Embed Size (px)
Citation preview

MEASURING LUNG IN INFANTS
AND PRESCHOOLERS
Peter D. Sly MBBS, MD, FRACP, DSc

TECHNIQUES FOR MEASURING LUNG FUNCTION IN
INFANTS AND PRE-SCHOOLERS
Infants Preschoolers
RVRTC Pleth FOT MBW FOT Spiro Rint sRaw MBW
Commercial
Equip
Yes Yes No Yes Yes Yes Yes Yes Yes
SOP Yes Yes No Yes Yes Yes Yes No Yes
Sedation Yes Yes No No
Tidal breathing No No Yes Yes Yes No Yes No Yes
Feasible* No No Yes Yes Yes Yes Yes Yes Yes
Adeq ref data No No No No Yes Yes Yes No Yes
Clinical utility No No No No Yes Yes Yes ? Yes
*without specialist lab and extensive training
Modified from: Rosenfeld Ann Thorac Soc 2013

LUNG FUNCTION IN SA INFANTS
Median 25-75%
Age (w) 7.4 6.6 - 8.1
Weight (z-score) -0.32 -0.97 - 5.4
Height (z-score) -0.66 -1.7 - 0.2
BW (z-score) -0.7 -1.4 - -0.1
Mbekweni
(n=176)
N(%)
TC Newman
(n=187)
N(%)
Total
(n=363)
N(%)
Male 81 (46) 100 (54) 181 (50)
Maternal HIV+ 61 (35) 8 (4) 69 (19)
Maternal smoking
active
Passive
26 (15)
84 (49)
95 (52)
67 (36)
121 (34)
151 (42)
African
Mixed race
174 (99)
2 (1)
2 (1)
185 (99)
176 (48)
187 (51)

LUNG FUNCTION IN SA INFANTS
Mean (sd) Median (25-75%) CoV Median (25-75%)
MBW (n=345)
FRC (ml) 78.0 (17) 75.1 (66.1-86.6) 5.4 (3.3-7.8)
LCI (turnovers) 7.2 (0.4) 7.2 (6.9-7.5) 4.0 (2.4-5.8)
Tidal breathing (n-356)
Vt (ml) 34.9 (6.3) 34.5 (30.8-39.0) 7.7 (6.3-9.9)
Rate (BPM) 48.1 (11.9) 46.4 (40.1-54.3) 8.0 (6.7-10.2)
Tptef/Te (%) 39.8 (12.1) 39.9 (31.6-46.7) 20.1 (16.8-25.2)
eNO (n=352)
eNO (ppb) 10.1 (6.8) 9.0 (5.0-13.7) 4.3 (3.4-6.5)
NO output (nL/min) 8.9 (4.5) 8.0 (6.6-10.2) 2.4 (1.4-3.4)
FOT (n=293)
R (cmH2O/L/s) 48.6 (15.7) 45.6 (38.1-57.2) 4.9 (3.0-8.0)
C (mL/cmH2O) 0.95 (0.44) 0.87 (0.68-1.15) 11.0 (6.1-17.9)

EUROPEAN EQUATIONS NOT APPROPRIATE
FOR SA INFANTS
SA Observed
Mean (std error)
European Refs
Mean (std error)
FRC (mL) 78.0 (0.92) 107.2 (0.47)
Vt (mL) 34.9 (0.34) 33.4 (0.19)
Rate (BPM) 48.1 (0.63) 45.9 (0.31)
eNO (ppb) 10.1 (0.36) 13.1 (0.15)
NO output 8.9 (0.24) 3.7 (0.03)

FORCED OSCILLATION TECHNIQUE
No active patient cooperation
Infants measured supine via face mask
Preschoolers measured seated via mouthpiece
Zrs at single or multiple frequencies
single sine wave
pseudorandom noise, NIM, NSND
Impulse (IOS)
Frequency range depends on circumstance
LF-FOT: 0.5-20.75 Hz
Spontaneous breathing: 4-48 (5-25 for IOS)
Input impedance (Zrs), P & V’ at airway opening

FOURIER TRANSFORMATION
Complex signal represented by series of
sinusoids, varying magnitude and phase
sinusoids transformed to frequency domain
simple calculation by computer gives magnitude
(resistance) and phase (reactance) relations
between P and V’

FORCED OSCILLATION TECHNIQUE
Real part = resistance
Imaginary part = reactance
Tissue Airway
LFFOT in infant measured during Hering-Breuer reflex induced apnea

FITTING THE CONSTANT PHASE MODEL
1 10 0
20
40
60
80
100
120
140
160
180
200
Frequency (Hz)
1 10
-500
-400
-300
-200
-100
0
100
RL
(cm
H2O
.s/L
)
XL
(cm
H2O
.s/L
)
input impedence
airway resistance
tissue resistance
Zrs = Raw + jIaw + (G - jH)/

FOT IN SPONTANEOUSLY BREATHING INFANTS
Infant studied during natural sleep breathing through face mask and filter

FOT IN SPONTANEOUSLY BREATHING INFANTS
Conventional RLC model fit to Zrs to give R, C and I
Nasal passages make major contribution to R & I

DRAKESTEIN CHILD LUNG HEALTH STUDY
Boys
n=104
Girls
n=94
p
R 55.7±19.6 48.3±15.6 0.004
C 0.77±0.35 0.91±0.46 0.02
Stiffer lungs (↑Xrs) in “smoked”
infants at 6w
Non-smoking
mother
Smoking
mother
Non-smoker
n=114
Smoker
N=83
p
R 52.5±16.2 51.5±20.7 0.8
C 0.074±0.03 0.067±0.05 0.03
Lung function in 6w old infants during natural sleep, tidal breathing, non-
commercial equipment

FOT IN PRESCHOOLERS
Child seated with arms at the side
Cheeks supported by technician
Nose-clip
Data collected during gentle tidal
breathing
Forcing function 4-24 Hz

4 year old measured seated through mouthpiece and filter

Reference data are available
[Hall GL, Thorax 2007;62:521-526; Calogero Ped Pulm 2013;48:707-15]

Age (years)
2.5 3.0 3.5 4.0 4.5 5.0 5.5 6.0 6.5
R (
hP
a.s
/L)
0
2
4
6
8
10
12
14
16
Age (years)
2.5 3.0 3.5 4.0 4.5 5.0 5.5 6.0 6.5
C (
L/h
Pa)
0.000
0.002
0.004
0.006
0.008
0.010
0.012
0.014
0.016
0.018
0.020
0.022
R= 0.389
p= <0.0001
R= 0.283p = 0.008
C = 0.00100 + (0.00144 * Age (years))
R= 12.657 - (0.967 * Age (years))
Height (cm)
85 90 95 100 105 110 115 120 125
R (
hP
a.s
/L)
0
2
4
6
8
10
12
14
16
Height (cm)
85 90 95 100 105 110 115 120 125
C (
L/h
Pa)
0.000
0.005
0.010
0.015
0.020
0.025
Rrs mean = 24.088 - (0.148 * Height (cm)) R= 0.565p= <0.001
C = -0.0129 + (0.000191 * Height (cm)) R= 0.358p= <0.001
Interpretation of R & C more simple

Clinical Report

MEASURING LUNG FUNCTION IN
CLINICAL PRACTICE
Aid in diagnosis
Bronchodilator response
Following progress or treatment response
Challenge tests?
More different for groups than for individuals

FOT IN POST-NEONATAL CLD
Height (cm)
9095100105110115120125130
Resistance (8 Hz) hPa.s/L
2
4
6
8
10
12
14
16
18
Height (cm)
9095100105110115120125130
Reactance 8 Hz (hPa.s/L)-10
-8
-6
-4
-2
0
2
4
FOT was feasible in young children with nCLD with
- baseline data obtained in 80% of children [n= 35 of 44],
- post BD data in 34 of 35 children [97%]

FOT BDR in children with neonatal CLD
Altered baseline FOT normalises following inhaled BD
Baseline
Post bronchodilator
-3
R6
2
1
0
-1
-2
R8 X6 X8
P < 0.001 P < 0.001
P < 0.001
P < 0.001
P < 0.001
P >0.2 P >0.2 P >0.2
P < 0.001 P < 0.001 P < 0.001 P < 0.001

FOT IN CF
Rrs6 0.677 ± 1.02 Xrs6 -0.759 ± 1.16
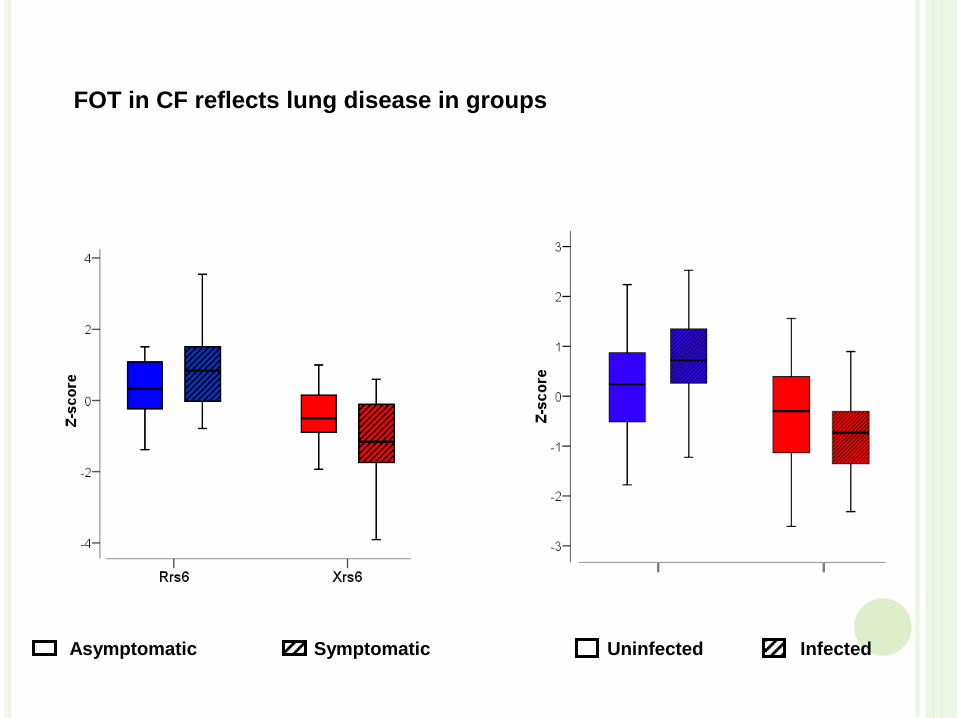
Asymptomatic Symptomatic Uninfected Infected
FOT in CF reflects lung disease in groups

FOT tracks lung
disease in children
with CF –
individual data

BRONCHODILATOR RESPONSE
What constitutes a BDR?
Absolute
change
% change Δ Z-score
R8 3.16hPa.s.L-1 34% 1.88
X8 2.25hPa.s.L-1 61% 2.48
Rint 0.26 kPa. L-1 32% 1.25
Note: this is based on limited data and more studies are required

BRONCHODILATOR RESPONSE
BDR – are we measuring the right thing?
Dynamic mechanics shows a different picture

p=0.023
Dynamic airway mechanics: ↓ distensibility with wheeze

BDR EXAMPLE 1
frequency (Hz)
4 8 12 16 20 24 28
Zrs
(hPa
.s/L
)
-15
-10
-5
0
5
10
15
20

BDR EXAMPLE 2
volume (L)
-0.1 0.0 0.1 0.2 0.3 0.4 0.5
Z 1
0 (h
Pa.
s/L)
-6
-4
-2
0
2
4
6
8
10
12
14
flow (L/s)
-0.4 -0.2 0.0 0.2 0.4 0.6

MEASURING LUNG IN INFANTS AND
PRESCHOOLERS
Conclusions
Lung function can be measures in infants and
preschoolers using a variety of techniques
Infants
No current place in clinical measurement
Preschoolers
Can be used in clinical practices as in older children
Dynamic mechanics may provide new information