Embed Size (px)
Citation preview
Measuring Local
Change Workshop
Purpose
To be an interactive session that provides an
opportunity to discuss the practicalities of:
1. Measuring local change in practice
2. Using and generating evidence in TIS work
3. Gaining access to support on these subjects
In particular, we will aim to understand and use
methods for measuring change due to TIS work.

Part 1: Introduction to measuring change
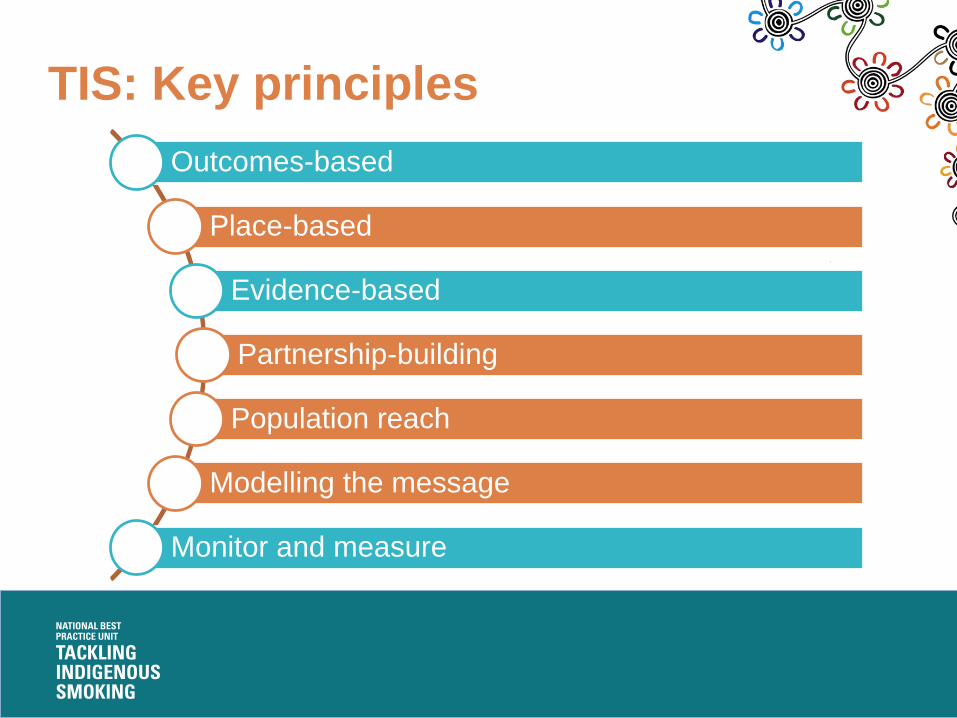
TIS: Key principles
Outcomes-based
Place-based
Evidence-based
Partnership-building
Population reach
Modelling the message
Monitor and measure
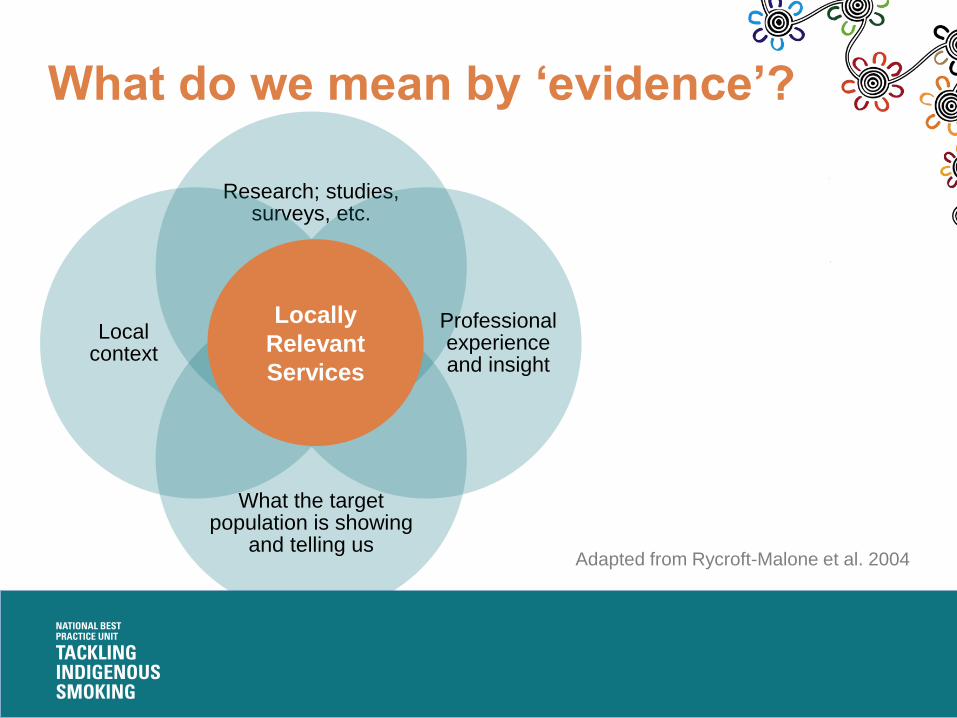
What do we mean by ‘evidence’?
Research; studies, surveys, etc.
Professional experience and insight
What the target population is showing
and telling us
Local context
Locally
Relevant
Services
Adapted from Rycroft-Malone et al. 2004
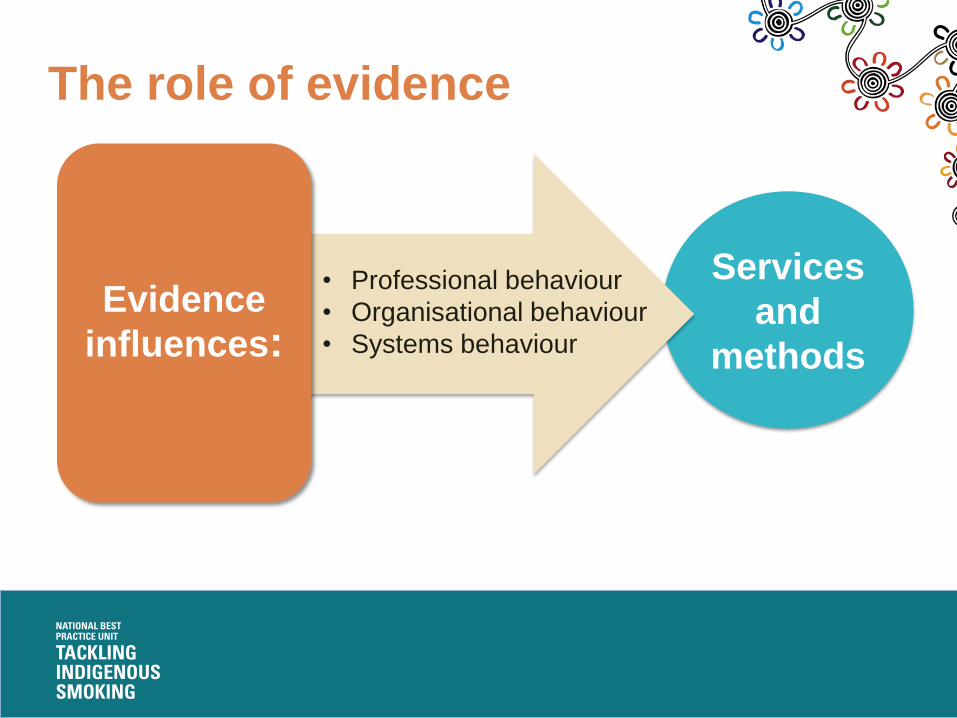
Services
and
methods
The role of evidence
• Professional behaviour
• Organisational behaviour
• Systems behaviour
Evidence
influences:
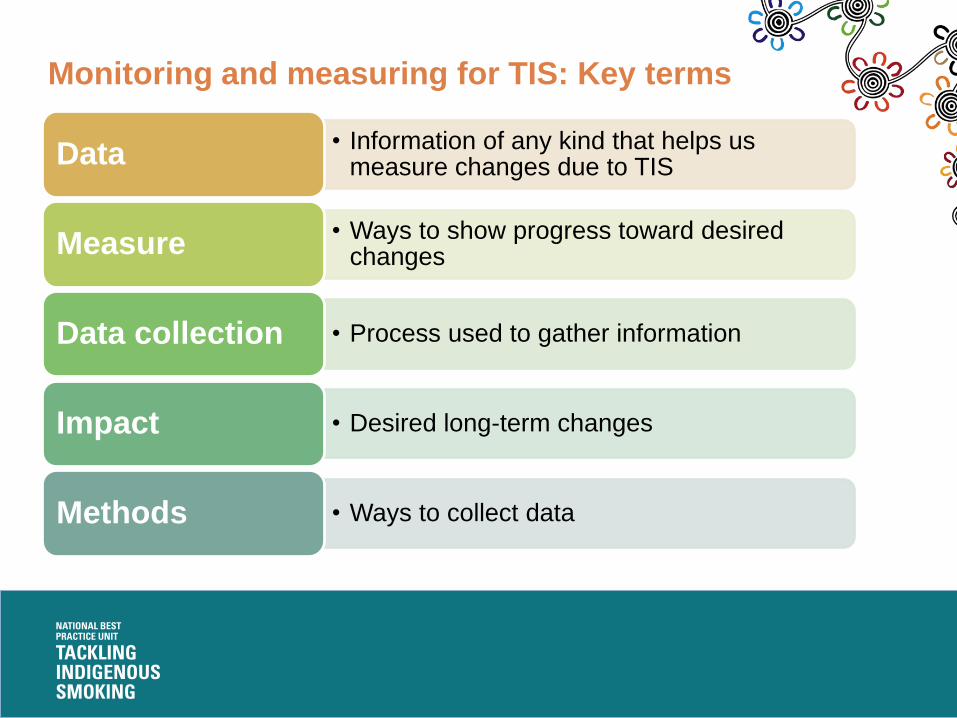
Monitoring and measuring for TIS: Key terms
• Information of any kind that helps us measure changes due to TISData
• Ways to show progress toward desired changes Measure
• Process used to gather information Data collection
• Desired long-term changes Impact
• Ways to collect dataMethods
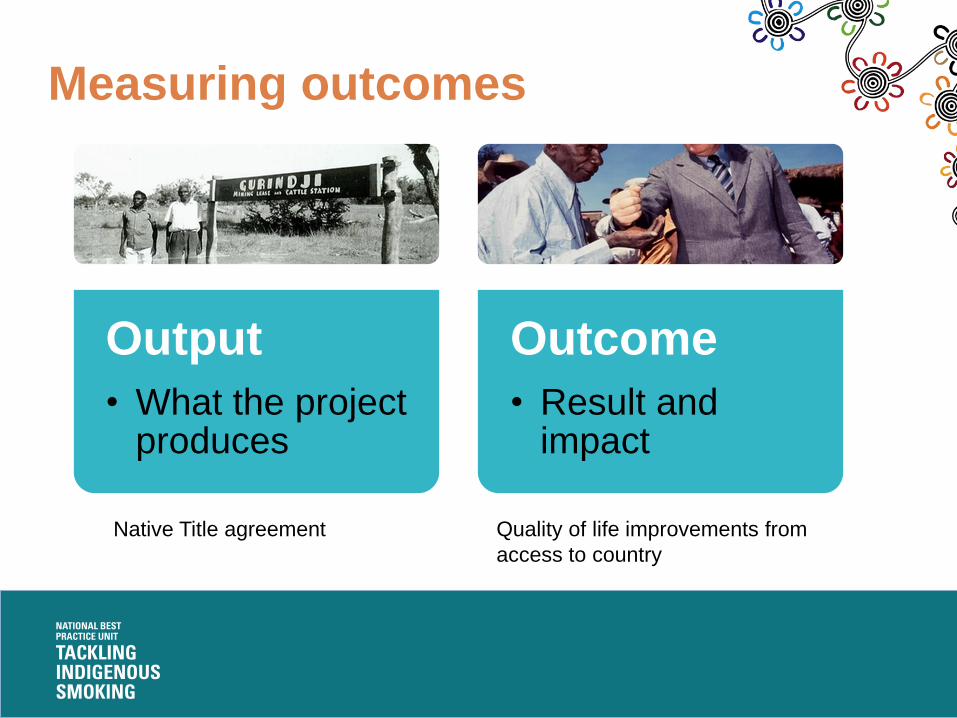
Measuring outcomes
Output
• What the project produces
Outcome
• Result and impact
Native Title agreement Quality of life improvements from
access to country
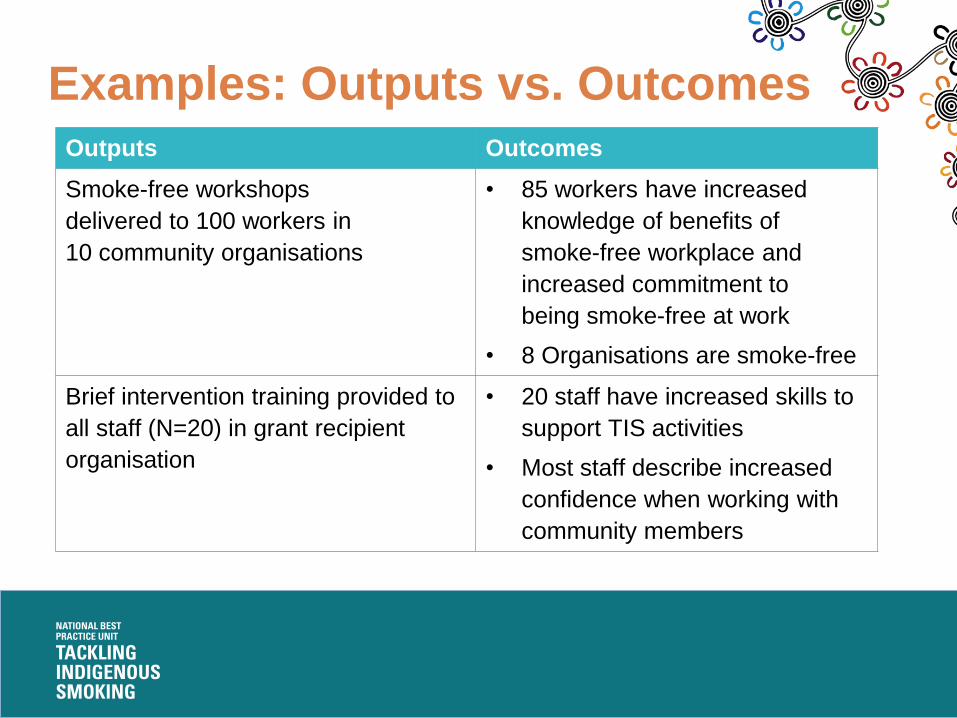
Examples: Outputs vs. Outcomes
Outputs Outcomes
Smoke-free workshops
delivered to 100 workers in
10 community organisations
• 85 workers have increased
knowledge of benefits of
smoke-free workplace and
increased commitment to
being smoke-free at work
• 8 Organisations are smoke-free
Brief intervention training provided to
all staff (N=20) in grant recipient
organisation
• 20 staff have increased skills to
support TIS activities
• Most staff describe increased
confidence when working with
community members
Measuring outcomes of TIS
Output
• TIS activities
Outcome
• TIS impact
As practical examples, we have included three
case studies:
• Alive and Kicking Goals
• Apunipima Baby Baskets
• Wadeye Communities for Children
Please can we read them and draw out key points,
including differences and similarities
(I will explain the aspects to look at carefully)
Exercise: Case studies
Part 2: Measuring change in TIS
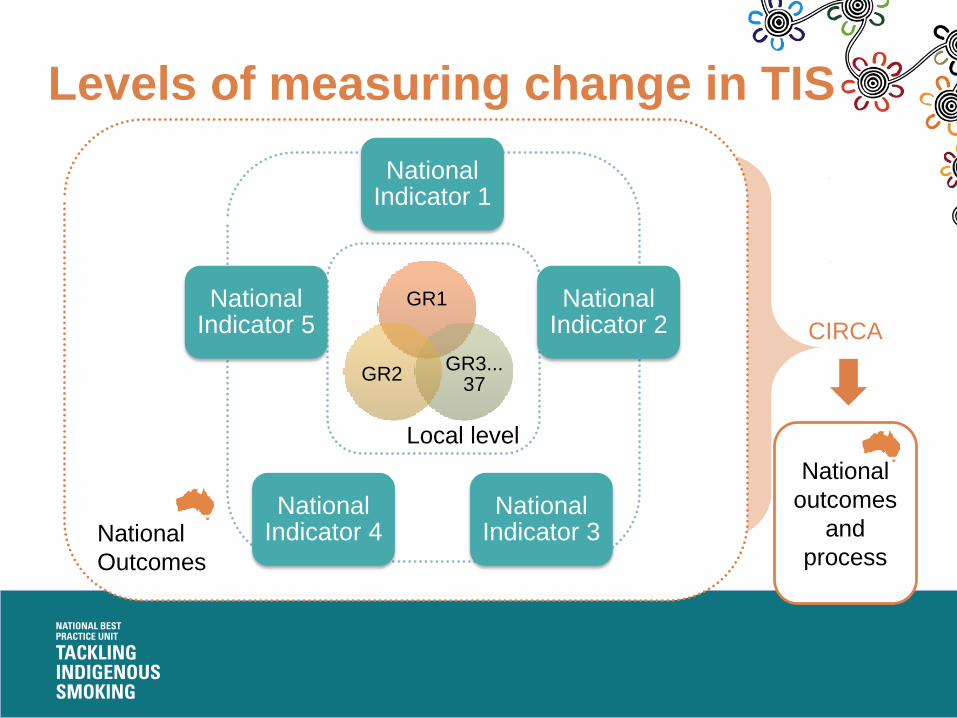
National
Outcomes
Local level
National Indicator 1
National Indicator 2
National Indicator 3
National Indicator 4
National Indicator 5
National
outcomes
and
process
Levels of measuring change in TIS
GR1
GR3... 37
GR2
CIRCA
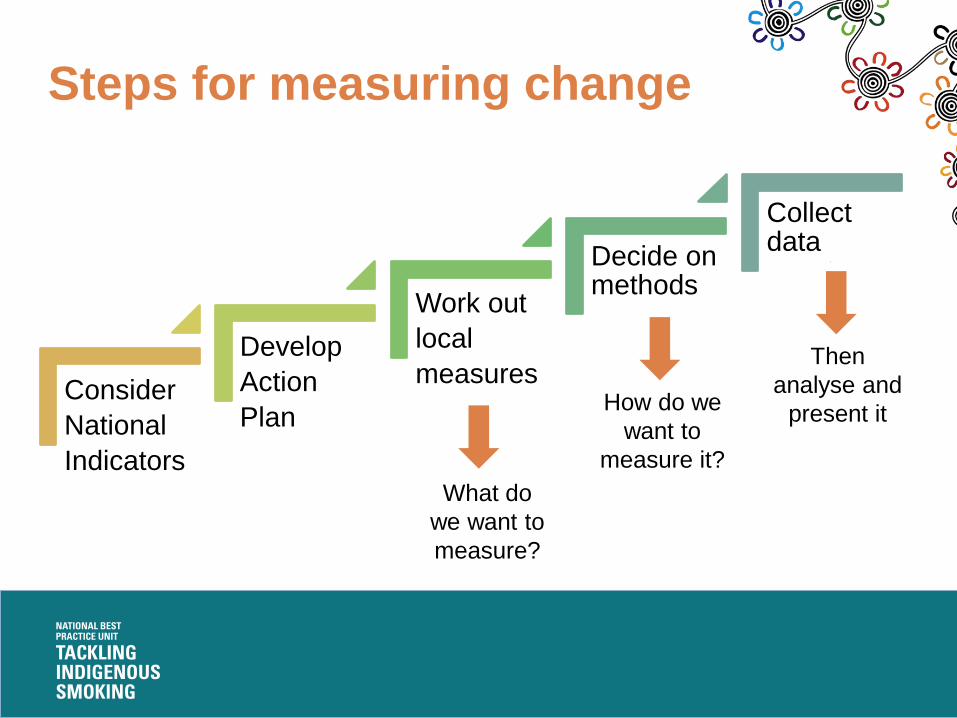
Steps for measuring change
Consider
National
Indicators
Develop
Action
Plan
Work out
local
measures
Decide on methods
Collect data
What do
we want to
measure?
How do we
want to
measure it?
Then
analyse and
present it
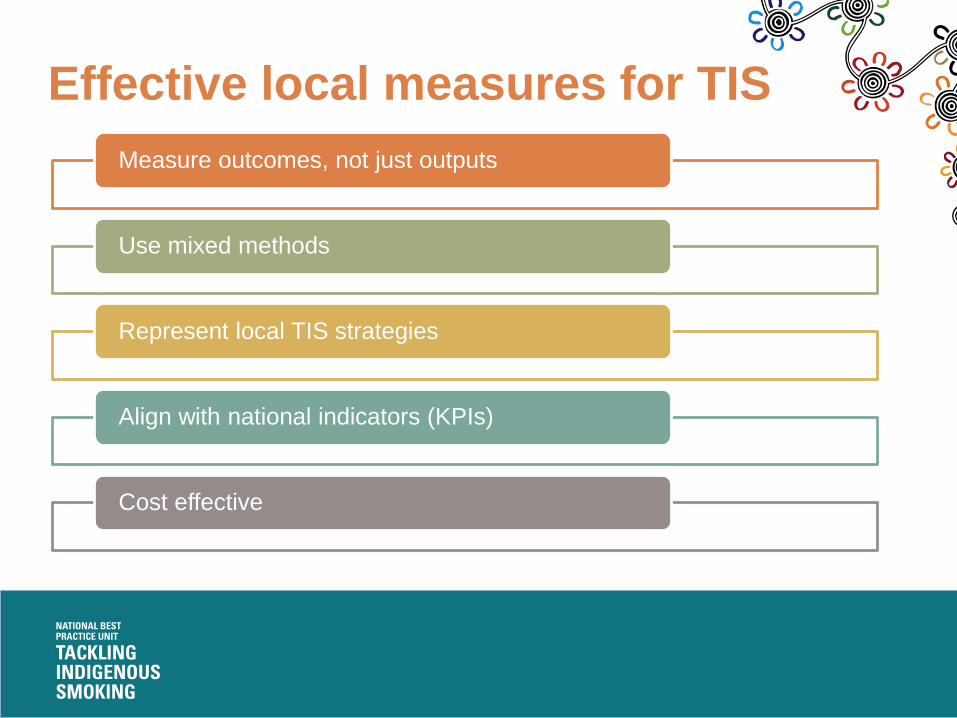
Effective local measures for TIS
Measure outcomes, not just outputs
Use mixed methods
Represent local TIS strategies
Align with national indicators (KPIs)
Cost effective
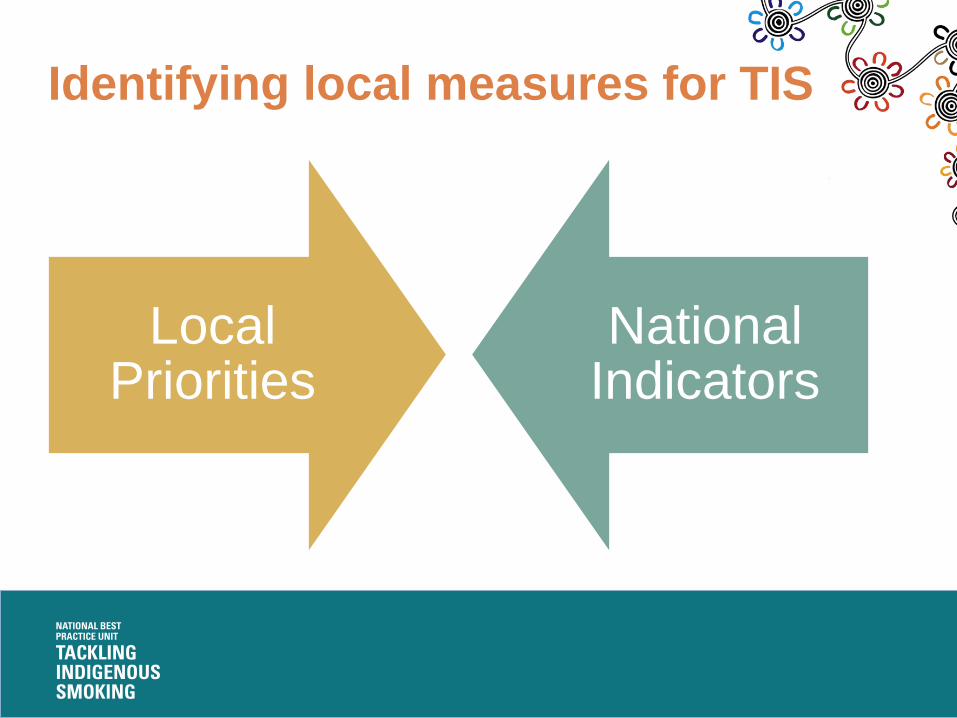
Identifying local measures for TIS
Local Priorities
National Indicators

National Indicator 1
Quality and reach of community engagement
No. and quality of partnerships
No. of meeting groups for
specific people eg pregnant
women
Geographical reach
No. and type of contacts across the population
National
Outcomes
Examples of local measures
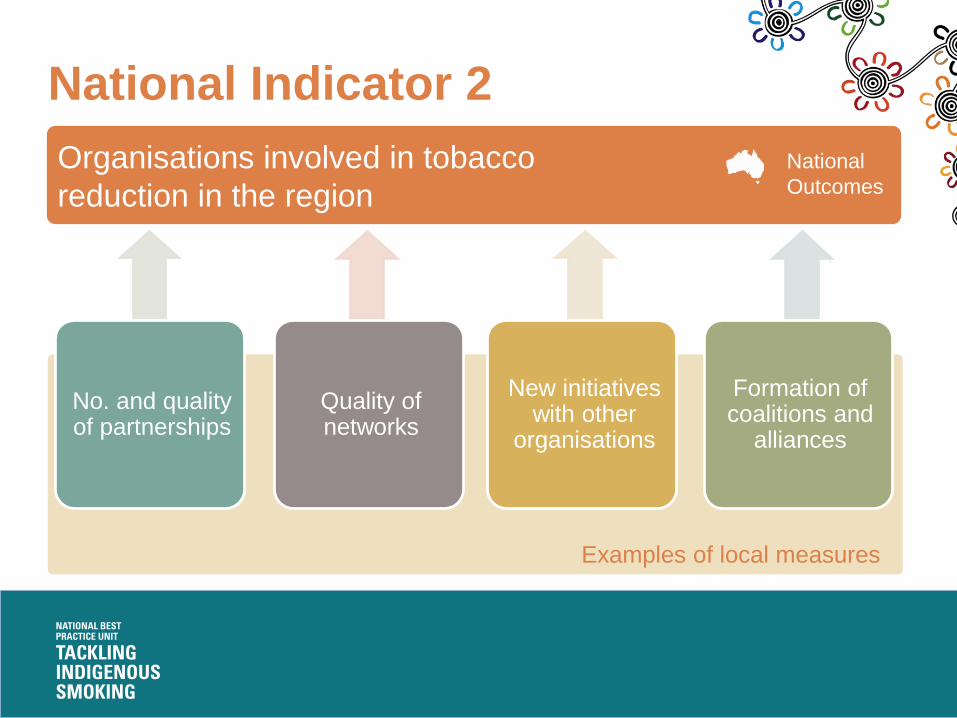
National Indicator 2
Organisations involved in tobacco
reduction in the region
Formation of coalitions and
alliances
New initiatives with other
organisations
No. and quality of partnerships
Quality of networks
National
Outcomes
Examples of local measures

National Indicator 3
Building capacity to support quitting
No. and effectiveness of Yarning Groups
No. and effectiveness
of brief interventions
No. and effectiveness of ambassadors, advocates, etc.
School-based knowledge and
support
National
Outcomes
Examples of local measures

National Indicator 4
Referrals to appropriate quitting support
Effective
partnerships
with clinical
services
Availability and
quality of local
quitting support
No. and
effectiveness of
referral
pathways
Outreach to
new groups
eg in disability
and mental
health
National
Outcomes
Examples of local measures
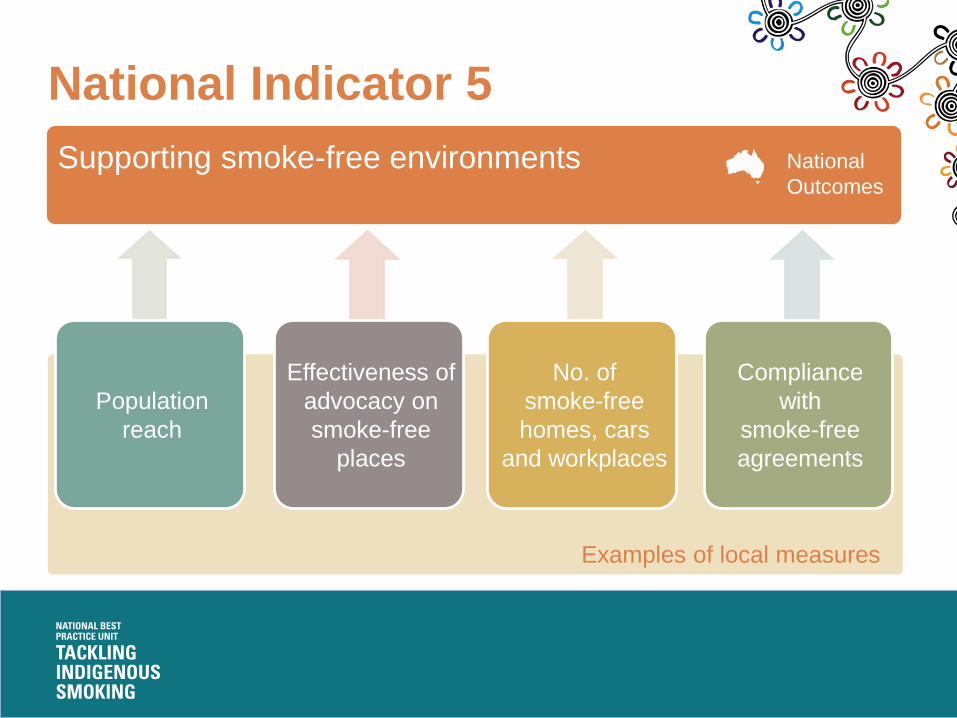
National Indicator 5
Supporting smoke-free environments
Compliance
with
smoke-free
agreements
No. of
smoke-free
homes, cars
and workplaces
Population
reach
Effectiveness of
advocacy on
smoke-free
places
National
Outcomes
Examples of local measures
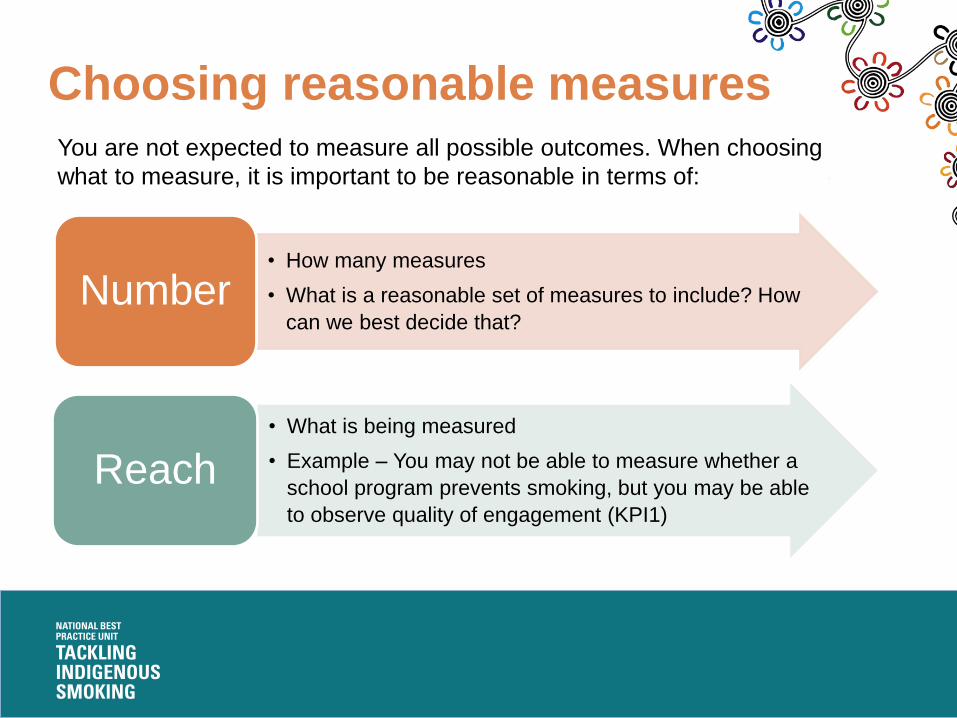
Choosing reasonable measures
• How many measures
• What is a reasonable set of measures to include? How
can we best decide that?Number
• What is being measured
• Example – You may not be able to measure whether a
school program prevents smoking, but you may be able
to observe quality of engagement (KPI1)
Reach
You are not expected to measure all possible outcomes. When choosing
what to measure, it is important to be reasonable in terms of:
Let’s draw on the whiteboard the ‘expected
outcomes’ and ‘Measuring change/impact’
columns of approved or draft Action Plan.
Then we will discuss options the number and
approach to each measure, depending on
the progress you have already made.
Exercise: Choosing local measures
Part 3: Designing data collection
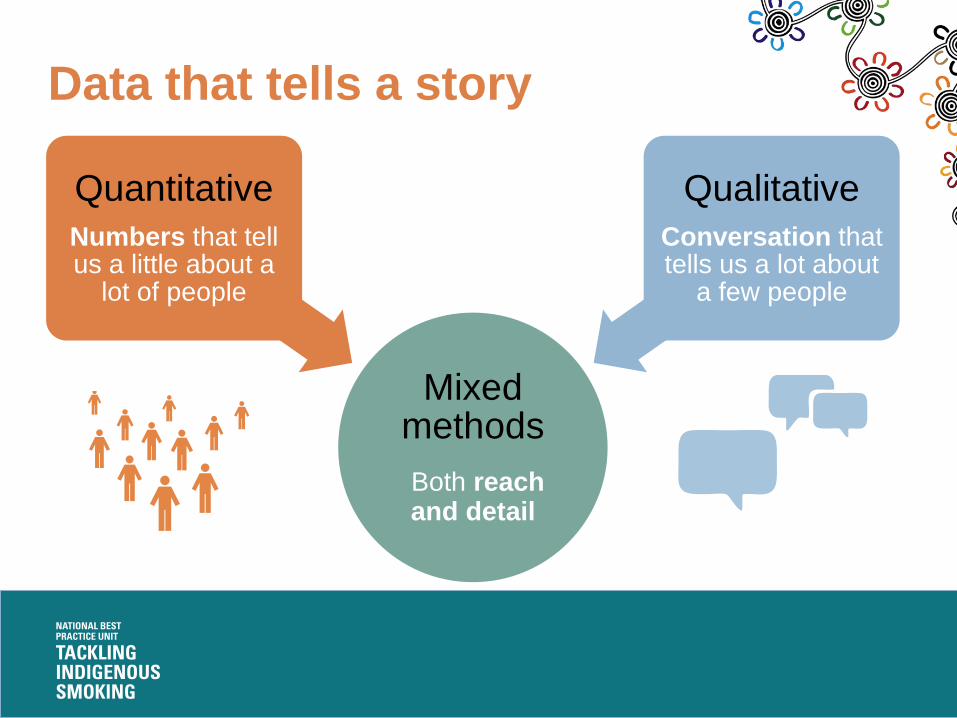
Data that tells a story
Mixed methods
Both reach and detail
Quantitative
Numbers that tell us a little about a
lot of people
Qualitative
Conversation that tells us a lot about
a few people
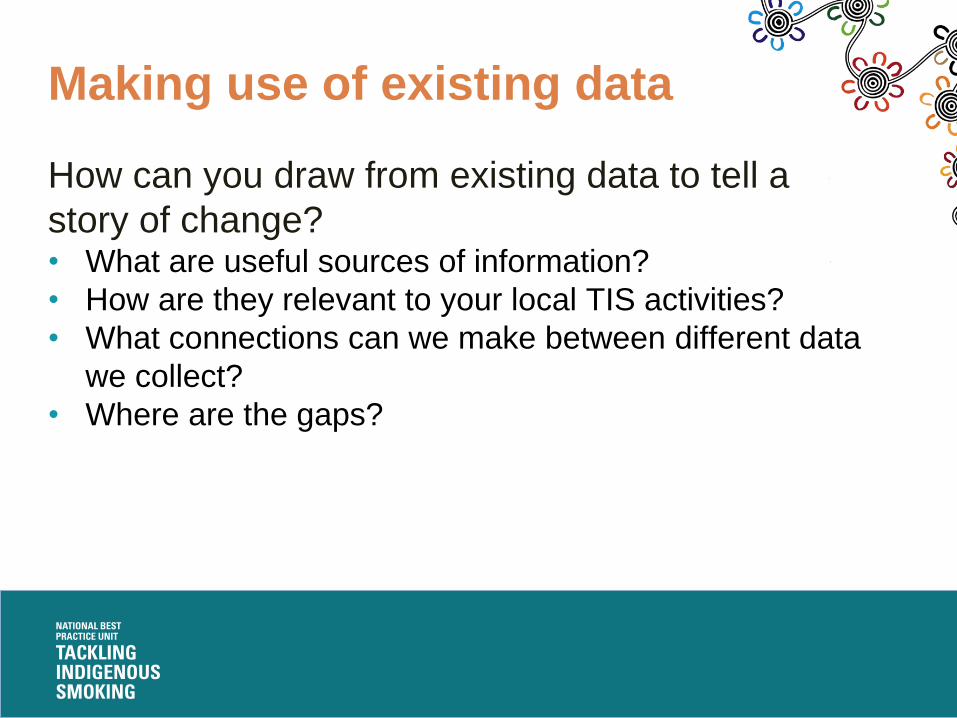
Making use of existing data
How can you draw from existing data to tell a
story of change?• What are useful sources of information?
• How are they relevant to your local TIS activities?
• What connections can we make between different data
we collect?
• Where are the gaps?
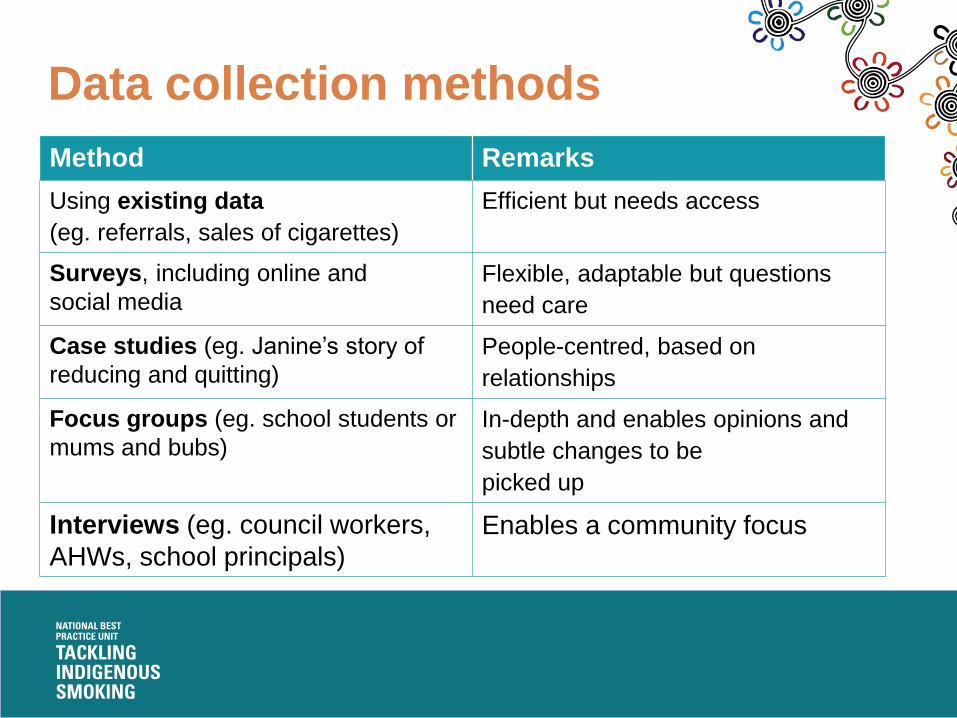
Data collection methods
Method Remarks
Using existing data
(eg. referrals, sales of cigarettes)
Efficient but needs access
Surveys, including online and
social media
Flexible, adaptable but questions
need care
Case studies (eg. Janine’s story of
reducing and quitting)
People-centred, based on
relationships
Focus groups (eg. school students or
mums and bubs)
In-depth and enables opinions and
subtle changes to be
picked up
Interviews (eg. council workers,
AHWs, school principals)
Enables a community focus
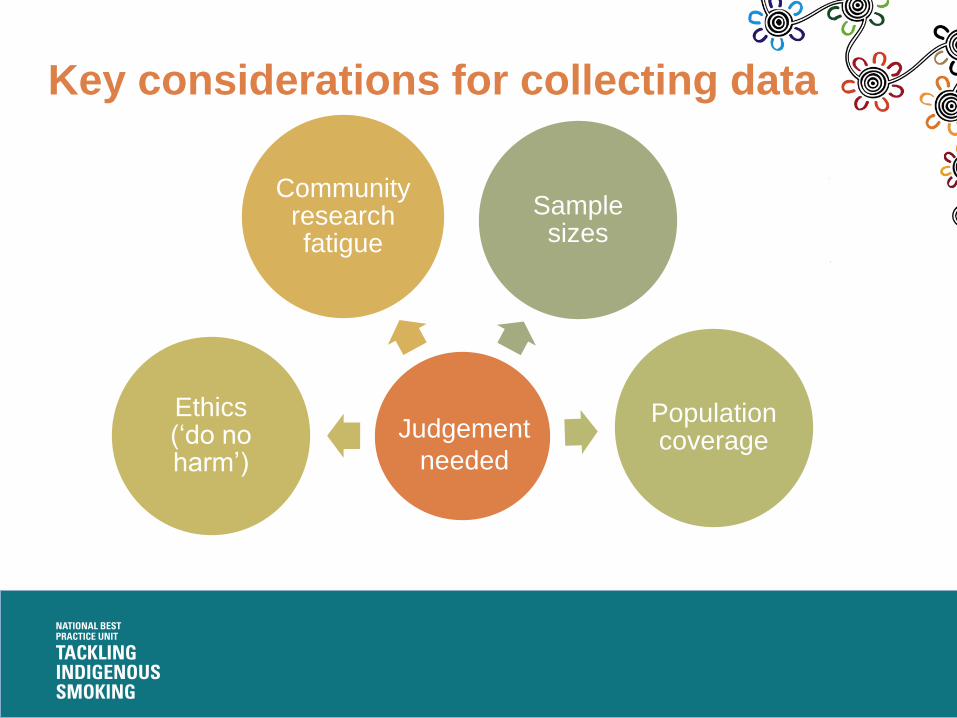
Key considerations for collecting data
Sample sizes
Populationcoverage
Ethics (‘do no harm’)
Community research fatigue
Judgement
needed
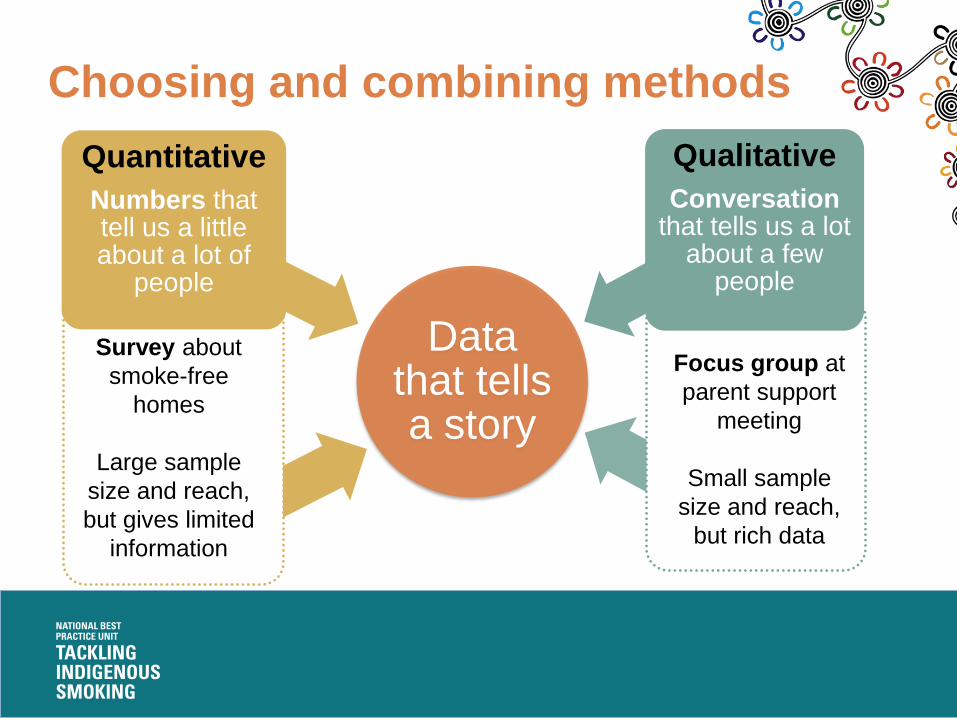
Choosing and combining methods
Data that tells a story
Quantitative
Numbers that tell us a little about a lot of
people
Qualitative
Conversationthat tells us a lot
about a few people
Focus group at
parent support
meeting
Small sample
size and reach,
but rich data
Survey about
smoke-free
homes
Large sample
size and reach,
but gives limited
information
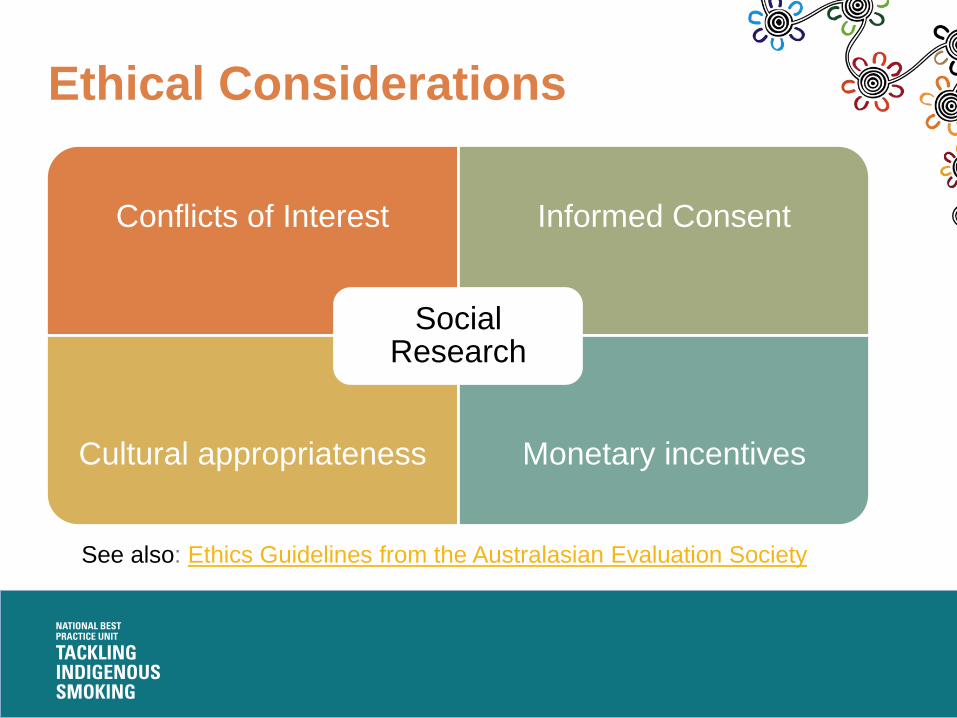
Ethical Considerations
Conflicts of Interest Informed Consent
Cultural appropriateness Monetary incentives
Social Research
See also: Ethics Guidelines from the Australasian Evaluation Society
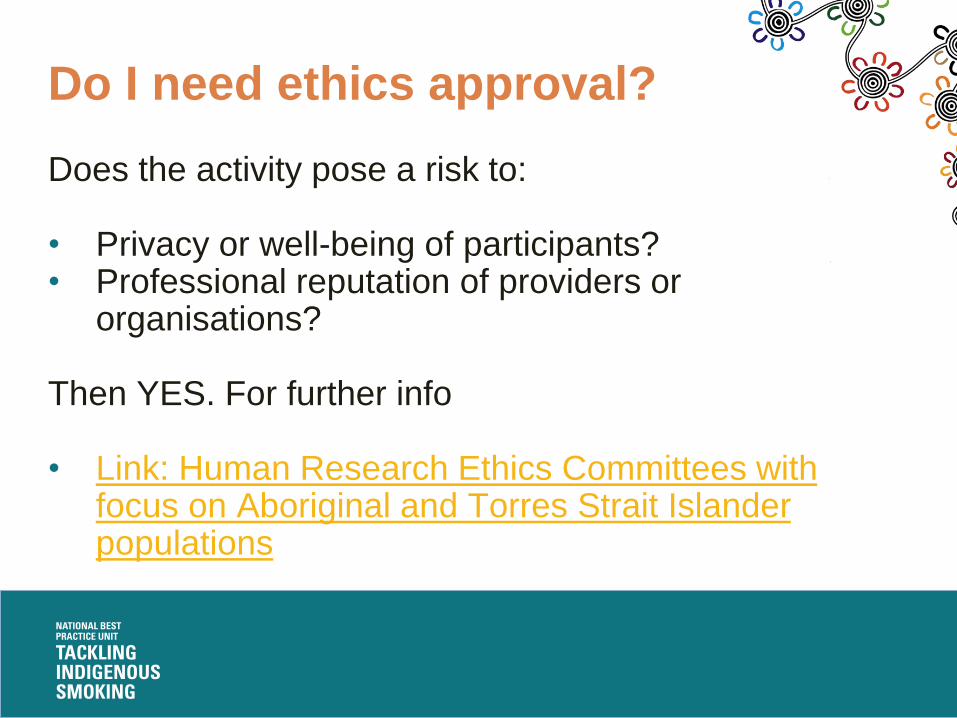
Do I need ethics approval?
Does the activity pose a risk to:
• Privacy or well-being of participants?• Professional reputation of providers or
organisations?
Then YES. For further info
• Link: Human Research Ethics Committees with focus on Aboriginal and Torres Strait Islander populations
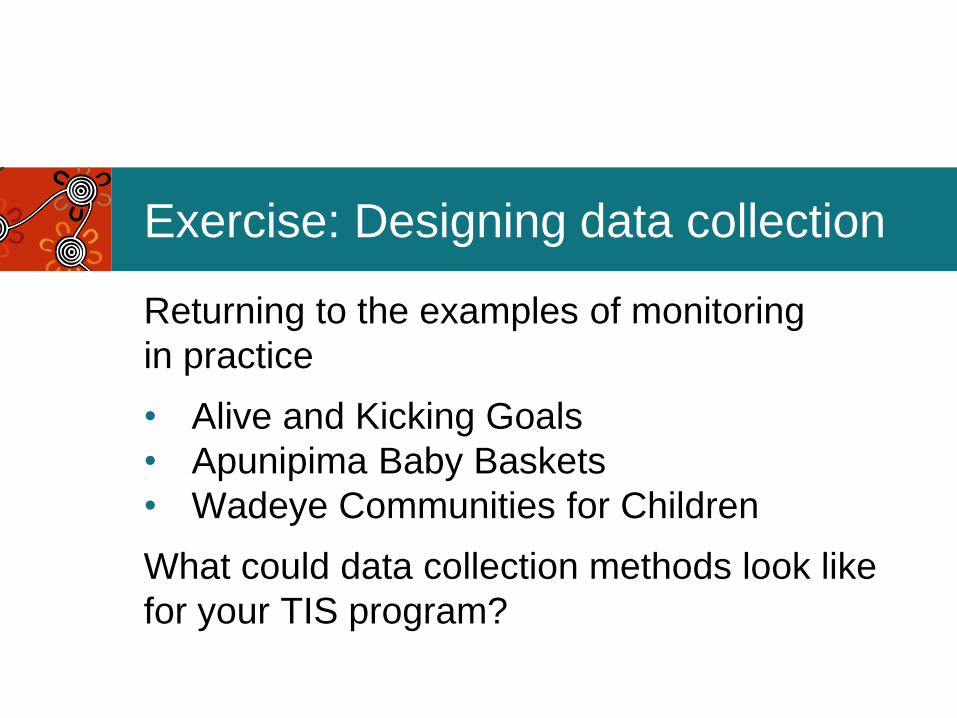
Returning to the examples of monitoring
in practice
• Alive and Kicking Goals
• Apunipima Baby Baskets
• Wadeye Communities for Children
What could data collection methods look like
for your TIS program?
Exercise: Designing data collection
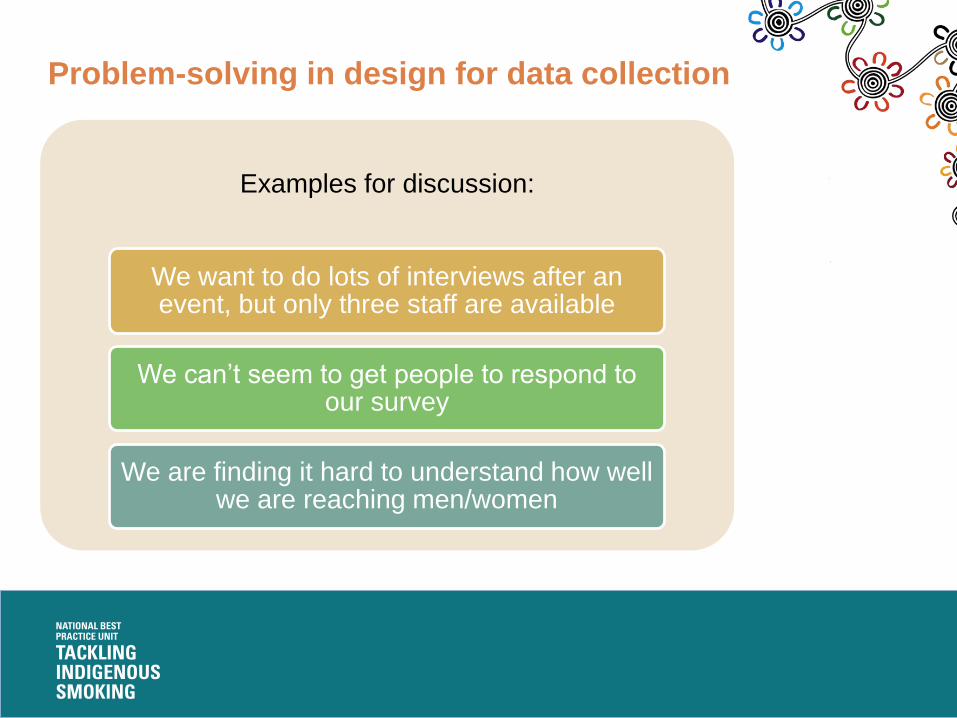
Problem-solving in design for data collection
Examples for discussion:
We want to do lots of interviews after an event, but only three staff are available
We can’t seem to get people to respond to our survey
We are finding it hard to understand how well we are reaching men/women
Part 4: Measuring change in practice
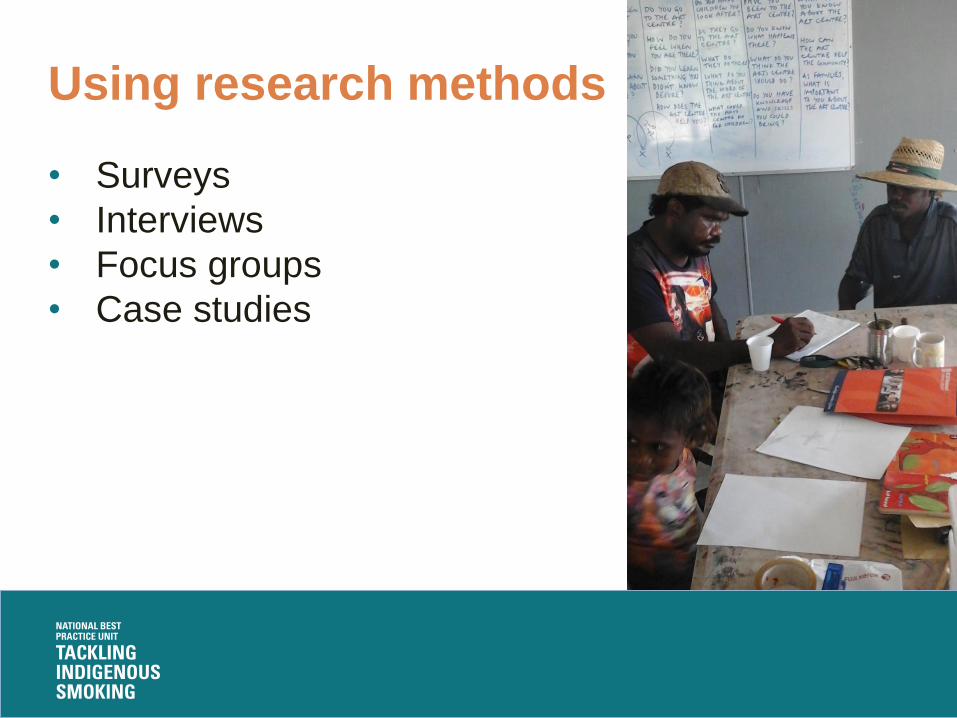
Using research methods
• Surveys
• Interviews
• Focus groups
• Case studies
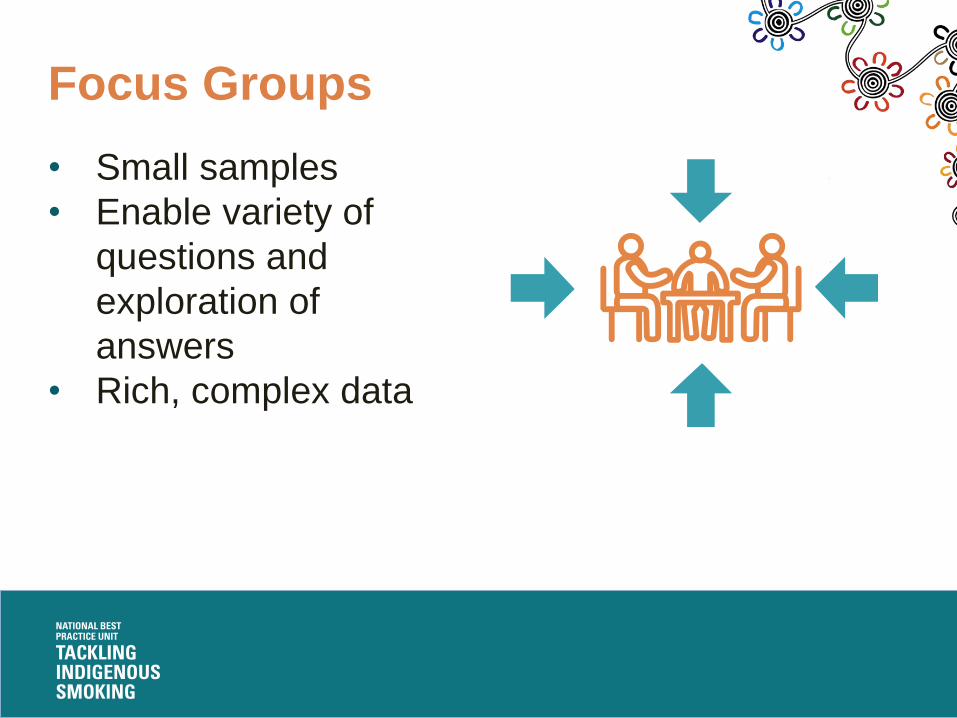
Focus Groups
• Small samples
• Enable variety of
questions and
exploration of
answers
• Rich, complex data
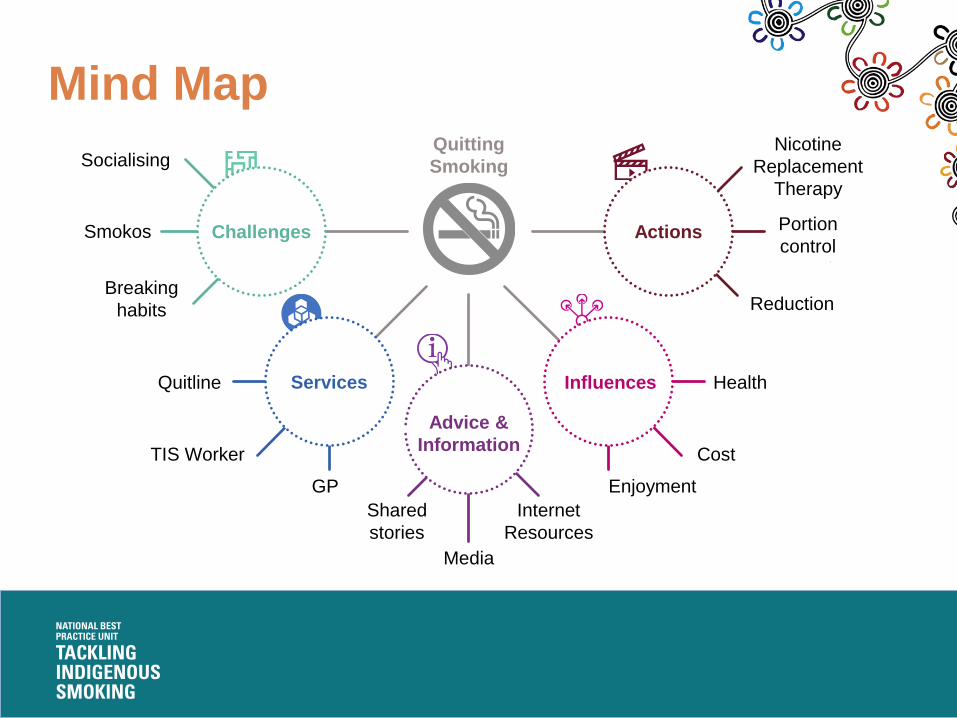
Challenges
Advice &
Information
InfluencesServices
Actions
Mind MapQuitting
SmokingSocialising
Smokos
Breaking
habits
Quitline
TIS Worker
GP
Media
Shared
stories
Internet
Resources
Enjoyment
Cost
Health
Reduction
Portion
control
Nicotine
Replacement
Therapy
River of time
method for focus
group discussions
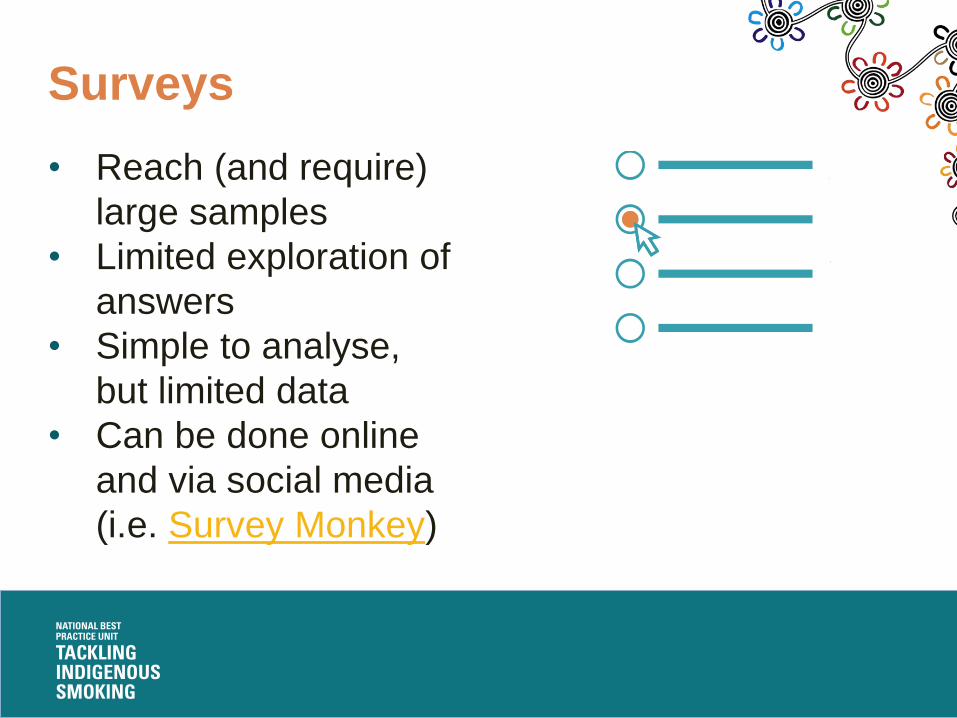
Surveys
• Reach (and require)
large samples
• Limited exploration of
answers
• Simple to analyse,
but limited data
• Can be done online
and via social media
(i.e. Survey Monkey)
Interviews
• Very small samples
• Very rich data
• Time intensive
• Can be done via
phone/skype
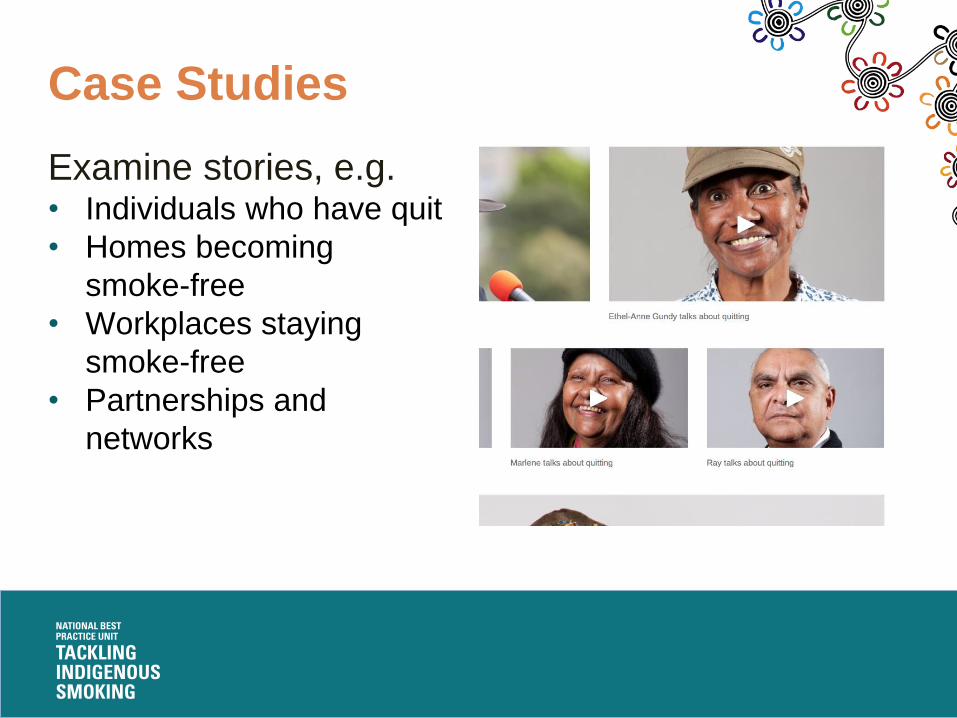
Case Studies
Examine stories, e.g.• Individuals who have quit
• Homes becoming
smoke-free
• Workplaces staying
smoke-free
• Partnerships and
networks
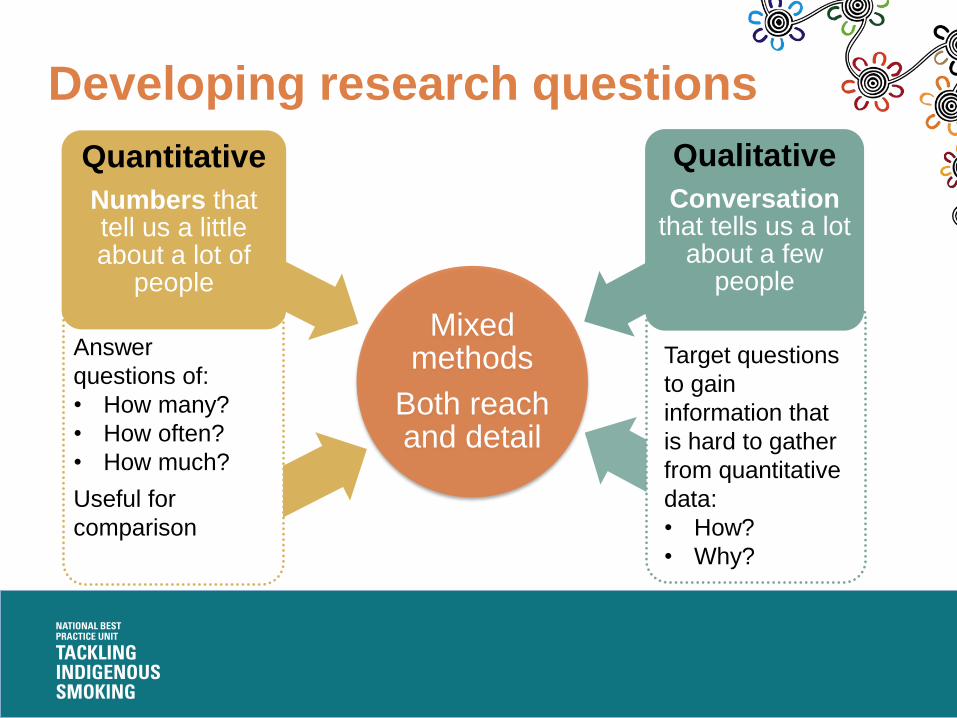
Developing research questions
Target questions
to gain
information that
is hard to gather
from quantitative
data:
• How?
• Why?
Answer
questions of:
• How many?
• How often?
• How much?
Useful for
comparison
Mixed methods
Both reach and detail
Quantitative
Numbers that tell us a little about a lot of
people
Qualitative
Conversationthat tells us a lot
about a few people
Let’s do some practice sessions for the
methods, especially interviews, case studies
and focus groups.
The TIS Portal will shortly have short videos
showing examples.
Exercise: Using data collection methods
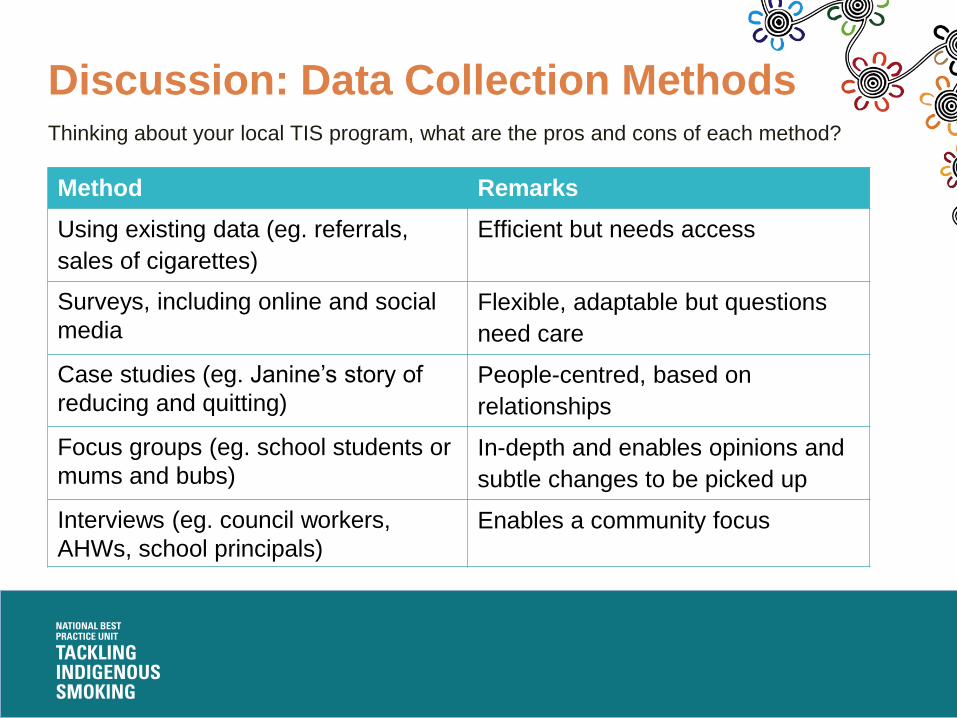
Discussion: Data Collection Methods Thinking about your local TIS program, what are the pros and cons of each method?
Method Remarks
Using existing data (eg. referrals,
sales of cigarettes)
Efficient but needs access
Surveys, including online and social
media
Flexible, adaptable but questions
need care
Case studies (eg. Janine’s story of
reducing and quitting)
People-centred, based on
relationships
Focus groups (eg. school students or
mums and bubs)
In-depth and enables opinions and
subtle changes to be picked up
Interviews (eg. council workers,
AHWs, school principals)
Enables a community focus
Part 5: Analysing data for TIS
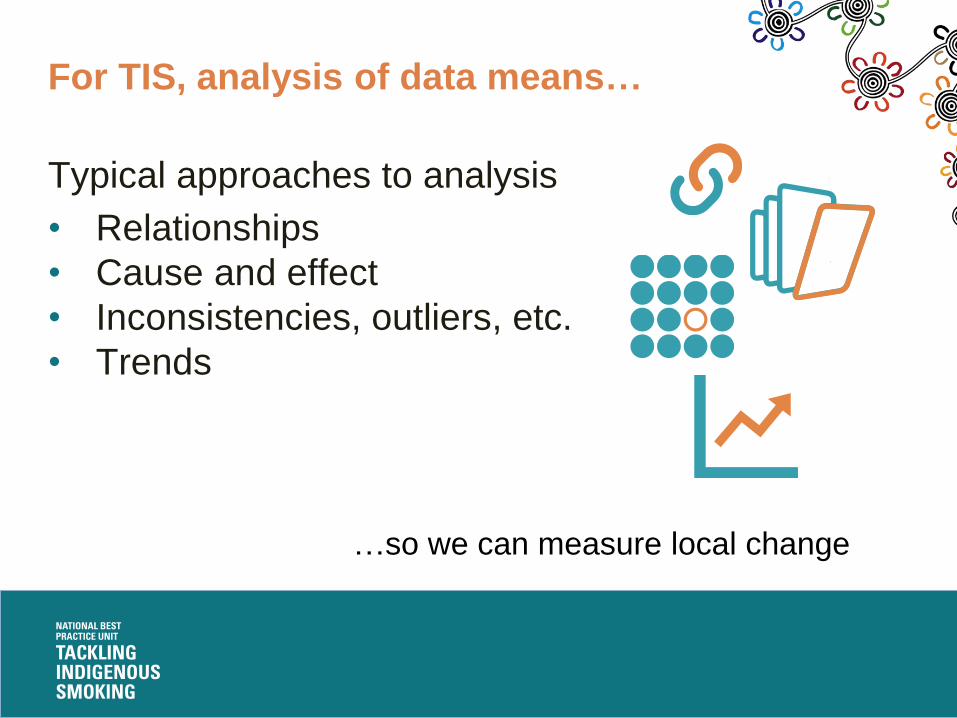
For TIS, analysis of data means…
Typical approaches to analysis
• Relationships
• Cause and effect
• Inconsistencies, outliers, etc.
• Trends
…so we can measure local change
Data analysis for TIS: Objectives
• Effectiveness of local TIS activities in relation
to outcomes
• Performance on national indicators
• Performance on locally-specific indicators
• Telling the story of change – what is behind
the indicator?
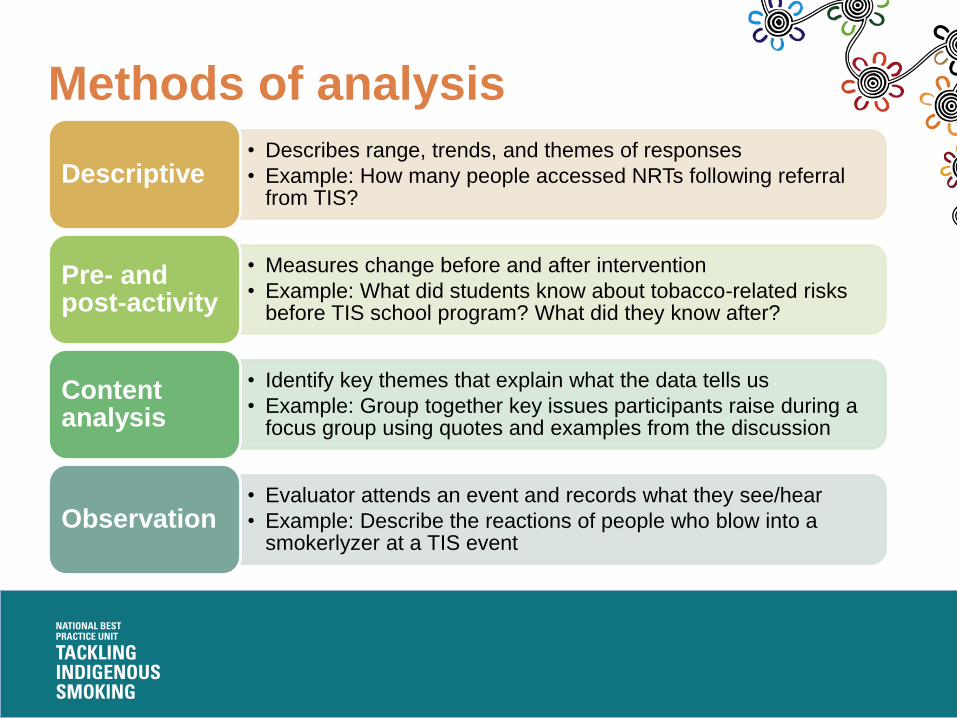
Methods of analysis
• Describes range, trends, and themes of responses
• Example: How many people accessed NRTs following referral from TIS?
Descriptive
• Measures change before and after intervention
• Example: What did students know about tobacco-related risks before TIS school program? What did they know after?
Pre- and post-activity
• Identify key themes that explain what the data tells us
• Example: Group together key issues participants raise during a focus group using quotes and examples from the discussion
Content analysis
• Evaluator attends an event and records what they see/hear
• Example: Describe the reactions of people who blow into a smokerlyzer at a TIS event
Observation
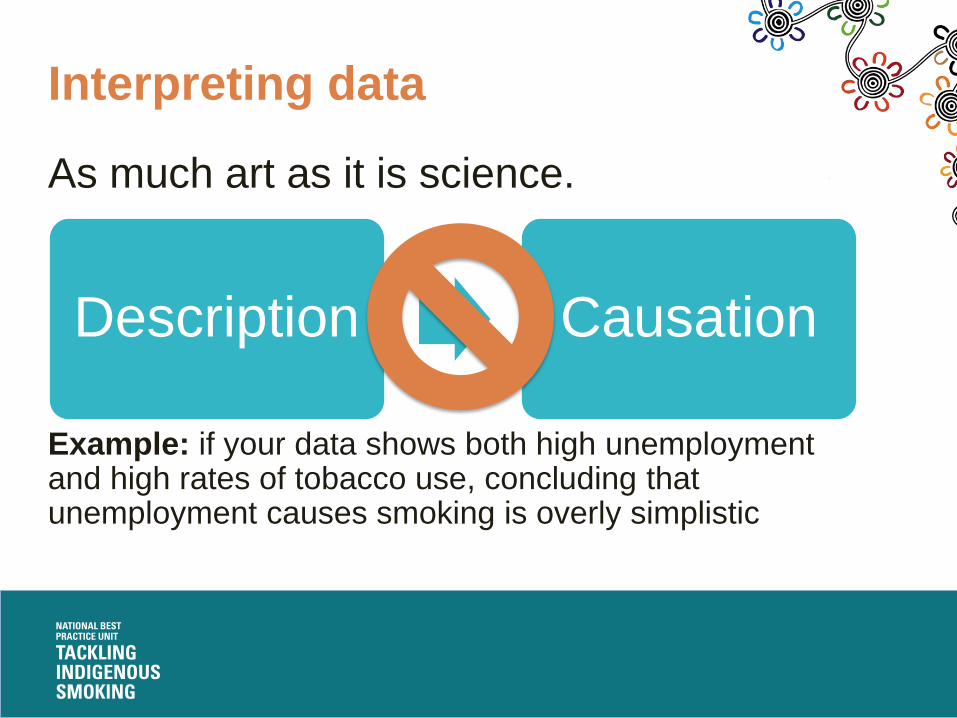
Interpreting data
As much art as it is science.
Example: if your data shows both high unemployment and high rates of tobacco use, concluding that unemployment causes smoking is overly simplistic
Description Causation
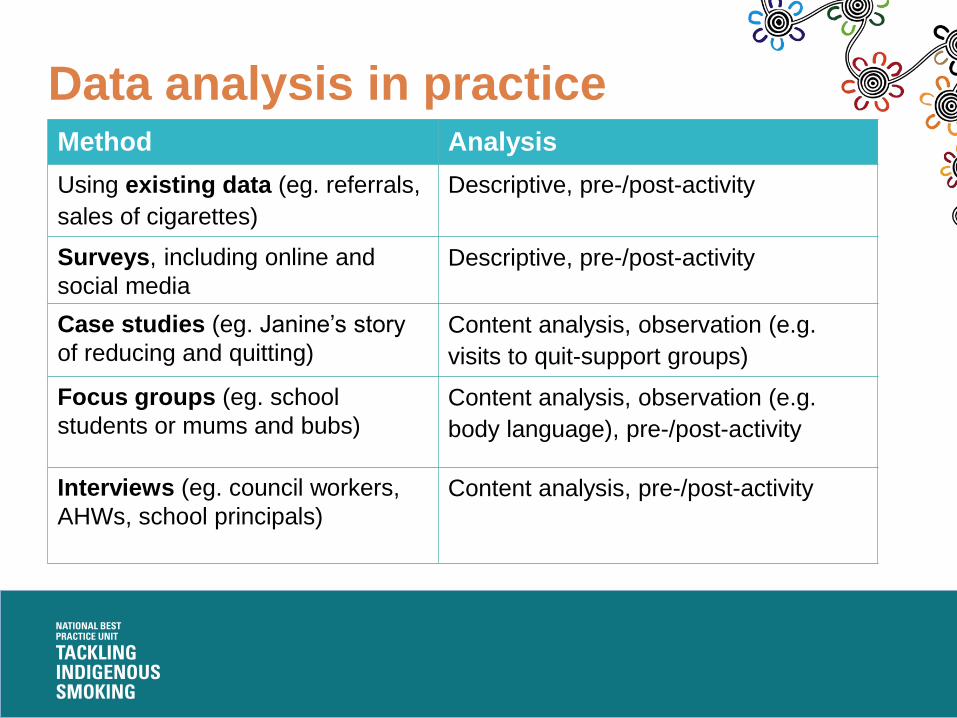
Data analysis in practiceMethod Analysis
Using existing data (eg. referrals,
sales of cigarettes)
Descriptive, pre-/post-activity
Surveys, including online and
social media
Descriptive, pre-/post-activity
Case studies (eg. Janine’s story
of reducing and quitting)
Content analysis, observation (e.g.
visits to quit-support groups)
Focus groups (eg. school
students or mums and bubs)
Content analysis, observation (e.g.
body language), pre-/post-activity
Interviews (eg. council workers,
AHWs, school principals)
Content analysis, pre-/post-activity
As with the previous exercise, let’s work
through examples of how we can analyse
information from surveys, interviews and
focus groups in particular.
Again, if ready at the time of this workshop,
the TIS Portal has some short videos on the
subject
Exercise: Analysing data
Questions and discussion

Part 6: Presenting and reporting data
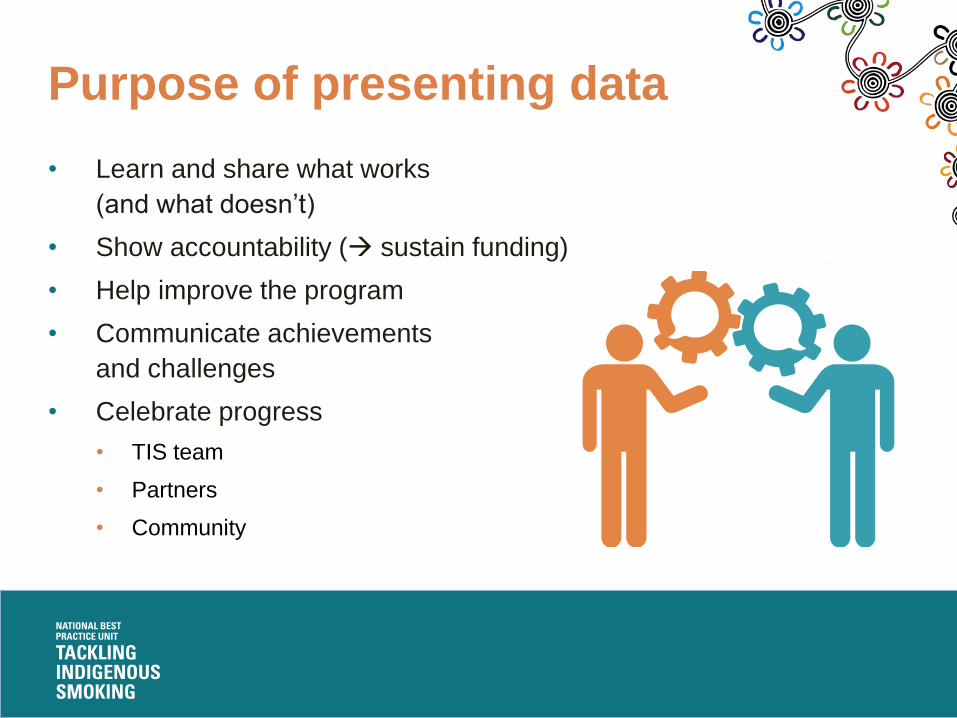
Purpose of presenting data
• Learn and share what works
(and what doesn’t)
• Show accountability ( sustain funding)
• Help improve the program
• Communicate achievements
and challenges
• Celebrate progress
• TIS team
• Partners
• Community
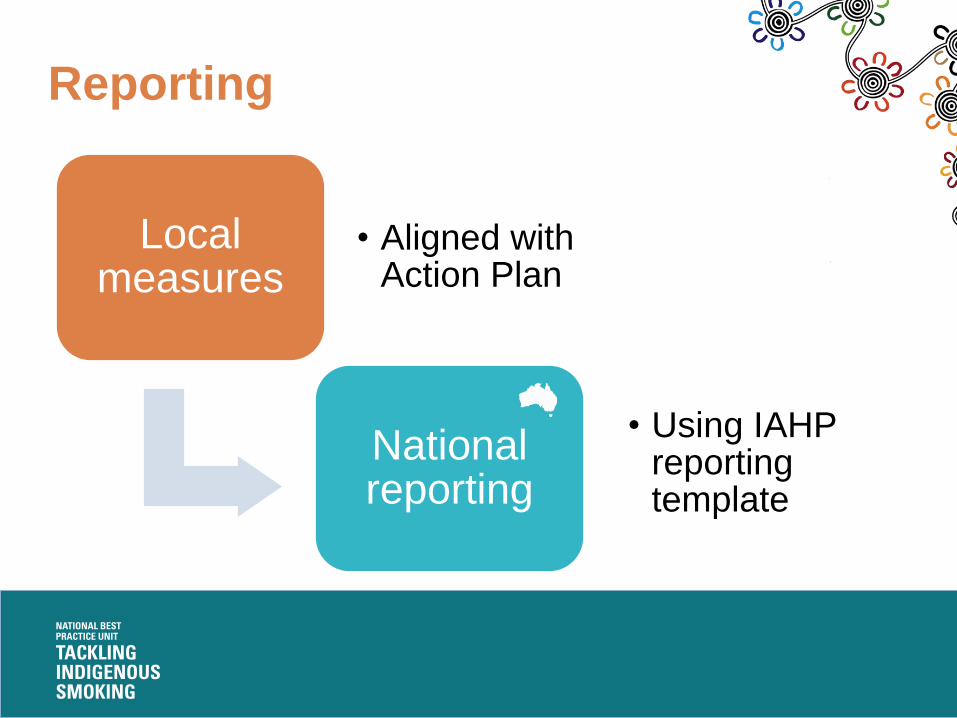
Reporting
Local measures
• Aligned with Action Plan
National reporting
• Using IAHP reporting template
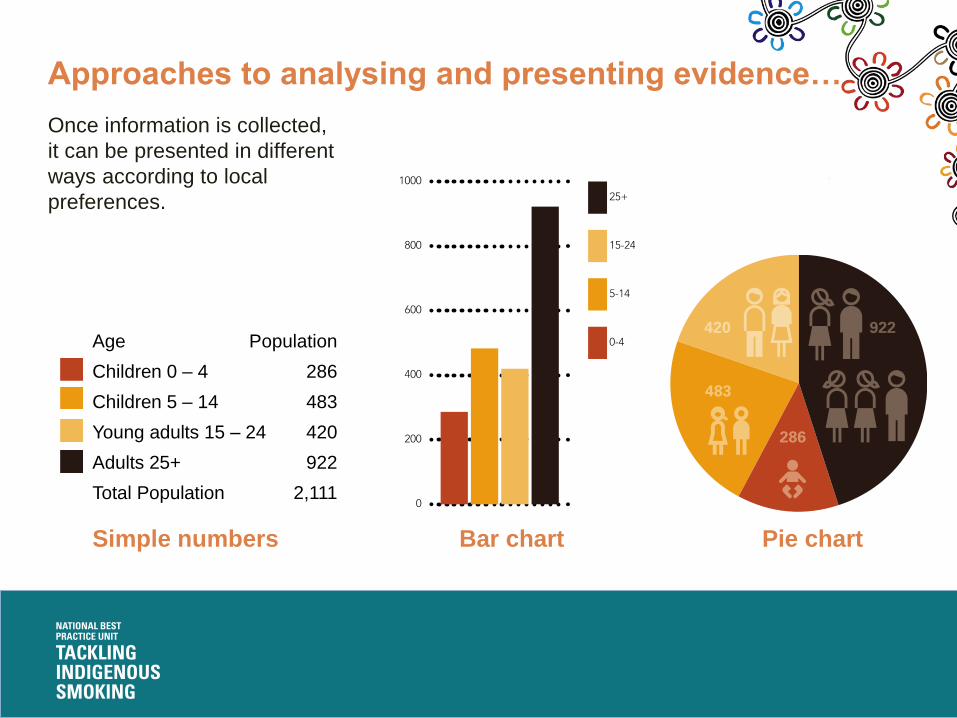
Approaches to analysing and presenting evidence…
Once information is collected,
it can be presented in different
ways according to local
preferences.
Pie chartSimple numbers Bar chart
Age Population
Children 0 – 4 286
Children 5 – 14 483
Young adults 15 – 24 420
Adults 25+ 922
Total Population 2,111
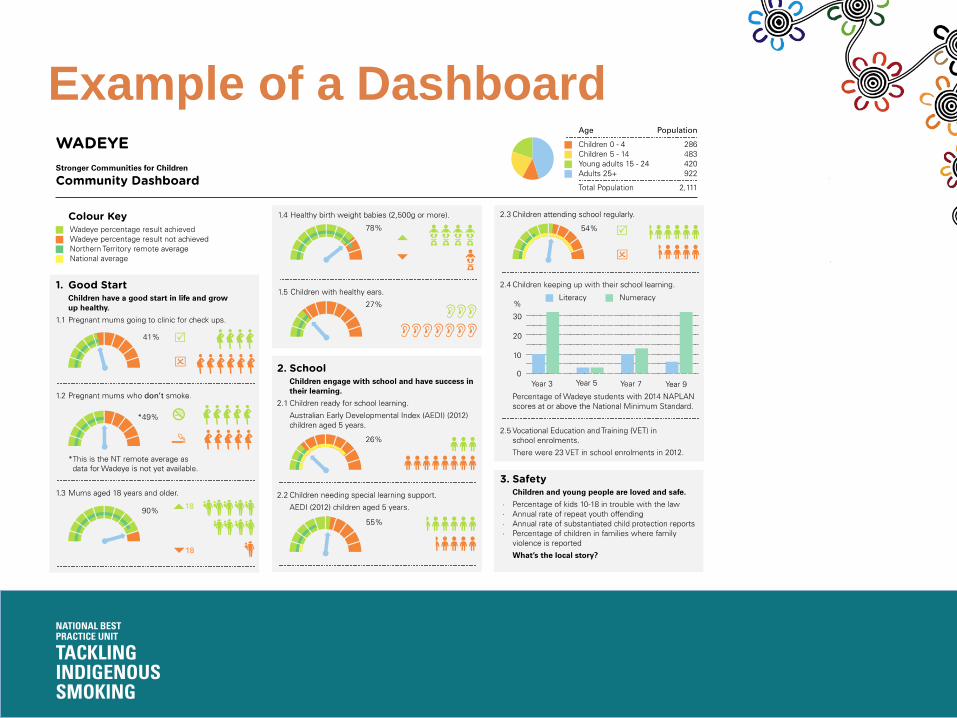
Example of a Dashboard
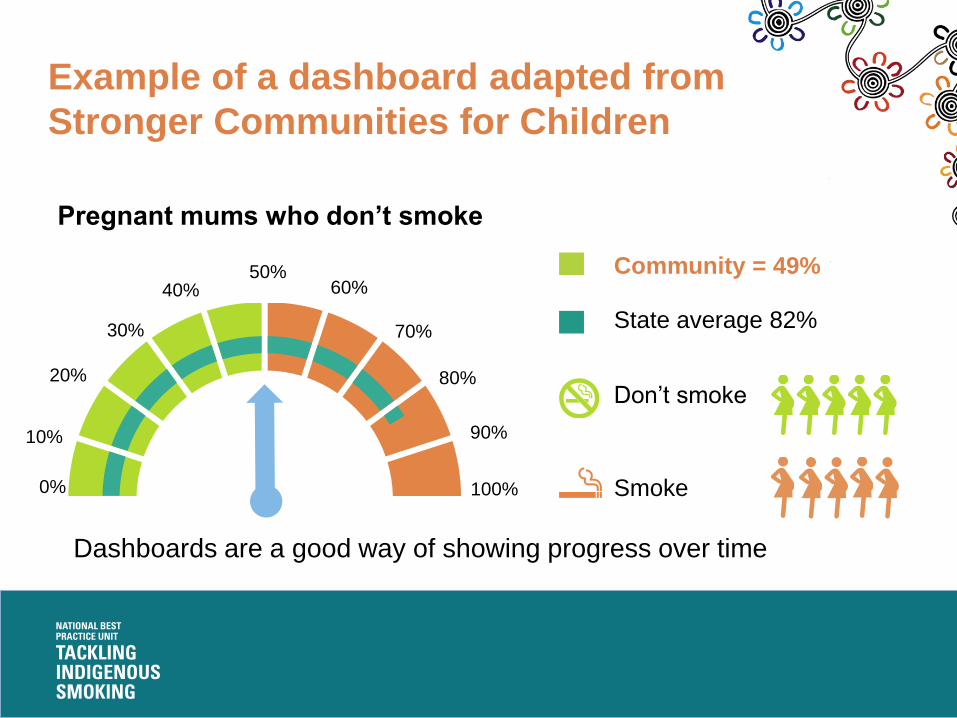
Pregnant mums who don’t smoke
Community = 49%
State average 82%
Don’t smoke
0%
10%
20%
30%
40%50%
60%
70%
80%
90%
100%
Example of a dashboard adapted from
Stronger Communities for Children
Smoke
Dashboards are a good way of showing progress over time
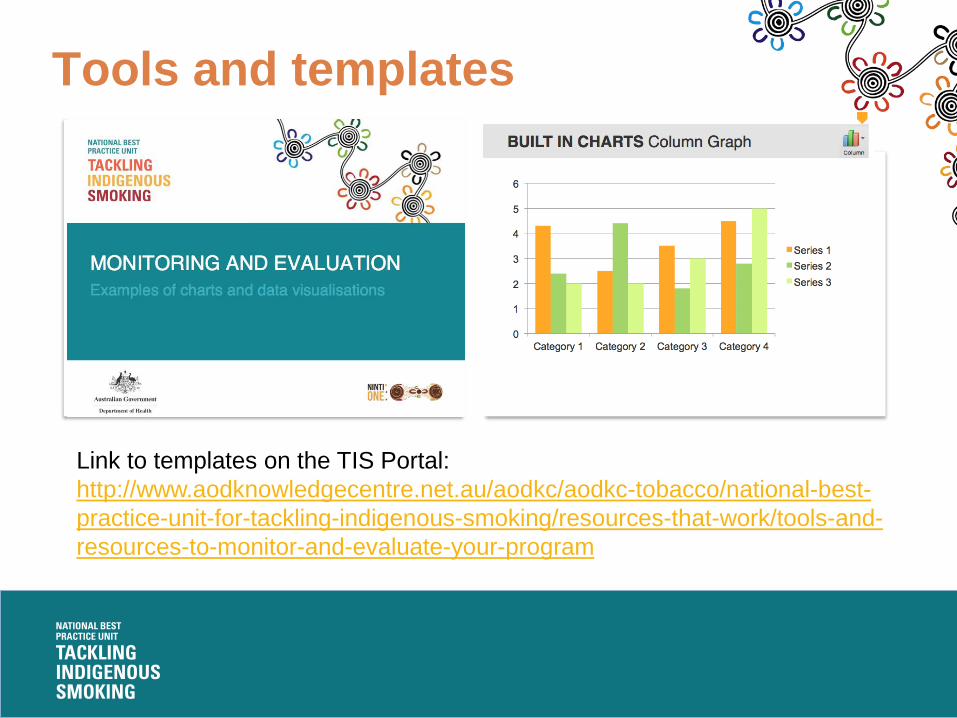
Tools and templates
Link to templates on the TIS Portal:
http://www.aodknowledgecentre.net.au/aodkc/aodkc-tobacco/national-best-
practice-unit-for-tackling-indigenous-smoking/resources-that-work/tools-and-
resources-to-monitor-and-evaluate-your-program
In this exercise, we are going to invent some
typical data and then work out how best to
present it using the methods shown in
previous slides.
Then let’s describe the pros and cons of
each method.
Exercise: Presenting and reporting data

Questions and discussion
Part 7: Planning for local measurement
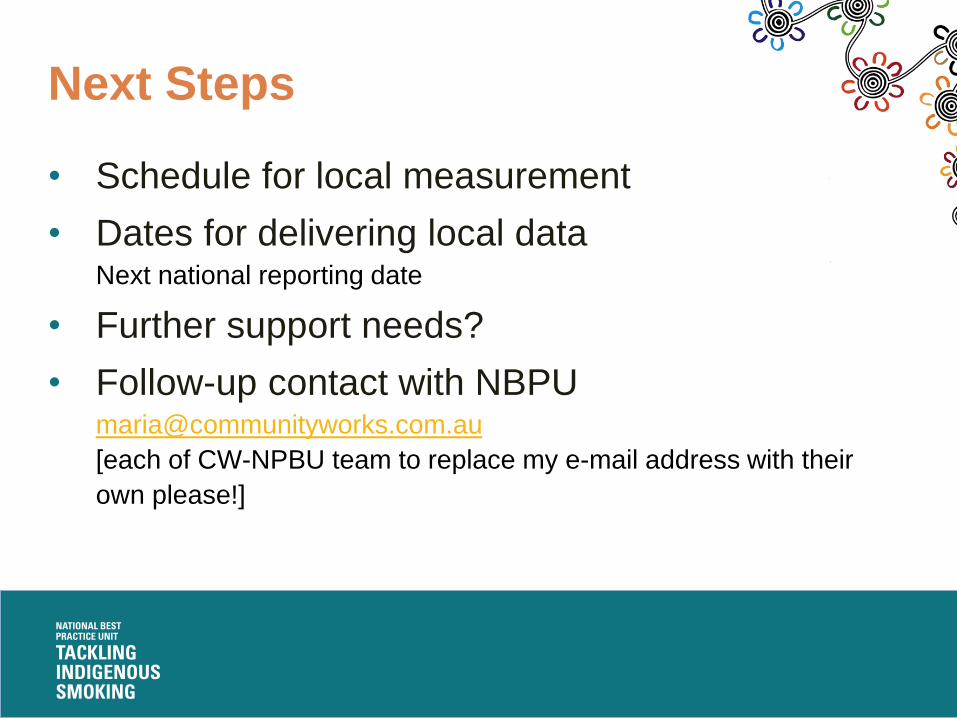
Next Steps
• Schedule for local measurement
• Dates for delivering local dataNext national reporting date
• Further support needs?
• Follow-up contact with [email protected]
[each of CW-NPBU team to replace my e-mail address with their
own please!]
Additional online resources
• TIS Portal
• Community Toolbox
• Better Evaluation
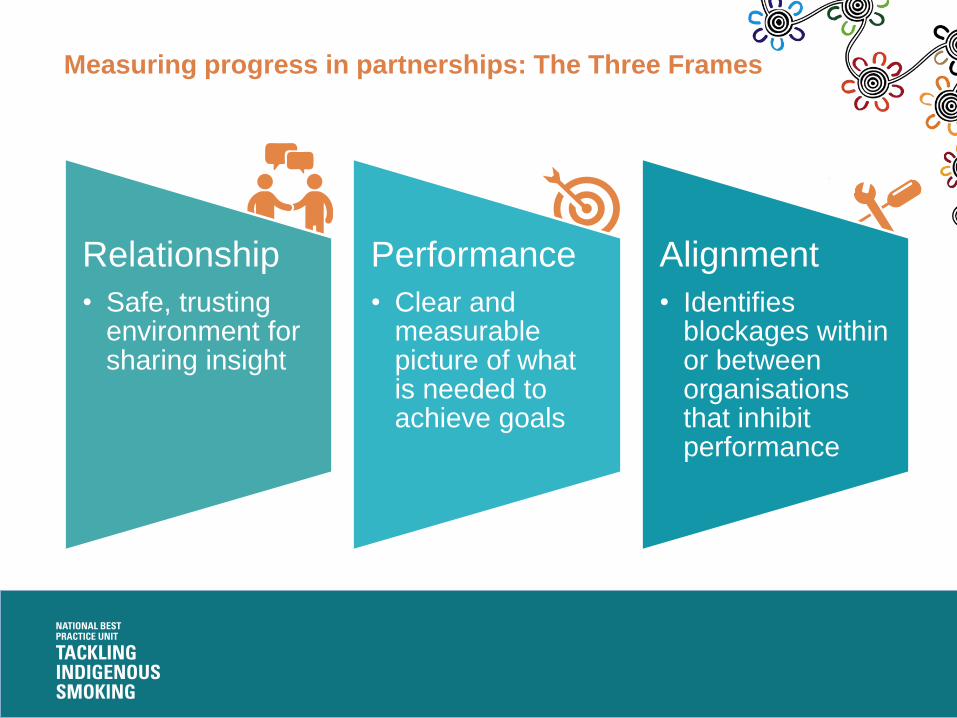
Measuring progress in partnerships: The Three Frames
Relationship
• Safe, trusting environment for sharing insight
Performance
• Clear and measurable picture of what is needed to achieve goals
Alignment
• Identifies blockages within or between organisationsthat inhibit performance
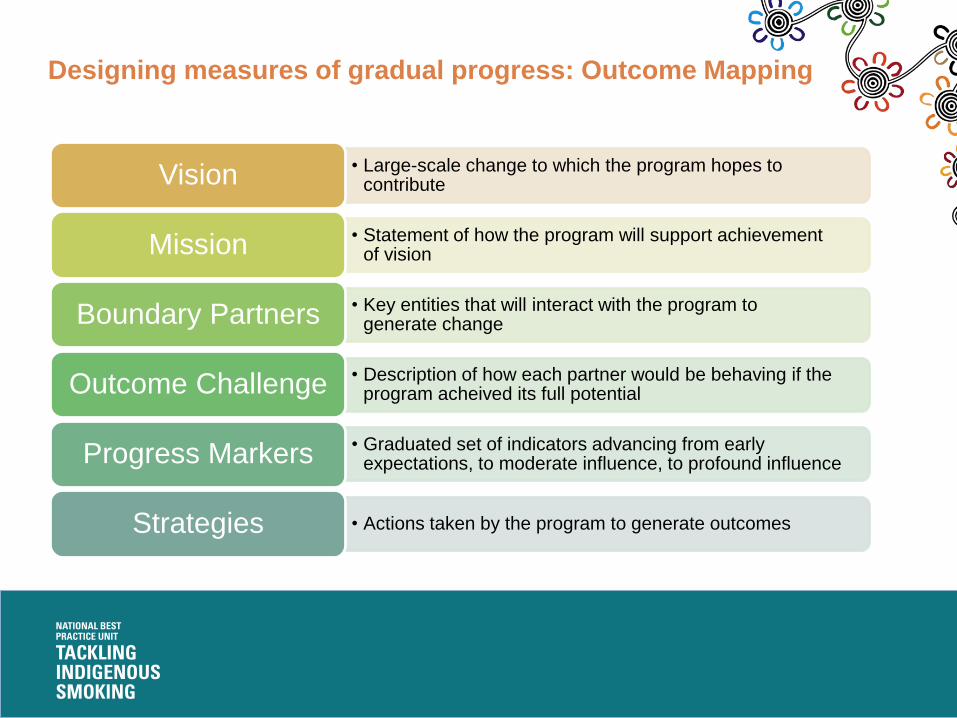
Designing measures of gradual progress: Outcome Mapping
• Large-scale change to which the program hopes to contributeVision
• Statement of how the program will support achievement of visionMission
• Key entities that will interact with the program to generate changeBoundary Partners
• Description of how each partner would be behaving if the program acheived its full potentialOutcome Challenge
• Graduated set of indicators advancing from early expectations, to moderate influence, to profound influenceProgress Markers
• Actions taken by the program to generate outcomesStrategies
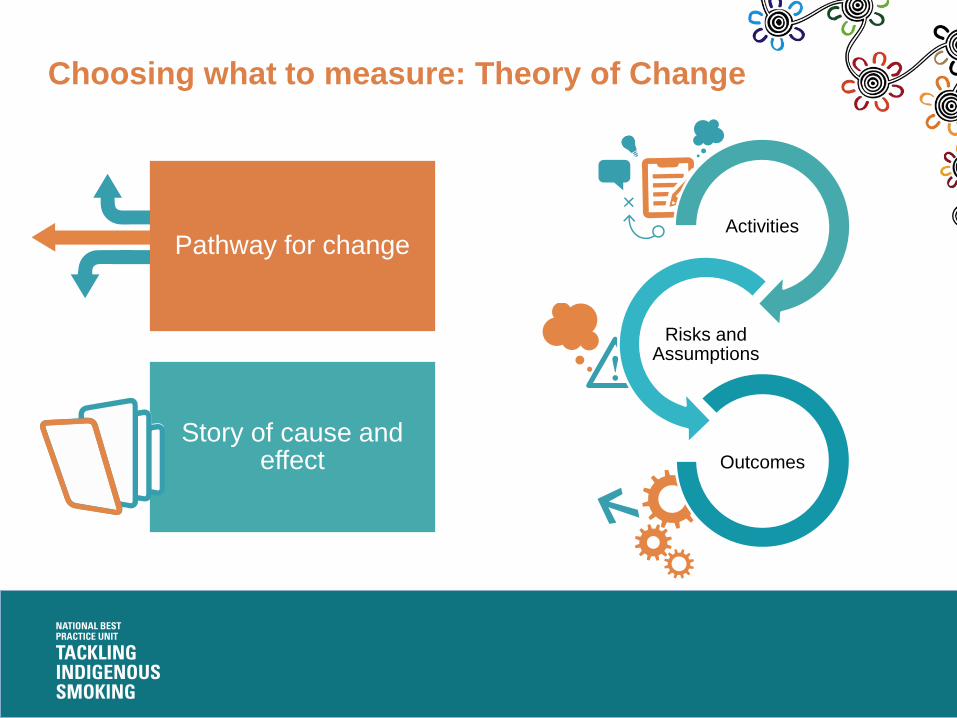
Pathway for change
Story of cause and effect
Choosing what to measure: Theory of Change
Activities
Risks and Assumptions
Outcomes