Embed Size (px)
Citation preview

Wright State University Wright State University
CORE Scholar CORE Scholar
Browse all Theses and Dissertations Theses and Dissertations
2019
Measuring Leader-Level Engagement: Addressing the Gap in Measuring Leader-Level Engagement: Addressing the Gap in
Employee Engagement Research Employee Engagement Research
Colleen Marie Hayden
Follow this and additional works at: https://corescholar.libraries.wright.edu/etd_all
Part of the Educational Leadership Commons
Repository Citation Repository Citation Hayden, Colleen Marie, "Measuring Leader-Level Engagement: Addressing the Gap in Employee Engagement Research" (2019). Browse all Theses and Dissertations. 2250. https://corescholar.libraries.wright.edu/etd_all/2250
This Dissertation is brought to you for free and open access by the Theses and Dissertations at CORE Scholar. It has been accepted for inclusion in Browse all Theses and Dissertations by an authorized administrator of CORE Scholar. For more information, please contact [email protected].

MEASURING LEADER-LEVEL ENGAGEMENT
i
MEASURING LEADER-LEVEL ENGAGEMENT: ADDRESSING THE GAP IN EMPLOYEE ENGAGEMENT RESEARCH
A dissertation to be submitted in partial fulfillment of the requirements for the degree of
Doctor of Education
By
COLLEEN MARIE HAYDEN B.A., Wright State University, 2007
M.S.L.D., Wright State University, 2011
_______________________________________
2019 Wright State University
MEASURING LEADER-LEVEL ENGAGEMENT
ii
COPYRIGHT BY
COLLEEN MARIE HAYDEN
2019

MEASURING LEADER-LEVEL ENGAGEMENT
iii
WRIGHT STATE UNIVERSITY GRADUATE SCHOOL
11/4/2019
I HEREBY RECOMMEND THAT THE DISSERTATION PREPARED UNDER MY SUPERVISION BY Colleen Marie Hayden ENTITLED Measuring leader-level engagement: Addressing the gap in employee engagement research BE ACCEPTED IN PARTIAL FULFILLMENT OF THE REQUIREMENTS FOR THE DEGREE OF Doctor of Education.
________________________ Yoko Miura, Ed.D. Dissertation Co-Chair
________________________
Sharon Heilmann, Ph.D. Dissertation Co-Chair
_______________________
Suzanne Franco, Ed.D. Doctor of Education Program Director
________________________
Carol Patitu, Ed.D. Chair, Leadership Studies in Education
and Organizations
_______________________ Barry Milligan, Ph.D.
Interim Dean of the Graduate School Committee on Final Examination ________________________ Yoko Muira, Ed.D. ________________________ Sharon Heilmann, Ph.D. ________________________ Adedeji Badiru, Ph.D. ________________________ Suzanne Franco, Ed.D. ________________________ Alan Nash, B.A.

MEASURING LEADER-LEVEL ENGAGEMENT
iv
ABSTRACT
Hayden, Colleen Marie Ed.D., Department of Leadership Studies in Education and Organizations, Wright State University, 2019. Measuring leader-level engagement: Addressing the gap in employee engagement research.
Since the early 2000s, employee engagement has become a growing point of
interest for scholars, organizations, and consultants alike due to its association with a
variety of organizational outcomes such as job satisfaction, burnout, and turnover intent.
Though there is much focus surrounding the measurement of employee engagement
within the literature (Saks, 2019; Saks & Gruman, 2014), there is a notable absence in the
literature related to a leader’s own level of engagement. This study aimed to address this
gap, utilizing the Employee Engagement Scale (EES; Shuck, Adelson, & Reio, 2017),
which was developed in response to the lack of a preferred employee engagement
measure grounded in Kahn’s (1990) framework of cognitive, emotional, and behavioral
engagement.
Confirmatory factor analysis (CFA) was used to evaluate if the EES could assess
leader-level engagement on data from 147 formal leaders. Although the model goodness-
of-fit indices did not provide irrefutable evidence that leader engagement could be
assessed with the 12-item, three-factor structure of the EES, review of regression weights
and reliability coefficients provided evidence for the overall structure of the measure, and
modification indices provided opportunities to improve the EES model with a sample of
leaders. Future research focused on leader-level engagement and its impact on
organizational outcomes would benefit both academics and human resources
practitioners.
MEASURING LEADER-LEVEL ENGAGEMENT
v
TABLE OF CONTENTS
Page
CHAPTER 1: INTRODUCTION…………………………………………………………1
Statement of the Problem……………………………………………………………...3
Rationale………………………………………………………………………………4
Conceptual Framework……………………………………………………………..…5
Research Questions and Hypotheses………………………………………………….8
Significance………………………………………………………………………...…8
Definition of Relevant Terms…………………………………………………………9
Scope…………………………………………………………………………………10
Assumptions………………………………………………………………………….10
Organization of the Study……………………………………………………………10
CHAPTER 2: REVIEW OF LITERATURE……………………………………………11
Theoretical Perspective………………………………………………………………13
Leader Engagement………………………………………………………………….14
Antecedents of Engagement…………………………………………………............15
Job Characteristics……………………………………………………………….17
Affective Commitment………………...………………………………………...17
Supervisor Support……….……………………………………………………...19
Consequences of Engagement……………………………………………………….20

MEASURING LEADER-LEVEL ENGAGEMENT
vi
Organizational Citizenship Behaviors…………………………………………...21
Turnover Intention……………….………………………………………………21
Job Satisfaction……...…………………………………………………………...23
Engagement Measures……………………………………………………………….24
Work and Family Engagement Scale…………………………………………….24
May, Gilson, and Harter Engagement Scale……………………………………..25
Job and Organizational Engagement Scale………………………………………26
Job Engagement Scale…………………………………………………………...27
Intellectual, Social, Affective Engagement Scale………………………………..28
Felt and Behavioral Engagement Scale………………………………………….29
Utrecht Work Engagement Scale………………………………………………...29
Employee Engagement Scale…………………………………………………….30
Selection of Employee Engagement Scale………………………………………......33
Study 1 of EES…………………………………………………………………...34
Study 2 of EES…………………………………………………………………...34
Study 3 of EES…………………………………………………………………...34
Cognitive Factor………………………………………………………………….35
Emotional Factor…………………………………………………………………35
Behavioral Factor………………………………………………………………...36
Conceptual Framework………………………………………………………………36
Kahn’s Engagement Research…………………………………………………...36
Cognitive Engagement.………………………………………………………37
Emotional Engagement………………………………………………………38

MEASURING LEADER-LEVEL ENGAGEMENT
vii
Behavioral Engagement……………………………………………………...38
Research Question…………………………………………………………………...39
Summary and Implications of Literature Review……………………………………39
CHAPTER 3: METHODS……………………………………………………………….41
Research Question and Hypotheses…….……………………………………………41
Research Design……………………………………………………………………...42
Participants…………………………………………………………………………...43
Instrumentation………...…………………………………………………………….44
Order of Survey Items……………………………………………………………44
Data Collection…..……………………..……………………………………………46
Data Analysis…………………...……………………………………………………47
Model Fit Criteria………………………………………………………………..48
Summary of Methodology…………………………………………………………...52
CHAPTER 4: RESULTS.………………………………………………………………..53
Research Questions and Hypotheses………………………………………………...53 Data Collection…..…...……………………………………………………………...55
Testing for Assumptions……………………………………………………………..55 Participants.………………………………………………………………………56
Missing Data……………………………………………………………………..57 Multivariate Outliers……………………………………………………………..57 Normality…………….…………………………………………………………..59
Multicollinearity…………………………………………………………………59
Confirmatory Factor Analysis………………………………...……………………..60
MEASURING LEADER-LEVEL ENGAGEMENT
viii
Just-Identified Model...…………..………………………………………………60 Model Goodness of Fit…………..………………………………………………63
Regression Weights..…………………………………………………………….65 Modification Indices……………………………………………………………..67
Modifications to the Model………………………………………………….67 Model Maximum Likelihood Estimates…....…………………….……………...69
Bayesian Estimation…..………………………….…………………………..71
Summary of Results….………………………………………...…………………….72
CHAPTER 5: DISCUSSION…………………………………………………………….73
Research Question and Hypotheses………………………………………………….73 Summary of Results………………………………………………………………….74 Discussion………………………………………..………………………….……….75
Modification of the Model…………………...…..………………………….…...75
Suggested Model Improvement 1……………………………………………76
Suggested Model Improvement 2……………………………………………77
Suggested Model Improvement 3……………………………………………78 Measuring Leader Engagement…..……………………………………………...…..83
Limitations……………………………………………………………………….…..86
Data Collection Limitations……………………………………………………...87 Recommendations and Future Research……………………………………………..89 Conclusion…………………………………………………………………………...91
REFERENCES.……………………………………………………………………...…..94 APPENDIX A: Employee Engagement Scale (EES)………….……………..………...113

MEASURING LEADER-LEVEL ENGAGEMENT
ix
APPENDIX B: Permission to Use Employee Engagement Scale (EES…………..……114 APPENDIX C: IRB Approval…..……………………………………………………...115
MEASURING LEADER-LEVEL ENGAGEMENT
x
LIST OF FIGURES
Figure Page
1. Visualization of Shuck et al. (2017) EES Model………………………..……………..7
2. Antecedents and Consequences of Employee Engagement………………………..….16
3. Kahn’s (1990) Conceptual Model of Engagement …………………………………...37
4. Visualization of EES to Measure for Leader Engagement……………...….…….…...43
5. Structural Model of the EES to Measure for Leader Engagement……………………49
6. Structural Model of the EES to Measure for Leader Engagement, Just-Identified…...61
7. Structural Model of the EES to Measure for Leader Engagement, with Residual
Variances for Emotional and Behavioral Factors Constrained Equal……………….63

MEASURING LEADER-LEVEL ENGAGEMENT
xi
LIST OF TABLES
Table Page
1. Theoretical Framework for Various Engagement Measures...………………………..12
2. Selected Engagement Measures and Results.…………………………………………31 3. Employee Engagement Scale (EES)…………………………………………………..33 4. Revised Order of Questions Provided to Participants in this Study..…………………45
5. Cutoff Criteria Guidelines for Model Fit……………….……………………………..50
6. LinkedIn Groups, Sample Distribution………………..………………………………54 7. Descriptive Statistics of the Initial Sample…………………………………...……….56 8. Communalities From a Principal Component Analysis.………………………………57
9. Descriptive Statistics of Initial Sample Excluding Missing Data……………………..58
10. Descriptive Statistics of Final Sample Excluding Outliers…………………………..58 11. Summary of Collinearity Statistics…………………………………………………..59 12. Critical Ratio Differences between Parameters in the Preliminary Model…………..62 13. Summary of Cutoff Criterion and Obtained Statistics Used to Assess Model Fit…...64 14. Standardized Regression Weights…………………………………………..………..66
15. Modification Indices Based on Regression Weights……………………...…………69
16. Maximum Likelihood Estimates……………………………………………………..70
17. Comparison of ML and Bayesian Estimates…………………………………………71

MEASURING LEADER-LEVEL ENGAGEMENT
xii
18. Comparison of the Original EES Survey Item Grouping to the Suggested Change to
Survey Item Grouping Based on Modification Indices……………………………...80
MEASURING LEADER-LEVEL ENGAGEMENT
xiii
ACKNOWLEDGEMENTS
The completion of this dissertation has been a journey of perseverance and
resilience. It is hard to put into words the gratitude I have for the many people it has
taken to help get me to this point. To my dissertation committee, thank you for your
support and encouragement throughout this journey. Special thanks to Dr. Yoko Miura,
for instilling into me a deep appreciation for data and statistical analysis, through which I
did not know I could muster the strength to endure.
To my classmates, specifically the Multivariate Raiders, I truly would not have
made it through this journey without your wonderful friendship and support. I am forever
grateful.
To my husband and family, thank you for yet again supporting me in my graduate
studies. I promise I am done being a “professional student!”
And to my most wonderful accomplishment of all, I dedicate this to my son,
Henry. Mommy loves you and cannot wait to see where your life’s journey takes you.

MEASURING LEADER-LEVEL ENGAGEMENT
1
CHAPTER 1: INTRODUCTION
Since the early 2000s, employee engagement has been a growing point of interest
for scholars, organizations, and consultants alike due to its association with key
organizational outcomes (Kwon & Park, 2019; Saks, 2006; Saks, 2019; Saks & Gruman,
2014; Shuck, Osam, Zigarmi, & Nimon, 2017). Whether referred to as employee, work,
or job engagement, research has focused solely on engagement at the employee-level and
how an employee’s physical, cognitive, and emotional states (Kahn, 1990) that are
associated with various organizational outcomes, such as job satisfaction, job
performance, organizational citizenship behaviors (OCB), and productivity (Crawford,
LePine, & Rich, 2010; Harter, Schmidt, & Hayes, 2002; Macey, Schneider, Barbera, &
Young, 2009; Rich, LePine, & Crawford, 2010; Saks, 2006; Shuck & Wollard, 2010), as
well as turnover intention and burnout (Harter et al., 2002; Maslach, Schaufeli, & Leiter,
2001; Salanova & Schaufeli, 2008; Xanthopoulou, Bakker, Demerouti, & Schaufeli,
2009).
Unlike other constructs that are distinctly synonymous with their measurement
tool, burnout as in the Maslach Burnout Inventory (MBI) (Maslach et al., 2001) or job
satisfaction as in the Job Satisfaction Survey (JSS) (Spector, 1997), scholars continue to
focus attention on the need for developing a preferred measure within the employee
engagement literature (Albrecht, 2010; Kwon & Park, 2019; Saks, 2006; Saks, 2019;
Saks & Gruman, 2014; Schneider, Yost, Kropp, Kind, & Lam, 2017; Shuck, Adelson, &

MEASURING LEADER-LEVEL ENGAGEMENT
2
Reio, 2017; Shuck, Osam, Zigarmi, & Nimon, 2017). Saks and Gruman (2014) have
identified at least seven different published scales to measure employee engagement.
Differences ranged from which theory the measures were grounded, such as Kahn’s
(1990) engagement theory or Maslach’s burnout theory (Maslach et al., 2001), to how
they termed ‘engagement,’ from employee to job to work engagement.
Social science researchers have been examining what constitutes a valid measure
since the early 1950s (Cronbach & Meehl, 1955). Validity provides support that an
instrument accurately measures the theoretical model that it was created to assess
(Carmines & Zeller, 1979). Providing statistical evidence of a measure’s validity
strengthens the underlying theoretical framework and the strength of testing the
hypothesized relationships associated with the measure (Campbell, 1960). Without a
valid measure, it is impossible to determine a measure’s reliability. Reliability provides
evidence that an instrument produces stable and consistent results across different
samples over time (Carmines & Zeller, 1979). Thus, without a consistently valid and
reliable employee engagement measure, it is questionable for researchers to continue to
posit the relationship of employee engagement with other organizational outcomes such
as job satisfaction, burnout, and turnover intention.
In addition to the literature noting the lack of a consistently reliable and valid tool
to measure employee engagement (Albrecht, 2010; Kwon & Park, 2019; Saks, 2006;
Saks, 2019; Saks & Gruman, 2014; Schneider et al., 2017; Shuck, Adelson, & Reio,
2017; Shuck, Osam, Zigarmi, & Nimon, 2017), there is a notable gap within the
employee engagement literature related to a leader’s own level of engagement within the
workplace. An employee’s relationship with his/her immediate supervisor has been well

MEASURING LEADER-LEVEL ENGAGEMENT
3
documented to influence an employee’s job satisfaction, intention to quit (Gerstner &
Day, 1997; Harris, Harris, & Brouer, 2009; Harris, Kacmar, & Witt, 2005; Liden &
Maslyn, 1998), and level of engagement (Christian, Garza, & Slaughter, 2011; Jordan &
Troth, 2011), yet assessing leader-level engagement remains absent from the literature.
Statement of the Problem
The culture within human resources practices and organizational leadership
research has focused exclusive attention on how variables associated with employees
influence an organization’s bottom line. Yet if the employee-supervisor relationship has
been widely cited as associated to an employee’s level of engagement, job satisfaction,
and turnover intention then might not a leader’s own responses to these organizational
variables within the workplace be worthy of attention within the literature? Reports from
Gallup (Adkins, 2015; Robinson, 2010) have provided one of the few pieces of evidence
that leader engagement is worth explicit focus due to the fiscal impact of leader
disengagement on organizations. Disengaged leaders are costing companies $77 to $96
billion annually due to the influence they have on those they lead (Adkins, 2015), which
includes the estimate that U.S. businesses lose a trillion dollars every year due to
voluntary employee turnover (McFeely & Wigert, 2019).
Research on the association of leader engagement on organizational outcomes
such as employee job satisfaction and turnover intention cannot be conducted if a valid,
reliable tool to measure leader engagement is not identified. Thus, this dissertation aimed
to evaluate if data provided by formal leaders could replicate the structure of an existing,
validated employee engagement measurement tool. Based on the monetary impact of the
studies cited from Gallup (Adkins, 2015; Robinson, 2010; McFeely & Wigert, 2019),

MEASURING LEADER-LEVEL ENGAGEMENT
4
businesses might consider the utility of assessing leader-level engagement and other
organizational variables from the leader’s point of view in an attempt to improve the
engagement of their entire workforce and ultimately their bottom lines.
Rationale
Although there has been much published in the employee engagement literature
focused on the need for a universal measure of employee engagement, the measurement
of leader engagement has been completely absent from the engagement literature. This
study aimed to address this absence, utilizing the Employee Engagement Scale (EES;
Shuck, Adelson, & Reio, 2017), which is grounded in Kahn’s (1990) engagement theory.
As indicated by Shuck et al. (2017), the EES was developed in direct response to the lack
of a preferred employee engagement measure grounded in Kahn’s (1990) engagement
framework of how one’s cognitive, emotional, and physical energies influence his/her
engagement within his/her workplace. Based on the evaluation of the measures presented
by Saks and Gruman in their 2014 review article by the researcher of this study, the EES
was selected for use to assess the research question and hypotheses for this dissertation.
The EES was selected due to its theoretical framework grounded in Kahn’s (1990) focus
on the cognitive, emotional, and physical energies that directly relate to one’s level of
engagement. Further discussion of the various measures reviewed by Saks and Gruman
(2014) is in Chapter 2.
Since the EES measure had strong validity and reliability based on initial reports
from Shuck et al. (2017), a special case of structural equation modeling (SEM),
confirmatory factor analysis (CFA), was employed in the present study as it takes a
confirmatory rather than exploratory approach to data analysis (Byrne, 2010). SEM

MEASURING LEADER-LEVEL ENGAGEMENT
5
provided the statistical methodology to confirm the structural theory of the EES (Byrne,
2010). As the EES is made up of three first-order factors (cognitive, emotional,
behavioral) and one second-order factor (engagement), second-order CFA was used on
data from self-identified formal leaders who were recruited for inclusion in this study via
LinkedIn (LinkedIn, n.d.), personal contacts, and the listserv of a mid-sized Midwestern
university. CFA results provided evaluative data as to whether the EES could accurately
measure leader-level engagement; the scale was initially validated using multiple groups
of employee samplings (Shuck et al., 2017). The results of this study provided evidence
to the management and leadership literature that leader-level engagement can be
measured; however the means of how to assess leader-level engagement with a valid,
reliable engagement measure requires additional consideration in future studies.
Conceptual Framework
Shuck, Adelson, and Reio (2017) recognized the gap within the literature
concerning a valid and reliable employee engagement measure grounded in Kahn’s
(1990) theoretical framework focusing on one’s cognitive, emotional, and physical
energies associated with his/her engagement in the workplace. The EES was developed to
be the first true measure of employee engagement, distinguishing the EES from job
engagement (Rich et al., 2010; Saks 2006), work engagement (Schaufeli, Salanova,
González-Romá, & Bakker, 2002), organizational engagement (Saks, 2006), as well as
intellectual and/or social engagement (Soane, Truss, Alfes, Shantz, Rees, & Gatenbytt,
2012). As indicated by Saks and Gruman (2014), the lack of a preferred tool grounded in
Kahn’s (1990) theory to measure employee engagement was the impetus for Shuck et al.
(2017) to develop the Employee Engagement Scale (EES).

MEASURING LEADER-LEVEL ENGAGEMENT
6
The 12 survey items included in the EES (see Appendix A for the complete EES
tool) are grounded in Kahn’s (1990) research on personal engagement, specifically
related to one’s cognitive, emotional, and physical engagement. In Kahn’s (1990) initial
work, these constructs paved the way for him to identify that one’s cognitive, emotional,
and physical engagement were grounded in the need for an employee’s meaningfulness,
safety, and availability within the workplace. Meaningfulness, safety, and availability are
theorized to influence the degree to which one cognitively, emotionally, and physically
engages in his/her work (May, Gilson, & Harter, 2004).
Meaningfulness is defined as the value of the work, as judged by an individual’s
own ideals and standards (Hackman & Oldham, 1980; Renn & Vandenberg, 1995).
Safety is defined as the ability to express one’s self without fear of retaliation for one’s
self-image, status, or career (Kahn, 1990). Availability is the most directly related to the
three constructs identified by Kahn (1990), focusing on availability as one’s belief that
he/she has the physical (synonymous with behavioral throughout the literature and this
dissertation), emotional, and/or cognitive resources to be fully engaged at work. From
this conceptual framework, the study by Shuck et al. (2017) established the 12-item
Employee Engagement Scale (EES; see Appendix A) and provided initial validation of
the measure’s factorial structure as it relates to Kahn’s (1990) theoretical framework.
The EES model illustrated in Figure 1 was created to visualize the structure of the
EES that was provided in the study by Shuck et al. (2017). The original validation study
for the EES utilized samples of employees to obtain the data used for running
confirmatory factor analysis (CFA) in the original study (Shuck et al., 2017). However
for this study, the population of interest was formal leaders (supervisors or managers),

MEASURING LEADER-LEVEL ENGAGEMENT
7
thus the dependent variable of interest shifts from employee engagement to leader
engagement. This study built from Shuck et al.’s (2017) research to address the gap in the
literature for a theoretically sound, valid, and reliable measurement tool to assess not only
employee engagement but also more specifically leader engagement.
Figure 1. Visualization of Shuck et al.’s (2017) EES model.
Item 1
Item 2
Item 3
Item 4
Item 5
Item 6
Item 7
Item 8
Item 9
Item 10
Item 12
Item 11
Cognitive Engagement
Emotional Engagement
Behavioral Engagement
Employee Engagement

MEASURING LEADER-LEVEL ENGAGEMENT
8
Research Question and Hypotheses
This study examined the following research question:
How well do the data collected from leaders replicate the three-factor structure identified
in the Employee Engagement Scale (EES) by Shuck, Adelson, and Reio (2017)?
To provide more precise examination of the research question, the following
hypotheses were tested:
H1. Responses to the Employee Engagement Scale (EES) can be explained by three first-
order factors (emotional, cognitive, and behavioral) and one second-order factor
(engagement).
Null H1. Responses to the Employee Engagement Scale (EES) cannot be explained by
three first-order factors (emotional, cognitive, and behavioral) and one second-order
factor (engagement).
H2. Covariance among the three first-order factors is explained fully by their regression
on the second-order factor.
Null H2. Covariance among the three first-order factors cannot be explained fully by their
regression on the second-order factor.
H3. Data from leaders fits the structure model of the EES.
Null H3. Data from leaders do not fit the structure model of the EES.
Significance
The significance of this study is two fold. One, the factorial validity of the
theoretically grounded EES (Shuck et al., 2017) measure needed to be further evaluated
to add credence to the literature on valid and reliable employee engagement measures.
Two, a sampling of formal leaders were surveyed using the EES specifically to address

MEASURING LEADER-LEVEL ENGAGEMENT
9
the gap in the literature related to assessing leader-level engagement.
Definition of Relevant Terms
Behavioral engagement: Psychological state of intention to act in a manner that
positively impacts work performance (Macey & Schneider, 2008; Rich et al., 2010);
synonymous with physical engagement.
Cognitive engagement: The intensity of one’s mental energy towards positive
outcomes within the organization he/she works (Rich et al., 2010).
Confirmatory factor analysis (CFA): A statistical technique used to verify the
factor structure of observed variables, specifically used to test the hypothesized
relationship between observed variables and their underlying latent constructs
(Tabachnick & Fidell, 2013).
Emotional engagement: Representative of one’s degree of enthusiasm, happiness,
and optimism experienced in the workplace (Bono, Foldes, Vinson, & Muros, 2007).
Employee: hierarchical junior of a leader; synonymous with subordinate and
follower
Employee engagement: A positive, active, work-related psychological state
operationalized by an employee’s ability to maintain the intensity and direction of his/her
cognitive, emotional, and behavioral energies (Shuck, Osam, Zigarmi, & Nimon, 2017).
Leader: Hierarchical superior of an employee; synonymous with supervisor or
manager.
Leader engagement: The immersion and holistic investment of a leader’s entire
self (physically, cognitively, and emotionally) into his/her work role within an
organization (Christian et al., 2011).

MEASURING LEADER-LEVEL ENGAGEMENT
10
Physical engagement: Psychological state of intention to act in a manner that
positively impacts work performance (Macey & Schneider, 2008; Rich et al., 2010);
synonymous with behavioral engagement.
Scope
The scope of this study was limited to volunteers who self-identified as holding a
formal leadership role (supervisors or managers) across different levels of management
who participated in completing the EES measure via LinkedIn or email invitation.
Assumptions
The following assumptions were adopted for this study: (a) participants truthfully
self-identified as supervisors or managers in order to be included in the sampling for this
study; (b) participants responded truthfully on the EES, and (c) participants perceived no
threat of repercussion for their involvement in the study.
Organization of the Study
Chapter One presented the statement of the problem, rationale, conceptual
framework, research questions, significance of the study, definition of terms, scope, and
assumptions of the study. Chapter Two contains the review of literature and research
related to employee engagement. Chapter Three contains the methodology and
procedures used to gather data for this study. Chapter Four contains the results of
analyses and outcomes that emerged from this study. Chapter Five contains a summary of
the study and analytic results, discussion drawn from the results, limitations, and
recommendations for future research.

MEASURING LEADER-LEVEL ENGAGEMENT
11
CHAPTER 2: REVIEW OF LITERATURE
Adkins (2015) suggested that leader disengagement cost companies $77 to $96
billion annually due to the influence leaders have on those they lead. Yet the primary
focus of engagement research has been on how engaged employees are in the workplace.
As Welbourne (2007) stated over a decade ago, “if [engagement] is something
organizations are trying to do to employees rather than a quality that leaders are
demonstrating through example, the interventions associated with engagement will fail”
(p. 45). Though Welbourne (2007) called for further research on leader-level engagement
years ago, a gap remains within the engagement literature as to whether leader
engagement has the same impact on organizational outcomes as evidenced in employee
engagement research.
A primary area of focus within the employee engagement literature centers on
how to measure the construct. Bailey, Madden, Alfes, and Fletcher’s (2017) review of the
engagement literature indicated that 86% of studies used the Utrecht Work Engagement
Scale (UWES; Schaufeli et al., 2002), which is grounded in burnout theory (Maslach et
al., 2001). Yet, as seen in Table 1, the majority of published employee engagement
measures are grounded in Kahn’s (1990) engagement theory; however, replication studies
seem to be unable to consistently produce reliable and valid results of those most
prolifically cited measures (Saks & Gruman, 2014). To address both the scarcity in the
literature related to leader engagement and the need for a consistently valid measure, this

MEASURING LEADER-LEVEL ENGAGEMENT
12
dissertation sought to analyze if leader-level engagement not only could be measured
using the EES (Shuck et al., 2017) but also would reflect the factor structure of the EES.
Table 1
Theoretical Frameworks for Various Engagement Measures
Theoretical Framework Engagement Measures
Engagement theory (Kahn, 1990)
Work and Family Engagement Scale (Rothbard, 2001)
May et al.’s (2004) Engagement Scale
Job and Organizational Engagement Scale (Saks, 2006)
Job Engagement Scale (JES; Rich et al., 2010)
Intellectual, Social, Affective (ISA) Engagement Scale (Soane et al., 2012)
Felt and Behavioral Engagement Scale (Stumpf et al., 2013)
Employee Engagement Scale (EES; Shuck et al., 2017)
Burnout theory (Maslach et al., 2001)
Utrecht Work Engagement Scale (UWES; Schaufeli et al., 2002)
It should be noted that several variations exist within the literature as to how
employee engagement can be defined and named. Though the constructs of job
engagement (Rich et al., 2010) and work engagement (Christian et al., 2011) are both
grounded in Kahn’s (1990) theoretical framework and cited throughout the literature by
those names, the terms appear to be interchangeable with employee engagement. A
review of the literature by Shuck, Osam, Zigarmi, and Nimon (2017) focused specific
attention on the differences between employee, job, and work engagement, to name a
few. The authors’ provided detailed discussion of the similarities and differences between
the various engagement frameworks and suggested that researchers investigating

MEASURING LEADER-LEVEL ENGAGEMENT
13
employee engagement should focus specifically on the construct as “a positive, active,
work-related psychological state operationalized by the maintenance, intensity, and
direction of cognitive, emotional, and behavioral energy” (Shuck, Osam, Zigarmi, &
Nimon, 2017, p. 269). Even Bakker and Leiter (2010) utilized both work engagement and
employee engagement interchangeably in their handbook of engagement theory and
research, further illustrating this peculiar incongruence within the literature (Albrecht,
2010; Saks & Gruman, 2014; Shuck, Osam, Zigarmi, & Nimon, 2017).
Theoretical Perspective
The theoretical perspective for this research was grounded in social
constructionism (Burr, 2003). Social constructionism is concerned with the meaning
placed on an object or event by those within a society, thus shaping the reality of that
society. Yet this socially constructed reality of a particular society may not be
representative of the reality shared by those outside of that society (Berger & Luckmann,
1966). Berger and Luckmann (1991) have focused attention on the nature and
construction of knowledge, specifically as to how knowledge emerged and how
knowledge came to have significance for a given society.
Knowledge is viewed as created by the interactions among individuals within a
society. This view is fundamental to constructionism because it aids in shaping one’s
identity (Schwandt, 2003). In relation to measuring leader engagement, one’s social
reality is essential to the perception of his/her level of engagement within the workplace
because one’s individualized reality about their engagement is grounded in the social
construction of what engagement means within the leaders’ societies. The data collected
in the present study represented leaders’ self-report about their engagement; the

MEASURING LEADER-LEVEL ENGAGEMENT
14
respondents were reporting their perceived socially constructed frame of reality about
leadership.
Leader Engagement
The few articles that have been published focusing on the wellbeing of leaders
were studied from the frame of leader-member exchange theory (Bernerth & Hirschfeld,
2016). One such article included data indicating that leader engagement and emotional
exhaustion were intervening variables of transformational leadership style (Courtright,
Colbert, & Choi, 2014). Courtright et al. (2014) used the Utrect Work Engagement Scale
(Schaufeli et al., 2002), grounded in Maslach et al.’s (2001) burnout theory not Kahn’s
(1990) engagement theory, to assess leader engagement. The authors adopted the
definition of engagement based on the theoretical frame of vigor, dedication, and
absorption established by Schaufeli et al. (2002).
Aldatmaz, Aykaç, and Dicle (2016) provided research on “manager” engagement
and its relationship to benefits and retention in organizations, but the authors utilized the
Gallup engagement survey which focuses on management practices and is not grounded
in theory (Saks & Gruman, 2014). Gallup has published several reports over the last
decade stating that disengaged leaders cost companies $77 to $96 billion annually due to
the influence leaders have on the employees they lead (Adkins, 2015). In addition, an
estimated trillion dollars is lost by U.S. businesses every year due to voluntary employee
turnover (McFeely & Wigert, 2019).
To offer additional evidence of the gap regarding leader engagement within
existing employee engagement research, the researcher of the present study used the
Academic Search Complete database through the university library to find and examine

MEASURING LEADER-LEVEL ENGAGEMENT
15
peer-reviewed, academic journal articles published through October 2019 with the search
terms “leader engagement” (15 articles), “supervisor engagement” (three articles), or
“manager engagement” (10 articles). The searches conducted with these three sets of
search terms yielded no articles that included measurement of leader-level engagement
based on this study’s definition of engagement (cognitive, emotional, and physical
engagement; Kahn, 1990). Furthermore, the addition of the search term “measure” to
each of these searches yielded only two published, peer-reviewed articles (non-
dissertation/thesis) for “leader engagement,” 12 published articles for “supervisor
engagement,” and two published articles for “manager engagement.” Adding the terms
did not yield any articles that met the theoretical framework and definitions of this study.
The paucity of existing published literature regarding leader engagement using
Kahn’s (1990) theory of engagement provided support for the assertion that leader-level
engagement remains a notable gap within the literature. The absence is notable given the
vast number of articles that have documented the impact of the employee-leader
relationship on many crucial organizational outcomes from employee performance to
burnout to turnover intention (Christian et al., 2011; Gerstner & Day, 1997; Harris, Harris
et al., 2009; Harris et al., 2005; Jordan & Troth, 2011; Liden & Maslyn, 1998). Without a
valid, reliable tool to measure leader engagement, it is impossible for researchers to
identify how leader engagement may influence crucial organizational outcomes as noted
throughout the employee engagement literature.
Antecedents of Engagement
Throughout the literature there are many factors that are noted to have an
influence on an employee’s engagement within the workplace. Job characteristics, such

MEASURING LEADER-LEVEL ENGAGEMENT
16
as skill variety, task-identify, and autonomy (Hackman & Oldham, 1980) provide
individuals with the opportunity and motivation to bring more of themselves into their
work, thus becoming more engaged (Kahn, 1992). In terms of social exchange theory
(SET; Blau, 1964), external rewards and recognition for a job provide incentive for
employees to become more engaged (Saks, 2006). Blau (1964) defined the social
exchange as a mutually contingent and rewarding process within a dyad. Social
exchanges are beyond the contractual obligations that an employee has with his/her
employer and instead focus on the voluntary actions of employees in exchange for
reciprocal benefits (Blau, 1964).
Yet the literature regarding the antecedents of engagement focus sole attention on
the employee, not the leader. Figure 2 is a visual representation of both commonly cited
antecedents of employee engagement such as job characteristics, affective commitment,
and supervisor support, as well as consequences associated with engagement such as
organizational citizenship behavior (OCB), turnover intention, and job satisfaction.
Figure 2. Antecedents and consequences of employee engagement. The arrow from Antecedents to Employee Engagement indicates that these variables influence one’s level of engagement. The arrow from Employee Engagement to Consequences indicates that one’s level of engagement influences various organizational consequences.
MEASURING LEADER-LEVEL ENGAGEMENT
17
Job Characteristics
According to Kahn (1990, 1992), psychological meaningfulness can be achieved
from job characteristics that provide variety, challenging work, use of different skills,
personal discretion, and the opportunity to make important contributions to one’s job and
organization. The characteristics of one’s job provide he/she with the opportunity and
motivation to bring more of themselves into their work, thus becoming more engaged
(Kahn, 1992). These features of the job are based on Kahn’s (1992) review of Hackman
and Oldham’s (1980) job characteristics research, specifically skill variety, task identity,
task significance, autonomy, and feedback. Jobs that exhibit these job characteristics
provide individuals with the ability and incentive to bring more of themselves into their
work and ultimately be more engaged (Kahn, 1992).
Affective Commitment
Affective commitment parallels the conditions of engagement that Kahn (1990)
grounded in one’s sense of meaningfulness and safety within the workplace. Likened to
the definition of emotional engagement, affective commitment emphasizes the sense of
belonging and emotional bond that employees have to their jobs, the organization, or both
(Macey & Schneider, 2008; Rhoades, Eisenberger, & Armeli, 2001; Saks, 2006). Based
on an extensive review of the literature, Rhoades and Eisenberger (2002) posited that
affective commitment is strongly correlated with perceived organizational support (POS).
Perceived organizational support is the belief that an organization values employees’
contributions in the workplace and cares about their personal well being (Eisenberger,
Huntington, Hutchison, & Sowa, 1986). Rhoades and Eisenberger (2002) reviewed more
than 70 studies that included POS data and noted that those studies measuring POS and

MEASURING LEADER-LEVEL ENGAGEMENT
18
affective commitment had an average weighted correlation of r = .65, p < .001, indicating
that POS and affective commitment have a significantly strong, positive relationship.
Other researchers have also indicated that there is a reciprocal relationship
between affective commitment and POS (Eisenberger et al., 1986; Mowday, Porter, &
Steers, 1982). Thus, an employee’s affective commitment may be seen to increase the
indebtedness that he/she has prescribed to the perceived level of organizational support
received. In theoretical terms, the reciprocal relationship between POS and affective
commitment is grounded in social exchange theory (SET; Lee & Peccei, 2007). As Blau
(1964) described SET, the social exchanges within the workplace that go beyond the
contractual obligations of one’s job duties are associated with both the perceived level of
organizational support and perceived affective commitment, specifically as it relates to
one’s sense of meaningfulness and safety within an organization (Kahn, 1990).
Affectively committed employees exhibit a strong sense of belonging and
identification with their jobs and the organization, thus increasing their involvement in
organizational activities and the pursuit of organizational goals (Meyer & Allen, 1991;
Mowday et al., 1982). Maslach et al. (2001) posited that a strong affective commitment to
one’s workplace provides the same level of emotional fulfillment that employees
experience as a result of being engaged in their work roles; albeit theorizing that
employee engagement is the antithesis of burnout. Though there are similarities between
affective commitment and engagement, Shuck et al. (2017) argued that these constructs
are distinct, even if affective commitment and engagement occur simultaneously within
an individual. This is due in part to the association of affective commitment with social
exchange theory (SET), in that employees interacts in a reciprocal relationship with their

MEASURING LEADER-LEVEL ENGAGEMENT
19
employer, whereas engagement is focused on the individual’s cognitive, emotional, and
behavioral energies at play within their work (Shuck et al., 2017). Yet as with the
engagement construct, these studies on affective commitment focus attention at the
employee-level only, without mention of a leader’s own affective commitment within the
workplace.
Supervisor Support
Leader-member exchange (LMX) theory grew out of Blau’s (1964) research on
social exchange theory (SET). Graen (1976) developed LMX theory to focus exclusive
attention on the relationship formed between a supervisor and each of his/her
subordinates. By focusing emphasis on the unique relationships that supervisors develop
with each of their subordinates, LMX theory has become an important means to evaluate
the impact that supervisor-subordinate relationships have on organizational outcomes
(Graen, Novak, & Sommerkamp, 1982; Vecchio, Griffith, & Hom, 1986). Settoon,
Bennett, and Liden (1996) indicated that the quality of the LMX relationship is associated
with both “out of role” (e.g., organizational citizenship behavior) and “in role” behaviors,
the latter associated with engagement (Saks, 2006). Grounded in social constructionism
(Burr, 2003), perceived supervisor support is taken into account when employees are
asked to evaluate the quality of the LMX relationship from their perspective. This is
based on the assertion that one’s perceived reality about their relationship with their
supervisor is grounded in the social construction of what supervisor support means within
the employee’s society.
Though Batista-Taran, Shuck, Gutierrez, and Baralt (2009) argued that LMX
theory does not provide evidence for how leaders may positively influence employee
MEASURING LEADER-LEVEL ENGAGEMENT
20
engagement (due to the concern of in-group versus out-group dichotomization of
subordinates), Jordan and Troth (2011) argued that high quality LMX relationships have
a mediating effect on employee engagement as it relates to job satisfaction and turnover
intention.
This argument was based on Jordan and Troth’s (2011) research with a sample of
578 employees at an Australian pathology company indicating that emotional intelligence
dimensions of ‘own awareness’ and ‘own management’ were significantly and positively
correlated with job satisfaction (p < .0001) and negatively correlated with turnover
intentions (p < .0001). Furthermore, Breevaart, Bakker, Demerouti, and van den Heuvel
(2015) suggested that the relationship between LMX and work engagement had a
significant (p < .001) inter-correlation of r = .46.
Bernerth and Hirschfeld (2016) recognized that within the LMX literature the
wellbeing of the leader was largely overlooked. Their study identified that leader job
stress had a positive relationship with low average LMX (β = .35, p < .01; Bernerth &
Hirschfeld, 2016). Acknowledging this gap in the LMX literature further supports the
notion that not only employees but also leaders should be included when assessing one’s
own wellbeing.
Consequences of Engagement
Just as there are several antecedents to engagement, there are numerous
consequences related to an employee’s level of engagement (see Figure 2). These
consequences, referred to as organizational outcomes, are some of the most notable
relationships studied within engagement literature: organizational citizenship behavior
(OCB) (Rich et al., 2011; Saks, 2006), turnover intention (Harter et al., 2002), and job

MEASURING LEADER-LEVEL ENGAGEMENT
21
satisfaction (Maslach et al., 2001; Rich et al., 2010; Saks, 2006) (see Figure 2).
Organizational Citizenship Behaviors
Unlike the definition of engagement, organizational citizenship behaviors (OCBs)
are defined as the informal, “out of role” behaviors that help to facilitate organizational
functioning; engagement focuses on the “in role” behaviors demonstrated in the
performance of an employee’s formal job tasks (Organ, 1988; Organ & Ryan, 1995;
Saks, 2006). In line with Kahn’s (1990) theory of engagement, many OCB researchers
have focused on the influence of cognition and affect towards one’s work (Lee & Allen,
2002; Organ & Near, 1985; Weiss & Cropanzano, 1996). The researchers asserted that
affect enhances both helpful behaviors (i.e., OCB) and harmful behaviors in the
workplace (George & Brief, 1992; Isen & Baron, 1991; Weiss & Cropanzano, 1996).
An additional strand of OCB research centers on how the employees’ positive
behaviors influence employee performance evaluations. Since the positive behaviors are
defined as going “above and beyond” the formal job requirements, Allen and Rush
(2001) suggest that leaders may be perceiving those employees exhibiting OCB to have
higher commitment and loyalty to the organization. This misperception of an employee’s
OCB may exist even if these employees are not fully engaged in their specific, defined
work roles and responsibilities (Podsakoff, Whiting, Podsakoff, & Blume, 2009). Yet, as
with other organizational variables of interest in the literature, OCB has been studied at
the employee-level and seemingly ignores how a leader’s OCB may affect organizational
outcomes, such as profitability, productivity, and efficiency (Podsakoff et al., 2009).
Turnover Intention

MEASURING LEADER-LEVEL ENGAGEMENT
22
The business case for reducing turnover among employees is grounded in the
associated cost turnover has on organizations (Cascio, 2000; Halbesleben, 2010; Harter et
al., 2002; Schaufeli & Bakker, 2004). An employee’s intention to quit (turnover) may not
be associated only with employee engagement but also with job satisfaction (Tett &
Meyer, 1993), OCB (Chen, Hui, & Sego, 1998), and burnout (Maslach et al., 2001). In a
study by De Lange et al. (2008), low levels of engagement (R = .64), low job autonomy
(R = .77), and low departmental resources (R = .93) accurately predicted an employee’s
turnover (β = -.60).
Putting a monetary figure on the annual cost of turnover, reporters from Gallup
(McFeely & Wigert, 2019) estimated that U.S. businesses lose a trillion dollars every
year due to voluntary employee turnover based on their review of 2017 U.S. Bureau of
Labor Statistics and McFeely and Wigert’s (2019) estimated cost of replacing employees
in the workforce. This report further stated that in the three months before employees left,
52% of exiting employees stated that neither their direct supervisor nor any other leader
spoke with them about their job satisfaction or future with the organization (McFeely &
Wigert, 2019). Yet, it was not clear in the Gallup report by McFeely and Wigert (2019)
how this data regarding 52% of exiting employees was collected.
As noted with the other organizational outcome variables described, researchers
assessing the impact of turnover intention have focused exclusively on the employee. To
date, there are no specific delineations within reports such as the one from Gallup in
April 2019 (McFeely & Wigert, 2019) about the organizational costs when leaders quit.
In addition, the data on separations that are reported monthly by the U.S. Bureau of Labor
Statistics’ Job Openings and Labor Turnover Survey (JOLTS) do not indicate whether

MEASURING LEADER-LEVEL ENGAGEMENT
23
those who ‘quit’ (voluntary separation) hold a supervisory role within an organization.
This missing data provide additional evidence that leaders are not of focus when others
have assessed the impact of turnover on organizations.
Job Satisfaction
Job satisfaction is defined as the affective, emotional response to one’s job or to
the specific facets of the job (Locke, 1976). Based on extensive review of the literature,
researchers have indicated that one’s engagement has a positive, direct effect on one’s job
satisfaction (Maslach et al., 2001; Rich et al., 2010; Saks, 2006). Leadership style,
specifically transformation leadership, has also been shown to be highly predictive of
employee job satisfaction (β = .28, p < .01; Piccolo, Bono, Heinitz, Rowold, Duehr, &
Judge, 2012), with job satisfaction highly correlated to job performance (ρ = .30, p < .01;
Judge, Bono, Thoresen, & Patton, 2001). A critical relationship for organizations to be
aware as job performance is related to an organization’s financial bottom line.
As with engagement research, job satisfaction is studied primarily at the
employee-level though there are a growing number of publications on leader-level job
satisfaction. Of the few publications related to the leader’s level of job satisfaction, many
are found within healthcare management literature (Laschinger, Purdy, & Almost, 2007;
Pantouvakis & Mpogiatzidis, 2013) and international companies such as China, South
Africa, and Tunisia (Karmeni, Hamadi, Mesri, & Slim Ben Mimoun, 2017; Mayer,
Louw, & Baxter, 2015; Zhao, Zhang, Kraimer, & Yang, 2017). The deficiency in this
area of the literature provides additional support for this and future studies to focus
attention on leader-level organizational inputs and outcomes, from job satisfaction to
engagement.

MEASURING LEADER-LEVEL ENGAGEMENT
24
Engagement Measures
Though numerous researchers have supported the relationship between employee
engagement and organizational outcomes, the findings are not based on a single, agreed-
upon measure (Albrecht, 2010; Saks & Gruman, 2014; Shuck et al., 2017). In their
review of research on employee engagement, Saks and Gruman (2014) identified at least
seven different scales to measure engagement (see Table 1). Though the majority of
measures are grounded in Kahn’s (1990) engagement theory, research by Bailey et al.
(2017) indicated that the most widely utilized measure reported in the literature is
actually the Utrect Work Engagement Scale (UWES; Schaufeli et al., 2002). The UWES
is more similar to burnout theory (Maslach et al., 2001) than to Kahn’s (1990) conceptual
model of engagement. Each of the measures reviewed by Saks and Gruman (2014) were
analyzed for whether the measure should be included or excluded as the measurement
tool for the present study.
The researcher of the present study analyzed each of the seven measures and their
associated statistics as previously reviewed by Saks and Gruman (2014), including the
EES measure published by Shuck et al. in 2017. Following this section, Table 2 should be
referenced for ease of comparing each of the engagement measures based on published
statistical data related to the sample size and results, including reliability and model fit
indices.
Work and Family Engagement Scale
Rothbard (2001) developed a model to study engagement in relation to the
multiple roles that individuals have within both work and family units. Rothbard (2001)
argued that the effects of engaging in these multiple roles might cause either depletion or
MEASURING LEADER-LEVEL ENGAGEMENT
25
enrichment from work-to-family engagement or vice versa based on her review of the
literature. Though grounding her definition of engagement in the theoretical frame
provided by Kahn (1990), Rothbard (2001) created an engagement measure specifically
to measure the latent constructs of work and family engagement, with items further
grouped by either attention (cognitive availability) or absorption (intensity of one’s focus
on a role). Rothbard (2001) utilized 790 employees at a large, public university to test her
Work and Family Engagement Scale. Though this measure provides acceptable overall
model fitness based on review of indices provided in the study (χ2 = 795.14; df = 248; p
< 0.001; CFI = 0.93; RMSEA = 0.057), the scale was not selected for use in the present
study due to the specificity of the latent constructs (work, family engagement) that
Rothbard (2001) created the scale to measure.
May, Gilson, and Harter Engagement Scale
May et al. (2004) developed a 13-item measure to test several hypotheses related
to the psychological conditions associated with Kahn’s (1990) meaningfulness, safety,
and availability and engagement (cognitive, emotional, physical) within the workplace.
The primary purpose of May et al.’s (2004) study was to identify a model that would
better predict how and why some individuals come to psychologically identify with their
jobs, while others do not (May et al., 2004). May et al. (2004) tested their engagement
scale using employees from a large insurance firm in Midwestern (N = 199). Based on
revisions to their model, May et al. (2004) reported their 13-item scale to have a
reliability coefficient of α = 0.77. Additional model fit indices were not included in the
publication of their original study and thus could not be analyzed in the present study.

MEASURING LEADER-LEVEL ENGAGEMENT
26
Viljevac, Cooper-Thomas, and Saks (2012) tested the validity of this measure
with 139 call center employees at two finance organizations in Auckland, New Zealand,
but CFA results identified weak evidence (χ2 = 74.587, df = 41, p < 0.001, RMSEA =
0.077, CFI = 0.853, TLI = 0.764) for the three-factor engagement measure published by
May et al. (2004). Though the May et al. (2004) engagement scale is not widely used
throughout the engagement literature, the inconsistent results in these two
aforementioned studies provides further evidence to the debate on how to measure the
employee engagement construct within the literature and the concern with getting
inconsistent results.
Job and Organizational Engagement Scale
One of the more prolific researchers within the engagement literature, Saks (2006)
conducted a meta-analysis of the existing engagement literature and identified items
associated with either job or organizational engagement to study the antecedents and
consequences of employee engagement. At the time of his study, Saks (2006) noted the
limited research on employee engagement, providing the impetus for the development of
the items he utilized in his study. Based on social exchange theory (SET), Saks’ (2006)
study provided evidence of the importance of studying engagement within the literature
and justifying its relationship with many crucial organizational outcomes, such as job
satisfaction, organizational commitment, organizational citizenship behaviors (OCB), and
intention to quit.
The initial validation study of Saks’ (2006) Job and Organizational Engagement
Scale included 102 participants across a variety of industries in Toronto, Canada. Though
acceptable internal reliability (α) was achieved for this scale (five items associated with

MEASURING LEADER-LEVEL ENGAGEMENT
27
job engagement, α = 0.82; six items associated with organizational engagement, α =
0.90), this scale was not utilized in the present study since it does not explicitly measure
for the three dimensions of engagement: cognitive, emotional, and behavioral.
Job Engagement Scale
Rich, LePine, and Crawford (2010) developed the Job Engagement Scale (JES)
based on the argument that one’s engagement is directly linked to one’s job performance,
grounded in Kahn’s (1990) engagement theory. The items that Rich et al. (2010) included
in their study to measure engagement were based on a variety of constructs likened to the
dimensions of physical, emotional, and cognitive engagement. For physical, Rich et al.
(2010) modified items from a “work intensity” measure developed by Brown and Leigh
(1996). For emotional, they drew from items in Russell and Barrett’s (1999) research on
“core affect.” Finally, for cognitive, Rich et al. (2001) drew from the items in Rothbard’s
(2001) measure, including those identified as either attention (level of focus) or
absorption (level of intensity).
To test the JES, 245 full-time firefighters and their supervisors from four
municipalities were included in the study (Rich et al., 2010). It should be noted that
though supervisors were included, there was no explicit differentiation or discussion of
results related to those persons in a formal leadership role. Though this measure provides
acceptable model fitness (χ2 = 391.90, df = 132, p < 0.001, CFI = 0.97, SRMR = 0.05,
RMSEA = 0.09), this measure was not used for the present study in order to offer
consistency throughout this study by referring to the construct as employee
engagement—not job engagement, as this scale was termed.

MEASURING LEADER-LEVEL ENGAGEMENT
28
Intellectual, Social, Affective Engagement Scale
Soane, Truss, Alfes, Shantz, Rees, and Gatenbytt (2012) developed the
Intellectual, Social, Affective (ISA) Engagement Scale grounded in Kahn’s (1990)
engagement theory. Building from Kahn’s (1990) work, Soane et al. (2012) focused on
three facets of engagement: intellectual, social, and affective. Though there is notable
alignment with the focus of Kahn’s (1990) theoretical framework (affective and
emotional; intellectual and cognitive), the ISA was developed to capture what Soane et
al. (2012) identified an additional dimension to the construct, specifically social
engagement, which did not directly align with Kahn’s (1990) model of cognitive,
emotional, and physical engagement.
Soane et al. (2012) tested their nine-item, three-factor ISA Engagement Scale in
two waves. In Study 1, they included 278 manufacturing employees in the United
Kingdom (UK), and based on review of results (χ2 = 64, df = 24, p < 0.001, CFI = 0.98,
GFI = 0.95, SRMR = 0.04, RMSEA = 0.08), Soane et al. (2012) determined the ISA
Engagement Scale had acceptable model fit and proceeded to test the scale with another
sample to confirm internal reliability. Study 2 included 835 retail workers in the UK and
once again, they obtained acceptable model fit results (χ2 = 128, df = 24, p < 0.001, CFI =
0.98, GFI = 0.96, SRMR = 0.03 RMSEA = 0.07; α = 0.88). Though this measure has
acceptable model fitness across two validation studies by Soane et al. (2012), the three
dimensions of the scale were not explicitly in sync with Kahn’s dimensions of
engagement at the core of the present study: cognitive, emotional, and behavioral.

MEASURING LEADER-LEVEL ENGAGEMENT
29
Felt and Behavioral Engagement Scale
Stumpf, Tymon, and van Dam (2013) developed a two-dimensional measure to
assess engagement for persons working in technically oriented groups. Though the
underlying framework for their study is grounded in Kahn’s (1990) engagement research,
Stumpf et al. (2013) created their scale based on the research of Macey and Schneider
(2008), specifically regarding the feelings and behaviors that people exhibit when highly
engaged in their jobs.
Stumpf et al. (2013) tested their felt and behavioral engagement scale with 341
Canadian professional across 38 different work groups. The only results provided in
Stumpf et al. (2013) study indicated that the five-items associated with felt engagement
had internal reliability of α = 0.89, and that the nine-items associated with behavioral
engagement had internal reliability of α = 0.92. Though these results indicated strong
internal reliability of the items associated with these engagement factors, this scale was
not utilized in the present study because it only focuses on the emotional and behavioral
dimensions of engagement and did not explicitly include the cognitive dimension of
engagement.
Utrecht Work Engagement Scale
As described earlier, the Utrecht Work Engagement Scale (UWES) is grounded in
burnout theory (Maslach et al., 2001). The measure consists of 17 items, loading on three
factors: vigor, dedication, and absorption. In relation to Kahn’s (1990) dimensions of
engagement (cognitive, emotional, and physical), Schaufeli et al. (2002) determined that
vigor associates with the physical dimension, absorption with the cognitive, and
dedication with the emotional. The initial validation of the UWES was conducted with
MEASURING LEADER-LEVEL ENGAGEMENT
30
314 Spanish university students and 619 employees from 12 private and public Spanish
companies (total N = 1,033). Results indicated poor model fit based on review of model
fit indices (χ2 = 952.66, df = 232, p < 0.001, RMSEA = 0.05, NFI = 0.87, CFI = 0.90). In
addition, Viljevac et al. (2012) also indicated poor model fit of the UWES (χ2 = 257.784, df
= 132, p < 0.001, RMSEA = 0.083, CFI = 0.905, TLI = 0.878) in their study which included
139 call center employees at two financial organizations in Auckland, New Zealand.
Though there is a noted association between Schaufeli et al.’s (2002) research and
Kahn’s (1990) engagement theory, a review of the literature indicates that there is no
consensus on whether simply identifying as not having burnout in one’s work role is truly
the same as one being engaged in his/her job. Furthermore, studies by Crawford et al.
(2010) and Byrne, Peters, and Weston (2016) asserted that the UWES and MBI
constructs were not empirical opposites, as claimed in previous research (Maslach &
Leiter, 1997), based on their reviews of meta-analysis results that showed inconsistent
relationships when correlating job demands-resources (Demerouti, Bakker, de Jonge,
Janssen, & Schaufeli, 2001) to both burnout and engagement constructs. These
inconsistent results are further supported by the poor model fit data results from the
studies previously mentioned by Schaufeli et al. (2002) and Viljevac et al. (2012).
Employee Engagement Scale
Shuck et al. (2017) developed the Employee Engagement Scale (EES) in response
to the lack of a preferred measurement of employee engagement within the literature. As
noted by Saks and Gruman (2014), the multitude of measures assessing job engagement
(Rich et al., 2010; Saks 2006), work engagement (Schaufeli et al., 2002), organizational
engagement (Saks, 2006), or intellectual and/or social engagement (Soane et al., 2012) all

MEASURING LEADER-LEVEL ENGAGEMENT
31
fell short of fulfilling the need for an employee engagement measure grounded in Kahn’s
(1990) engagement research, focused specifically on the cognitive, emotional, and
behavioral energies at play. Based on the high reliability coefficients (Cronbach’s alpha)
of the survey items loading onto one of three factors (cognitive, emotional, behavioral)
and that the EES was grounded in Kahn’s (1990) engagement theory, the EES was
selected for use in the present study, with more in depth discussion of the EES
forthcoming in this chapter.
The information included in Table 2 highlights the discussion within the literature
regarding a lack of consistency in observed statistics when testing for measurement
validity. Because sample size is critical for factor analyses, Table 2 information further
emphasizes the need for adequate sample sizes when assessing engagement. Based on
Comrey and Lee’s (1992) rating scale of adequate sample sizes for factor analysis, the
cited studies in Table 2 had ‘poor’ (N = 102; Saks, 2006) and ‘fair’ (N = 213; May et al.,
2004) sample sizes. A detailed discussion on the model fit criterion (indices) used to
determine overall model goodness of fit is included in Chapter Three.
Table 2 Selected Engagement Measures and Results
Study Citation
Engagement Measurement
Sample Results
Shuck, Aldeson, and Reio (2017)
Employee Engagement Scale (EES)
Large, regional sampling of financial services employees across 16 independent work units; N = 1,067
χ2 = 459.89, df = 51, p < 0.001, CFI = 0.99, TLI = 0.99 Internal consistency reliability: cognitive α = 0.94, emotional α = 0.88, behavioral α = 0.91
Rothbard (2001)
Work and family engagement survey
Employees at a large, public university; N = 790
χ2 = 795.14; d f= 248; p < 0.001; CFI = 0.93; RMSEA = 0.057

MEASURING LEADER-LEVEL ENGAGEMENT
32
Table 2 (continued) Selected Engagement Measures and Results
Study Citation
Engagement Measurement
Sample Results
May, Gilson, and Harter (2004)
May et al. (2004) scale
Large insurance firm in Midwestern USA; N = 199
χ2 = 69.91, df = 25, p < 0.05 (revised model, three-factor model across 13-items); α = 0.77 (goodness of model fit indices were not included in the publication of the original study)
Saks (2006) Saks’ job and organizational engagement scale
Employees working across variety of jobs and organizations in Toronto, Canada; N = 102
Job engagement: PCA supported five-item scale (initially six-item scale); α = 0.82 Organizational engagement: PCA supported six-item scale; α = 0.90
Rich, LePine, and Crawford (2010)
Job Engagement Scale
Full-time firefighters and their supervisors, from four municipalities; N =245 (did not differentiate results of leaders included in this study)
χ2 = 391.90, df = 132, p < 0.001, CFI = 0.97, SRMR = 0.05, RMSEA = 0.09
Soane, Truss, Alfes, Shantz, Rees, and Gatenby (2012)
Intellectual, Social, Affective (ISA) Engagement Scale
Study 1: Manufacturing employees in UK; N = 278 Study 2: Retail workers in UK; N = 835
Study 1: χ2 = 64, df = 24, p < 0.001, CFI = 0.98, GFI = 0.95, SRMR = 0.04, RMSEA = 0.08 Study 2: χ2 = 128, df = 24, p < 0.001, CFI = 0.98, GFI = 0.96, SRMR = 0.03 RMSEA = 0.07; α = 0.88
Stumpf, Tymon, and van Dam (2013)
Stumpf et al. felt and behavioral engagement scale
Sample of Canadian professionals across 38 different work groups; N =341 (did not differentiate results of leaders included in this study)
Felt engagement: PCA supported five-item scale (initially six-item scale); α = 0.89 Behavioral engagement: PCA supported nine-item scale; α = 0.92
Schaufeli, Salanova, González-Romá, and Bakker (2002)
UWES (2002) Spanish university students (n =314); employees from 12 private and public Spanish companies (n =619); total N =1,033
χ2 = 952.66, df = 232, p ≤ 0.001, RMSEA = 0.05, NFI = 0.87, CFI = 0.90
Note. The engagement measures in this table were reviewed in depth in proceeding section of Chapter 2. Results provided in this table can be assessed based on criteria provided in Chapter 3.

MEASURING LEADER-LEVEL ENGAGEMENT
33
Selection of Employee Engagement Scale
The selection of the Employee Engagement Scale (EES; Shuck et al., 2017) for
utilization in the present study was based on two key parameters. First, it was a more
recently published engagement measure (published fall 2017). Second, Shuck et al.
(2017) described, in depth, the multiple models and steps taken to create and validate the
12-item EES measure grounded in Kahn’s (1990) engagement theory. It allowed the
author of this study to replicate the steps used, with the expectation to provide empirical
support for the use of the EES in future engagement literature. It should be noted that
Saks and Gruman’s (2014) review of the most widely cited engagement measures
purposefully excluded the commercially popular Gallup engagement survey (Harter et al.,
2002) because it measures management practices and not engagement. The 12 survey
items of the EES, categorized by the item’s factor association, can be found in Table 3.
Table 3
Employee Engagement Scale (EES; Shuck et al., 2017)
Items, by factor Cognitive
1. I am really focused when I am working. 2. I concentrate on my job when I am at work. 3. I give my job responsibility a lot of attention. 4. At work, I am focused on my job.
Emotional 5. Working at my current organization has a great deal of personal meaning to me. 6. I feel a strong sense of belonging to my job. 7. I believe in the mission and purpose of my company. 8. I care about the future of my company.
Behavioral 9. I really push myself to work beyond what is expected of me. 10. I am willing to put in extra effort without being asked. 11. I often go above what is expected of me to help my team be successful. 12. I work harder than expected to help my company be successful.
Note. 5-point Likert scale ranging from 1 (strongly disagree) to 5 (strongly agree).

MEASURING LEADER-LEVEL ENGAGEMENT
34
Study 1 of EES
Shuck et al. (2017) used a variety of employee samples to perform analysis to
determine the final 12-item, three-factor structure of the EES. Study 1 included 283
participants from a variety of industries, including service, manufacturing, professional,
and non-profit. Exploratory factor analysis (EFA) was performed on data from this
sample (N = 283), with the initial version of the EES that included 14 items. Issues were
noted with the items associated with the cognitive factor, with an average interim
correlation of .30; based on extensive research into the theoretical frame of the construct,
Shuck et al. (2017) identified seven new items for the cognitive factor, and tested it in
Study 2 of EES
Study 2 included the newly developed cognitive survey items and the EES tool
that now contained 17 items. Health care employees (N = 241) were included in this
second study and confirmatory factor analysis (CFA) was performed on the data. Based
on review of CFA results, Shuck et al. (2017) removed two items from the cognitive
factor, with a total of 15 items on the version of the EES that was used to Study 3.
Study 3 of EES
The goal of Study 3 was to reduce the EES from 15 to 12 items, with four items
loading onto one of three factors, cognitive, emotional, or behavioral. CFA was once
again performed on a sample of 1,067 employees from the financial services field.
Internal reliability of each factor (cognitive, emotional, behavioral) was assessed using
Cronbach’s alpha, with acceptable reliability at α ≥ .70 (Nunnally, 1978; Peterson, 1994).
The following sections detail the establishment of the items for each factor and its
associated reliability coefficient following the data analysis of Study 3.
MEASURING LEADER-LEVEL ENGAGEMENT
35
Cognitive Factor
During the initial development of the EES, Shuck et al. (2017) reported that in
Study 1 the initial reliability of the cognitive factor was significantly lower (α = .63) than
the reliability coefficients reported for the emotional factor (α = .89) and the behavioral
factor (α = .92), based on Shuck et al.’s (2017) selected threshold of α > .80 for reliability
values, recommended by Clark and Watson (1995). Shuck et al. (2017) noted that the
initial weak interitem correlations (r = .30) and unacceptable Cronbach’s alpha (α = .63)
within the cognitive factor might be associated with the complexity of measuring the
phenomenon of cognition due to the associated challenge of developing questions that are
cognitively grounded without the bias of affect (Nimon, Zigarmi, Houson, Witt, & Diehl,
2011). Shuck et al. (2017) had to develop new items for this factor of the EES due to the
weak internal consistency reliability and correlation coefficients that came out of the
initial development of the scale.
The cognitive factor was further refined through Study 2 and Study 3 conducted
by Shuck et al. (2017), resulting in the four-item factor on the present version of the EES.
Internal consistency reliability saw vast improvement in the final iteration of the survey
at α = .94, as compared to the factor’s initial reliability of α = .63. In addition, the
standardized regression weights across the items associated with the cognitive factor
ranged from .904 to .963, indicating that the items were ‘acceptable’ in measuring the
cognitive factor based on the recommendation of > .70 by Hair, Black, Babin, and
Anderson (2010).
Emotional Factor
Unlike the initial results associated with the cognitive factor, the five items
MEASURING LEADER-LEVEL ENGAGEMENT
36
associated with the emotional factor provided an initial reliability of α = .89 and a
correlation coefficient of r = .62 (Shuck et al., 2017). The emotional factor was further
refined through additional studies, resulting in the four-item factor on the present version
of the EES. Strong internal consistency reliability remained for the emotional factor in
the final iteration of survey at α = .88. Furthermore, the standardized regression weights
across the emotional factor ranged from .863 to .942 (> .70 recommended by Hair et al.,
2010).
Behavioral Factor
Likened to the initial results seen in the emotional factor, the five items associated
with the behavioral factor provided an initial reliability of α = .92 and a correlation
coefficient of r = .72 (Shuck et al., 2017). The behavioral factor was also further refined
through the additional studies conducted by Shuck et al. (2017), providing the four-item
factor on the present version of the EES. Strong internal consistency reliability remained
for the behavioral factor at α = .91 in the final iteration of the measure. In addition, the
standardized regression weights across the behavioral factor ranged from .868 to .973 (>
.70 recommended by Hair et al., 2010).
Conceptual Framework
Kahn’s Engagement Research
Kahn’s (1990) pre-eminent study of personal engagement and disengagement in
the workplace focused on exploring the specific conditions at work by which people
engaged and disengaged. Qualitative analysis based on in-depth interviews with two
different samples of employees (summer camp, n = 16; architectural firm, n = 16)
brought about the definition of “engagement as the harnessing of organization members’
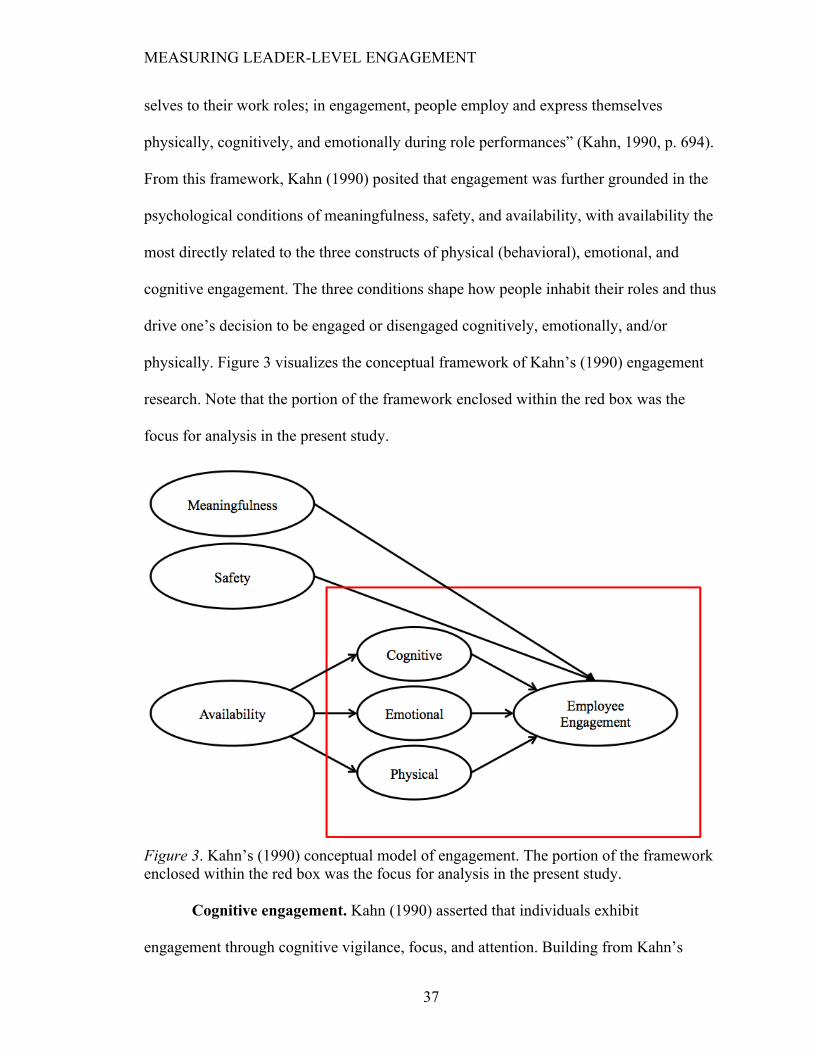
MEASURING LEADER-LEVEL ENGAGEMENT
37
selves to their work roles; in engagement, people employ and express themselves
physically, cognitively, and emotionally during role performances” (Kahn, 1990, p. 694).
From this framework, Kahn (1990) posited that engagement was further grounded in the
psychological conditions of meaningfulness, safety, and availability, with availability the
most directly related to the three constructs of physical (behavioral), emotional, and
cognitive engagement. The three conditions shape how people inhabit their roles and thus
drive one’s decision to be engaged or disengaged cognitively, emotionally, and/or
physically. Figure 3 visualizes the conceptual framework of Kahn’s (1990) engagement
research. Note that the portion of the framework enclosed within the red box was the
focus for analysis in the present study.
Figure 3. Kahn’s (1990) conceptual model of engagement. The portion of the framework enclosed within the red box was the focus for analysis in the present study.
Cognitive engagement. Kahn (1990) asserted that individuals exhibit
engagement through cognitive vigilance, focus, and attention. Building from Kahn’s
MEASURING LEADER-LEVEL ENGAGEMENT
38
(1990) work, Rich et al. (2010) reviewed the existing engagement literature and defined
this sub-dimension of engagement as the intensity of one’s mental energy towards
positive outcomes within the organization for which he/she works. The level of
engagement helps to direct an employee’s cognitive energy in both the direction and
volume of focus and attention on work-related tasks, experiences, and situations (Shuck
et al., 2017).
Emotional engagement. Employees who are engaged are emotionally connected
to the work tasks they perform and to those in the service of their work roles (Kahn,
1990). Rich et al. (2010) argued that the emotional energies employees exhibit are
synonymous with affective energies; the authors focused on this factor of engagement as
representative of one’s degree of enthusiasm, happiness, and optimism experienced in the
workplace (Bono, Foldes, Vinson, & Muros, 2007). Affective commitment and emotive
qualities help to stimulate an employee’s willingness to engage in behaviors that work
towards desired organizational outcomes, which in turn fulfills the meaningfulness and
safety that employees desire (Shuck & Wollard, 2010). Hence, Shuck, Reio, and Rocco
(2011) postulated affective commitment as an antecedent of engagement, suggesting that
affective commitment influences the development of one’s level of engagement within
the workplace based on their review of the engagement literature.
Behavioral engagement. Synonymous with physical engagement, behavioral
engagement is defined as the psychological state of intention to act in a manner that
positively impacts performance, specifically in the work setting (Macey & Schneider,
2008; Rich et al., 2010). Furthermore, since behavioral engagement is the intent to act but
not yet an action-related behavior, it is different from other constructs such as

MEASURING LEADER-LEVEL ENGAGEMENT
39
organizational citizenship behavior (OCB) and performance, as behaviorally engaged
employees can see themselves as willing to give more and willing to go above and
beyond the specifics of their job role (Macey & Schneider, 2008). Shuck et al. (2017)
further emphasized Macey and Schneider’s (2008) assertion that behavioral engagement
is a psychological state and that it should be evaluated differently that constructs that look
at how employees perform or physically manifest behaviors in the workplace (e.g.,
OCB).
Research Question
This study examined the following research question:
How well do the data collected from leaders replicate the three-factor structure identified
in the Employee Engagement Scale (EES) by Shuck, Adelson, and Reio (2017)?
Summary and Implications of Literature Review
A review of the literature has provided evidence that there is a lack of a preferred
tool for measuring employee engagement, as well as the gap in the literature related to
leader-level engagement. Though the majority of engagement measures are grounded in
Kahn’s (1990) engagement theory, researchers have been unable to yield consistently,
reliable and valid results for the most prolifically cited measures (Saks & Gruman, 2014).
Even though few studies have been published providing evidence for the financial impact
of leader disengagement on organizations (Adkins, 2015; Robinson, 2010), a gap remains
within the literature regarding measuring the impact leader engagement may have on
organizational outcomes. This study aimed to address both gaps in the literature,
specifically assessing if data collected from a sample of leaders could replicate the three-
factor structure of the EES identified by Shuck et al. (2017), grounded in Kahn’s (1990)

MEASURING LEADER-LEVEL ENGAGEMENT
40
engagement theory. The following chapter provides an overview of the methods used to
address the research question and hypotheses, including the research design, participants,
description of the measurement tool, data collection procedure, and plan for data analysis.
MEASURING LEADER-LEVEL ENGAGEMENT
41
CHAPTER 3: METHODS
This chapter described the design of the present study, specifically the selection of
second-order confirmatory factor analysis (CFA) to examine the research question and
hypotheses. This chapter also offered a review of participants and required sample size,
as well as a description of the Employee Engagement Scale (EES; Shuck et al., 2017) that
was used to measure for leader engagement, the data collection procedure, and the plan
for analyzing the data provided by formal leaders via CFA.
Research Question and Hypotheses
This study examined the following research question:
How well do the data collected from leaders replicate the three-factor structure identified
in the Employee Engagement Scale (EES) by Shuck, Adelson, and Reio (2017)?
To provide more precise examination of the research question, the following
hypotheses were tested:
H1. Responses to the Employee Engagement Scale (EES) can be explained by three first-
order factors (emotional, cognitive, and behavioral) and one second-order factor
(engagement).
Null H1. Responses to the Employee Engagement Scale (EES) cannot be explained by
three first-order factors (emotional, cognitive, and behavioral) and one second-order
factor (engagement).

MEASURING LEADER-LEVEL ENGAGEMENT
42
H2. Covariance among the three first-order factors is explained fully by their regression
on the second-order factor.
Null H2. Covariance among the three first-order factors cannot be explained fully by their
regression on the second-order factor.
H3. Data from leaders fits the structure model of the EES.
Null H3. Data from leaders do not fit the structure model of the EES.
Research Design
This study used a quantitative research design. The focus was on whether data
from self-identified, formal leaders could replicate the 12-item, three-factor structure of
the Employee Engagement Scale (EES; Shuck et al., 2017), grounded in Kahn’s (1990)
engagement theory. To evaluate the data from leaders in relation to replicating the EES
structure, a special case of structural equation modeling (SEM), confirmatory factor
analysis (CFA), was chosen as the data analysis tool. CFA provides a confirmatory rather
than exploratory approach to data analysis (Byrne, 2010), which was necessary in order
to examine the research question and hypotheses in this study related to confirming the
structure of the EES with a sample of formal leaders.
The data collected from formal leaders were examined using second-order CFA to
offer evidence for the validity of the 12-item EES tool, loading on three-factors
(cognitive, emotional, behavioral) in measuring leader engagement as the second-order
factor (see Figure 4). Informed by the few studies published by Gallup on leader
engagement (Adkins, 2015; Robinson, 2010), this study aspired to provide researchers
with a tool to measure leader engagement based analysis of CFA results.
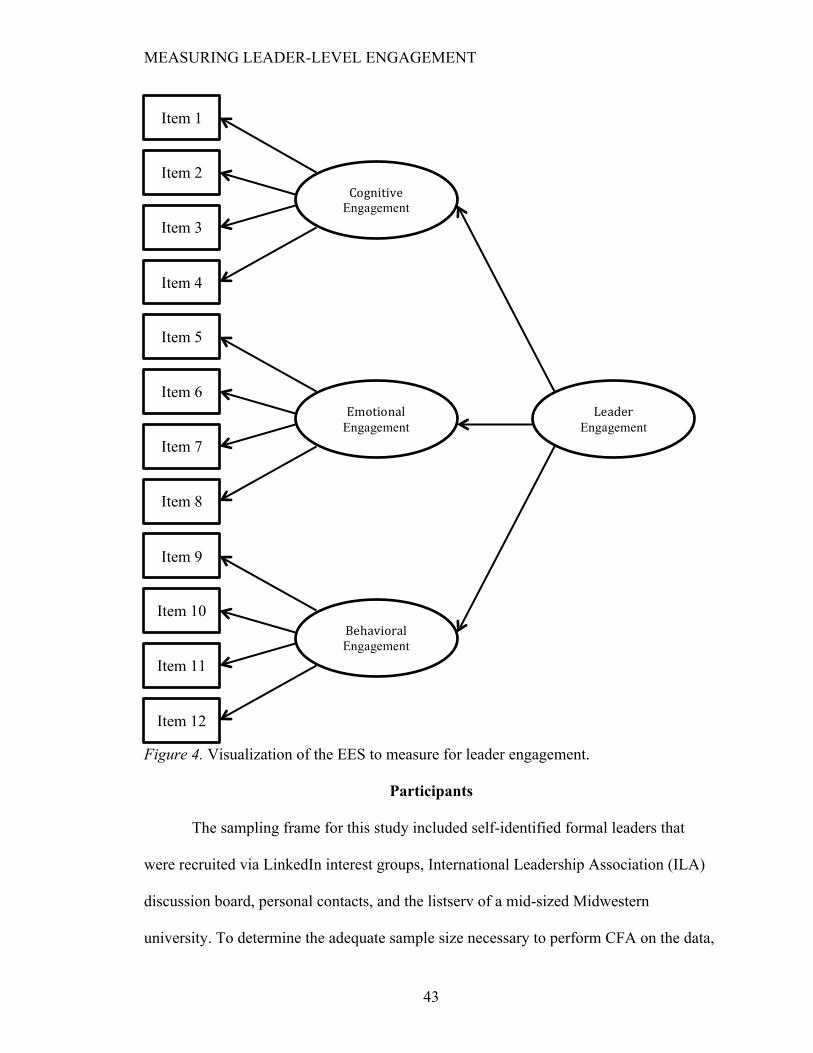
MEASURING LEADER-LEVEL ENGAGEMENT
43
Figure 4. Visualization of the EES to measure for leader engagement.
Participants
The sampling frame for this study included self-identified formal leaders that
were recruited via LinkedIn interest groups, International Leadership Association (ILA)
discussion board, personal contacts, and the listserv of a mid-sized Midwestern
university. To determine the adequate sample size necessary to perform CFA on the data,
Item 1
Item 2
Item 3
Item 4
Item 5
Item 6
Item 7
Item 8
Item 9
Item 10
Item 12
Item 11
CognitiveEngagement
EmotionalEngagement
BehavioralEngagement
LeaderEngagement

MEASURING LEADER-LEVEL ENGAGEMENT
44
the researcher of the present study followed guidelines from Gagné and Hancock (2006).
Based on these guidelines, the minimum sample size for the present study was calculated
by reviewing the ESS model, having three well-determined factors (3 parameters), with
four items loading on each factor (12 parameters), and each item having an associated
error (12 parameters). Thus, the number of model parameters (q) for the EES was 27.
Given that the ratio of N to the number of model parameters (q) should be greater than 5,
this study had to attain a valid N =135 for adequate sample size (Gagné & Hancock,
2006).
Instrumentation
The EES (Shuck et al., 2017) was utilized to assess employee engagement (see
Appendix A). The EES consists of 12 items, equally distributed across the three factors
(emotional, behavioral, cognitive) of Kahn’s (1990) engagement theory, with an internal
consistency reliability of α = .88 for emotional engagement, α = .91 for behavioral
(physical) engagement, and α = .94 for cognitive engagement (Shuck et al., 2017). The
measure utilizes a 5-point Likert scale (1 = strongly disagree, 2 = disagree, 3 = neutral, 4
= agree, 5 = strongly agree). Within the survey, the term ‘focused’ was defined as the
direction of attention or efforts, and the term ‘expected’ was defined as fulfilling the
requirements of my work role. Permission to use the measure was provided by the
authors in their publication of the scale (Shuck et al., 2017; see Appendix B).
Order of Survey Items
Researchers (Oldendick, 2008; Schuman, Kalton, & Ludwig, 1983) have
indicated that, “the order in which questions are asked in a questionnaire can have a
significant effect on the results. Preceding questions provide the context in which the

MEASURING LEADER-LEVEL ENGAGEMENT
45
respondent answers an item, and changing this context can make a large difference in the
survey results” (Oldendick, 2008, p. 2). Shuck et al. (2017) grouped the four questions
that loaded on the cognitive engagement factor together, followed by the four questions
that loaded on emotional engagement factor, and ending with the last four questions in
the EES loading on behavioral engagement factor. To address this potential bias of
preceding questions informing participant responses, the questions were not grouped by
factors in the present study (see Table 4). Note that the previous versions of the
visualized model presented in this study (see Figure 4) indicated the order of questions
based on the original sequence described by Shuck et al. (2017).
Table 4
Revised Order of Questions Provided to Participants in this Study
Items, by construct Reordered Item
Cognitive 1. I am really focused when I am working. Q1 2. I concentrate on my job when I am at work. Q4 3. I give my job responsibility a lot of attention. Q7 4. At work, I am focused on my job. Q10
Emotional 5. Working at my current organization has a great deal of personal meaning to me.
Q2
6. I feel a strong sense of belonging to my job. Q5 7. I believe in the mission and purpose of my company. Q8 8. I care about the future of my company. Q11
Behavioral 9. I really push myself to work beyond what is expected of me. Q3 10. I am willing to put in extra effort without being asked. Q6 11. I often go above what is expected of me to help my team be successful.
Q9
12. I work harder than expected to help my company be successful. Q12 Note. 5-point Likert scale ranging from 1 (strongly disagree) to 5 (strongly agree). Reordered item numbering is associated with the structural models and results in the proceeding chapters.
MEASURING LEADER-LEVEL ENGAGEMENT
46
Though evidence exists that the order of survey items can impact results
(Oldendick, 2008; Schuman et al., 1983), there are no technical procedures for
eliminating the effects of question order, such as how specifically to reorder or rearrange
the order of questions.
Data Collection
The population of interest for this study was formal leaders within organizations,
across all levels of management. The researcher obtained institutional review board (IRB)
exempted status for this study in July 2017 (see Appendix C). A statement denoting
consent to participant in the study was included on the electronic version of the survey
via Qualtrics. Thus, participants indicated their consent to participate in this study by
nature of completing the survey.
Data collection occurred in two stages. The first stage included recruitment of
participants from the LinkedIn groups’ message boards (July through August 2017). Due
to very low initial participation via LinkedIn, the second stage of data collection occurred
from late July through November 2017, recruiting participants via the International
Leadership Association (ILA) discussion board, personal contacts, and the listserv of a
mid-sized Midwestern university with a link via the survey software system, Qualtrics.
Participants were asked to complete the 12-item EES (see Appendix A).
Targeted sampling method was employed for this research. Initially, only specific
LinkedIn interest groups were targeted for inclusion in this study because the persons
involved in these groups self-reported to be active leaders interested in leadership
networking, research, and data (Watters & Biernacki, 1989). This is a type of
nonprobability sampling where members of the target population that meet certain

MEASURING LEADER-LEVEL ENGAGEMENT
47
practical criteria (Saumure & Given, 2008). In this case, all those targeted self-reported
that they met the criteria of having experience in formal leadership positions (supervisors
or managers). With that, LinkedIn was chosen as the primary sampling population
because “[it] is a platform that connects professionals in various fields and, therefore,
provides greater ability to target data collection to an appropriate social network” (Dusek,
Yurova, & Ruppel, 2015, p. 282). Though others have found that recruitment through
LinkedIn can dramatically increase the potential pool of respondents based on the ease of
access to the populations using the social media platform (Dicce & Ewers, 2019), that
was not the case in the present study.
Data Analysis
Since the EES measure had strong validity and reliability based on initial reports
from Shuck et al. (2017), a special case of structural equation modeling (SEM),
confirmatory factor analysis (CFA), was employed in the present study as it takes a
confirmatory rather than exploratory approach to data analysis (Byrne, 2010). SEM
provided the statistical methodology to confirm the structural theory of the EES (Byrne,
2010). The use of SEM elicits: “(a) that the causal processes under study can be
represented by a series of structural (i.e., regression) equations, and (b) that these
structural relations can be modeled pictorially to enable a clearer conceptualization of the
theory under study” (Byrne, 2010, p. 3). Furthermore, CFA is a technique that “analyzes
a priori measurement models in which both the number of factors and their
correspondence with the indicators are explicitly specified” (Kline, 2011, p. 112).
Shuck et al. (2017) provided a detailed description of how the EES was
developed, including its content validity, results of exploratory factor analysis (EFA), and

MEASURING LEADER-LEVEL ENGAGEMENT
48
the multiple iterations of CFA resulting in a 12-item measure loading on three factors.
These descriptive results provided the basis to test against using the EES leader-level
engagement model. The structural model for the ESS (see Figure 4) was constructed
based on the author of study’s interpretation of Shuck et al.’s (2017) work. Since the
specification of the factors was already well established by Shuck et al. (2017), only CFA
was used in this study to test the EES model with data from a sample of leaders.
Second-order CFA was used to test the hypotheses using IBM SPSS AMOS
Version 25 software. First, the factorial structure adapted from Shuck et al.’s (2017)
research was run through SPSS AMOS to produce a preliminary model output summary
(see Figure 5). Next, the structural model was conducted, producing a goodness-of-fit
summary that was evaluated against model fit criterion (indices). Model fit assessment is
fully discussed in Chapter 4. The goodness-of-fit summary produced in this study was
compared against the statistics provided by Shuck et al. (2017) for the initial validation of
the EES.
Model Fit Criteria
Though Barrett (2007) argued that Chi-Square is the only substantive test of fit
for SEM, specifically CFA in this study, additional model fit indices were selected for
inclusion in the analysis of the data for this study. A decision about overall model
goodness-of-fit cannot be made based on a single model fit index. This is due to the
complexity of SEM, due to the multiple regressions and associations between the factors
and variables that are accounted for in the analysis. Hu and Bentler (1999) suggest
including standardized root mean square residual (SRMR), Tucker Lewis Index (TLI),
root mean square error of approximation (RMSEA), and Comparative Fit Index (CFI).

MEASURING LEADER-LEVEL ENGAGEMENT
49
Figure 5. Structural model of the EES measuring for leader engagement.
McDonald and Ho (2002) also suggest reporting Goodness-of-Fit (GFI) and Normed Fit
Index (NFI), in addition to CFI and TLI, when analyzing CFA results.
Thus, based on these recommendations, two indices across each classification of
fit were included in this study to balance the interpretation of the CFA results. Those
specific model fit criteria included were Chi-Square; absolute fit indices, specifically GFI
and SRMR; relative fit indices, specifically NFI and TLI; and noncentrality-based
indices, specifically RMSEA and CFI (see Table 5). Parsimony fit indices were not
Behavioral
Item 9 e9 1
Item 10 e10 1
Item 11 e11 1
Item 12 e12 1
1
1
Emotional
Item 5 e5 1
Item 6 e6 1
Item 7 e7 1
Item 8 e8 1
1
Leader Engagement
1
Cognitive
Item 1 e1 1
Item 2 e2 1
Item 3 e3 1
Item 4 e4 1
1
res1
res3
1
1res2

MEASURING LEADER-LEVEL ENGAGEMENT
50
included in the present study because, as noted by Hooper, Coughlan, and Mullen (2008),
no recommended threshold levels for these indices have been published, thus making
them more difficult to interpret.
Table 5 Cutoff Criteria Guidelines for Model Fit
Test statistic/ index
Cutoff criteria
df > 0 χ2 ≤ df p > .05 GFI ≥ .90 NFI ≥ .90 CFI ≥ .93 TLI ≥ .95 RMSEA ≤ .08 SRMR ≤ .08 Note. df = degrees of freedom; χ2 = chi-square; GFI = Goodness of Fit Index; NFI = Normed Fit Index; CFI = Comparative Fit Index; TLI = Tucker Lewis Index; RMSEA = Root Mean Square Error of Approximation; SRMR = Standardized Root Mean Square Residual
The Chi-Square value (χ2) is the traditional index for evaluating overall model fit
as it “assesses the magnitude of discrepancy between the sample and fitted covariances
matrices” (Hu & Bentler, 1999, p. 2). An acceptable model fit would provide an
insignificant result at a 0.05 level (p > .05; Barrett, 2007), thus the Chi-Square statistic is
often referred to as a “badness of fit” (Kline, 2005).
Absolute fit indices (GFI and SRMR) compare the specified model to no model at
all (Byrne, 2010; Hu & Bentler, 1995). Higher values for the GFI indicate a better fit,
with ≥ .90 as the ideal cutoff (Hooper et al., 2008). SRMR is based upon the observed
and predicted covariances (Kline, 2011), with a value of ≤ .08 generally considered a
good fit (Hu & Bentler, 1999).
MEASURING LEADER-LEVEL ENGAGEMENT
51
Relative fit indices (NFI and TLI) test the hypothesized model against the null, or
independence model, using ratios of the hypothesized model χ2 and the null χ2, taking
into account the degrees of freedom for both models (Bentler & Bonett, 1980). Preferred
cutoff for NFI is ≥ .90 (Byrne, 1994) and the cutoff for TLI is ≥ .95 (Hu & Bentler,
1999).
Noncentrality-based indices (RMSEA and CFI) are based on the assertion that
structural modeling is hoping to not reject the null hypothesis and instead to reject the
alternative hypothesis, thus requires decisions to be made using the noncentral χ2
distribution (Steiger, Shapiro, & Brown, 1985). RMSEA cutoff of ≤ .08 is ideal
(MacCallum, Browne, & Sugawara, 1996), with ≥ .93 as the cutoff for CFI (Byrne,
1994).
In addition, standardized regression weights were examined to determine an
item’s factor loadings, inter-factor associations, and error variances. Hair, Black, Babin,
and Anderson (2010) indicated that standardized regression weights greater than .50 are
acceptable, with weights greater than .70 to be ideal in assessing factor loadings.
Maximum likelihood (ML) estimates were also analyzed to determine the likelihood that
the data were drawn from the population (Kline, 2011). Cronbach’s alpha was also
calculated to determine the reliability coefficients of the three first-order factors
(cognitive, emotional, behavioral). The model fit indices, regression weights, and
reliability coefficients were analyzed to provide evidence to reject or retain the null
hypotheses in this study.

MEASURING LEADER-LEVEL ENGAGEMENT
52
Summary of Methods
Once IRB approval was obtained in July 2017, formal leaders (supervisors or
managers) were recruited over a five-month period (July-November 2017) via LinkedIn,
International Leadership Association (ILA) discussion board, personal contacts, and the
listserv of a mid-sized Midwestern university.
A special case of structural equation modeling (SEM), confirmatory factor
analysis (CFA) was employed in the present study as it provided the statistical
methodology to confirm the structural theory of the EES. Select model fit indices,
regression weights, and reliability coefficients were identified as the standards to
determine if the data from a sample of formal leaders could replicate the three-factor
structure of the EES. The next chapter will include testing the data for assumptions prior
to running CFA. Results of the study will be analyzed to address the research question
and hypotheses; specifically based on model fit indices, regression weights, reliability
coefficients, and modification indices.

MEASURING LEADER-LEVEL ENGAGEMENT
53
CHAPTER 4: RESULTS
The purpose of this study was to determine if data collected from a sample of
leaders could replicate the three-factor structure of the Employee Engagement Scale
(EES; Shuck et al., 2017), grounded in Kahn’s (1990) engagement theory. To test the
hypotheses in this study, a structural model was developed for this study (see Figure 5).
This chapter provided analysis of the second-order confirmatory factor analysis (CFA)
results to address the research question and hypotheses that guided this study.
Research Question and Hypotheses
This study examined the following research question:
How well do the data collected from leaders replicate the three-factor structure identified
in the Employee Engagement Scale (EES) by Shuck, Adelson, and Reio (2017)?
To provide more precise examination of the research question, the following
hypotheses were tested:
H1. Responses to the Employee Engagement Scale (EES) can be explained by three first-
order factors (emotional, cognitive, and behavioral) and one second-order factor
(engagement).
Null H1. Responses to the Employee Engagement Scale (EES) cannot be explained by
three first-order factors (emotional, cognitive, and behavioral) and one second-order
factor (engagement).

MEASURING LEADER-LEVEL ENGAGEMENT
54
H2. Covariance among the three first-order factors is explained fully by their regression
on the second-order factor.
Null H2. Covariance among the three first-order factors cannot be explained fully by their
regression on the second-order factor.
H3. Data from leaders fits the structure model of the EES.
Null H3. Data from leaders do not fit the structure model of the EES.
Table 6 LinkedIn Groups, Sample Distribution Count of
participants (n)
Percentage of participants
(%)
Collection Period
LinkedIn group name
Linked:HR 2 1.3 July-August 2017 Employee Communications, Engagement,
and Experience 1 0.6
Educational Leadership 1 0.6
Leadership & Organizational Development
2 1.3
ILA Women and Leadership Affinity Group (WLAG)
2 1.3
Leader Campus 2 1.3
LinkedIn: Dayton 16 10.1
University listserv 79 49.7 July-November 2017
International Leadership Association (ILA) Discussion Board
29 18.2 July-September 2017
Personal contacts of the researcher 25 15.7 July-August 2017
Note. N =159

MEASURING LEADER-LEVEL ENGAGEMENT
55
Data Collection
Data were collected from participants via LinkedIn groups beginning in July
2017. Due to the very low response rates in the first weeks of data collection (see Table
6), it was determined that additional populations would need to be included in this study
in order to reach the sample size minimum of N =135. The listserv of a mid-sized
Midwestern university, the International Leadership Association (ILA) discussion board,
and personal contact of the researcher were included in the sampling for this dissertation.
At the conclusion of the data collection period in November 2017, a total of 159 self-
identified leaders had voluntarily completed the EES measure. Based on distribution of
the sample of leaders included in this dissertation, nearly 50% of participants were
recruited from the university.
Testing for Assumptions
Prior to testing the hypothesized model with confirmatory factor analysis (CFA),
the data were screened for the necessary assumptions of sample size, missing data,
multivariate outliers, normality, and multicollinearity (Kline, 2011). To test the
hypothesized model (see Figure 4) based on the research published by Shuck et al.
(2017), a structural model was developed (see Figure 5). This hypothesized structural
model was then analyzed using structural equation modeling (SEM) with IBM SPSS
AMOS Version 25 software. CFA, a specific application of SEM, was used to investigate
the replication of the three-factor structure of the EES (Shuck et al., 2017) with a sample
of leaders. The structural model includes a measurement error for each of the items in the
EES scale (see Figure 5).

MEASURING LEADER-LEVEL ENGAGEMENT
56
Participants
The initial sample size of this study was 159 formal leaders. Descriptive statistics
were run to review the overall data, including the valid N for each survey item, as well as
Skewness and kurtosis (see Table 7). To ensure the sample size was sufficient for
continuing with this study, communalities were examined. To assess adequacy of sample
size, all communalities were acceptable at greater than .60, with survey item 2 (.581)
approaching the cutoff threshold of .60 (MacCallum, Widaman, Zhang, & Hong, 1999;
see Table 8); indicating that the intended sample size for this study was adequate in
identifying the percentage of variance in a given factor (emotional, cognitive, behavioral)
explained by all factors together (MacCallum et al., 1999).
Table 7 Descriptive Statistics of the Initial Sample
Survey Item N M S.D. Skewness Kurtosis
1 158 4.19 0.815 -1.507 3.648 2 158 3.99 1.006 -1.127 1.036 3 159 4.49 0.778 -2.170 6.394 4 159 4.10 1.008 -1.370 1.613 5 159 4.55 0.727 -2.272 7.147 6 159 4.16 0.725 -1.258 3.830 7 159 4.33 0.807 -1.542 3.281 8 159 4.47 0.701 -1.944 6.599 9 158 4.44 0.802 -2.025 5.483 10 158 4.18 0.730 -1.294 3.866 11 159 4.23 0.980 -1.612 2.690 12 157 4.34 0.822 -1.627 3.745 Note. S.D. = standard deviation
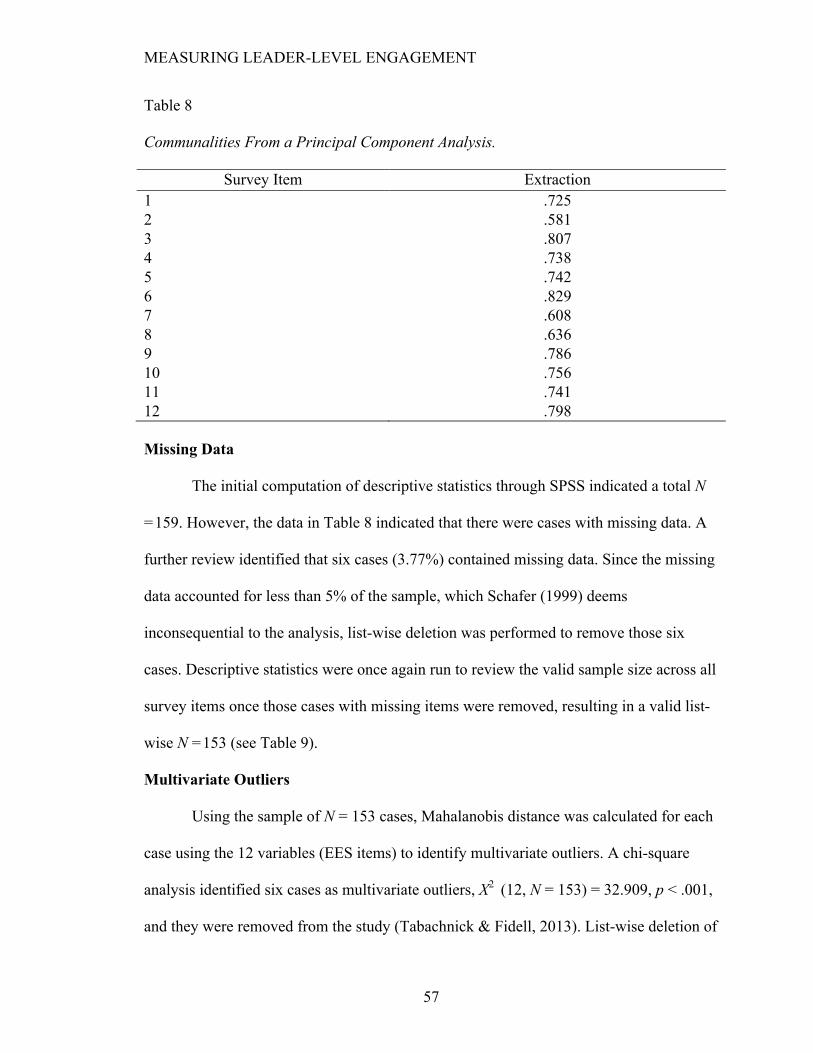
MEASURING LEADER-LEVEL ENGAGEMENT
57
Table 8
Communalities From a Principal Component Analysis.
Survey Item Extraction 1 .725 2 .581 3 .807 4 .738 5 .742 6 .829 7 .608 8 .636 9 .786 10 .756 11 .741 12 .798 Missing Data
The initial computation of descriptive statistics through SPSS indicated a total N
=159. However, the data in Table 8 indicated that there were cases with missing data. A
further review identified that six cases (3.77%) contained missing data. Since the missing
data accounted for less than 5% of the sample, which Schafer (1999) deems
inconsequential to the analysis, list-wise deletion was performed to remove those six
cases. Descriptive statistics were once again run to review the valid sample size across all
survey items once those cases with missing items were removed, resulting in a valid list-
wise N =153 (see Table 9).
Multivariate Outliers
Using the sample of N = 153 cases, Mahalanobis distance was calculated for each
case using the 12 variables (EES items) to identify multivariate outliers. A chi-square
analysis identified six cases as multivariate outliers, X2 (12, N = 153) = 32.909, p < .001,
and they were removed from the study (Tabachnick & Fidell, 2013). List-wise deletion of

MEASURING LEADER-LEVEL ENGAGEMENT
58
the multivariate outliers reduced the sample size to N = 147, which still satisfies the
minimum required sample size of 135. Following the removal of multivariate outliers,
descriptive statistics were run once again through IBM SPSS (see Table 10).
Table 9
Descriptive Statistics of Sample After Removing Missing Data
Survey Item M S.D. Skewness Kurtosis
1 4.20 0.798 -1.564 4.164 2 4.0 0.987 -1.082 0.954 3 4.48 0.787 -2.138 6.193 4 4.10 1.005 -1.381 1.693 5 4.53 0.735 -2.218 6.851 6 4.16 0.727 -1.292 3.982 7 4.31 0.813 -1.513 3.175 8 4.44 0.706 -1.903 6.435 9 4.45 0.802 -2.083 5.761 10 4.18 0.727 -1.327 4.105 11 4.25 0.948 -1.645 2.973 12 4.35 0.822 -1.658 3.906 Note. N = 153; S.D. = standard deviation
Table 10
Descriptive Statistics of Final Sample Excluding Outliers
Survey Item M S.D. Skewness Kurtosis
1 4.29 0.633 -0.657 1.036 2 4.07 0.869 -0.782 0.063 3 4.54 0.655 -1.700 4.868 4 4.17 0.902 -1.309 1.774 5 4.6 0.569 -1.299 1.967 6 4.21 0.599 -0.308 0.518 7 4.39 0.668 -0.935 0.917 8 4.50 0.578 -0.850 0.962 9 4.52 0.645 -1.307 1.912 10 4.23 0.598 -0.325 0.524 11 4.29 0.884 -1.561 2.913 12 4.41 0.701 -1.266 2.702 Note. N = 147; S.D. = standard deviation

MEASURING LEADER-LEVEL ENGAGEMENT
59
Normality
Normality was evaluated through review of the skewness and kurtosis values
reported for the 12 items of the EES once outliers were removed (see Table 10). Gao,
Mokhtarian, and Johnston (2008) indicated that absolute values of skewness greater than
1.96 indicate nonnormality. Kline (2005) indicated that the absolute values of kurtosis
greater than 7.0 are problematic. Upon review of the descriptive statistics in Table 11, no
variables were outside of the limits set for skewness, absolute values ±1.96 (Gao et al.,
2008) or kurtosis, absolute values ±7.0 (Kline, 2005).
Table 11 Summary of Collinearity Statistics
Survey Item
Tolerance VIF
1 .447 2.236 2 .415 2.412 3 .507 1.973 4 .396 2.525 5 .559 1.789 6 .403 2.479 7 .461 2.168 8 .463 2.160 9 .332 3.016 10 .301 3.324 11 .384 2.605 12 .298 3.353 Note. N = 147
Multicollinearity
The final test for assumptions was performed to determine if any multicollinearity
was present among the 12 items of the EES. Multicollinearity is a state of high
intercorrelations among the variables; in this case the survey items of the EES. Two
multicollinearity statistics were reviewed, tolerance and variance inflation factor (VIF)

MEASURING LEADER-LEVEL ENGAGEMENT
60
values. Kline (2011) suggested that tolerance values < 0.1 and VIF values > 10.0 indicate
that multicollinearity exists. Upon review of the tolerance values and VIF for the data in
this study (see Table 11), no issues of multicollinearity were present.
Confirmatory Factor Analysis
Following the cleaning of the data resulting in the final sample size of N = 147 for
inclusion in this study, confirmatory factor analysis (CFA) via IBM SPSS AMOS
Version 25 software was performed on the data. In order to answer the research question
and hypotheses, the researcher of the present study had to interpret and recreate the
factorial structure of the EES from the original study by Shuck et al. (2017) in order to
perform CFA (see Figure 6).
Based on review of Byrne’s (2010) procedure for second-order CFA, one item
from each of the first-order factors (cognitive, emotional, behavioral) is selected as a
marker variable and its loading is fixed to 1. In the present study, the SPSS AMOS
software identified Q10, Q11, and Q12 to be fixed at 1 for their respective factors (see
Figure 6). Those items fixed to 1 impacted the review of maximum likelihood (ML)
estimates in determining the values for the parameters of a model, such to maximize the
likelihood that the process described by the model actually fit with the data collected
from formal leaders.
Just-Identified Model
Upon review of Byrne’s (2010) discussion of ‘just-identified’ models, which are
defined as models with the number of free parameters exactly equal to the number of
known values and having zero degrees of freedom, the second-order structure that was
initially built in SPSS AMOS was in fact ‘just-identified’ (see Figure 6). It was necessary

MEASURING LEADER-LEVEL ENGAGEMENT
61
to correct for ‘just-identification’ as one of the primary aims of SEM “is to specify a
model and such that it meets the criterion of overidentification (Byrne, 2010, p. 34)” in
order to allow for rejection of the model.
Figure 6. Structural model of the EES to measure for leader engagement, just-identified.
As described by Byrne (2010), “with three first-order factors, we have six
([3x4]/2) pieces of information; the number of estimate parameters is also six (three
factor loadings; three residuals), thereby resulting in a just-identified model” (p. 132).
Thus, the critical ratio difference (CRDIFF) method was utilized to produce “a listing of
critical ratios for the pairwise differences among all parameter estimates (p. 133),”
specifically seeking out values related to the residuals (Byrne, 2010).

MEASURING LEADER-LEVEL ENGAGEMENT
62
Table 12
Critical Ratio Differences between Parameters in the Preliminary Model
Variable Estimate SE CR P Parameter Label Engagement 1.000 res1 .134 .032 4.168 *** par_13 res2 .174 .036 4.799 *** par_14 res3 .077 .051 1.511 .131 par_15 err4 .078 .017 4.547 *** par_16 err3 .225 .028 8.036 *** par_17 err2 .117 .019 6.169 *** par_18 err1 .167 .024 6.997 *** par_19 err8 .122 .023 5.350 *** par_20 err7 .334 .049 6.794 *** par_21 err6 .464 .060 7.750 *** par_22 err5 .270 .046 5.848 *** par_23 err12 .094 .020 4.669 *** par_24 err11 .118 .020 6.053 *** par_25 err10 .135 .019 7.287 *** par_26 err9 .248 .032 7.845 *** par_27 Note. N = 147; SE=standard error; CR=critical ratio *** p < .001
Based on review of the critical ratio (CR) differences between parameters (see
Table 12), constraints were placed on the first-order constructs of Emotional and
Behavioral (as these two factors had differing critical ratio values of 4.799 and 1.511 for
their associated residuals, respectively). The constraints were noted by replacing the
residuals on the Emotional and Behavioral factors with ‘var_a’ as seen in Figure 7. By
constraining the residuals on both the Emotional and Behavioral factors to be the same, a
degrees of freedom value greater than 0 was achieved for the model. With the revised
model respecified (see Figure 7) to address the just-identification issue present in the
upper level of the original model (see Figure 6), analysis could now be performed via
IBM SPSS AMOS Version 25 software to provide model goodness of fit indices.

MEASURING LEADER-LEVEL ENGAGEMENT
63
Figure 7. Structural model of the EES to measure for leader engagement, with the residual variances constrained for Emotional and Behavioral factors, indicated by ‘var_a’ labels. Model Goodness of Fit
The structural, second-order model in Figure 7 with factorial constraints was run
through IBM SPSS AMOS Version 25 software. The results of the CFA produced
goodness-of-fit indices. The data provided in these outputs was evaluated to determine if
the research question and reject the null hypotheses in this study could be addressed.
In order to address the research question and reject the null hypotheses, the
following assumptions had to be met:
1. Model goodness-of-fit indices ‘fit’ reputable cutoffs

MEASURING LEADER-LEVEL ENGAGEMENT
64
2. A comparison of the hypothesized model’s goodness-of-fit indices should be
comparable to the results produced by Shuck et al. (2017) on the EES
As stated in chapter three, Shuck et al. (2017) produced the following CFA results
with a sample of 1,067 employees: χ2 = 459.89, df = 51, p < 0.001, CFI = 0.99, TLI =
0.99. It should be noted that CFI and TLI were the only model goodness of fit indices
provided in the Shuck et al. (2017) publication. The internal reliability of the three factors
of the EES, measured by Cronbach’s alpha, was: α = .94 for items associated with the
Cognitive factor; α = .88 for the Emotional factor; and α = .91 for the Behavioral factor
(Shuck et al., 2017).
Table 13
Summary of Cutoff Criterion and Obtained Statistics Used to Assess Model Fit
Test statistic/ index
Cutoff criteria Obtained statistic
df > 0 52 χ2 ≤ df 155.594 p > .05 .000 GFI ≥ .90 .846 NFI ≥ .90 .853 CFI ≥ .93 .896 TLI ≥ .95 .867 RMSEA ≤ .08 .117 SRMR ≤ .08 .107 Note. N = 147; df = degrees of freedom; χ2 = chi-square; GFI = Goodness of Fit Index; NFI = Normed Fit Index; CFI = Comparative Fit Index; TLI = Tucker Lewis Index; RMSEA = Root Mean Square Error of Approximation; SRMR = Standardized Root Mean Square Residual
Table 13 displays several goodness-of-fit outputs that were produced using IBM
SPSS AMOS Version 25 software. It should be noted that one might assume that the
degrees of freedom (df) from the original study by Shuck et al. (df = 51) and the present
study (df = 52) should be nearly identical based on the structure of the second-order

MEASURING LEADER-LEVEL ENGAGEMENT
65
model. As outlined by Byrne (2010), the CRDIFF method was employed to address just-
identification of the model and thus increased the df from 51 to 52. Since it appears,
based on the df value, that Shuck et al. (2017) did not apply this adjustment to correct for
a just-identified model, this should be taken into consideration when comparing the
results of the present study with the results presented by Shuck et al. (2017). This is
further discussed in chapter 5.
The Cronbach’s alphas for the data of 147 formal leaders in this study indicated
“acceptable” reliability (≥ .70; Nunnally, 1978; Peterson, 1994) for the Cognitive factor
(α = .73), for the Emotional factor (α = .78), as well as for the Behavioral factor (α = .72).
Though these are deemed “acceptable” based on recommendation by Nunnally (1978),
these values are all well below the reliability values that Shuck et al. (2017) computed in
their validation study of the EES.
Though null hypothesis 3 was retained due to the interpretation of model
goodness-of-fit indices (see Table 13) of the data from leaders, the reliability coefficients
that were produced in this study indicated that the items loading onto the three-factor
structure were an “acceptable” fit. Thus, evaluation of the reliability coefficients provided
evidence to reject null hypothesis 1, in that responses to the EES can be explained by
three first-order factors (emotional, cognitive, and behavioral) with a sample of leaders.
Regression Weights
Standardized regression weight estimates were analyzed to address the hypotheses
that guided this study (see Table 14). Standardized regression weights can be viewed as
factor loadings when interpreting CFA outputs (Yang, 2010). Hair et al. (2010) indicated
that “a .50 loading denotes that 25% of the variance is accounted for by that factor. The

MEASURING LEADER-LEVEL ENGAGEMENT
66
loading must exceed .70 for the factor to account for 50% of the variance of a variable”
(p.114). Furthermore, Kline (2011) also indicates that factor loadings greater than .70 are
favorable in interpreting CFA results.
Table 14
Standardized Regression Weights
Variable Variable Estimate Cognitive <--- Engagement .753 Emotional <--- Engagement .689 Behavioral <--- Engagement .813 Q10 <--- Cognitive .881 Q7 <--- Cognitive .565 Q4 <--- Cognitive .820 Q1 <--- Cognitive .764 Q11 <--- Emotional .819 Q8 <--- Emotional .746 Q5 <--- Emotional .623 Q2 <--- Emotional .818 Q12 <--- Behavioral .905 Q9 <--- Behavioral .853 Q6 <--- Behavioral .764 Q3 <--- Behavioral .664
Upon review of Table 14, all of the standardized regression weight estimates
(factor loadings) meet the minimum benchmark of .50 loading (Hair et al., 2010), with
the majority exceeding .70 loading (Hair et al., 2010; Kline, 2011). A loading value
exceeding .70 accounts for 50% of the variance for that survey item (Kline, 2011). The
only items that had regression weights less than .70 were Q3, Q5, and Q7. Thus, null
hypothesis 1 was rejected, in that the responses to the EES can be explained by the three
first-order factors (emotional, cognitive, and behavioral) and one second-order factor
MEASURING LEADER-LEVEL ENGAGEMENT
67
(engagement). Furthermore, null hypothesis 2 was also rejected, in that the covariance
among the three first-order factors (cognitive, emotional, behavioral) was explained fully
by their regression (factor loading) on the second-order factor (engagement), as indicated
in Table 14.
Modification Indices
A review of the modification indices (MI) for the regression weights (i.e., factor
loadings) revealed several parameters suggestive of items cross loading onto additional
factors than onto those indicated in the hypothesized model (see Table 15). These
misspecifications might indicate that several items (e.g., Q3, Q5, Q7, Q10) measure
additional factors than the ones they are associated in the model (see Figure 6). For
example, the MI for Q7 and Behavioral factor (MI = 24.134) indicated that survey item
Q7 of the EES may fit better on the behavioral factor versus the a prior association of Q7
loading on the cognitive factor.
Upon review of Table 14, the items with the lowest standardized regression
weights were Q3, Q5, and Q7. When reviewing Table 15 in relation to the modification
indices based on these regression weights, it was not surprising to find that these same
three items loaded onto additional factors than those they were originally associated.
These suggestions for future model improvement will be discussed in chapter 5.
Modifications to the model. Though the CFA results in the present study did not
provide irrefutable evidence that the EES can be used to assess engagement among a
sample of formal leaders based on review of model fit indices, the review of the
modification indices (MI) for the regression weights revealed several parameters that
cross-loaded onto additional factors than those indicated in the hypothesized model (see

MEASURING LEADER-LEVEL ENGAGEMENT
68
Table 15). Future researchers may consider rearranging the paths in the model tested in
the present study based on the regression weights with larger MI values. In addition,
correlations between various survey items (such as Q3 and Q8) should also be considered
for assessment of how the model may be improved when analyzing data from formal
leaders.
For instance, survey item Q5 may have a better fit if the path was moved from
Emotional to Cognitive (MI = 13.181; as indicated in Table 16). These misspecifications
might indicate that several items (Q3, Q5, Q7) are associated with additional factors
when utilizing a sample of leaders to measure for engagement. For example, the MI
between Q7 and Behavioral factor (MI = 24.134) indicated that survey item Q7 of the
EES may fit better on the Behavioral factor versus a prior association of Q7 loading on
the Cognitive factor. Future researchers should consider rearranging several paths based
on MI results in Table 16 and then re-running CFA to see if the rearrangement of the
paths improves overall model fitness. Due to this dearth in the literature to provide
grounded research in what paths to change in the EES when measuring engagement with
a sample of leaders, it is recommended that future researchers also perform exploratory
factor analysis (EFA) on data collected from a sample of leaders to provide statistical
evidence to the factor loadings and model specifications that should be employed before
the model is conducted with CFA on a sample of leaders.
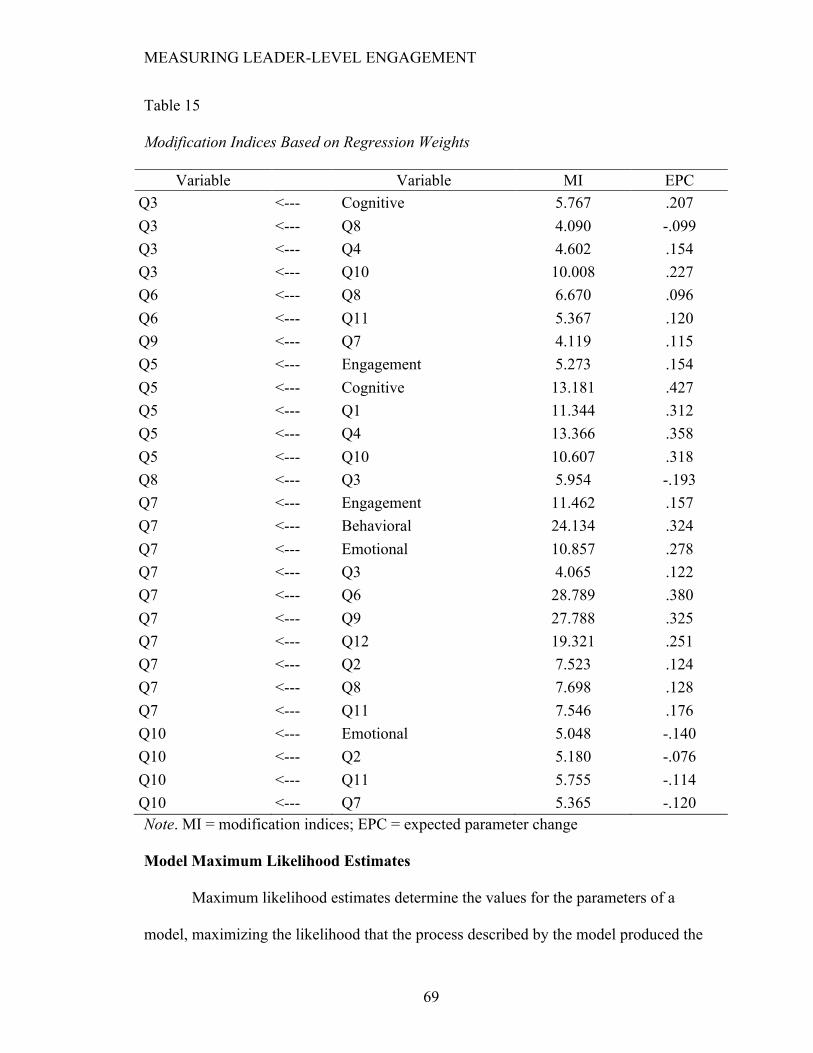
MEASURING LEADER-LEVEL ENGAGEMENT
69
Table 15
Modification Indices Based on Regression Weights
Variable Variable MI EPC Q3 <--- Cognitive 5.767 .207 Q3 <--- Q8 4.090 -.099 Q3 <--- Q4 4.602 .154 Q3 <--- Q10 10.008 .227 Q6 <--- Q8 6.670 .096 Q6 <--- Q11 5.367 .120 Q9 <--- Q7 4.119 .115 Q5 <--- Engagement 5.273 .154 Q5 <--- Cognitive 13.181 .427 Q5 <--- Q1 11.344 .312 Q5 <--- Q4 13.366 .358 Q5 <--- Q10 10.607 .318 Q8 <--- Q3 5.954 -.193 Q7 <--- Engagement 11.462 .157 Q7 <--- Behavioral 24.134 .324 Q7 <--- Emotional 10.857 .278 Q7 <--- Q3 4.065 .122 Q7 <--- Q6 28.789 .380 Q7 <--- Q9 27.788 .325 Q7 <--- Q12 19.321 .251 Q7 <--- Q2 7.523 .124 Q7 <--- Q8 7.698 .128 Q7 <--- Q11 7.546 .176 Q10 <--- Emotional 5.048 -.140 Q10 <--- Q2 5.180 -.076 Q10 <--- Q11 5.755 -.114 Q10 <--- Q7 5.365 -.120 Note. MI = modification indices; EPC = expected parameter change
Model Maximum Likelihood Estimates
Maximum likelihood estimates determine the values for the parameters of a
model, maximizing the likelihood that the process described by the model produced the
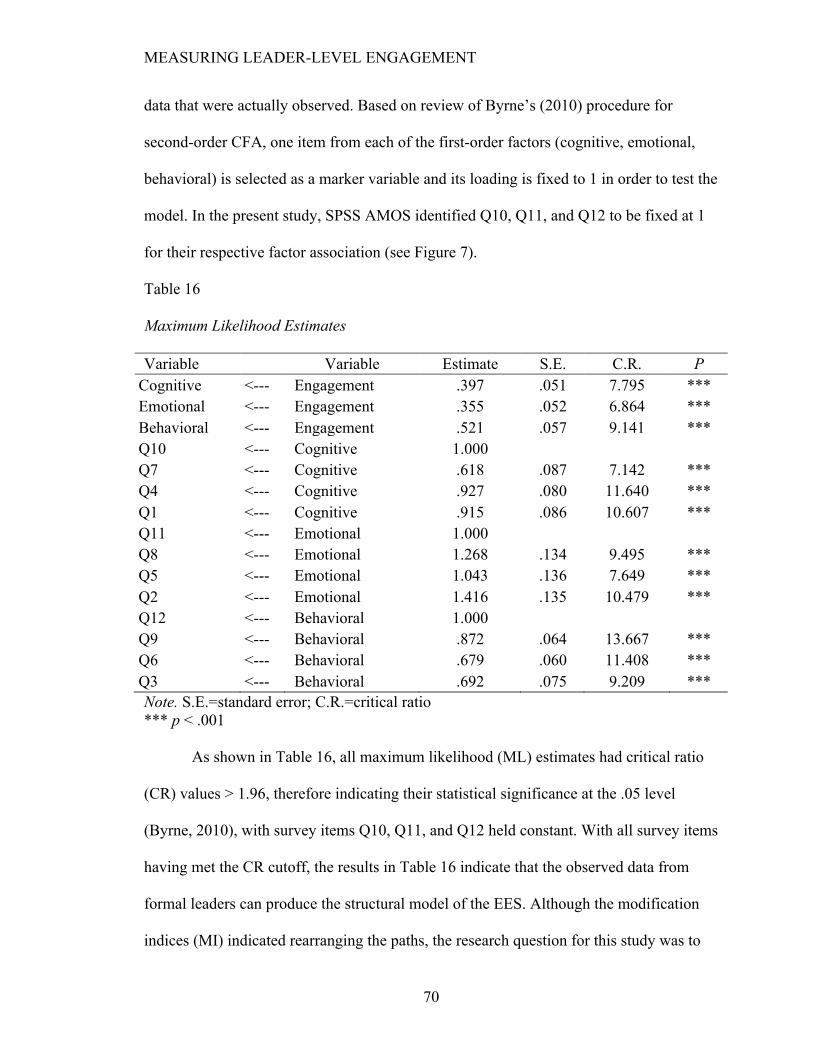
MEASURING LEADER-LEVEL ENGAGEMENT
70
data that were actually observed. Based on review of Byrne’s (2010) procedure for
second-order CFA, one item from each of the first-order factors (cognitive, emotional,
behavioral) is selected as a marker variable and its loading is fixed to 1 in order to test the
model. In the present study, SPSS AMOS identified Q10, Q11, and Q12 to be fixed at 1
for their respective factor association (see Figure 7).
Table 16
Maximum Likelihood Estimates
Variable Variable Estimate S.E. C.R. P Cognitive <--- Engagement .397 .051 7.795 *** Emotional <--- Engagement .355 .052 6.864 *** Behavioral <--- Engagement .521 .057 9.141 *** Q10 <--- Cognitive 1.000 Q7 <--- Cognitive .618 .087 7.142 *** Q4 <--- Cognitive .927 .080 11.640 *** Q1 <--- Cognitive .915 .086 10.607 *** Q11 <--- Emotional 1.000 Q8 <--- Emotional 1.268 .134 9.495 *** Q5 <--- Emotional 1.043 .136 7.649 *** Q2 <--- Emotional 1.416 .135 10.479 *** Q12 <--- Behavioral 1.000 Q9 <--- Behavioral .872 .064 13.667 *** Q6 <--- Behavioral .679 .060 11.408 *** Q3 <--- Behavioral .692 .075 9.209 *** Note. S.E.=standard error; C.R.=critical ratio *** p < .001
As shown in Table 16, all maximum likelihood (ML) estimates had critical ratio
(CR) values > 1.96, therefore indicating their statistical significance at the .05 level
(Byrne, 2010), with survey items Q10, Q11, and Q12 held constant. With all survey items
having met the CR cutoff, the results in Table 16 indicate that the observed data from
formal leaders can produce the structural model of the EES. Although the modification
indices (MI) indicated rearranging the paths, the research question for this study was to
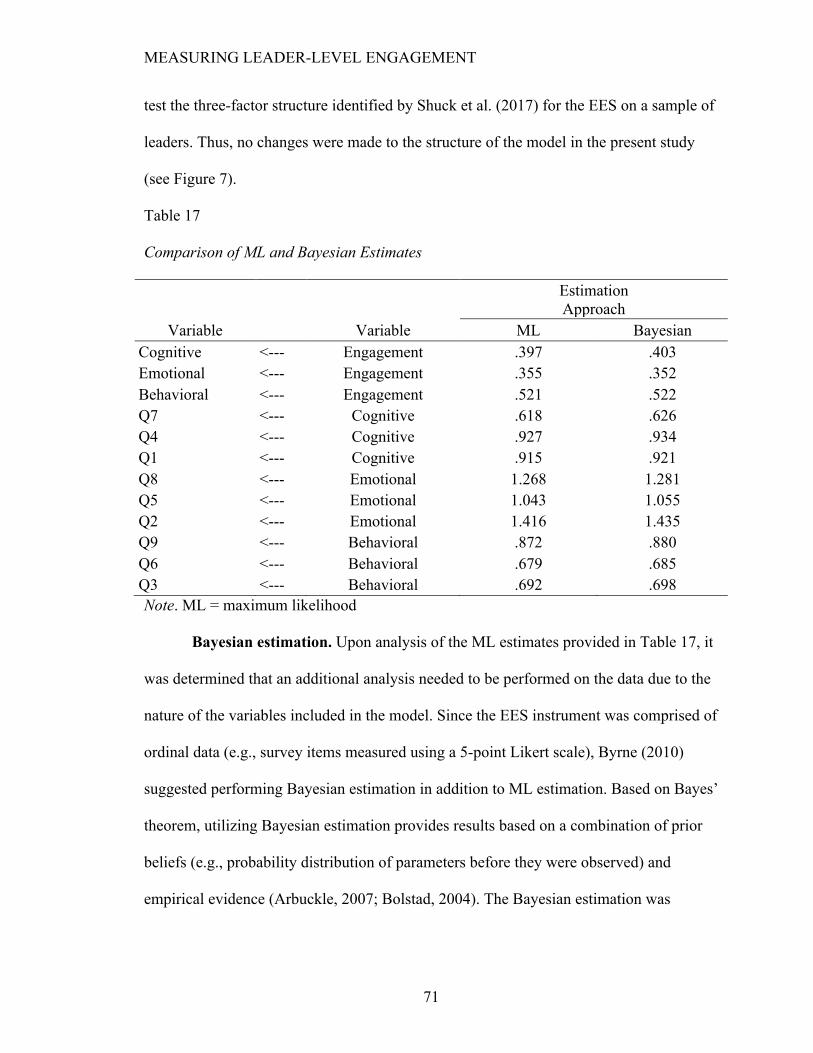
MEASURING LEADER-LEVEL ENGAGEMENT
71
test the three-factor structure identified by Shuck et al. (2017) for the EES on a sample of
leaders. Thus, no changes were made to the structure of the model in the present study
(see Figure 7).
Table 17 Comparison of ML and Bayesian Estimates
Estimation Approach
Variable Variable ML Bayesian Cognitive <--- Engagement .397 .403 Emotional <--- Engagement .355 .352 Behavioral <--- Engagement .521 .522 Q7 <--- Cognitive .618 .626 Q4 <--- Cognitive .927 .934 Q1 <--- Cognitive .915 .921 Q8 <--- Emotional 1.268 1.281 Q5 <--- Emotional 1.043 1.055 Q2 <--- Emotional 1.416 1.435 Q9 <--- Behavioral .872 .880 Q6 <--- Behavioral .679 .685 Q3 <--- Behavioral .692 .698 Note. ML = maximum likelihood
Bayesian estimation. Upon analysis of the ML estimates provided in Table 17, it
was determined that an additional analysis needed to be performed on the data due to the
nature of the variables included in the model. Since the EES instrument was comprised of
ordinal data (e.g., survey items measured using a 5-point Likert scale), Byrne (2010)
suggested performing Bayesian estimation in addition to ML estimation. Based on Bayes’
theorem, utilizing Bayesian estimation provides results based on a combination of prior
beliefs (e.g., probability distribution of parameters before they were observed) and
empirical evidence (Arbuckle, 2007; Bolstad, 2004). The Bayesian estimation was

MEASURING LEADER-LEVEL ENGAGEMENT
72
applied to the data and the results produced nearly identical outcomes to the ML
estimates from the initial CFA run (see Table 17).
The comparability of these results is not surprising, because as Byrne (2010)
stated, when the hypothesized model is well specified (which is true for the EES used in
this study) and the scaling is based on more than three categories (which is again true for
the EES since the scale is a 5-point Likert), it is unlikely there will be significant
difference between the ML and Bayesian estimations.
Summary of Results
A sample of 159 formal leaders was analyzed for assumptions prior to conducting
second-order CFA. Six cases (3.8% of the total sample) were removed from the analysis
due to missing data. Mahalanobis distance was calculated to test for multivariate outliers,
resulting in additional six cases to be removed from the study, bringing the valid N to
147. Skewness and kurtosis values were reviewed to test for multivariate normality, with
no variables outside of the limits. Tolerance and VIF values were analyzed to test for
multicollinearity, which indicated no issues with the data.
Based on analysis of standardized regression weights and reliability coefficients,
null hypothesis 1 was rejected in that the responses to the EES can be explained by the
three first-order factors (emotional, cognitive, and behavioral) and one second-order
factor (engagement). Null hypothesis 2 was also rejected in that the covariance among the
three first-order factors (cognitive, emotional, behavioral) was fully explained by their
factor loadings (regression) on the second-order factor (engagement). Null hypothesis 3
was, however, retained in that data from a sample of leaders did not fit the structural
model of the EES based on interpretation of the model fit indices.

MEASURING LEADER-LEVEL ENGAGEMENT
73
CHAPTER 5: DISCUSSION
The purpose of this study was to determine if the structure of the Employee
Engagement Scale (EES) could be replicated with a sample of formal leaders (supervisors
or managers). Shuck, Adelson, and Reio (2017) verified the EES instrument with 1,067
employeeswho worked in the financial services industry, however this study aimed at
verifying the EES instrument with a sample of leaders. While there is an abundance of
research on the impact of employee engagement within the workforce (Albrecht, 2010;
Saks, 2019; Saks & Gruman, 2014) there is a notable absence in relation to leader
engagement and how it may influence other organizational outcomes (Welbourne, 2007).
Furthermore, due to this gap in the literature focused exclusively on assessing leader-
level engagement, it comes as no surprise that no scales exist to specifically measure
leader engagement. Given this constraint, the researcher of the present study chose to use
a validated employee engagement measure to determine whether or not leader
engagement could be assessed with an existing tool.
Research Question and Hypotheses
This study examined the following research question:
How well do the data collected from leaders replicate the three-factor structure identified
in the Employee Engagement Scale (EES) by Shuck, Adelson, and Reio (2017)?
To provide more precise examination of the research question, the following
hypotheses were tested:

MEASURING LEADER-LEVEL ENGAGEMENT
74
H1. Responses to the Employee Engagement Scale (EES) can be explained by three first-
order factors (emotional, cognitive, and behavioral) and one second-order factor
(engagement).
Null H1. Responses to the Employee Engagement Scale (EES) cannot be explained by
three first-order factors (emotional, cognitive, and behavioral) and one second-order
factor (engagement).
H2. Covariance among the three first-order factors is explained fully by their regression
on the second-order factor.
Null H2. Covariance among the three first-order factors cannot be explained fully by their
regression on the second-order factor.
H3. Data from leaders fits the structure model of the EES.
Null H3. Data from leaders do not fit the structure model of the EES.
Summary of Results
In the present study, second-order confirmatory factor analysis (CFA) was
performed on data from 147 formal leaders to determine if the 12-item, three-factor
structure of the EES could be retained with a sample of leaders. Based on analysis of
standardized regression weights (see Table 14) and reliability coefficients (α > .70), null
hypotheses 1 and 2 were rejected in that the data from formals leaders provided evidence
that the EES can be explained by the three first-order factors of emotional, cognitive, and
behavioral and their loading on the second-order factor of engagement. Yet, based
exclusively on interpretation of the model fit indices (see Table 13), null hypothesis 3
was retained, as the data from leaders did not adequately fit the EES’s structural model.

MEASURING LEADER-LEVEL ENGAGEMENT
75
Interpretation of all the CFA results indicated that future researchers should still
consider using the EES measure to assess leader-level engagement, as evaluation of CFA
results requires consideration of all outputs—from model fit indices to reliability
coefficients to regression weights. Upon review of modification indices (MI) in Table 15,
there is much to consider for future research in improving the model structure when
measuring leader-level engagement.
Discussion
The discussion throughout this chapter will focus on the most significant results
as it relates to considerations for future research. The most critical conversation is related
to suggested modifications to the EES model structure based on review of modification
indices (MI) found in Table 15. These modifications have the implication of making
significant improvements to the overall goodness-of-fit of the EES model when analyzing
data from a sample of formal leaders. Furthermore, future researchers may consider
additional exploratory factor analysis (EFA) and qualitative research methods to isolate
the ideal structure and verbiage used in the survey items of the EES when measuring for
leader-level engagement.
Modifications to the Model
Since overall results suggested rejection of hypotheses 1 and 2, the structure of
the EES could be justified as is, but some specific results as indicated in review of
modification indices (MI) raise questions and possibilities that need to be examined.
Based on review of the standardized regression weights and the MI values, it is suggested
that future researchers consider rearranging paths when using the EES with a sample of
leaders.

MEASURING LEADER-LEVEL ENGAGEMENT
76
In review of both regression weights (see Table 14) and MI values (see Table 15),
there are three items from the EES that indicate that path modification would improve
model fitness when using the EES to measure leader engagement. The specific items are
Q3, Q5, and Q7. Each of these items had a standardized regression weight (factor
loading) greater than .70, the cutoff recommended by Kline (2011). Specific
considerations for model improvements and future research related to Q3, Q5, and Q7 are
as follows.
Suggested model improvement 1. Based on review of the modification indices
(MI) presented in Table 15, survey item Q7 needs to be further investigated as to why it
loaded on all three factors, including the second-order factor of Engagement. Based on
the study by Shuck et al. (2017), Q7 was associated with the Cognitive factor; however,
MI values indicate that it could also load on the Behavioral and Emotional factors, with
MI values of 24.134 and 10.857 respectively. In addition to these alternate factor
loadings, the MI values also indicate that there is an association between Q7 and seven of
12 items in the EES measure. Of those associations, the MI values of the association
between Q6, Q9, and Q12 with Q7 supports the assertion, based on the data, that Q7 may
load better on the Behavioral factor, as items Q6, Q9, and Q12 are all linked with the
Behavioral factor based on the Shuck et al. (2017) study.
Based exclusively on the data results from a sample of formal leaders in the
present study, it is suggested to modify the model by moving Q7 from the Cognitive
factor to the Behavioral factor. If the data from the current sample of leaders in this study
were to be run through CFA after making this suggested modification to the EES model, I
would predict that the overall model goodness-of-fit would have a slight improvement,
MEASURING LEADER-LEVEL ENGAGEMENT
77
based on the expected parameter change (EPC) of .157 in moving Q7 to the Behavioral
factor.
Though the data are of great interest in suggesting model improvement, one
should also consider the verbiage of the Q7 survey item. This item states, “I give my job
responsibility a lot of attention” (Shuck et al., 2017). Future researchers should consider
how the word ‘attention’ is defined and operationalized by those completing the EES
tool. Does ‘attention’ to one’s job responsibilities truly capture Cognitive engagement in
the workplace? Alternatively, does the definition of ‘attention’ associate more
appropriately with either Emotional or Behavioral engagement, as indicated by MI
values? Furthermore, does ‘attention’ mean something else entirely and should the
verbiage in Q7 be altered to better represent the cognitive function that Shuck et al.
(2017) were trying to elicit from this survey item? Future research may provide data to
answer these questions.
Suggested model improvement 2. Looking once again to the MI values in Table
15, another suggested model improvement would be related to the loadings associated
with Q5, which is associated with the Emotional factor based on the initial validation of
the EES by Shuck et al. (2017). Based on MI values, survey item Q5 loaded directly on
the second-order factor of Engagement and the Cognitive factor, with a MI value of
13.181 for that latter association. Q5 is also associated with items Q1, Q4, and Q10,
which all loaded on the Cognitive factor based on the initial validation of the EES by
Shuck et al. (2017). Thus, based exclusively on the MI values, it is recommended that
following the move of Q7 to the Behavioral factor and analyzing those CFA results, I
would then move Q5 to the Cognitive factor and once again run data from the sample of

MEASURING LEADER-LEVEL ENGAGEMENT
78
leaders in the present study through CFA and interpret the goodness-of-fit results. I
would once again predict that there would be overall model improvement of the EES with
a sample of leaders based on the expected parameter change (EPC) of .427 found in
Table 15.
As with the discussion on the verbiage in Q7, I would also recommend that future
researchers consider how participants are operationalizing the question asked in Q5,
which states, “I feel a strong sense of belonging to my job” (Shuck et al., 2017).
Assuming that the term ‘belonging’ has various meaning and association to those who
complete the EES tool, further interpretation of this terminology should be included to
improve the model structure of the EES when measuring for leader engagement.
Suggested model improvement 3. Upon review of the MI values in Table 15, the
next suggested improvement to the structure of the EES model would be related to Q3,
which loads on the Behavioral factor based on the initial validation of the EES by Shuck
et al. (2017). Based on MI values, survey item Q3 is suggested to load onto the Cognitive
factor with a MI value of 5.767, and is also associated with items Q4 and Q10, both of
which are connected to the Cognitive factor of the EES (Shuck et al., 2017). It is
suggested that following analysis of the impact of first moving the path associated with
Q7 and then moving the path for Q5, the path from survey item Q3 should be moved to
the Cognitive factor and CFA should be re-run a third time with the data from the sample
of leaders in the current study. I would predict overall model improvement to the EES
measuring for leader engagement based on the expected parameter change (EPC) of .207
found in Table 15.

MEASURING LEADER-LEVEL ENGAGEMENT
79
As with the other suggested model improvements discussed so far, the language
used in Q3 should be further analyzed. Survey item Q3 states, “I really push myself to
work beyond what is expected of me” (Shuck et al., 2017). But as with Q7 and Q5, how
is the statement in this question being operationalized by those completing the EES tool?
Might Shuck et al. (2017) have associated Q3 with the Behavioral factor based on the
verb ‘push’ in the question. Yet, based on my own assumptions, “pushing one’s self”
may be a cognitive function, likened to concentrating and focusing on one’s job duties.
The terms ‘concentrate’ and ‘focus’ are both included in three of the EES survey items
associated with the Cognitive factor based on the initial validation of the tool by Shuck et
al. (2017).
As with the verbiage in Q7 and Q5, the definitions associated with the language
used in Q3 would benefit from qualitative research methods. Due to the limitation of
quantitative research in that one cannot assume the social construction of the reality in
which their participants exist, qualitative methods would allow for focus groups and
interviews to be conducted to provide more insight into how participants are
operationalizing terms such as ‘attention,’ ‘belonging,’ and ‘push.’ Though improving the
EES model step-by-step, starting with rearranging the factorial paths associated with Q7,
then Q5, and ultimately Q3, should improve the overall model fit when analyzing data
from formal leaders, the inclusion of qualitative methods with future research in this area
would be beneficial to developing the body of research related to measuring leader-level
engagement.
To provide a visual of the language used in the current version of the EES
published by Shuck et al. (2017) and the suggested changes to the factor associations for

MEASURING LEADER-LEVEL ENGAGEMENT
80
Q3, Q5, and Q7, Table 18 includes the original survey item groupings of the EES, by
factor, on the left hand side, with the suggested modifications as discussed in this present
study on the right hand side. Note that only those items discussed previously are noted
with their survey item number (Q3, Q5, Q7) in Table 18 to provide further clarity on
which EES items are suggested to be regrouped based on modification indices (MI).
Table 18
Comparison of the Original EES Suvey Item Grouping to the Suggested Change to Survey Item Grouping Based on Modification Indices
Original grouping of
survey items Suggested change to grouping of
survey items
Cognitive
I am really focused when I am working. I am really focused when I am working.
I concentrate on my job when I am at work. I concentrate on my job when I am at work.
I give my job responsibility a lot of attention. (Q7)
At work, I am focused on my job.
At work, I am focused on my job. I feel a strong sense of belonging to my job. (Q5)
I really push myself to work beyond what is expected of me. (Q3)
Emotional
Working at my current organization has a great deal of personal meaning to me.
Working at my current organization has a great deal of personal meaning to me.
I feel a strong sense of belonging to my job. (Q5)
I believe in the mission and purpose of my company.
I believe in the mission and purpose of my company.
I care about the future of my company.
I care about the future of my company.

MEASURING LEADER-LEVEL ENGAGEMENT
81
Table 18 (continued)
Comparison of the Original EES Survey Item Grouping to the Suggested Change to Survey Item Grouping Based on Modification Indices
Original grouping of
survey items Suggested change to grouping of
survey items
Behavioral
I really push myself to work beyond what is expected of me. (Q3)
I give my job responsibility a lot of attention. (Q7)
I am willing to put in extra effort without being asked.
I am willing to put in extra effort without being asked.
I often go above what is expected of me to help my team be successful.
I often go above what is expected of me to help my team be successful.
I work harder than expected to help my company be successful.
I work harder than expected to help my company be successful.
Note. Only those survey items that suggested to be rearranged based on modification indices (MI) are noted and boldfaced in this table.
In relation specifically to predicted improvements to the model between moving
the paths associated with Q7 and Q5, I would predict more significant improvement to
the overall model once Q5 is moved to the Cognitive factor in the second iteration of
model improvement. This is based exclusively on review of the data in Table 15,
specifically the EPC value of .427 related to moving Q5 to the Cognitive factor, whereas
the EPC value is only .157 for moving Q7 to Behavioral. Future research will provide
data to retain or reject this supposition of how modifications to the model structure will
impact overall model fit of the EES analyzing data from formal leaders. Furthermore,
future researchers should consider the language used in the EES survey items. The use of
‘attention,’ ‘belonging,’ and ‘push’ need to be further examined to indicate if they are
accurately assessing the constructs that they are associated, whether that be one’s
cognitive, emotional, or behavioral engagement in the workplace.
MEASURING LEADER-LEVEL ENGAGEMENT
82
Though the CFA results of this study indicated opportunities for improvement of
the model, the more pertinent discussion point in response to the results of this study is
why a sample of leaders would not be able to replicate the findings by Shuck et al. (2017)
when they tested the EES model on a sample of employees. Furthermore, might the
failure of Shuck et al. (2017) to correct the just-identified model even with a sample of
employees have produced inaccurate results, thus perhaps the EES should be revised for
use with samples of both employees and leaders? Future research assessing the reliability
of the EES with a different sample of employees, using the CRDIFF correction, would be
of value to the literature on engagement measures and the noted concern of experts in the
field on the lack of a valid of a tool to consistently measure engagement (Saks, 2019).
In addition to the suggested changes to the model structure indicated by MI and
regression weights to the model, exploratory factor analysis (EFA) should be considered
for future studies measuring leader engagement with the EES. Unlike the confirmatory
factor analysis (CFA) that was used in the present study to assess if the structure of the
EES could be replicated with a sample of leaders, EFA would be used for “consolidating
variables and for generating hypotheses about underlying processes” (Tabachnick &
Fidell, 2013, p. 614). Though running data from a different sample of leaders through the
revised model in Figure 8 is worth consideration, employing EFA on the same data
collected from the sample of leaders in the present study would strengthen the argument
for how the structure of the EES might be modified when measuring for leader-level
engagement. I would predict that running EFA on the data from leaders in the present
study would produce a model structure similar to the changes suggested in review of the
modification indices (MI) in Table 15, specifically related to moving the path associated

MEASURING LEADER-LEVEL ENGAGEMENT
83
with Q7 to the Behavioral factor, Q5 to Cognitive factor, and Q3 also to the Cognitive
factor. EFA results would be analyzed based on review of eigenvalues to determine with
survey items load, or group together, on a particular factor.
Utilizing EFA may also indicate that additional factors exist in the model. Again,
since EFA takes an exploratory approach versus confirming an existing structure, as is
the case with CFA, future researchers will need to see where the data leads then in
identifying if the factorial structure of the EES with a sample of leaders needs to be
modified. Furthermore, taking into consideration the specific language used in the
various survey items of the EES, future researchers may also consider whether the factor
names of Cognitive, Emotional, and Behavioral should be retained or if, based on EFA
results, the factors should be renamed to better represent what is occurring in the data.
Measuring Leader Engagement
Though research related to leader-level engagement continues to be missing from
the literature, the interest in employee engagement and its association with organizational
outcomes such as job satisfaction, burnout, and turnover intention continues to gain
momentum. In 2017, the Society for Human Resource Management (SHRM) published a
report on data from 600 employees that showed a moderately engaged workforce with an
average engagement score of 3.9 within the U.S., with 89% indicating satisfaction in their
organization (Lee, Esen, & DiNicola, 2017). Yet, even with these ‘high’ levels of
engagement and satisfaction, 40% of employees surveyed indicated that they might
consider looking for new employment in the next two years. With the consideration for
high costs associated with turnover, companies are continually striving to engage their
workforce and address reasons that may lead an employee to leave an organization,

MEASURING LEADER-LEVEL ENGAGEMENT
84
reasons such as compensation to work/life balance to meaningfulness of the work (Lee et
al., 2017).
Yet, at the core of this present study, focus on measuring leader engagement is
missing from the engagement literature and ultimately how leader engagement may be
associated with organizational variables such as job satisfaction, organizational
citizenship behavior (OCB), and turnover. Though there is plenty of evidence related to
the relationship between employees and their immediate supervisors (e.g., Gerstner &
Day, 1997; Harris et al., 2009; Harris et al., 2005; Liden & Maslyn, 1998), there is a
notable gap focusing on how engagement might impact those in formal leadership
positions. If leaders have high or low levels of cognitive, emotional, and/or behavioral
engagement within their organizations, what impact might it have on those they
supervise? One might postulate that if a leader has a high level of engagement, it may
positively influence their subordinates’ perceptions of their own engagement. If that were
to be the case, then engagement research should not exclusively focus at assessing
engagement only at the employee level, but should consider the impact that leader
engagement, and leader disengagement, might have on organizational outcomes.
Another point of consideration is whether leaders identify themselves as
employees within their organizational roles. If engagement is specifically related to one’s
cognitive, emotional, and behavioral energies in an employee role, might formal leaders
perceive their work roles as supervisors or managers as different from an employee role?
Laing, Phillipson, and Lee (1966) indicated that one’s perception informs his or her
reality. So, even though the majority of leaders report to a supervisor of their own, given
that many CEOs report to a board of directors or the like, do leaders perceive their

MEASURING LEADER-LEVEL ENGAGEMENT
85
leadership role as disconnected from their role as an employee within an organization?
These questions are critical to further investigate in addressing the leader-level gap in the
engagement literature.
The scarcity of literature focused on measuring variables at the leader-level is not
unique to just organizational consequences such as job satisfaction, organizational
citizenship behavior (OCB), and turnover intention. Transformational leadership (TFL;
Bass, 1985) has been one of the most prominently researched leadership types (Avolio,
Walumbwa, & Weber, 2009; Bass, 1999; Judge & Piccolo, 2004), especially related to its
link to increased performance of employees (Bass, 1999; Braun et al., 2013; Dvir, Eden,
Avolio, & Shamir, 2002; Farahnak, Ehrhart, Torres, & Aarons, 2019; Hildenbrand,
Sacramento, & Binnewies, 2018). Yet, TFL is typically assessed from the point-of-view
of the employee (Farahnak et al., 2019); with leaders rarely assessed to measure their
own transformational leadership when assessing the relationship between TFL and
various organizational outcomes (Lanaj, Johnson, & Lee, 2016). Thus, as previously
stated, if “perception is reality” (Laing et al., 1966), might we consider more frequently
measuring these leadership variables from the perspective of the leader?
Though it is of great interest to assess how leader engagement might impact
variables such as job satisfaction and turnover intention, we cannot conduct these
analyses without first identifying a measure to assess the construct of leader engagement.
As already stated, whether future researchers modify the EES based on review of
modification indices (MI) to rearrange the paths for items Q3, Q5, and Q7 or use
exploratory factor analysis (EPA) to improve the model fit of the EES with data from
formal leaders, the focus on leader engagement cannot gain momentum without
MEASURING LEADER-LEVEL ENGAGEMENT
86
determining the tool that can be used to assess this construct. With the impressive
financial cost associated with employee turnover, it is of critical importance that a
reliable measure be identified to assess the seemingly forgotten variable of leader
engagement.
Limitations
There were several limitations to the present study. The primary limitation of this
study was my decision to utilize the critical ratio difference (CRDIFF) method outlined
by Byrne (2010) to address just-identification of the model, thus increasing the degrees of
freedom (df) from 51 to 52 in the model tested in this study. Since it appears that Shuck
et al. (2017) did not apply this adjustment to correct for a just-identified model at the
upper level (based on their reported df value of 51), it is more difficult to compare the
results of the present study with those reported by Shuck et al. (2017). Since the primary
concern with a just-identified model is that it does not test a particular hypothesis (Kline,
2011), is it critical to correct for just-identification in order to adequately evaluate the
model fit of the structure being assessed using confirmatory factor analysis (CFA). Thus,
this concern was addressed in the present study and must be taken into consideration
when comparing the results with those produced by Shuck et al. (2017).
A secondary limitation of this study was the subgroups of the population from
which the valid sample for analysis was collected and its impact on generalizability.
Though this was a noted limitation, recruiting participants via LinkedIn, ILA discussion
board, personal contacts, and the listserv of a mid-sized Midwestern university, provided
access to the population of persons in formal leadership roles, which was the most
critical criterion for inclusion in this study. Since participants had to self-identify as

MEASURING LEADER-LEVEL ENGAGEMENT
87
formal leaders (supervisors or managers) to be included in the study, the researcher had
no way to verify that the participants actually hold a formal leadership role—further
adding to the limitation this poses on the present study and its results.
Data Collection Limitations
The primary data collection limitation of this study was the use of the Employee
Engagement Scale (EES) itself, as it was developed and validated with a sample of
employees. Given that no research exists focused on leader-level engagement, the use of a
scale that was established to measure employee engagement provides a limitation in the
present study, as evidenced in the review of model fit indices. Yet, based on the
evaluation of regression weights and reliability coefficients, the EES should not be cast
aside for use to measure leader engagement. Review of modification indices (MI)
provides guidelines for future research to modify the paths in the model to improve the
overall model fit with a sample of leaders.
Common method variance (CMV) bias was an additional data collection
limitation to this study. Scholars identify CMV as a potential problem associated with
research in the social and behavioral sciences, specifically studies involving self-reports
such as questionnaires, surveys, and interviews for their data collection (Richardson,
Simmering, & Sturman, 2009). CMV refers to the variance that is attributed to the data
collection method rather than to the construct that is theoretically represented by the
measures being used (Campbell & Fiske, 1959; Podsakoff et al., 2003). To address the
impact of CMV as a limitation to the present study, the researcher ensured the anonymity
and confidentiality of the participants by not collecting any identifiable information on
participants (such as name, email address). In addition, though it was also listed as a

MEASURING LEADER-LEVEL ENGAGEMENT
88
limitation of the present study, the researcher counterbalanced the order of the questions
by reordering the items from the original survey tool so that items that were associated
with the same engagement factor (cognitive, emotional, or behavioral) were not grouped
together (Nunnally & Bernstein, 1994; Podsakoff et al., 2003).
Another data collection limitation to this study is related to social desirability bias
(Podsakoff, MacKenzie, Jeong-Yeon, & Podsakoff, 2003; Podsakoff, MacKenzie, &
Podsakoff, 2012). This bias postulates that participants may not be as truthful in their
responses to the survey items as they may strive to be more socially acceptable in how
they respond (Podsakoff et al., 2003). Though there is no way to truly eliminate social
desirability bias, this study provides evidence for the utilization of an engagement
measure, specifically the EES to addressing the gap in the literature related to measuring
leader-level engagement. With the rejection of null hypotheses 1 and 2 in this study based
on analysis of standardized regression weights (see Chapter Four), future studies should
still consider using the EES to measure leader-level engagement—though, with possible
modifications to the paths in the model based on review of modification indices (MI).
An additional limitation is related to the information that was not collected for
this study. The Shuck et al (2017) study included analysis of 1,067 employees from the
financial services industry; yet, the leaders included in this study were not asked to
disclose the industry in which they were employed. Based on review of response rates
from the various samplings (see Table 6), the researcher can conclude that roughly 50%
of those included in this study work within higher education. In relation to the Shuck et al
(2017) study, might they have obtained the same reliability results with a sample of
MEASURING LEADER-LEVEL ENGAGEMENT
89
employees from other industries? Future researchers should consider collecting data
related to the industries in which employees and leaders work.
Recommendations and Future Research
More research should be conducted in relation to assessing leader engagement.
Though the present research study did not provide irrefutable evidence for the utility of
the EES (Shuck et al., 2017) to measure leader-level engagement, it does reinforce the
three-factor structure of the EES, grounded in Kahn’s (1990) theoretical framework
focusing on emotional, cognitive, and behavioral engagement based on analysis of
regression weights and reliability coefficients.
Based on review of modification indices (MI) and regression weights, future
researchers consider rearranging the paths associated with survey items Q7, Q5, and then
Q3. It is recommended that the paths be rearranged in this specific order based on the MI
values in Table 15. Survey item Q7 had the highest number of instances for suggested
modification based on MI values, followed by Q5 and then Q3. Following each change in
the path association (first Q7, then Q5, and then Q3), it is recommended that CFA be re-
run to analyze the results and determine if these changes to the paths did indeed improve
the fit of data from formal leaders when measuring for leader engagement with the EES.
In addition, exploratory factor analysis (EFA) should also be considered when
evaluating an engagement measure to assess leader engagement to analyze how data from
a sample of leaders loads onto a varying number of factors. Using the 12-items from the
EES, with knowledge of how Shuck et al. (2017) developed the structure of that 3-factor
model, one might predict that performing EFA on data from a sample of leaders would
indicate a 3-factor model. However, based on the MI values in the present study, I would
MEASURING LEADER-LEVEL ENGAGEMENT
90
predict that EFA results would indicate a 3-factor model that would mirror the path
changes indicated in Table 18 based on the modification indices (MI) obtained in the
present study.
In addition to the quantitative methods recommended by rearranging the paths
based on MI values and analysis of EFA results, focusing on how leaders and employees
are interpreting the verbiage of the EES items might require additional analyses. Since
the interpretation of the questions associated with the three factors—cognitive, emotional,
and behavioral—seem to be interpreted differently with a sample of leaders than they
were with samples of employees based on the results of the present study, it is strongly
recommended that qualitative methods be used by future researchers seeking to measure
leader-level engagement with the EES. Without additional qualitative research to get at
the ‘why’ leaders might respond differently to an employee engagement measure,
specifically the verbiage in the survey items Q3, Q5, and Q7, the question may not be
answered.
Future researchers should consider the lack of research on leader engagement in
the overall leadership literature when evaluating the impact of leadership variables on
organizational outcomes such as employee-level engagement, job satisfaction, OCB, and
turnover intention. When taking into consideration that “perspective is reality” for an
individual person (Laing et al., 1966), assessing a leader’s own level of engagement, job
satisfaction, OCB, and turnover intention from the leader’s own perspective should be of
interest. Data gathered directly from leaders on their own levels of engagement, job
satisfaction, and turnover intention may help in determining interventions and human
resources management (HRM) training programs to improve these organizational

MEASURING LEADER-LEVEL ENGAGEMENT
91
variables that have an impact on a business’ financial bottom line (Kim, Kolb, & Kim,
2013; Schneider et al., 2017; Tarique & Schuler, 2010).
Though LinkedIn seemed to be an ideal target for recruitment of participants for
this study, the lack of a personal association with potential recruits hampered its utility.
Limited to posting requests to participate in a study such as this one in the LinkedIn
groups’ discussion boards was not a successful means to reach enough participants to
meet the minimum sample size in the present study. Though it may be worthy of use in
other research designs depending on the specific groups that are targeted for
participation, I did not find this an advisable target population for sampling for this
dissertation.
With emergent research on “engagement as management practice” within human
resource management (HRM) practices, it is worth noting once again that future
researchers would be wise to assess both leader-level and employee-level engagement
when determining if there is any difference on organizational outcomes whether one is
‘doing engagement’ in contrast to merely ‘being engaged’ (Truss, Alfes, Delbridge,
Shantz, & Soane, 2014).
Conclusion
The goal of this study was to bring attention to the absence in the literature related
to measuring leader engagement, specifically by examining if the Employee Engagement
Scale (EES; Shuck et al., 2017) could be used to assess leader-level engagement. With
leader disengagement reportedly costing organizations $77 to $96 billion annually due to
the influence they have on those they lead (Adkins, 2015), it is of critical importance to
the engagement research that a valid instrument to measure leader engagement be
MEASURING LEADER-LEVEL ENGAGEMENT
92
identified. To provide data to address this gap within the employee engagement research,
self-identified leaders were recruited to participate in this study to assess their level of
engagement within the workplace, utilizing the Employee Engagement Survey (EES;
Shuck et al., 2017), grounded in Kahn’s (1990) theoretical framework.
After testing for assumptions and cleaning the data, 147 leaders were included in
the second-order confirmatory factor analysis (CFA) to evaluate whether the EES could
be used to measure leader engagement. Though the model goodness-of-fit indices did not
provide irrefutable evidence that leader engagement could be assessed with the EES,
review of regression weights and reliability coefficients did provide evidence for the
overall structure of the measure. Modification indices (MI) provided opportunities to
improve the EES model for future researchers when measuring for leader-level
engagement. Future researchers should consider the suggested model improvements
discussed in this study by rearranging the paths associated with several survey items to
analyze if the suggested modifications improved the overall fit of the EES model with
data from formal leaders.
Though the data analyzed in this study did not provide irrefutable evidence to
support the use of the EES tool by Shuck et al. (2017), to measure for leader engagement,
this study shed light on the seemingly forgotten variable of leader engagement in the
literature. Identifying a valid tool to measure leader engagement would allow future
researchers to substantiate, or refute, the claim that leader disengagement has a
significant financial impact on the bottom line of organizations (Adkins, 2015). While
data are nonexistent on the potential impact leader engagement may have on job
satisfaction, organizational citizenship behavior, and turnover intention of those they

MEASURING LEADER-LEVEL ENGAGEMENT
93
lead, the inclusion of assessing leader engagement within the literature would benefit
academics and practitioners alike to improve human resources training interventions and
the financial bottom lines in the organizations that leaders serve.

MEASURING LEADER-LEVEL ENGAGEMENT
94
REFERENCES
Adkins, A. (2015, April). Only 35% of U.S. managers are engaged in their jobs.
Retrieved from http://www.gallup.com/businessjournal/182228/managers-
engaged-jobs.aspx
Albrecht, S. L. (2010). Employee engagement: 10 key questions for research and
practice. Handbook of employee engagement: Perspectives, Issues, Research and
Practice (pp. 3-19). Cheltenham, UK: Edward Elgar Publishing
Aldatmaz, I., Aykaç, C., & Dicle, Ü. (2016). The impact of benefits and services on
manager engagement and manager retention in tourism industry: Enhanced by the
effect of management level. Marmara University Journal Of Economic &
Administrative Sciences, 38(2), 21-44. doi:10.14780/muiibd.281306
Alfes, K., Truss, C., Soane, E. C., Rees, C., & Gatenby M. (2013). The relationship
between line manager behavior, perceived HRM practices, and individual
performance: Examining the mediating role of engagement. Human Resource
Management, 52(6), 839-859. doi:10.1002/hrm.21512
Allen, T. D., & Rush, M. C. (2001). The influence of ratee gender on ratings of
Organizational citizenship behavior. Journal of Applied Social Psychology,
31(12), 2561–2587.
Arbuckle, J. L. (2007). AmosTM 16 user’s guide, Chicago, IL: SPSS.
Avolio, B. J., Walumbwa, F. O., & Weber, T. J. (2009). Leadership: Current theories,

MEASURING LEADER-LEVEL ENGAGEMENT
95
research, and future directions. Annual Review of Psychology, 60(1), 421-449.
Bailey, C., Madden, A., Alfes, K., & Fletcher, L. (2017). The meaning, antecedents and
outcomes of employee engagement: A narrative synthesis. International Journal
of Management Reviews, 19(1), 31-53.
Bakker, A.B., Demerouti, E., & Verbeke, W. (2004). Using the Job Demands-Resources
model to predict burnout and performance. Human Resource Management, 43(1),
83-104.
Bakker, A. B., & Leiter, M. P. (Eds.). (2010). Work engagement: A handbook of essential
theory and research. Hove, East Sussex: Psychology Press.
Barrett, P. (2007). Structural equation modeling: Adjudging model fit. Personality and
Individual Differences, 42(5), 815-24.
Bass, B. M. (1999). Two decades of research and development in transformational
leadership. European Journal of Work and Organizational Psychology, 8(1), 9-
32.
Batista-Taran, L. C., Shuck, M. B., Gutierrez, C. C., & Baralt, S. (2009). The role of
leadership style in employee engagement. In M. S. Plakhotnik, S. M. Nielsen, &
D. M. Pane (Eds.), Proceedings of the Eighth Annual College of Education &
GSN Research Conference (pp. 15-20). Miami, FL: Florida International
University.
Bentler, P. M., & Bonett, D. G. (1980). Significance tests and goodness-of-fit in analysis
of covariance structures. Psychological Bulletin, 88(3), 588-606.
doi:10.1037/0033-2909.88.3.588
Berger, P. & Luckmann, T. (1966). The social construction of reality: A treatise in the

MEASURING LEADER-LEVEL ENGAGEMENT
96
sociology of knowledge. New York, NY: Doubleday.
Berger, P. & Luckmann, T. (1991). The social construction of reality. London, UK:
Penguin Books.
Bernerth, J. B., & Hirschfeld, R. R. (2016). The subjective well-being of group leaders as
explained by the quality of leader-member exchange. The Leadership Quarterly,
27(4), 697-710. http://dx.doi.org/10.1016/j.leaqua.2016.04.003
Blau, P. (1964). Exchange and power in social life. New York, NY: Wiley.
Bolstad, W. M. (2004). Introduction to Bayesian statistics. Hoboken, NJ: Wiley.
Boushey, H., & Glynn, S. J. (2012, November). There are significant business costs to
replacing employees. Retrieved from https://www.americanprogress.org/wp-
content/uploads/2012/11/CostofTurnover.pdf
Braun, S., Peus, C., Weisweiler, S., & Frey, D. (2013). Transformational leadership, job
satisfaction, and team performance: A multilevel mediation model of trust. The
Leadership Quarterly, 24(1), 270-283. doi:10.1016/j.leaqua.2012.11.006
Breevaart, K., Bakker, A. B., Demerouti, E., & van den Heuvel, M. (2015). Leader-
member exchange, work engagement, and job performance. Journal of
Managerial Psychology, 30(7), 754-770. doi:10.1108/JMP-03-2013-0088
Burr, V. (2003). Social constructionism. London, UK: Routledge.
Byrne, B. M. (1994). Structural equation modeling with EQS and EQS/Windows.
Thousand Oaks, CA: Sage Publications.
Byrne, B. M. (2010). Structural equation modeling with AMOS: Basic concepts,
applications, and programming (2nd ed.). New York, NY: Routledge.
Byrne, Z. S., Peters, J. M., & Weston, J. W. (2016). The struggle with employee

MEASURING LEADER-LEVEL ENGAGEMENT
97
engagement: Measures and construct clarification using five samples. Journal of
Applied Psychology, 101(9), 1201-1227
Campbell, D. T., & Fiske, D. W. (1959). Convergent and discriminant validation by the
multitraitmultimethod matrix. Psychological Bulletin, 56, 81-105.
Carmines, E. G., & Zeller, R. A. (1979). Reliability and validity assessment. Beverly
Hills, CA: Sage.
Cascio, W. F. (2000). Costing human resources: The financial impact of behavior in
organizations. Cincinnati, OH: South-Western College Pub.
Chen, X.-P, Hui, C., & Sego, D. J. (1998). The role of organizational citizenship behavior
in turnover: Conceptualization and preliminary tests of key hypotheses. Journal of
Applied Psychology, 83(6), 922-931.
Christian, M. S., Garza, A. S., & Slaughter, J. E. (2011). Work engagement: A
quantitative review and test of its relations with task and contextual performance.
Personnel Psychology, 64, 89-136.
Clark, L. A., & Watson, D. (1995). Constructing validity: Basic issues in objective scale
development. Psychological Assessment, 7, 309-319.
Comrey, A. L., & Lee, H. B. (1992). A first course in factor analysis. Hillsdale, NJ:
Erlbaum.
Courtright, S., Colbert, A., & Choi, D. (2014). Fired up or burned out? How
developmental challenge differentially impacts leader behavior. Journal of
Applied Psychology, 99(4), 681-696.
Crawford, E. R., LePine, J. A., & Rich, B. L. (2010). Linking job demands and resources

MEASURING LEADER-LEVEL ENGAGEMENT
98
to employee engagement and burnout: A theoretical extension and meta-analytic
test. Journal of Applied Psychology, 95, 834-848.
Cronbach, L.J., & Meehl, P.E. (1955). Construct validity in psychological tests.
Psychological Bulletin, 52(4), 281-302.
Deci, E. L., & Ryan, R. M. (1985). Intrinsic motivation and self-determination in human
behavior. New York, NY: Plenum.
De Lange, A.H., De Witte, H., & Notelaers, G. (2008). Should I stay or should I go?
Examining longitudinal relations among job resources and work engagement for
stayers versus movers. Work & Stress, 22(3), 201-223.
Demerouti, E., Bakker, A. B., de Jonge, J., Janssen, P. P., & Schaufeli, W. B. (2001).
Burnout and engagement at work as a function of demands and control.
Scandinavian Journal of Work, Environment & Health, 27(4), 279-286.
doi:10.5271/sjweh.615
Dicce, R. P., & Ewers, M. C. (2019). Becoming linked in: Leveraging professional
networks for elite surveys and interviews. Geographical Review, 1-12. Retreived
from https://doi.org/10.1111/gere.12346
Dusek, G. A., Yurova, Y. V., & Ruppel, C. P. (2015). Using social media and targeted
snowball sampling tosurvey a hard-to-reach population: A case study.
International Journal of Doctoral Studies, 10, 279-299. Retrieved
from http://ijds.org/Volume10/IJDSv10p279-299Dusek0717.pdf
Dvir, T., Eden, D., Avolio, B., & Shamir, B. (2002). Impact of transformational
leadership on follower development and performance: A field experiment.
Academy of Management Journal, 45, 735–744.

MEASURING LEADER-LEVEL ENGAGEMENT
99
Eisenberger, R., Huntington, R., Hutchison, S., & Sowa, D. (1986). Perceived
organizational support. Journal of Applied Psychology, 71(3), 500-507.
Emerson, R. M. (1976). Social exchange theory. Annual Review of Sociology, 2, 335-362.
Farahnak, L. R., Ehrhart, M. G., Torres, E. M., & Aarons, G. A. (2019). The influence of
transformational leadership and leader attitudes on subordinate attitudes and
implementation success. Journal of Leadership & Organizational Studies, 1-14.
https://doi.org/10.1177/1548051818824529
Gagné, P., & Hancock, G. R. (2006). Measurement model quality, sample size, and
solution propriety in confirmatory factor models. Multivariate Behavioral
Research, 41(1), 65–83. http://dx.doi.org/10.1207/s15327906mbr4101_5
Gao, S., Mokhtarian, P. L., & Johnston, R. A. (2008, January). Non-normality of data in
structural equation models. Paper presented at the 87th annual meeting of the
Transportation Research Board, Washington, DC:
https://escholarship.org/uc/item/7nf8f0v7
George, J. M., & Brief, A. P. (1992). Feeling good–doing good: A conceptual analysis of
the mood at work–organizational spontaneity relationship. Psychological Bulletin,
112, 310–329.
Gerstner, C. R., & Day, D. V. (1997). Meta-analytic review of leader-member exchange
theory: Correlates and construct issues. Journal of Applied Psychology, 82, 827-
844.
González-Romá, V., Schaufeli, W. B., Bakker, A. B., & Lloret, S. (2006). Burnout and
work engagement: Independent factors or opposite poles? Journal of Vocational
Behavior, 68(1), 165-174.

MEASURING LEADER-LEVEL ENGAGEMENT
100
Graen, G. B. (1976). Role-making processes within complex organizations. In M. D.
Dunnette (Ed.), Handbook of industrial and organizational psychology (pp. 1201-
1245). Chicago: Rand McNally.
Graen, G. B., Novak, M. A., & Sommerkamp, P. (1982). The effects of leader-member
exchange and job design on productivity and satisfaction: Testing a dual
attachment model. Organizational Behavior and Human Performance, 30, 109-
131.
Graen, G. B., & Uhl-Bien, M. (1995). Relationship-based approach to leadership:
Development of leader-member exchange (LMX) theory of leadership over 25
years: Applying a multi-level multi-domain perspective. Leadership Quarterly,
6(2), 219-247.
Gray, L. R. (2012). Nurse manager engagement: A concept analysis. Nursing Forum,
47(3), 193-199.
Gray, L. R., & Shirey, M. R. (2013). Nurse manager engagement. Nursing
Administration Quarterly, 37(4), 337-345. doi:10.1097/NAQ.0b013e3182a2fa15
Griffeth, R. W., Hom, P. W., & Gaertner, S. (2000). A meta-analysis of antecedents and
correlates of employee turnover: Update, moderator tests, and research
implications for the next millennium. Journal of Management, 26(3), 463–488.
Hackman, J. R., & Oldham, G. R. (1980). Work redesign. Reading, MA: Addison
Wesley.
Hair, J. F., Black, W. C., Babin, B. J., & Anderson, R. E. (2010). Multivariate data
analysis (7th ed.). Englewood Cliffs, NJ: Prentice Hall.
Halbesleben, J. R. B. (2010). A meta-analysis of work engagement: Relationships with

MEASURING LEADER-LEVEL ENGAGEMENT
101
burnout, demands, resources, and consequences. In A. B. Bakker & M. P. Leiter
(Eds.), Work engagement: A handbook of essential theory and research (pp. 102-
117). Hove, East Sussex: Psychology Press.
Harris, K. J., Harris, R. B., & Brouer, R. L. (2009). LMX and subordinate political skill:
Direct and interactive effects on turnover intentions and job satisfaction. Journal
of Applied Social Psychology, 39(10), 2373-2395.
Harris, K. J., Kacmar, K. M., & Witt, L. A. (2005). An examination of the curvilinear
relationship between leader-member exchange and intent to turnover. Journal of
Organizational Behavior, 26(4), 363-378.
Harter, J. K., Schmidt, F. L., & Hayes, T. L. (2002). Business-unit level relationship
between employee satisfaction, employee engagement, and business outcomes: A
meta-analysis. Journal of Applied Psychology, 87(2), 268-279.
Hildenbrand, K., Sacramento, C. A., & Binnewies, C. (2018). Transformational
leadership and burnout: The role of thriving and followers’ openness to
experience. Journal of Occupational Health Psychology, 23(1), 31-43.
Hoogendoorn, A. W. (2008). Response propensity. In P. J. Lavrakas (Ed.), Encyclopedia
of Survey Methods. Thousand Oaks, CA: Sage Publications.
http://dx.doi.org/10.4135/9781412963947.n489
Hooper, D., Coughlan, J., & Mullen, M. (2008). Structural equation modelling:
Guidelines to determining model fit. The Electronic Journal of Business Research
Methods, (6)1, 53-60. Retrieved from http://www.ejbrm.com/volume6/issue1/p53
Hu, L., & Bentler, P. M. (1999). Cut off criteria for fit indexes in covariance structure
MEASURING LEADER-LEVEL ENGAGEMENT
102
analysis: Conventional criteria versus new alternatives. Structural Equation
Modeling, 6, 1-55.
Isen, A. M., & Baron, R. A. (1991). Positive affect as a factor in organizational behavior.
Research in Organizational Behavior, 13, 1-53.
Jordan, P. J., & Troth, A. (2011). Emotional intelligence and leader member exchange:
The relationship with employee turnover intentions and job satisfaction.
Leadership & Organization Development Journal, 32(3), 260-280.
Judge, T. A., & Piccolo, R. F. (2004). Transformational and transactional leadership: A
meta-analytic test of their relative validity. Journal of Applied Psychology, 89(5),
755–768.
Judge, T. A., Thoresen, C. J., Bono, J. E., & Patton, G. K. (2001). The job satisfaction–
job performance relationship: A qualitative and quantitative review.
Psychological Bulletin, 127(3), 376-407
Kahn, W. A. (1990). Psychological conditions of personal engagement and
disengagement at work. Academy of Management Journal, 33(4), 692-724.
Kahn, W. A. (1992). To be full there: Psychological presence at work. Human
Relations, 45, 321-49.
Karmeni, K., Hamadi, A., Mesri, L., & Slim Ben Mimoun, M. (2017). The impact of
innovation on store managers’ job satisfaction: Evidence from Tunisian
retailing. Revue Management et Avenir, (93), 103–119.
Kerlinger, F. N. (1986). Foundations of behavioral research (3rd ed.). New York, NY:
Holt, Rhinehart, & Winston.
Kim, W., Kolb, J. A., & Kim, T. (2013). The relationship between work engagement and

MEASURING LEADER-LEVEL ENGAGEMENT
103
performance: A review of empirical literature and a proposed research agenda.
Human Resource Development Review, 12(3), 248-276.
Kline, R. B. (2005). Principles and practice of structural equation modeling (2nd ed.).
New York: Guilford.
Kline, R. B. (2011). Principles and practice of structural equation modeling (3rd ed.).
New York, NY: Guilford Press.
Kwon, K., & Park, J. (2019). The life cycle of employee engagement theory in HRD
research. Advances in Developing Human Resources, 21(3), 352-370.
Laing, R. D., Phillipson, H., & Lee, A. R. (1966). Interpersonal perception: A theory and
a method of research. Oxford, England: Springer.
Lanaj, K., Johnson, R. E., & Lee, S. M. (2016). Benefits of transformational behaviors
for leaders: A daily investigation of leader behaviors and need
fulfillment. Journal of Applied Psychology, 101(2), 237-251.
Laschinger, H., Purdy, N., & Almost, J. (2007). The impact of leader-member exchange
quality, empowerment, and core self-evaluation on nurse manager's job
satisfaction. Journal of Nursing Administration, 37(5), 221-229.
Lee, C., Esen, E., & DiNicola, S. (2017). Employee job satisfaction and engagement: The
doors of opportunity are open. Society for Human Resource Management, 1-12.
Retrieved from https://www.shrm.org/hr-today/trends-and-forecasting/research-
and-surveys/pages/2017-job-satisfaction-and-engagement-doors-of-opportunity-
are-open.aspx
Lee, J., & Peccei, R. (2007). Perceived organizational support and affective commitment:

MEASURING LEADER-LEVEL ENGAGEMENT
104
the mediating role of organization-based self-esteem in the context of job
insecurity. Journal of organizational behavior, 28(6), 661-685.
Liden, R. C., & Maslyn, J. M. (1998). Multidimensionality of leader-member exchange:
An empirical assessment through scale development. Journal of Management,
24(1), 43-72.
LinkedIn. (n.d.). Retrieved October 18, 2019 from https://www.linkedin.com/company/
linkedin/?src=direct%2Fnone&veh=direct%2Fnone
Locke, E. A. (1976). The nature and causes of job satisfaction. In M. D. Dunnette (Ed.),
Handbook of industrial and organizational psychology (pp. 1297-1349).
Chicago, IL: Rand McNally.
MacCallum, R. C., Browne, M. W., & Sugawara, H. M. (1996). Power analysis and
determination of sample size for covariance structure modeling. Psychological
Methods, 1(2), 130-149.
MacCallum, R. C., Widaman, K. F., Zhang, S., & Hong, S. (1999). Sample size in factor
analysis. Psychological methods, 4(1), 84-99.
McDonald, R. P. and Ho, M-H. R. (2002). Principles and practice in reporting statistical
equation analyses. Psychological Methods, 7(1), 64-82.
Macey, W.H., Scheinder, B., Barbera, K. M., & Young, S. A. (2009). Employee
engagement: Tools for analysis, practice, and competitive advantage. New York,
NY: Blackwell Press.
Maslach, C., & Leiter, M.P. (1997). The truth about burnout. New York, NY: Jossey-
Bass.
Maslach, C., Schaufeli, W. B., & Leiter, M. P. (2001). Job burnout. Annual Review of

MEASURING LEADER-LEVEL ENGAGEMENT
105
Psychology, 52, 397-422.
May, D. R., Gilson, R. L., & Harter, L. M. (2004). The psychological conditions of
meaningfulness, safety and availability and the engagement of the human spirit at
work. Journal of Occupational and Organizational Psychology, 77, 11-37.
http://dx.doi.org/10.1348/096317904322915892
Mayer, C.-H., Louw, L., & Baxter, J. (2015). Committed, motivated and joyful? Job
satisfaction and organisational commitment of managers at a South African public
utility. Acta Commercii, 15(1), 1–12.
McFeely, S., & Wigert, B. (2019, April). This fixable problem costs U.S. businesses $1
trillion. Retried from https://www.gallup.com/workplace/247391/fixable-
problem-costs-businesses-trillion.aspx
Meyer, J. P., & Allen, N. J. (1991). A three-component conceptualization of
organizational commitment. Human Resource Management Review, 1(1), 61-89.
Mobley, W. H. (1977). Intermediate linkages in the relationship between job satisfaction
and employee turnover. Journal of Applied Psychology, 62(2), 237-240.
Mowday, R. T., Porter, L. W., & Steers, R. M. (1982). Organizational linkages: The
psychology of commitment, absenteeism, and turnover. San Diego, CA: Academic
Press.
Nimon, K., Zigarmi, D., Houson, D., Witt, D., & Diehl, J. (2011). The work cognition
inventory: Initial evidence of construct validity. Human Resources Development
Quarterly, 22, 7-35. doi: 10.1002/hrdq.20064
Nunnally, J. C. (1978). Psychometric theory. New York, NY: McGraw-Hill.
Nunnally, J. C., & Bernstein, J. H. (1994). Psychometric theory (3rd ed.). New York,
MEASURING LEADER-LEVEL ENGAGEMENT
106
NY: McGraw-Hill.
Oldendick, R. (2008). Question order effects. In P. J. Lavrakas (Ed.), Encyclopedia of
survey research methods (pp. 664-665). Thousand Oaks, CA: Sage Publications.
Organ, D. W. (1988). Issues in organization and management series. Organizational
citizenship behavior: The good soldier syndrome. Lexington, MA, England:
Lexington Books/D. C. Heath and Com.
Organ, D. W., & Near, J. P. (1985). Cognition vs. affect in measures of job satisfaction.
International Journal of Psychology, 20, 241-253.
Organ, D. W. and Ryan, K. (1995). A meta‐analytic review of attitudinal and
dispositional predictors of organizational citizenship behavior. Personnel
Psychology, 48(4), 775-802
Pantouvakis, A., & Mpogiatzidis, P. (2013) The impact of internal service quality and
learning organization on clinical leaders' job satisfaction in hospital care services.
Leadership in Health Services, 26(1), 34 – 49.
Peterson, R. A. (1994). A meta-analysis of Cronbach's coefficient alpha. Journal of
Consumer Research, 21(2), 381-391.
Podsakoff, N. P., Whiting, S. W., Podsakoff, P. M., & Blume, B. D. (2009). Individual-
and organizational-level consequences of organizational citizenship behaviors: A
meta-analysis. Journal of Applied Psychology, 94(1), 122-141.
Podsakoff, P. M., MacKenzie, S. B., & Bommer, W. H. (1996). Transformational
leadership behaviors and substitutes for leadership as determinants of employee
satisfaction, commitment, trust, and organizational citizenship behaviors. Journal
of Management, 22(2), 259-298.

MEASURING LEADER-LEVEL ENGAGEMENT
107
Podsakoff, P. M., MacKenzie, S. B., Jeong-Yeon, L., & Podsakoff, N. P. (2003).
Common method biases in behavioral research: A critical review of the literature
and recommended remedies. Journal of Applied Psychology, 88(5), 879-903.
Podsakoff, P. M., MacKenzie, S. B., & Podsakoff, N. P. (2012). Sources of method bias
in social science research and recommendations on how to control it. Annual
Review of Psychology, 63, 539–569.
Renn, R. W., & Vanderberg, R. J. (1995). The critical psychological states: An
underrepresented component in job characteristics model research. Journal of
Management, 21(2), 279-303.
Rhoades, L., & Eisenberger, R. (2002). Perceived organizational support: A review of the
literature. Journal of Applied Psychology, 87(4), 698-714. doi: 10.1037//0021-
9010.87.4.698
Rhoades, L., Eisenberger, R., & Armeli, S. (2001). Affective commitment to the
organization: The contribution of perceived organizational support. Journal of
Applied Psychology, 86(5), 825-836.
Rich, B. L., LePine, J. A., & Crawford, E. R. (2010). Job engagement: Antecedents and
effects on job performance. Academy of Management Journal, 53(3), 617-635.
doi:10.5465/AMJ.2010.51468988
Richardson, H. A., Simmering, M. J., & Sturman, M. C. (2009). A tale of three
perspectives: Examining post hoc statistical techniques for detection and
correction of common method variance. Organizational Research Methods, 12(4),
762–800.
Robinson, J. (2010, November). Leading engagement from the top. Retrieved from
MEASURING LEADER-LEVEL ENGAGEMENT
108
http://www.gallup.com/businessjournal/144140/Leading-Engagement-Top.aspx
Rothbard, N. P. (2001). Enriching or depleting: The dynamics of engagement in work
and family roles. Administrative Science Quarterly, 46, 655-684. doi:
10.2307/3094827
Ryan, R. M., & Deci, E. L. (2000). Self-determination theory and the facilitation of
intrinsic motivation, social development, and well-being. American Psychologist,
55(1), 68-78.
Saks, A. M. (2006). Antecedents and consequences of employee engagement. Journal of
Managerial Psychology, 21(7), 600-619.
Saks, A. M. (2019). Antecedents and consequences of employee engagement revisited.
Journal of Organizational Effectiveness: People and Performance, 6(1), 19-38.
Saks, A. M., & Gruman, J. A. (2014). What do we really know about employee
engagement? Human Resource Development Quarterly, 25(2), 155-182.
Salanova, M., & Schaufeli, W. B. (2008). A cross-national study of work engagement as
a mediatory between job resources and proactive behavior. International Journal
of Human Resource Management, 19(1), 116-131.
Saumure, K., & Given, L. M. (2008). Convenience sampling. In L. M. Given
(Ed.), The SAGE Encyclopedia of Qualitative Research Methods (pp. 125).
Thousand Oaks, CA: Sage Publications.
Schafer, J. L. (1999). Multiple imputation: A primer. Statistical Methods in Medical
Research, 8(1), 3-15.
Schaufeli, W. B., Salanova, M., González-Romá, V., & Bakker, A. B. (2002). The

MEASURING LEADER-LEVEL ENGAGEMENT
109
measurement of engagement and burnout: A two sample confirmatory factory
analytic approach. Journal of Happiness Studies, 3, 71-92.
Schneider, B., Yost, A. B., Kropp, A., Kind, C., & Lam, H. (2017). Workforce
engagement: What it is, what drives it, and why it matters for organizational
performance. Journal of Organizational Behavior, 39(4), 462–480.
https://doi.org/10.1002/job.2244
Schuman, H., Kalton, G., & Ludwig, J. (1983). Context and contiguity in survey
questionnaires. Public Opinion Quarterly, 47(1), 112-115.
Schwandt, T. A. (2003). Three epistemological stances for qualitative inquiry:
Interpretativism, hermeneutics and social constructionism. In Denzin, N. and
Lincoln, Y (Eds.), The Landscape of Qualitative Research: Theories and Issues
(pp. 292-331). Thousand Oaks, CA: Sage.
Settoon, R. P., Bennett, N., & Liden, R. C. (1996). Social exchange in organizations:
Perceived organizational support, leader–member exchange, and employee
reciprocity. Journal of Applied Psychology, 81(3), 219-227.
Shuck, B., Adelson, J. L., & Reio, T. G. (2017). The Employee Engagement Scale: Initial
evidence for construct validity and implications for theory and practice. Human
Resource Management, (56)6, 953-977. doi:10.1002/hrm.21811
Shuck, B., Osam, K., Zigarmi, D., & Nimon, K. (2017). Definitional and conceptual
muddling: Identifying the positionality of employee engagement and defining the
construct. Human Resource Development Review, 16(3), 263-293.
Shuck, B., Reio, T. G., & Rocco, T. S. (2011). Employee engagement: An examination of
antecedent and outcome variables. Human Resource Development International,

MEASURING LEADER-LEVEL ENGAGEMENT
110
14(4), 427-445.
Shuck, B., Twyford, D., Reio, T. G., Jr., & Shuck, A. (2014). Human resource
development practices and employee engagement: Examining the connection with
employee turnover intentions. Human Resource Development Quarterly, 25(2),
239-270.
Shuck, B. & Wollard, K. (2010). Employee engagement and HRD: A seminal review of
the foundations. Human Resource Development Review, 9(1), 89-110.
Soane, E., Truss, C., Alfes, K., Shantz, A., Rees, C., & Gatenby, M. (2012). Development
and application of a new measure of employee engagement: The ISA Engagement
Scale. Human Resource Development International, 15(5), 529-547.
Spector, P. (1997). Job satisfaction: Application, assessment, causes, and consequences.
Thousand Oaks, CA: Sage Publications.
Steiger, J.H., Shapiro, A. & Browne, M.W. (1985). On the multivariate asymptotic
distribution of sequential chi-square statistics. Psychometrika, 50(3), 253–263.
Stumpf, S. A., Tymon, W. G., Jr., & van Dam, N. H. M. (2013). Felt and behavioral
engagement in workgroups of professionals. Journal of Vocational Behavior, 83,
255-264.
Tabachnick, B.G., & Fidell L.S. (2013). Using multivariate statistics (6th ed.). Upper
Saddle River, NJ: Pearson.
Tarique, I., & Schuler, R. S. (2010). Global talent management: Literature review,
integrative framework, and suggestions for further research. Journal of World
Business, 45(2), 122-133.
Tett, R. P., & Meyer, J. P. (1993). Job satisfaction, organizational commitment,

MEASURING LEADER-LEVEL ENGAGEMENT
111
turnover intention, and turnover: Path analyses based on meta-analytic findings.
Personnel Psychology, 46(2), 259-293. doi:10.1111/j.1744-6570.1993.tb00874.x
Truss, C., Alfes, K., Delbridge, R., Shantz, A. & Soane, E. (2014). Employee
engagement in theory and practice. London, UK: Routledge.
Uprichard, E. (2013). Sampling: Bridging probability and non-probability designs.
International Journal Of Social Research Methodology, 16(1), 1-11.
U.S. Bureau of Labor Statistics. Job Openings and Labor Turnover Survey. Retrieved
from https://www.bls.gov/jlt/.
Vecchio, R. P., Griffith, R. W., & Hom, P. W. (1986). The predictive utility of the
vertical dyad linkage approach. Journal of Social Psychology, 126, 617-625.
Viljevac, A., Cooper-Thomas, H. D., & Saks, A. M. (2012). An investigation into the
validity of two measure of work engagement. International Journal of Human
Resource Management, 23(17), 3692-3709. doi:10.1080/09585192.2011.639542
Watters, J., & Biernacki, P. (1989). Targeted sampling: Options for the study of hidden
populations. Social Problems, 36(4), 416-430.
Weiss, H. M., & Cropanzano, R. (1996). Affective events theory: A theoretical
discussion of the structure, causes and consequences of affective experiences at
work. Research In Organizational Behavior, 18(1), 1-74.
Welbourne, T. M. (2007). Employee engagement: Beyond the fad and into the executive
suite. Leader to Leader, 2007(44), 45-51.
Xanthopoulou, D., Bakker, A. B., Demerouti, E., & Schaufeli, W. B., (2009). Work
engagement and financial returns: A diary study on the role of job and personal
resources. Journal of Occupational and Organizational Psychology, 82, 183-200.
MEASURING LEADER-LEVEL ENGAGEMENT
112
Yang, H. (2010). Factor loadings. In N. J. Salkind (Ed.), Encyclopedia of Survey
Methods. Thousand Oaks, CA: Sage Publications.
http://dx.doi.org/10.4135/9781412961288.n149
Zhao, K., Zhang, M., Kraimer, M. L., & Yang, B. (2019). Source attribution matters:
Mediation and moderation effects in the relationship between work�to�family
conflict and job satisfaction. Journal of Organizational Behavior, 40(4), 492–505.

MEASURING LEADER-LEVEL ENGAGEMENT
113
APPENDIX A Employee Engagement Scale (EES; Shuck et al., 2017) Survey Instructions: Please answer the following by indicating the extent to which you agree or disagree with how the statement describes how you feel about the work environment you are in right now from your perspective as a supervisor/manager. Within the survey, the following terms will be defined as: Focused = direction of attention or efforts Expected = fulfilling the requirements of my work role 1. I am really focused when I am working. 2. I concentrate on my job when I am at work. 3. I give my job responsibility a lot of attention. 4. At work, I am focused on my job. 5. Working at my current organization has a great deal of personal meaning to me. 6. I feel a strong sense of belonging to my job. 7. I believe in the mission and purpose of my company. 8. I care about the future of my company. 9. I really push myself to work beyond what is expected of me. 10. I am willing to put in extra effort without being asked. 11. I often go above what is expected of me to help my team be successful. 12. I work harder than expected to help my company be successful. 5-point Likert scale (1 = strongly disagree, 2 = disagree, 3 = neutral, 4 = agree, 5 = strongly agree)

MEASURING LEADER-LEVEL ENGAGEMENT
114
APPENDIX B
Permission to use the Employee Engagement Scale (EES) Authors’ Note The employee engagement scale (EES) and cognitive work appraisal scale-11 (CWAS-11) are permitted for broad use in noncommercial settings, including but not limited to academically focused research to include dissertations and theses and original works of scholarship and grant activity within the limitations of the publication copyright, so long as this work is appropriately and correctly cited. To use either instrument in a commercial or for-profit setting, or for questions regarding permission of use, please contact Brad Shuck at [email protected]. An earlier version of this manuscript was presented at the 2015 AHRD International Conference. Shuck, B., Adelson, J. L., & Reio, T. G. (2017). The Employee Engagement Scale: Initial
evidence for construct validity and implications for theory and practice. Human Resource Management, (56)6, 953-977. doi:10.1002/hrm.21811

MEASURING LEADER-LEVEL ENGAGEMENT
115
APPENDIX C
IRB Approval