Embed Size (px)
Citation preview
Page 1
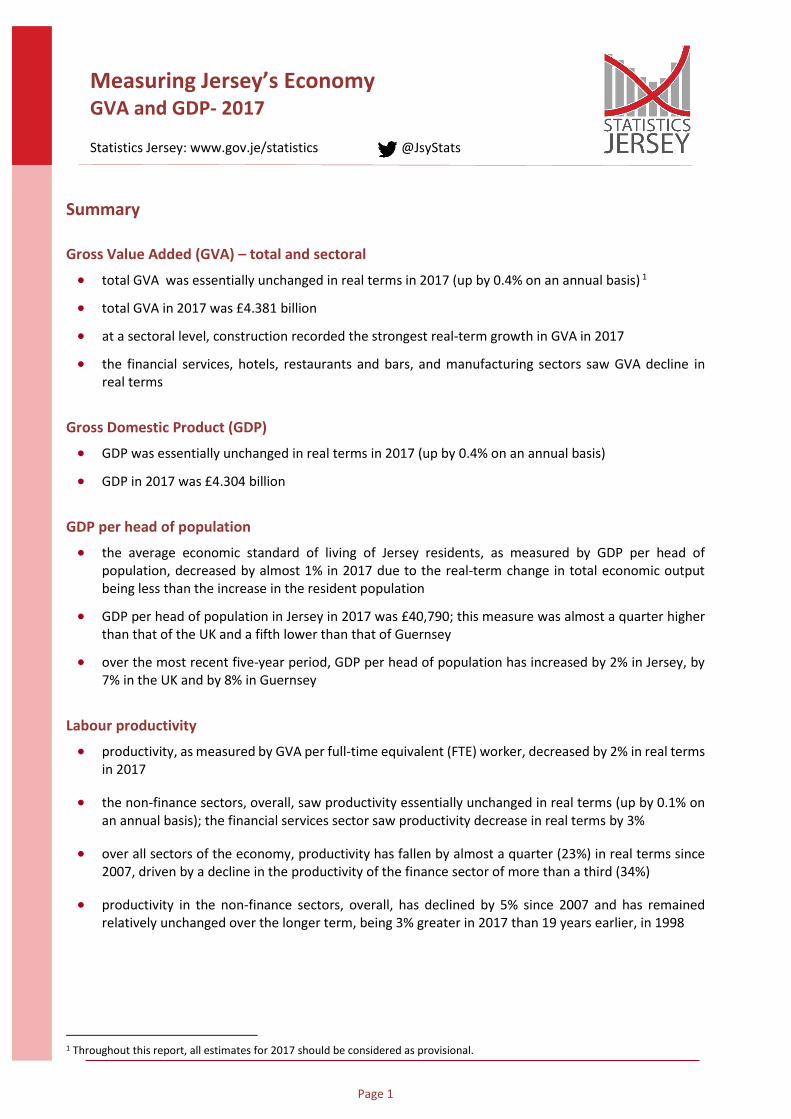
Measuring Jersey’s Economy GVA and GDP- 2017
Statistics Jersey: www.gov.je/statistics @JsyStats
Summary
Gross Value Added (GVA) – total and sectoral
total GVA was essentially unchanged in real terms in 2017 (up by 0.4% on an annual basis) 1
total GVA in 2017 was £4.381 billion
at a sectoral level, construction recorded the strongest real-term growth in GVA in 2017
the financial services, hotels, restaurants and bars, and manufacturing sectors saw GVA decline inreal terms
Gross Domestic Product (GDP)
GDP was essentially unchanged in real terms in 2017 (up by 0.4% on an annual basis)
GDP in 2017 was £4.304 billion
GDP per head of population
the average economic standard of living of Jersey residents, as measured by GDP per head ofpopulation, decreased by almost 1% in 2017 due to the real-term change in total economic outputbeing less than the increase in the resident population
GDP per head of population in Jersey in 2017 was £40,790; this measure was almost a quarter higherthan that of the UK and a fifth lower than that of Guernsey
over the most recent five-year period, GDP per head of population has increased by 2% in Jersey, by7% in the UK and by 8% in Guernsey
Labour productivity
productivity, as measured by GVA per full-time equivalent (FTE) worker, decreased by 2% in real termsin 2017
the non-finance sectors, overall, saw productivity essentially unchanged in real terms (up by 0.1% onan annual basis); the financial services sector saw productivity decrease in real terms by 3%
over all sectors of the economy, productivity has fallen by almost a quarter (23%) in real terms since2007, driven by a decline in the productivity of the finance sector of more than a third (34%)
productivity in the non-finance sectors, overall, has declined by 5% since 2007 and has remainedrelatively unchanged over the longer term, being 3% greater in 2017 than 19 years earlier, in 1998
1 Throughout this report, all estimates for 2017 should be considered as provisional.
Page 2
Gross Value Added, GVA
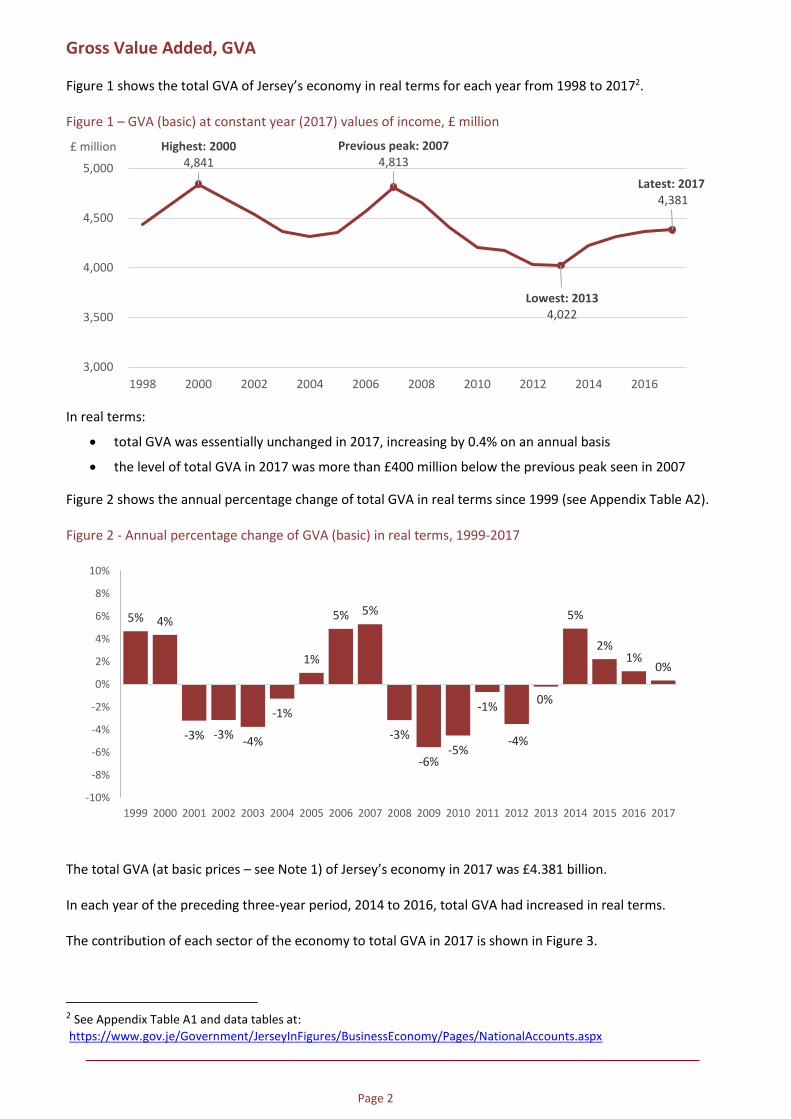
Figure 1 shows the total GVA of Jersey’s economy in real terms for each year from 1998 to 20172.
Figure 1 – GVA (basic) at constant year (2017) values of income, £ million
In real terms:
total GVA was essentially unchanged in 2017, increasing by 0.4% on an annual basis
the level of total GVA in 2017 was more than £400 million below the previous peak seen in 2007
Figure 2 shows the annual percentage change of total GVA in real terms since 1999 (see Appendix Table A2).
Figure 2 - Annual percentage change of GVA (basic) in real terms, 1999-2017
The total GVA (at basic prices – see Note 1) of Jersey’s economy in 2017 was £4.381 billion.
In each year of the preceding three-year period, 2014 to 2016, total GVA had increased in real terms.
The contribution of each sector of the economy to total GVA in 2017 is shown in Figure 3.
2 See Appendix Table A1 and data tables at:
https://www.gov.je/Government/JerseyInFigures/BusinessEconomy/Pages/NationalAccounts.aspx
Highest: 20004,841
Previous peak: 20074,813
Lowest: 20134,022
Latest: 2017 4,381
3,000
3,500
4,000
4,500
5,000
1998 2000 2002 2004 2006 2008 2010 2012 2014 2016
£ million
5% 4%
-3% -3%-4%
-1%
1%
5% 5%
-3%
-6%-5%
-1%
-4%
0%
5%
2%1%
0%
-10%
-8%
-6%
-4%
-2%
0%
2%
4%
6%
8%
10%
1999 2000 2001 2002 2003 2004 2005 2006 2007 2008 2009 2010 2011 2012 2013 2014 2015 2016 2017
Page 3
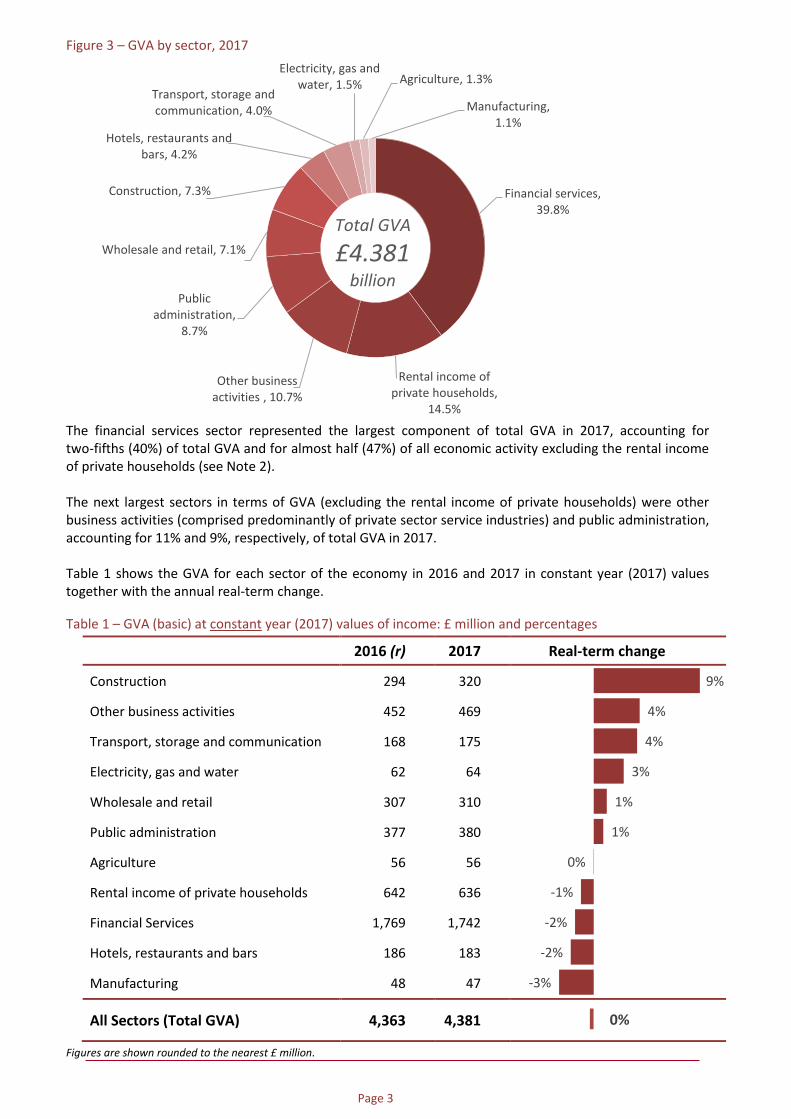
Figure 3 – GVA by sector, 2017
The financial services sector represented the largest component of total GVA in 2017, accounting for two-fifths (40%) of total GVA and for almost half (47%) of all economic activity excluding the rental income of private households (see Note 2).
The next largest sectors in terms of GVA (excluding the rental income of private households) were other business activities (comprised predominantly of private sector service industries) and public administration, accounting for 11% and 9%, respectively, of total GVA in 2017.
Table 1 shows the GVA for each sector of the economy in 2016 and 2017 in constant year (2017) values together with the annual real-term change.
Table 1 – GVA (basic) at constant year (2017) values of income: £ million and percentages
2016 (r) 2017 Real-term change
Construction 294 320
Other business activities 452 469
Transport, storage and communication 168 175
Electricity, gas and water 62 64
Wholesale and retail 307 310
Public administration 377 380
Agriculture 56 56
Rental income of private households 642 636
Financial Services 1,769 1,742
Hotels, restaurants and bars 186 183
Manufacturing 48 47
All Sectors (Total GVA) 4,363 4,381
Figures are shown rounded to the nearest £ million.
Financial services, 39.8%
Rental income of private households,
14.5%
Other business activities , 10.7%
Public administration,
8.7%
Wholesale and retail, 7.1%
Construction, 7.3%
Hotels, restaurants and bars, 4.2%
Transport, storage and communication, 4.0%
Electricity, gas and water, 1.5% Agriculture, 1.3%
Manufacturing, 1.1%
Total GVA
£4.381 billion
-3%
-2%
-2%
-1%
0%
1%
1%
3%
4%
4%
9%
0%
Page 4
The principal upward drivers to the real-term change of total GVA in 2017 were the construction sector and the private sector service industries, which recorded real-term increases in GVA in 2017 of £26 million and £17 million, respectively. Construction also recorded the greatest percentage increase in GVA.
In contrast, manufacturing, hotels restaurants and bars, and financial services saw GVA decline in real-terms in 2017.
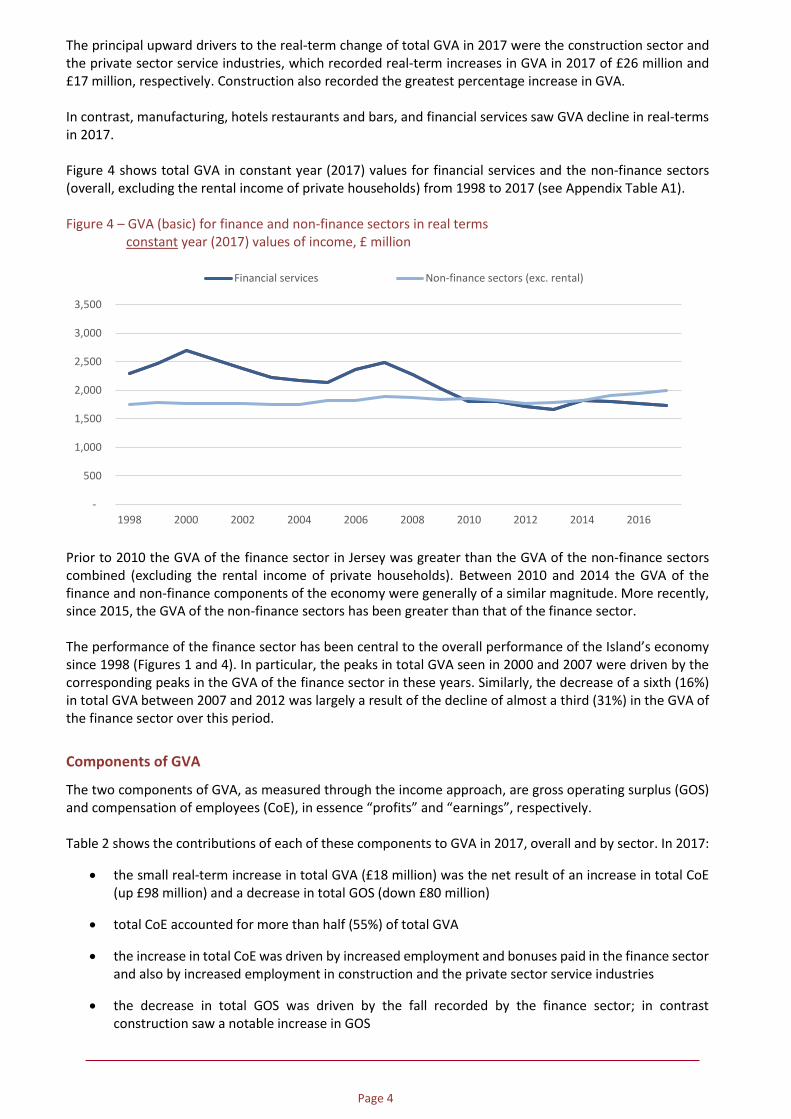
Figure 4 shows total GVA in constant year (2017) values for financial services and the non-finance sectors (overall, excluding the rental income of private households) from 1998 to 2017 (see Appendix Table A1).
Figure 4 – GVA (basic) for finance and non-finance sectors in real terms constant year (2017) values of income, £ million
Prior to 2010 the GVA of the finance sector in Jersey was greater than the GVA of the non-finance sectors combined (excluding the rental income of private households). Between 2010 and 2014 the GVA of the finance and non-finance components of the economy were generally of a similar magnitude. More recently, since 2015, the GVA of the non-finance sectors has been greater than that of the finance sector.
The performance of the finance sector has been central to the overall performance of the Island’s economy since 1998 (Figures 1 and 4). In particular, the peaks in total GVA seen in 2000 and 2007 were driven by the corresponding peaks in the GVA of the finance sector in these years. Similarly, the decrease of a sixth (16%) in total GVA between 2007 and 2012 was largely a result of the decline of almost a third (31%) in the GVA of the finance sector over this period.
Components of GVA
The two components of GVA, as measured through the income approach, are gross operating surplus (GOS) and compensation of employees (CoE), in essence “profits” and “earnings”, respectively.
Table 2 shows the contributions of each of these components to GVA in 2017, overall and by sector. In 2017:
the small real-term increase in total GVA (£18 million) was the net result of an increase in total CoE(up £98 million) and a decrease in total GOS (down £80 million)
total CoE accounted for more than half (55%) of total GVA
the increase in total CoE was driven by increased employment and bonuses paid in the finance sectorand also by increased employment in construction and the private sector service industries
the decrease in total GOS was driven by the fall recorded by the finance sector; in contrastconstruction saw a notable increase in GOS
-
500
1,000
1,500
2,000
2,500
3,000
3,500
1998 2000 2002 2004 2006 2008 2010 2012 2014 2016
Financial services Non-finance sectors (exc. rental)
Page 5
the largest upward contributors to the real-term change in total GVA in 2017 were the construction and private sector service industries; the largest downward contributor was the finance sector
financial services accounted for more than two-fifths (44%) of total GOS and for more than a third (37%) of total CoE
Table 2 – Gross Operating Surplus (GOS) and Compensation of Employees (CoE) in 2017
and real-term annual change in GOS, CoE and GVA, £ million
£ million Real-term annual change
GOS COE GOS CoE GVA
Agriculture 20 36 1 -1 0
Manufacturing 8 39 -2 0 -1
Electricity, gas and water 33 31 1 1 2
Construction 92 228 17 9 26
Wholesale and retail 124 187 3 1 3
Hotels, restaurants and bars 53 130 -6 2 -4
Transport, storage and communication
55 119 3 3 6
Financial services 859 883 -89 62 -28
Other business activities 83 386 -1 18 17
Rental income of private households
636 0 -7 0 -7
Public administration 0 380 0 3 3
Total 1,963 2,418 -80 98 18
Figures are shown rounded to the nearest £ million; hence components may not sum to row or column totals
Gross Domestic Product
On an annual basis, Jersey’s GDP was essentially unchanged in 2017, increasing by £19 million in real terms from £4,285 million in 2016 to £4,304 million in 2017 (see Appendix Table A1), representing a real-term increase of 0.4%.
Page 6
GVA and GDP per head of population
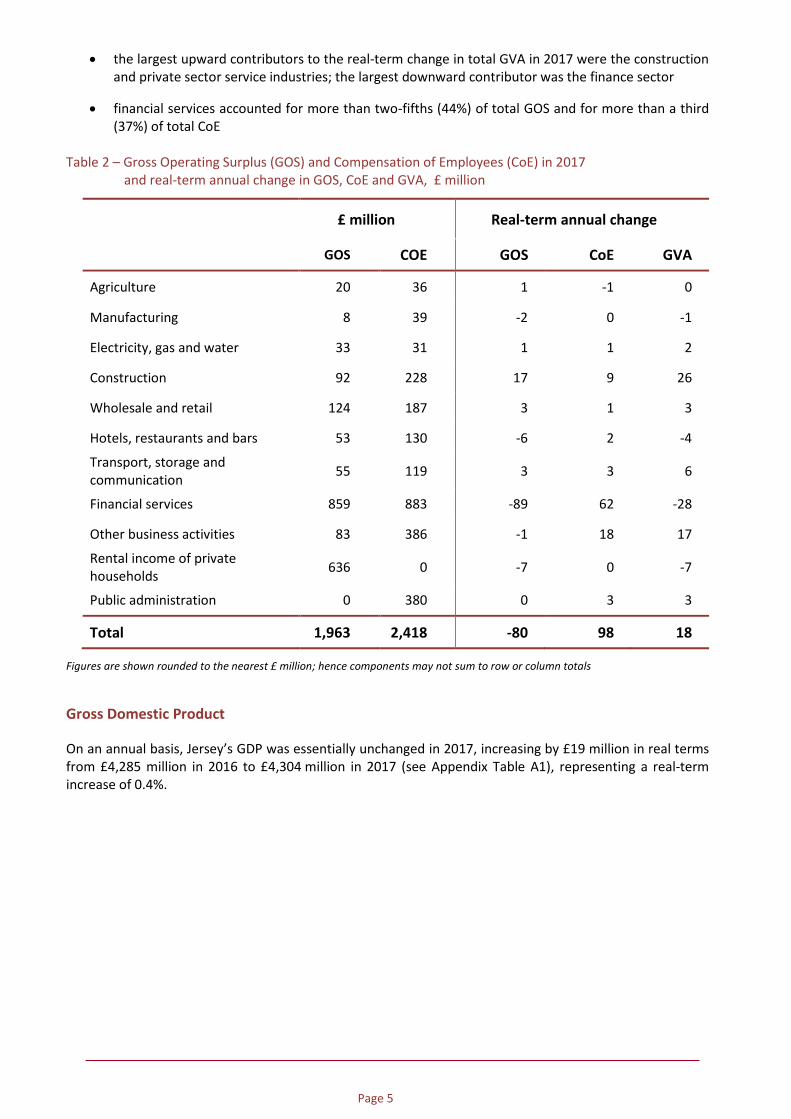
Expressing national accounting aggregates such as GDP and GVA on a per capita basis (i.e. per head of population) provides a broad indicator of the average economic standard of living for the resident population. In 2017 GDP per head of population in Jersey was £40,790. In real-terms, GDP per head of population decreased by almost 1% in 2017. A longer period perspective of the real-term change in the average economic standard of living of Jersey residents may be examined by considering GVA per head in constant year values. The two components of this analysis, the resident population and the total GVA in constant year (2017) values, are shown in Figure 5 for the period 2000 to 20173.
Figure 5 – Jersey’s resident population and total GVA (basic) in real terms (£ million), 2000 to 2017
The total GVA of Jersey’s economy in 2017 was 10% lower than in 2000. Over the same period the resident population increased by more than 17,000 people, an increase in population of almost a fifth (19%). Figure 6 shows GVA per head in constant year (2017) values over this period (see Appendix Table A6).
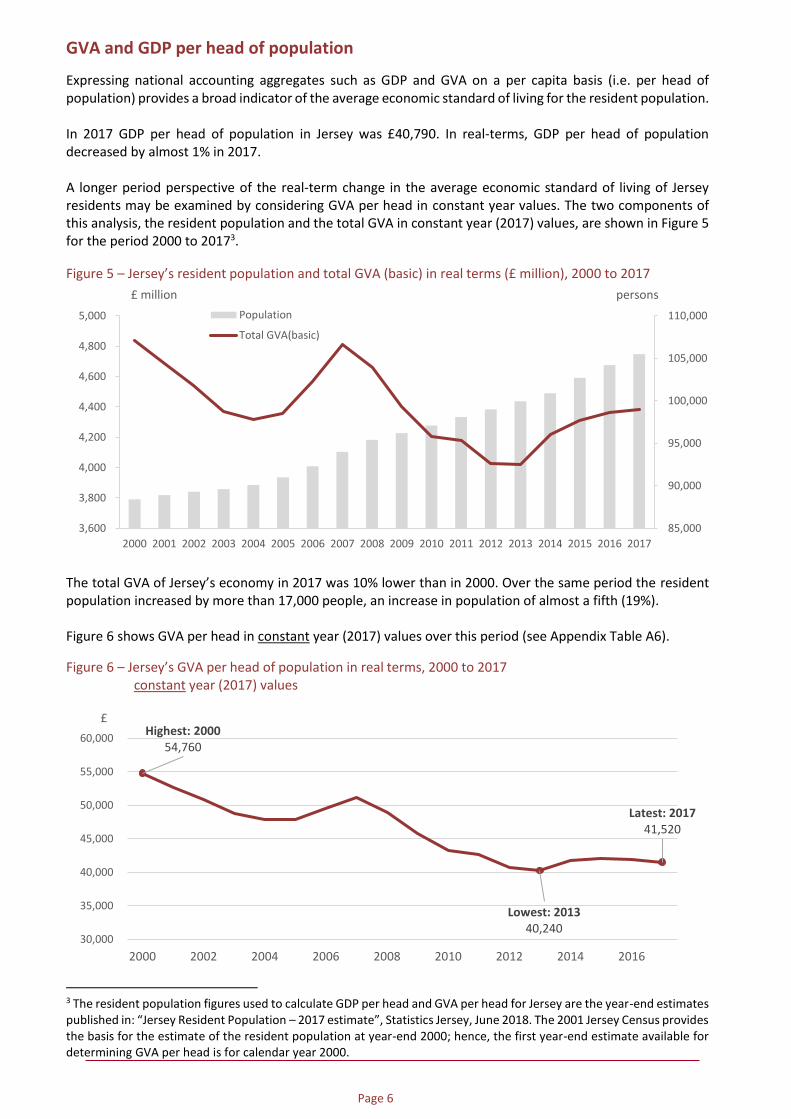
Figure 6 – Jersey’s GVA per head of population in real terms, 2000 to 2017 constant year (2017) values
3 The resident population figures used to calculate GDP per head and GVA per head for Jersey are the year-end estimates published in: “Jersey Resident Population – 2017 estimate”, Statistics Jersey, June 2018. The 2001 Jersey Census provides the basis for the estimate of the resident population at year-end 2000; hence, the first year-end estimate available for determining GVA per head is for calendar year 2000.
85,000
90,000
95,000
100,000
105,000
110,000
3,600
3,800
4,000
4,200
4,400
4,600
4,800
5,000
2000 2001 2002 2003 2004 2005 2006 2007 2008 2009 2010 2011 2012 2013 2014 2015 2016 2017
persons£ million
Population
Total GVA(basic)
Highest: 200054,760
Lowest: 201340,240
Latest: 2017 41,520
30,000
35,000
40,000
45,000
50,000
55,000
60,000
2000 2002 2004 2006 2008 2010 2012 2014 2016
£
Page 7
Over the period from 2000 to 2017, the GVA per head of population in Jersey decreased by almost a quarter (24%) in real terms. Most of this long-term decline occurred after 2007; between 2007 and 2017 the GVA per head of population in Jersey decreased by almost a fifth (19%). In the latest year, 2017, GVA per head of population decreased by almost 1% in real terms. Comparison with Guernsey and the UK4
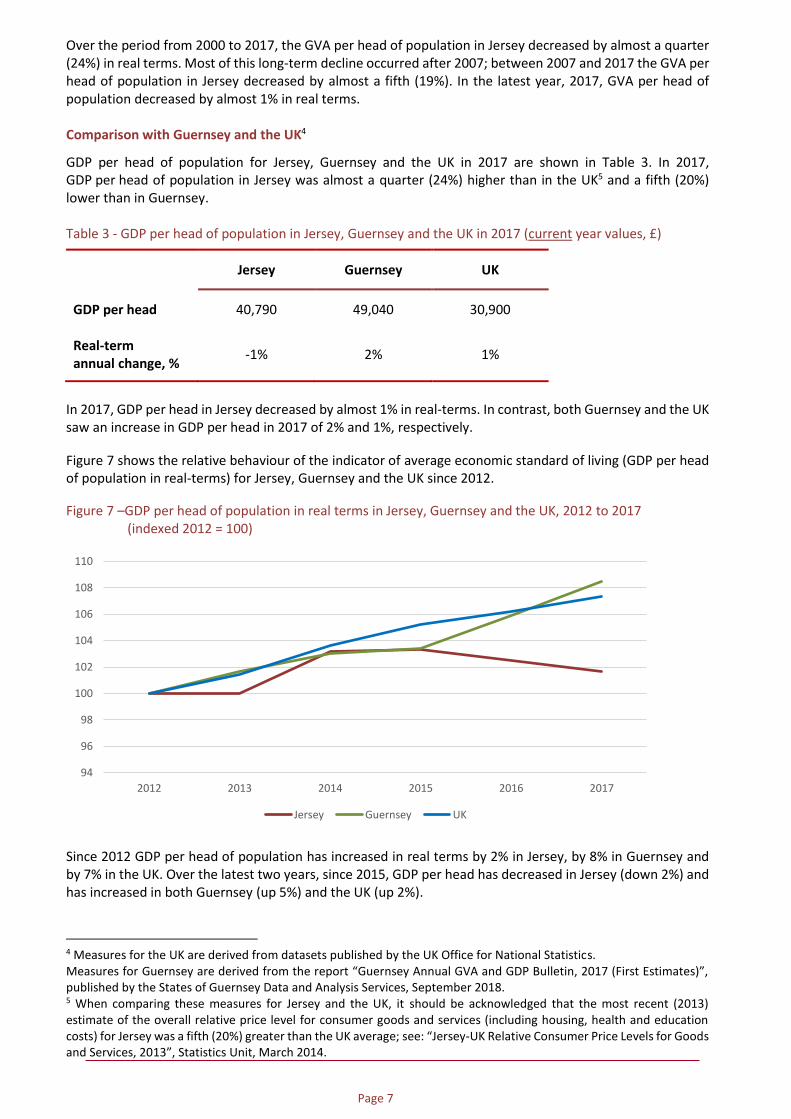
GDP per head of population for Jersey, Guernsey and the UK in 2017 are shown in Table 3. In 2017, GDP per head of population in Jersey was almost a quarter (24%) higher than in the UK5 and a fifth (20%) lower than in Guernsey. Table 3 - GDP per head of population in Jersey, Guernsey and the UK in 2017 (current year values, £)
Jersey Guernsey UK
GDP per head 40,790 49,040 30,900
Real-term annual change, %
-1% 2% 1%
In 2017, GDP per head in Jersey decreased by almost 1% in real-terms. In contrast, both Guernsey and the UK saw an increase in GDP per head in 2017 of 2% and 1%, respectively.
Figure 7 shows the relative behaviour of the indicator of average economic standard of living (GDP per head of population in real-terms) for Jersey, Guernsey and the UK since 2012.
Figure 7 –GDP per head of population in real terms in Jersey, Guernsey and the UK, 2012 to 2017 (indexed 2012 = 100)
Since 2012 GDP per head of population has increased in real terms by 2% in Jersey, by 8% in Guernsey and by 7% in the UK. Over the latest two years, since 2015, GDP per head has decreased in Jersey (down 2%) and has increased in both Guernsey (up 5%) and the UK (up 2%).
4 Measures for the UK are derived from datasets published by the UK Office for National Statistics. Measures for Guernsey are derived from the report “Guernsey Annual GVA and GDP Bulletin, 2017 (First Estimates)”, published by the States of Guernsey Data and Analysis Services, September 2018. 5 When comparing these measures for Jersey and the UK, it should be acknowledged that the most recent (2013) estimate of the overall relative price level for consumer goods and services (including housing, health and education costs) for Jersey was a fifth (20%) greater than the UK average; see: “Jersey-UK Relative Consumer Price Levels for Goods and Services, 2013”, Statistics Unit, March 2014.
94
96
98
100
102
104
106
108
110
2012 2013 2014 2015 2016 2017
Jersey Guernsey UK
Page 8
Labour productivity
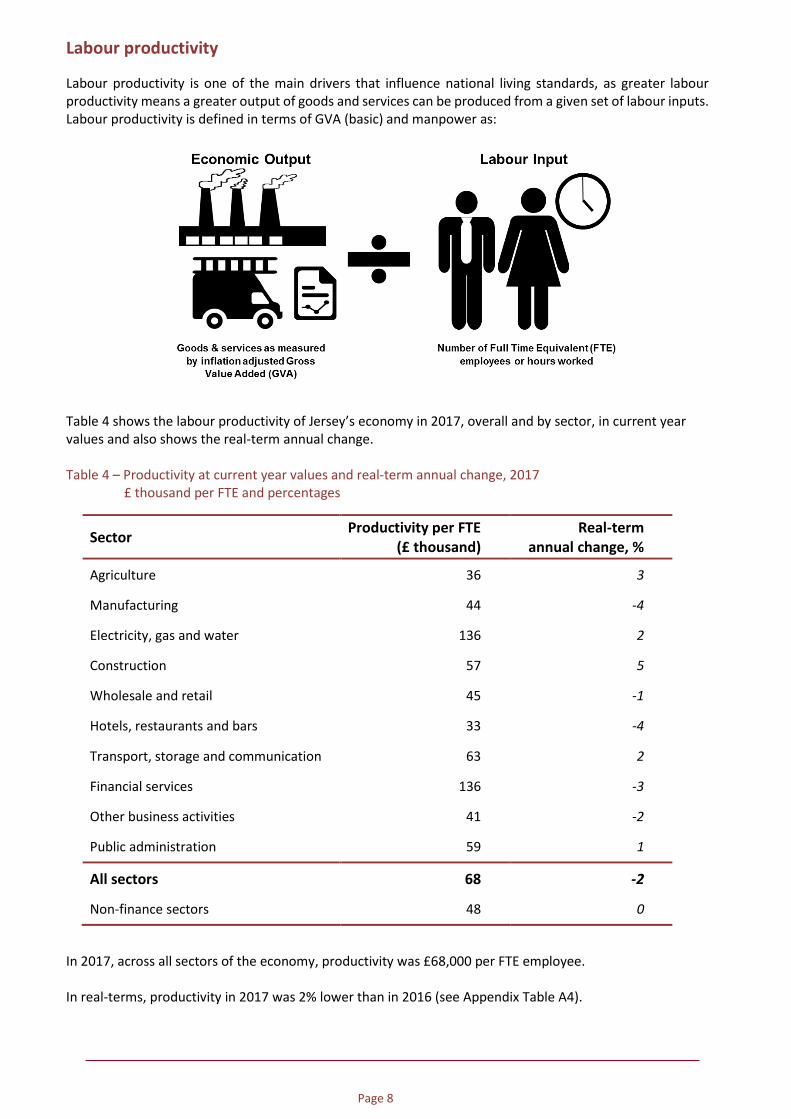
Labour productivity is one of the main drivers that influence national living standards, as greater labour productivity means a greater output of goods and services can be produced from a given set of labour inputs. Labour productivity is defined in terms of GVA (basic) and manpower as:
Table 4 shows the labour productivity of Jersey’s economy in 2017, overall and by sector, in current year values and also shows the real-term annual change. Table 4 – Productivity at current year values and real-term annual change, 2017
£ thousand per FTE and percentages
Sector Productivity per FTE
(£ thousand) Real-term
annual change, %
Agriculture 36 3
Manufacturing 44 -4
Electricity, gas and water 136 2
Construction 57 5
Wholesale and retail 45 -1
Hotels, restaurants and bars 33 -4
Transport, storage and communication 63 2
Financial services 136 -3
Other business activities 41 -2
Public administration 59 1
All sectors 68 -2
Non-finance sectors 48 0
In 2017, across all sectors of the economy, productivity was £68,000 per FTE employee. In real-terms, productivity in 2017 was 2% lower than in 2016 (see Appendix Table A4).
Page 9
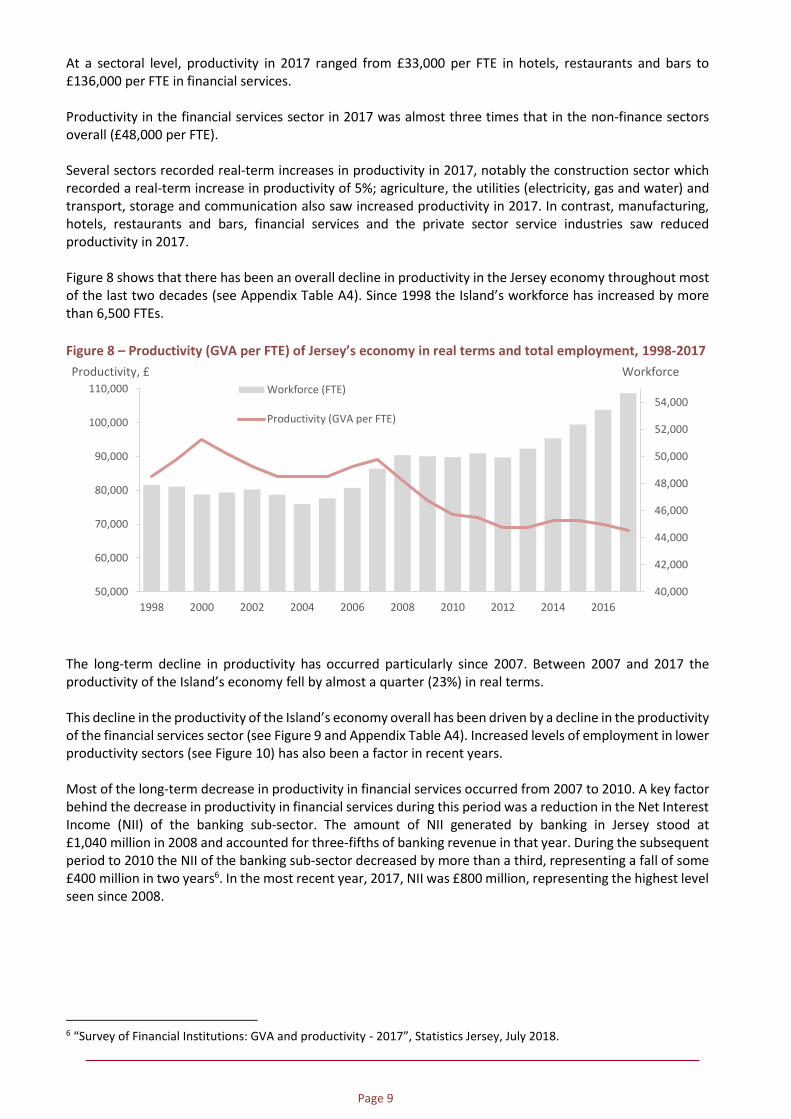
At a sectoral level, productivity in 2017 ranged from £33,000 per FTE in hotels, restaurants and bars to £136,000 per FTE in financial services. Productivity in the financial services sector in 2017 was almost three times that in the non-finance sectors overall (£48,000 per FTE). Several sectors recorded real-term increases in productivity in 2017, notably the construction sector which recorded a real-term increase in productivity of 5%; agriculture, the utilities (electricity, gas and water) and transport, storage and communication also saw increased productivity in 2017. In contrast, manufacturing, hotels, restaurants and bars, financial services and the private sector service industries saw reduced productivity in 2017. Figure 8 shows that there has been an overall decline in productivity in the Jersey economy throughout most of the last two decades (see Appendix Table A4). Since 1998 the Island’s workforce has increased by more than 6,500 FTEs.
Figure 8 – Productivity (GVA per FTE) of Jersey’s economy in real terms and total employment, 1998-2017
The long-term decline in productivity has occurred particularly since 2007. Between 2007 and 2017 the productivity of the Island’s economy fell by almost a quarter (23%) in real terms. This decline in the productivity of the Island’s economy overall has been driven by a decline in the productivity of the financial services sector (see Figure 9 and Appendix Table A4). Increased levels of employment in lower productivity sectors (see Figure 10) has also been a factor in recent years. Most of the long-term decrease in productivity in financial services occurred from 2007 to 2010. A key factor behind the decrease in productivity in financial services during this period was a reduction in the Net Interest Income (NII) of the banking sub-sector. The amount of NII generated by banking in Jersey stood at £1,040 million in 2008 and accounted for three-fifths of banking revenue in that year. During the subsequent period to 2010 the NII of the banking sub-sector decreased by more than a third, representing a fall of some £400 million in two years6. In the most recent year, 2017, NII was £800 million, representing the highest level seen since 2008.
6 “Survey of Financial Institutions: GVA and productivity - 2017”, Statistics Jersey, July 2018.
40,000
42,000
44,000
46,000
48,000
50,000
52,000
54,000
50,000
60,000
70,000
80,000
90,000
100,000
110,000
1998 2000 2002 2004 2006 2008 2010 2012 2014 2016
WorkforceProductivity, £
Workforce (FTE)
Productivity (GVA per FTE)
Page 10
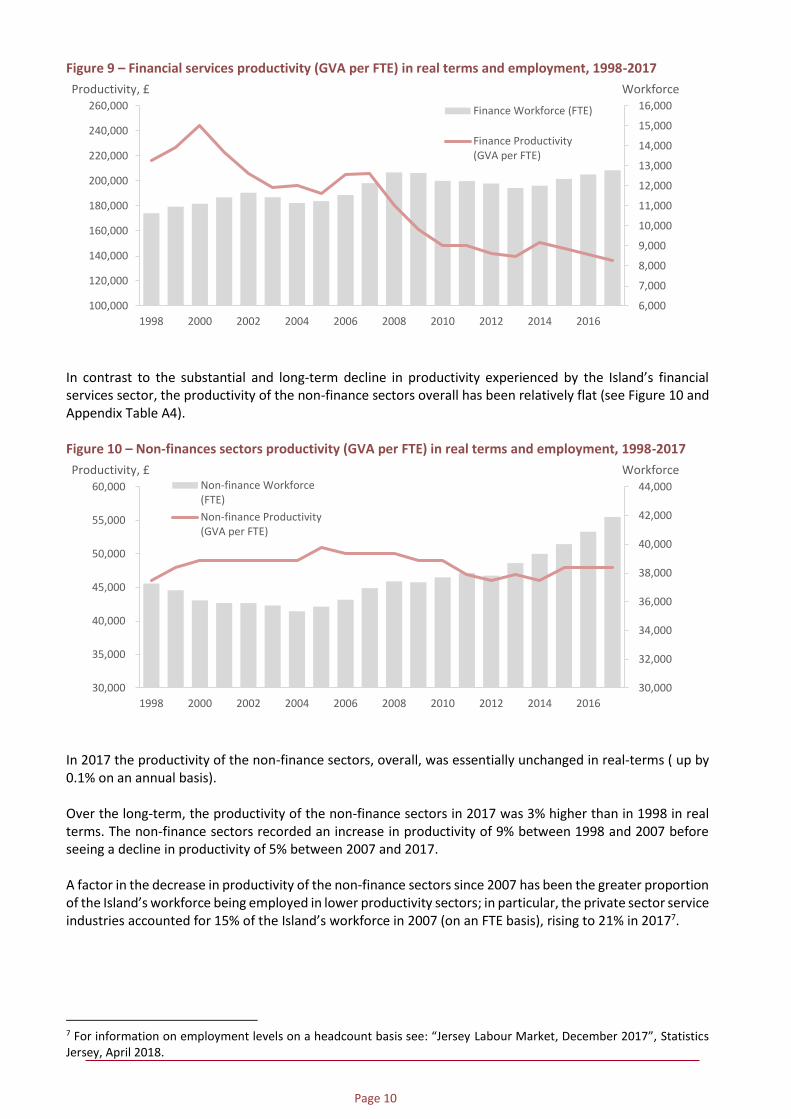
Figure 9 – Financial services productivity (GVA per FTE) in real terms and employment, 1998-2017
In contrast to the substantial and long-term decline in productivity experienced by the Island’s financial services sector, the productivity of the non-finance sectors overall has been relatively flat (see Figure 10 and Appendix Table A4). Figure 10 – Non-finances sectors productivity (GVA per FTE) in real terms and employment, 1998-2017
In 2017 the productivity of the non-finance sectors, overall, was essentially unchanged in real-terms ( up by 0.1% on an annual basis). Over the long-term, the productivity of the non-finance sectors in 2017 was 3% higher than in 1998 in real terms. The non-finance sectors recorded an increase in productivity of 9% between 1998 and 2007 before seeing a decline in productivity of 5% between 2007 and 2017. A factor in the decrease in productivity of the non-finance sectors since 2007 has been the greater proportion of the Island’s workforce being employed in lower productivity sectors; in particular, the private sector service industries accounted for 15% of the Island’s workforce in 2007 (on an FTE basis), rising to 21% in 20177.
7 For information on employment levels on a headcount basis see: “Jersey Labour Market, December 2017”, Statistics Jersey, April 2018.
6,000
7,000
8,000
9,000
10,000
11,000
12,000
13,000
14,000
15,000
16,000
100,000
120,000
140,000
160,000
180,000
200,000
220,000
240,000
260,000
1998 2000 2002 2004 2006 2008 2010 2012 2014 2016
WorkforceProductivity, £
Finance Workforce (FTE)
Finance Productivity(GVA per FTE)
30,000
32,000
34,000
36,000
38,000
40,000
42,000
44,000
30,000
35,000
40,000
45,000
50,000
55,000
60,000
1998 2000 2002 2004 2006 2008 2010 2012 2014 2016
WorkforceProductivity, £Non-finance Workforce(FTE)
Non-finance Productivity(GVA per FTE)
Page 11
APPENDIX
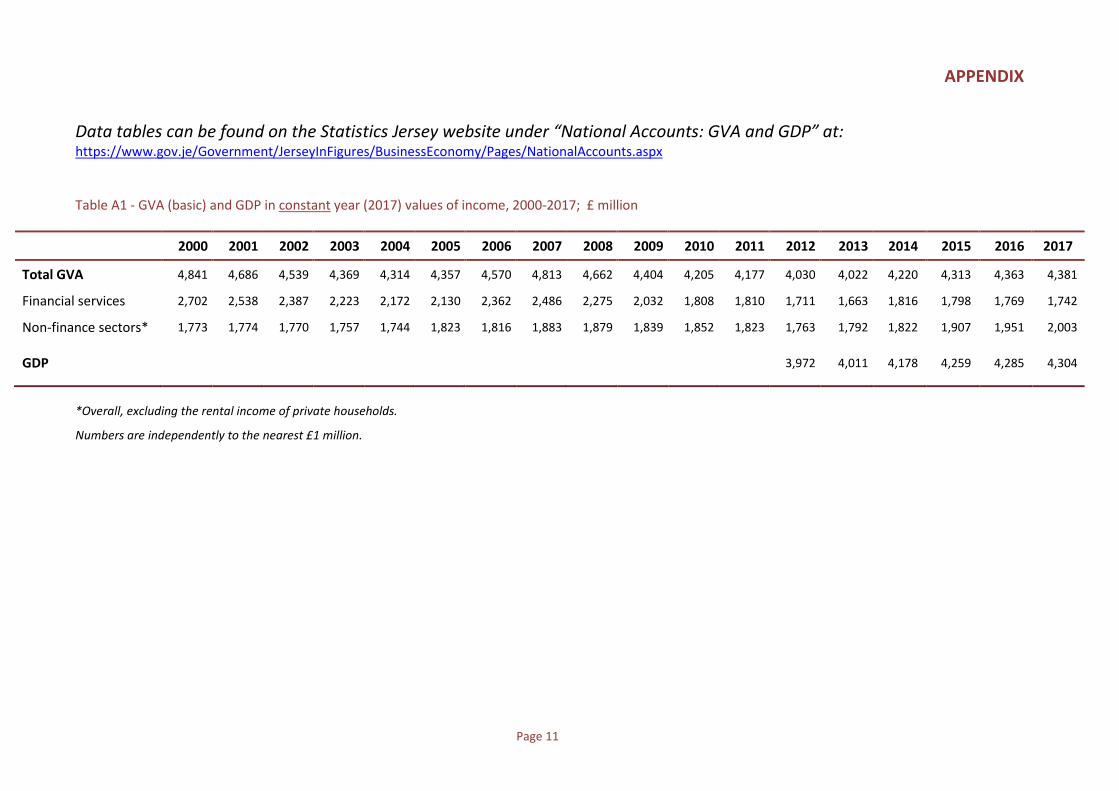
Data tables can be found on the Statistics Jersey website under “National Accounts: GVA and GDP” at: https://www.gov.je/Government/JerseyInFigures/BusinessEconomy/Pages/NationalAccounts.aspx Table A1 - GVA (basic) and GDP in constant year (2017) values of income, 2000-2017; £ million
2000 2001 2002 2003 2004 2005 2006 2007 2008 2009 2010 2011 2012 2013 2014 2015 2016 2017
Total GVA 4,841 4,686 4,539 4,369 4,314 4,357 4,570 4,813 4,662 4,404 4,205 4,177 4,030 4,022 4,220 4,313 4,363 4,381
Financial services 2,702 2,538 2,387 2,223 2,172 2,130 2,362 2,486 2,275 2,032 1,808 1,810 1,711 1,663 1,816 1,798 1,769 1,742
Non-finance sectors* 1,773 1,774 1,770 1,757 1,744 1,823 1,816 1,883 1,879 1,839 1,852 1,823 1,763 1,792 1,822 1,907 1,951 2,003
GDP 3,972 4,011 4,178 4,259 4,285 4,304
*Overall, excluding the rental income of private households.
Numbers are independently to the nearest £1 million.
Page 12
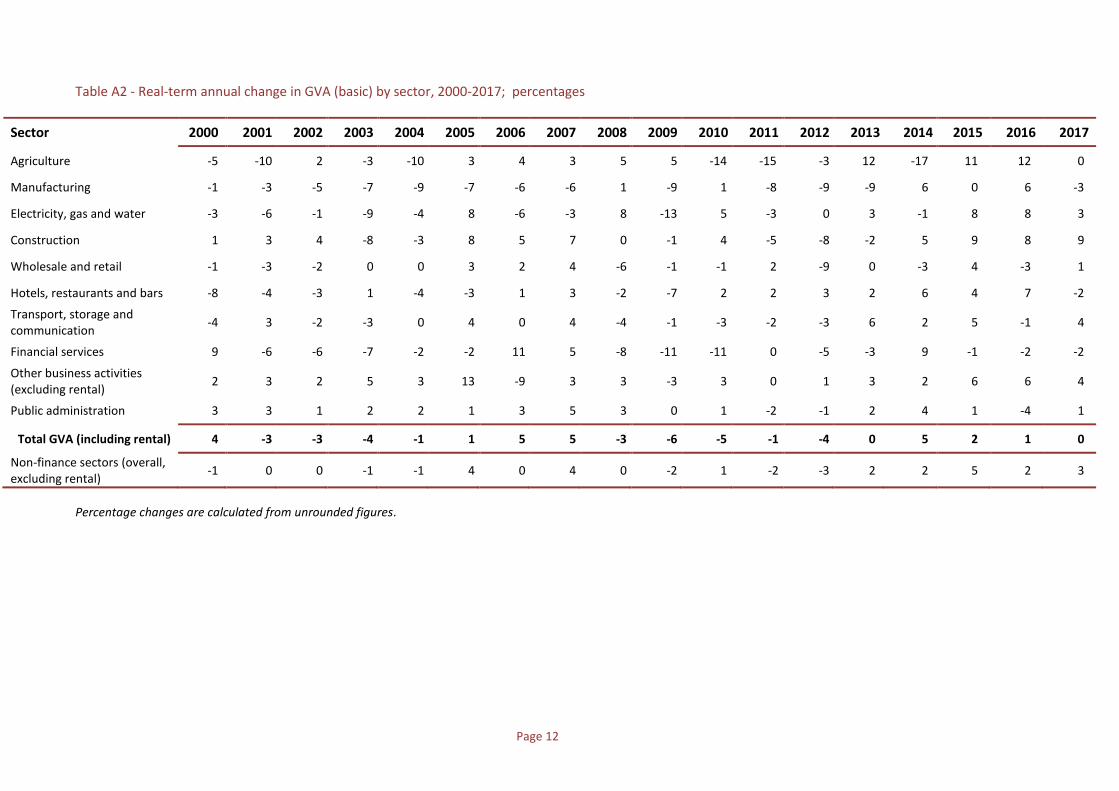
Table A2 - Real-term annual change in GVA (basic) by sector, 2000-2017; percentages
Sector 2000 2001 2002 2003 2004 2005 2006 2007 2008 2009 2010 2011 2012 2013 2014 2015 2016 2017
Agriculture -5 -10 2 -3 -10 3 4 3 5 5 -14 -15 -3 12 -17 11 12 0
Manufacturing -1 -3 -5 -7 -9 -7 -6 -6 1 -9 1 -8 -9 -9 6 0 6 -3
Electricity, gas and water -3 -6 -1 -9 -4 8 -6 -3 8 -13 5 -3 0 3 -1 8 8 3
Construction 1 3 4 -8 -3 8 5 7 0 -1 4 -5 -8 -2 5 9 8 9
Wholesale and retail -1 -3 -2 0 0 3 2 4 -6 -1 -1 2 -9 0 -3 4 -3 1
Hotels, restaurants and bars -8 -4 -3 1 -4 -3 1 3 -2 -7 2 2 3 2 6 4 7 -2
Transport, storage and communication
-4 3 -2 -3 0 4 0 4 -4 -1 -3 -2 -3 6 2 5 -1 4
Financial services 9 -6 -6 -7 -2 -2 11 5 -8 -11 -11 0 -5 -3 9 -1 -2 -2
Other business activities (excluding rental)
2 3 2 5 3 13 -9 3 3 -3 3 0 1 3 2 6 6 4
Public administration 3 3 1 2 2 1 3 5 3 0 1 -2 -1 2 4 1 -4 1
Total GVA (including rental) 4 -3 -3 -4 -1 1 5 5 -3 -6 -5 -1 -4 0 5 2 1 0
Non-finance sectors (overall, excluding rental)
-1 0 0 -1 -1 4 0 4 0 -2 1 -2 -3 2 2 5 2 3
Percentage changes are calculated from unrounded figures.
Page 13
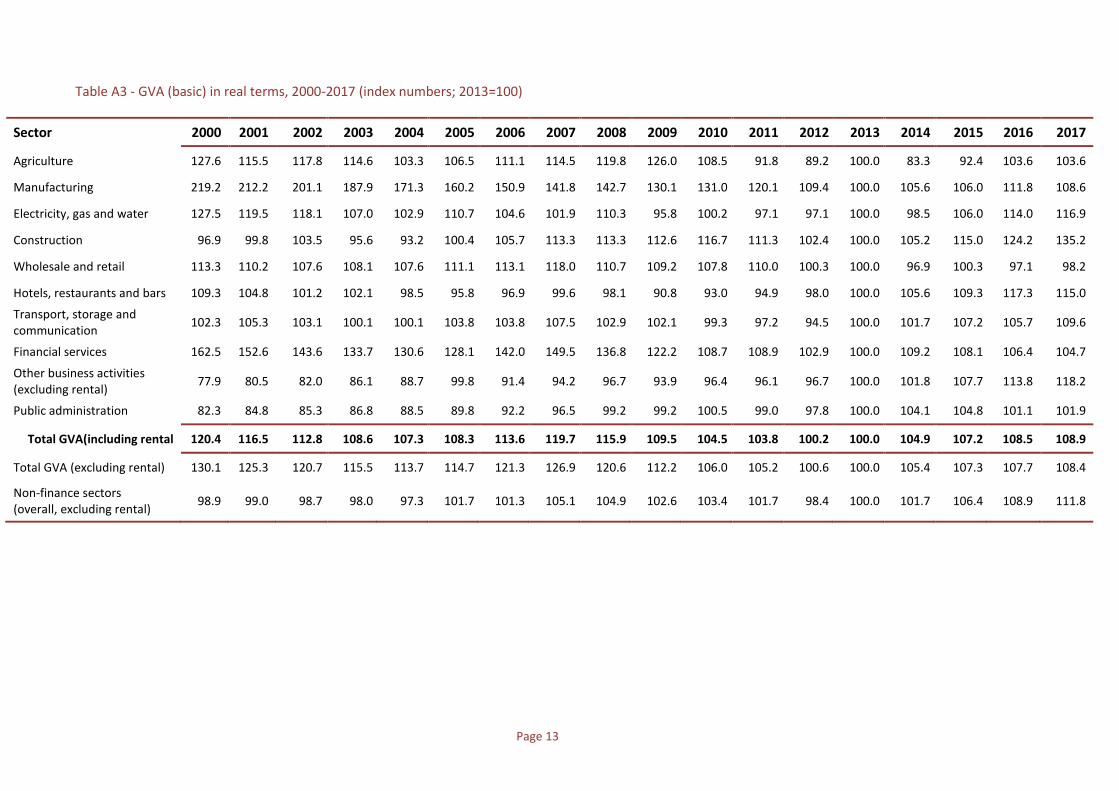
Table A3 - GVA (basic) in real terms, 2000-2017 (index numbers; 2013=100)
Sector 2000 2001 2002 2003 2004 2005 2006 2007 2008 2009 2010 2011 2012 2013 2014 2015 2016 2017
Agriculture 127.6 115.5 117.8 114.6 103.3 106.5 111.1 114.5 119.8 126.0 108.5 91.8 89.2 100.0 83.3 92.4 103.6 103.6
Manufacturing 219.2 212.2 201.1 187.9 171.3 160.2 150.9 141.8 142.7 130.1 131.0 120.1 109.4 100.0 105.6 106.0 111.8 108.6
Electricity, gas and water 127.5 119.5 118.1 107.0 102.9 110.7 104.6 101.9 110.3 95.8 100.2 97.1 97.1 100.0 98.5 106.0 114.0 116.9
Construction 96.9 99.8 103.5 95.6 93.2 100.4 105.7 113.3 113.3 112.6 116.7 111.3 102.4 100.0 105.2 115.0 124.2 135.2
Wholesale and retail 113.3 110.2 107.6 108.1 107.6 111.1 113.1 118.0 110.7 109.2 107.8 110.0 100.3 100.0 96.9 100.3 97.1 98.2
Hotels, restaurants and bars 109.3 104.8 101.2 102.1 98.5 95.8 96.9 99.6 98.1 90.8 93.0 94.9 98.0 100.0 105.6 109.3 117.3 115.0
Transport, storage and communication
102.3 105.3 103.1 100.1 100.1 103.8 103.8 107.5 102.9 102.1 99.3 97.2 94.5 100.0 101.7 107.2 105.7 109.6
Financial services 162.5 152.6 143.6 133.7 130.6 128.1 142.0 149.5 136.8 122.2 108.7 108.9 102.9 100.0 109.2 108.1 106.4 104.7
Other business activities (excluding rental)
77.9 80.5 82.0 86.1 88.7 99.8 91.4 94.2 96.7 93.9 96.4 96.1 96.7 100.0 101.8 107.7 113.8 118.2
Public administration 82.3 84.8 85.3 86.8 88.5 89.8 92.2 96.5 99.2 99.2 100.5 99.0 97.8 100.0 104.1 104.8 101.1 101.9
Total GVA(including rental 120.4 116.5 112.8 108.6 107.3 108.3 113.6 119.7 115.9 109.5 104.5 103.8 100.2 100.0 104.9 107.2 108.5 108.9
Total GVA (excluding rental) 130.1 125.3 120.7 115.5 113.7 114.7 121.3 126.9 120.6 112.2 106.0 105.2 100.6 100.0 105.4 107.3 107.7 108.4
Non-finance sectors (overall, excluding rental)
98.9 99.0 98.7 98.0 97.3 101.7 101.3 105.1 104.9 102.6 103.4 101.7 98.4 100.0 101.7 106.4 108.9 111.8
Page 14
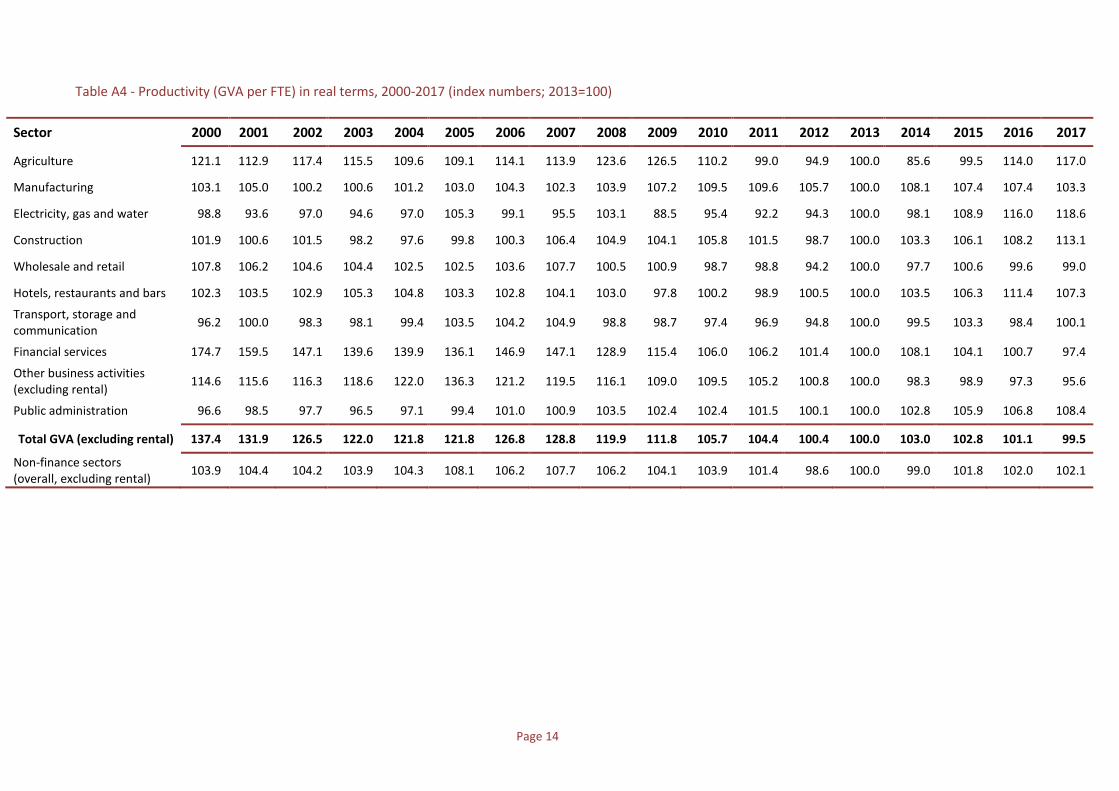
Table A4 - Productivity (GVA per FTE) in real terms, 2000-2017 (index numbers; 2013=100)
Sector 2000 2001 2002 2003 2004 2005 2006 2007 2008 2009 2010 2011 2012 2013 2014 2015 2016 2017
Agriculture 121.1 112.9 117.4 115.5 109.6 109.1 114.1 113.9 123.6 126.5 110.2 99.0 94.9 100.0 85.6 99.5 114.0 117.0
Manufacturing 103.1 105.0 100.2 100.6 101.2 103.0 104.3 102.3 103.9 107.2 109.5 109.6 105.7 100.0 108.1 107.4 107.4 103.3
Electricity, gas and water 98.8 93.6 97.0 94.6 97.0 105.3 99.1 95.5 103.1 88.5 95.4 92.2 94.3 100.0 98.1 108.9 116.0 118.6
Construction 101.9 100.6 101.5 98.2 97.6 99.8 100.3 106.4 104.9 104.1 105.8 101.5 98.7 100.0 103.3 106.1 108.2 113.1
Wholesale and retail 107.8 106.2 104.6 104.4 102.5 102.5 103.6 107.7 100.5 100.9 98.7 98.8 94.2 100.0 97.7 100.6 99.6 99.0
Hotels, restaurants and bars 102.3 103.5 102.9 105.3 104.8 103.3 102.8 104.1 103.0 97.8 100.2 98.9 100.5 100.0 103.5 106.3 111.4 107.3
Transport, storage and communication
96.2 100.0 98.3 98.1 99.4 103.5 104.2 104.9 98.8 98.7 97.4 96.9 94.8 100.0 99.5 103.3 98.4 100.1
Financial services 174.7 159.5 147.1 139.6 139.9 136.1 146.9 147.1 128.9 115.4 106.0 106.2 101.4 100.0 108.1 104.1 100.7 97.4
Other business activities (excluding rental)
114.6 115.6 116.3 118.6 122.0 136.3 121.2 119.5 116.1 109.0 109.5 105.2 100.8 100.0 98.3 98.9 97.3 95.6
Public administration 96.6 98.5 97.7 96.5 97.1 99.4 101.0 100.9 103.5 102.4 102.4 101.5 100.1 100.0 102.8 105.9 106.8 108.4
Total GVA (excluding rental) 137.4 131.9 126.5 122.0 121.8 121.8 126.8 128.8 119.9 111.8 105.7 104.4 100.4 100.0 103.0 102.8 101.1 99.5
Non-finance sectors (overall, excluding rental)
103.9 104.4 104.2 103.9 104.3 108.1 106.2 107.7 106.2 104.1 103.9 101.4 98.6 100.0 99.0 101.8 102.0 102.1
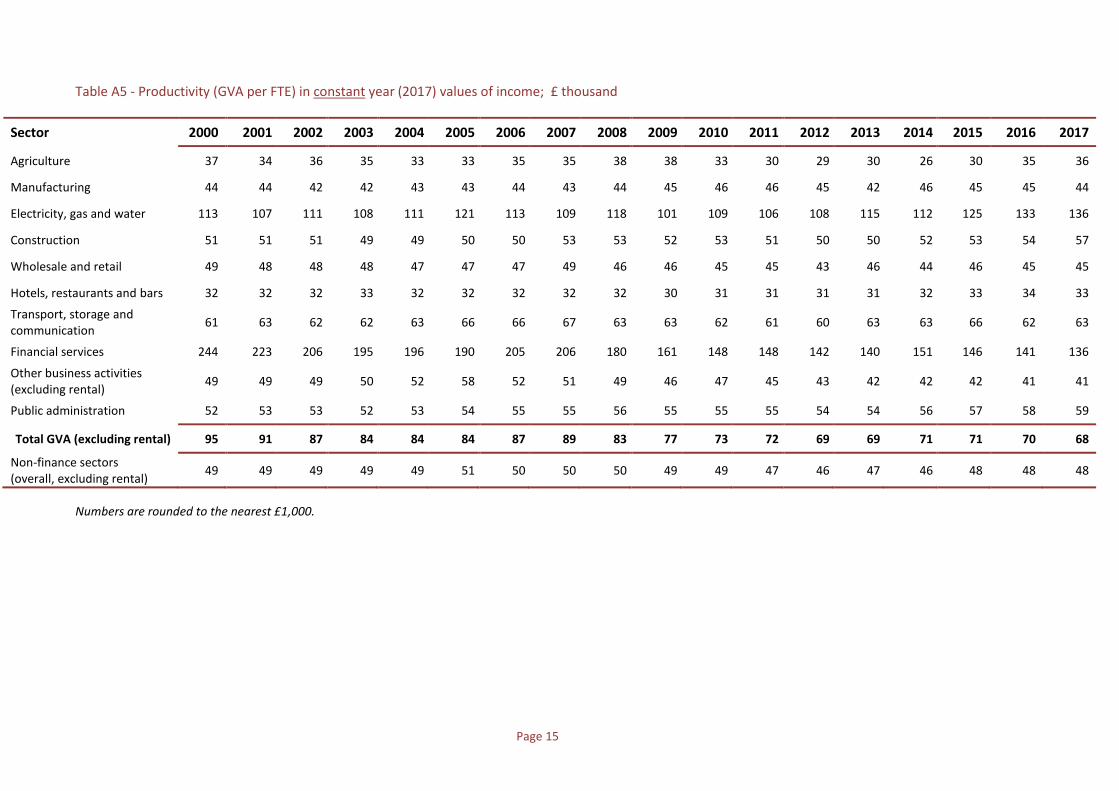
Page 15
Table A5 - Productivity (GVA per FTE) in constant year (2017) values of income; £ thousand
Sector 2000 2001 2002 2003 2004 2005 2006 2007 2008 2009 2010 2011 2012 2013 2014 2015 2016 2017
Agriculture 37 34 36 35 33 33 35 35 38 38 33 30 29 30 26 30 35 36
Manufacturing 44 44 42 42 43 43 44 43 44 45 46 46 45 42 46 45 45 44
Electricity, gas and water 113 107 111 108 111 121 113 109 118 101 109 106 108 115 112 125 133 136
Construction 51 51 51 49 49 50 50 53 53 52 53 51 50 50 52 53 54 57
Wholesale and retail 49 48 48 48 47 47 47 49 46 46 45 45 43 46 44 46 45 45
Hotels, restaurants and bars 32 32 32 33 32 32 32 32 32 30 31 31 31 31 32 33 34 33
Transport, storage and communication
61 63 62 62 63 66 66 67 63 63 62 61 60 63 63 66 62 63
Financial services 244 223 206 195 196 190 205 206 180 161 148 148 142 140 151 146 141 136
Other business activities (excluding rental)
49 49 49 50 52 58 52 51 49 46 47 45 43 42 42 42 41 41
Public administration 52 53 53 52 53 54 55 55 56 55 55 55 54 54 56 57 58 59
Total GVA (excluding rental) 95 91 87 84 84 84 87 89 83 77 73 72 69 69 71 71 70 68
Non-finance sectors (overall, excluding rental)
49 49 49 49 49 51 50 50 50 49 49 47 46 47 46 48 48 48
Numbers are rounded to the nearest £1,000.
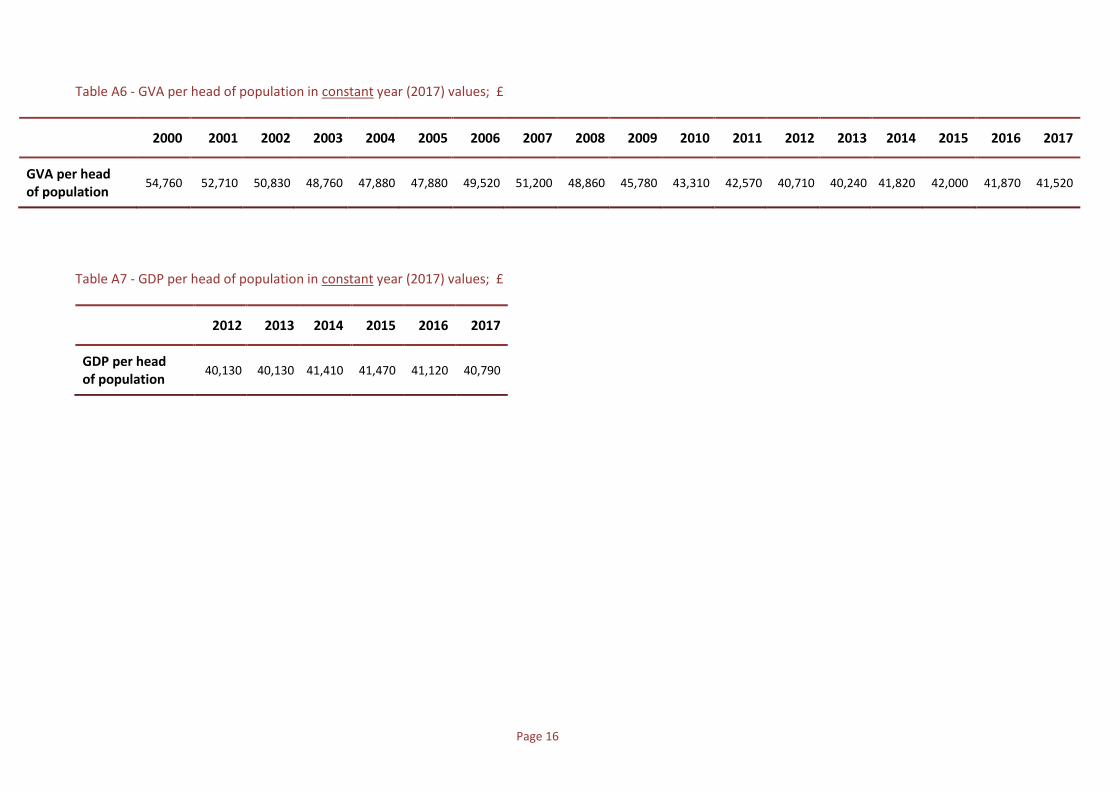
Page 16
Table A6 - GVA per head of population in constant year (2017) values; £
2000 2001 2002 2003 2004 2005 2006 2007 2008 2009 2010 2011 2012 2013 2014 2015 2016 2017
GVA per head of population
54,760 52,710 50,830 48,760 47,880 47,880 49,520 51,200 48,860 45,780 43,310 42,570 40,710 40,240 41,820 42,000 41,870 41,520
Table A7 - GDP per head of population in constant year (2017) values; £
2012 2013 2014 2015 2016 2017
GDP per head of population
40,130 40,130 41,410 41,470 41,120 40,790
Page 17
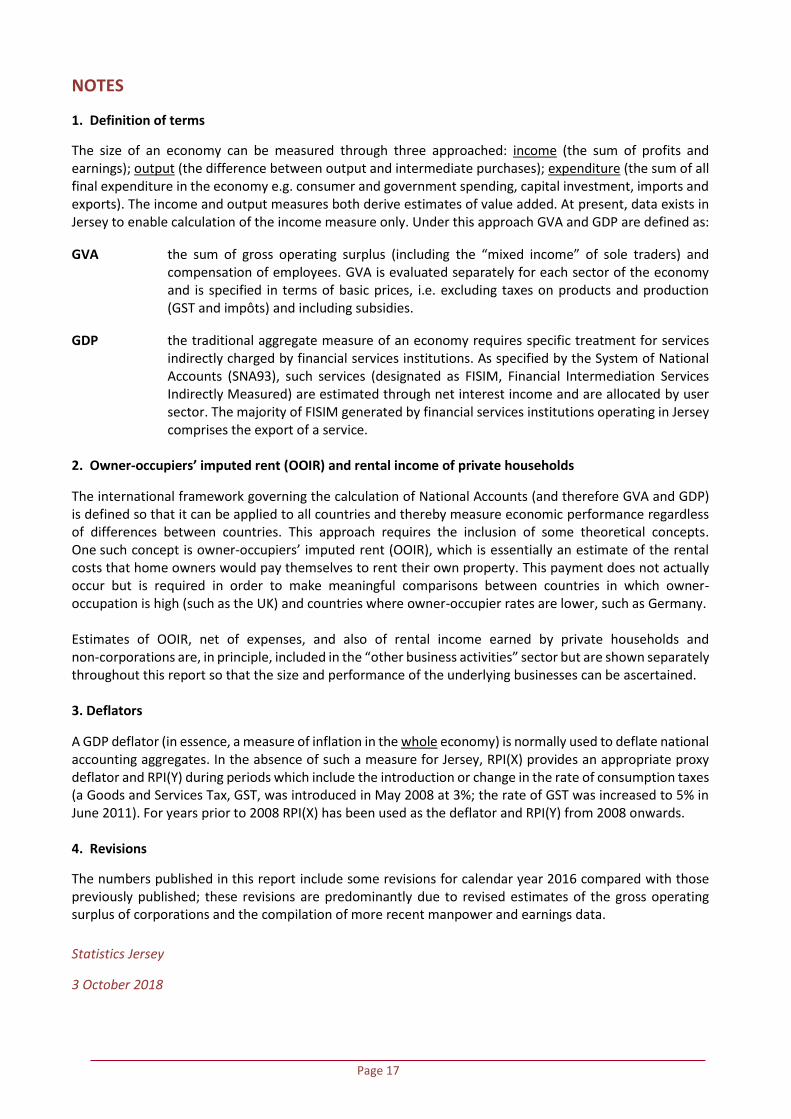
NOTES
1. Definition of terms
The size of an economy can be measured through three approached: income (the sum of profits and earnings); output (the difference between output and intermediate purchases); expenditure (the sum of all final expenditure in the economy e.g. consumer and government spending, capital investment, imports and exports). The income and output measures both derive estimates of value added. At present, data exists in Jersey to enable calculation of the income measure only. Under this approach GVA and GDP are defined as:
GVA the sum of gross operating surplus (including the “mixed income” of sole traders) and compensation of employees. GVA is evaluated separately for each sector of the economy and is specified in terms of basic prices, i.e. excluding taxes on products and production (GST and impôts) and including subsidies.
GDP the traditional aggregate measure of an economy requires specific treatment for services indirectly charged by financial services institutions. As specified by the System of National Accounts (SNA93), such services (designated as FISIM, Financial Intermediation Services Indirectly Measured) are estimated through net interest income and are allocated by user sector. The majority of FISIM generated by financial services institutions operating in Jersey comprises the export of a service.
2. Owner-occupiers’ imputed rent (OOIR) and rental income of private households
The international framework governing the calculation of National Accounts (and therefore GVA and GDP) is defined so that it can be applied to all countries and thereby measure economic performance regardless of differences between countries. This approach requires the inclusion of some theoretical concepts. One such concept is owner-occupiers’ imputed rent (OOIR), which is essentially an estimate of the rental costs that home owners would pay themselves to rent their own property. This payment does not actually occur but is required in order to make meaningful comparisons between countries in which owner-occupation is high (such as the UK) and countries where owner-occupier rates are lower, such as Germany. Estimates of OOIR, net of expenses, and also of rental income earned by private households and non-corporations are, in principle, included in the “other business activities” sector but are shown separately throughout this report so that the size and performance of the underlying businesses can be ascertained. 3. Deflators
A GDP deflator (in essence, a measure of inflation in the whole economy) is normally used to deflate national accounting aggregates. In the absence of such a measure for Jersey, RPI(X) provides an appropriate proxy deflator and RPI(Y) during periods which include the introduction or change in the rate of consumption taxes (a Goods and Services Tax, GST, was introduced in May 2008 at 3%; the rate of GST was increased to 5% in June 2011). For years prior to 2008 RPI(X) has been used as the deflator and RPI(Y) from 2008 onwards. 4. Revisions
The numbers published in this report include some revisions for calendar year 2016 compared with those previously published; these revisions are predominantly due to revised estimates of the gross operating surplus of corporations and the compilation of more recent manpower and earnings data.
Statistics Jersey
3 October 2018