Embed Size (px)
Citation preview

19Measuring Integration in the Labor Market – Which to Use, the Demographic or the Ethnic Concept?
Abstract:
In most countries, the data and the underlying theoretical approaches tend to emphasize the greater success of the natives or the ethnic majority in the labor market. When measuring integration and success in the labor market, different approaches can be used, for example, the demographic or ethnic concept. The ethnic concept refers to ethnicity, regardless of having an immigrant background or not. The demographic concept instead uses the native/immigrant dimension, usually considering first- and second-generation immigrants. Researchers’ use of these concepts varies by country but rarely do they discuss which concept would be more relevant to measure labor market differences and inequalities. Relevance is defined by how labor market differences and inequalities can be identified most clearly. In recent literature, it is suggested that in Baltic countries statistical categories of ‘international migrant/foreign–born’ (demographic concept) are not relevant to use because migration took place inside the borders. In the current article, the focus is on the Estonian context and the research question, therefore, asks which concept is suitable for the Estonian context when taking the Russian speaking population into consideration in labor market analysis. Results lead to the conclusion that using the demographic concept without making an ethnic distinction could lead to a distorted interpretation of the Russian-speaking population’s labor market integration in the Estonian context. This result also supports the recommendations from previous literature to use an ethnic concept. The study used the Labor Force Survey (LFS) 2013-2014 for the empirical analysis. Keywords: labor market, immigrants, demographic concept, ethnic concept, Russian-speaking population
Introduction
The literature provides a vast amount of results about labor market differences between different social groups in society. One aim has been to compare groups based on different ethnicities or immigrant origins. Origin determines whether respondents’ and parental birthplaces are relevant for analysis, and this is the most general distinction, although many subdivisions have also been used.
In most countries, the data and the underlying theoretical approaches tend to have emphasized the greater success that natives or the ethnic majority have in the labor market (Chiswick, 1978; Priore, 1979; Esser, 2004; Heath & Cheung, 2007; Bergh, 2017 etc.). It is also important to be very clear in the use of terminology and how target groups are defined. Jacobs et al. (2009) state that the diverse statistical constructions used by different European countries lead to labels such as ‘ethnic majority’ and ‘minority’, or ‘natives’ and ‘immigrants’. The different approaches make the international comparison quite challenging (Jacobs et al, 2009; Gorodzeisky & Leykin, 2019).
It is not only about international comparison; in the literature, there are also discussions about which definitions are used and how they compare with each other. Even more important is the ability to measure all of the groups in society, which should be targeted for the analysis of integration in the labor market (Borjas, 1987; Dustmann & Fabbri, 2003).
STSS Vol 12 / Issue 2Studies of Transition States and Societies
Measuring Integration in the Labor Market – Which to Use, the Demographic or the Ethnic Concept? Siim Krusell*
* E-mail: [email protected]

20 Siim Krusell
The distinction between ethnic minorities and immigrants is often blurred, and the practice in many Member States includes different schemes of classification. The umbrella term ‘ethnic minority’ can be used as a broad and purely descriptive term (people not belonging to the ethnic majority) which refers to “recent migrants, established ethnic minorities, national minorities, Roma and stateless persons” (Süssmuth, 2007).
Why do countries not use more or less similar concepts? There are many reasons and some may stem from country specific-contexts around the formation of the immigrant and ethnic community and from understanding the relationships between the state, the citizens and ethnic groups. In addition, continuity with previous research practices could be an issue.
Different approaches to defining the target groups can be grouped under common denominators or concepts such as the ethnic and demographic concepts. The main difference between them is that while the ethnic concept identifies groups by their ethnic belonging or national identity, with the demographic concept the country of birth of the respondent or their parents is central. There is a question about whether the ethnic and demographic concepts are distinct or if they overlap in several contexts.
Over the past decade, a growing number of researchers have urged for more reflexivity with regard to the categories used in the study of migration (categories such as ‘migrants’ – Dahinden, 2016; Favell, 2016; ‘second-generation migrants’ or ‘migration background’ – Elrick and Schwartzman, 2015; Horvath, 2019). Recent studies on ethnic boundary making have shown that systems of classification are intertwined with wider social and political relations and could normalize new forms of social inequality (Elrick & Schwartzman, 2015; Schinkel, 2018).
This article provides a contribution towards understanding what would be the most relevant statistical construction for measuring differences and inequalities in the Estonian labor market. This is significant for a forthcoming analysis in Estonia and could be useful to take into account in other country-specific studies, especially in post-Soviet countries as well as in former Yugoslavia (in the context of changing borders). It may not improve the international comparison directly but indirectly by more clear and grounded concepts, which are used in studies.
There are a few examples in the literature review section of this article, where the weak points of the definitions used are discussed (Jacobs et al, 2009; Kogan, 2007). However, there are not many and there is only one in the Estonian case (Gorodzeisky & Leykin, 2019), although there are examples where different definitions have been used. The basis for comparison in several studies has been the distinction between Estonians and non-Estonians, Russians and Estonians, Russian speakers and Estonian speakers, as well as natives and immigrants. Lindemann (2014), analyzing the duration of unemployment before finding a first job, combined the variables of ethnicity and language skills. Ethnic identity was self-reported and individuals with non-Estonian ethnic identity who speak Russian at home were considered as the Russian-speaking minority (Lindemann, 2014). Espenberg (2013) separated Estonians and non-Estonians tackling inequalities in the labor market in Estonia during the Great Recession (Espenberg, 2013). Luuk (2008) did not use the ethnic concept in her analysis about employment areas but used the demographic concept instead, comparing natives and immigrants. Aavik et al. (2018) examined how ethnic minorities negotiate ethnicity-based boundaries and, without further distinction, decided to use Russian-speaking women as an observation group.
In this article, the focus and research question is therefore: which concept is suitable to better grasp inequalities in the Estonian labor market? The key factor here is that a considerable proportion of the Russian-speaking population is part of the native population by definition, and a substantial part of the Estonian population considered by statistics as immigrants is composed of those, who historically were internal migrants. The formation of the immigrant population and further developments in Estonian society are different than in most other (Western) European countries, and these peculiarities are shown in more detail in the Estonian context section.

21Measuring Integration in the Labor Market – Which to Use, the Demographic or the Ethnic Concept?
The advantages and disadvantages of both concepts are discussed to assist in identifying which is the most appropriate concept for measuring differences and inequalities in the labor market. Why should the scope of this article be studied and what contribution does it make to the literature? The research question has not yet been studied thoroughly in the Estonian context or in the broader context of Estonia previously being part of the Soviet Union. Although the study is country-specific, the conclusions could offer a useful framework for future analyses of the disadvantages in the labor market in other post-Soviet countries as well as countries where the borders have changed (see also Gorodzeisky & Leykin, 2019). In certain contexts, not necessarily when measuring the labor market differences, the concepts that are used may even lead to further distinction in society through the citizenship policy, etc.
The current study will hopefully encourage other researchers to use a similar approach for other country-specific studies. It should also help to identify which concept is most relevant for use both in data collection and further analysis.
The paper is organized as follows. First, after this Introduction, an overview of the different ways in which the immigrant and ethnic concepts have been used in different countries in research generally and in labor market analysis specifically. The methodological issues that have already been identified from the existing literature will also be referred to. The paper continues with an overview of the Estonian context, data and methods, and a section of results, where the descriptive figures and regression model outcomes are presented. Finally, the paper finishes with conclusions.
Literature overview
This article explores whether the concept used for measuring labor market integration of different demographic groups covers the target group and enables the possible problems of labor market integration to be shown for a population with a migration background in one country. Another question is how country-specific measurement allows a valid international comparison.
Tribalat (1997) discussed problems related to the measurement of ethnic and immigrant divisions and their various definitions, concentrating on the French case. He concluded that it is not sufficient to survey foreigners while omitting those who have acquired French nationality. However, he also found that using ethnic categories instead will also cause difficulties. Ethnic identity varies in time and between generations, and there will be a significant risk of bias in observing only those who identify with a major ethnic group. Therefore, ethnic identity and nationality should be considered as secondary variables (Tribalat, 1997).
Simpson et al. (2009) stress that little attention has been paid to ethnicity classifications and their uncertainties when aggregating different ethnic groups. Dustmann and Fabbri (2003) point out that many studies analyze various aspects of the British labor market performance of ethnic minorities and compare these with those of the majority population. They state that attempts should be made to divide ethnic minorities into immigrant and British-born minorities (Dustmann & Fabbri, 2003). Many studies of ethnic inequalities in the United Kingdom have not taken account of characteristics linked to immigration or differences between immigrant ‘generations’ (Platt, 2005). For many ethnic minorities in the United Kingdom, it may be important to build data that can be measured in relation to immigration into an analysis. For example, relevant questions might include whether or not individuals are born in the country of residence, how long their family has lived in the country, their proficiency in the host country language and whether their educational participation was in the host or origin country (Connelly et al, 2016).
Despite the ongoing discussion about the composition, definition and usage of the immigrant or ethnic variable in labor market analyses, most countries have already settled on practices and classifications.

22 Siim Krusell
There are a few studies, which try to classify countries according to which concepts and distinctions have been used in studies; for example, discussions about the meaning and use of the term ethnicity and how this concept differs and overlaps with the neighboring concepts of race and national identity (Connelly et al, 2016).
Jacobs et al. (2009) found that most countries in Europe lack an official (legal) definition of people of foreign origin or of ethnic minorities (of foreign origin). The distinction between nationals and non-nationals (or ‘foreigners’) is used instead (Jacobs et al, 2009). In addition, Bustillo and Anton (2012) indicate the same problem: there is no standardized definition of who is an immigrant. In fact, in most states this concept simply does not exist in legal terms. When it comes to comparisons between countries, the legislative framework also plays an important role. While one possibility for distinction could be citizenship, in some countries the acquisition of citizenship for foreigners is much easier than in other countries. Jacobs et al. (2009) give several examples. It is more likely for a person with a foreign background to have state citizenship in Belgium or the Netherlands than it is in Austria or Switzerland. It is therefore hard to compare unemployment figures by citizenship (Jacobs et al, 2009).
Guzi et al. (2015) also stress that any conclusion about ethnic differences in terms of economic conditions in comparisons between countries would not be easy. The main problem is the scarcity of quantitative and qualitative data of a high enough quality to allow cross-country comparability. In addition, countries use different empirical definitions of what it means to be an ethnic minority. Consequently, ethnic minorities are often insufficiently covered by empirical research and comparisons of economic conditions at a cross-country level become uninformative and biased (Guzi et al, 2015). Guzi et al. (2015) consider that these empirical issues are especially relevant in some Eastern European countries, where the term ‘nationality’, which in Western understanding is a synonym of citizenship, has the meaning of ethnicity or belonging to a national group as an identity category. Statistical information from Eastern Europe tends to differentiate between ethnic populations, which is a remnant of the traditional role ethnicity played in defining individual self-identification in the former Soviet bloc (Guzi et al, 2015).
Most northern European countries have used the ethnic concept to produce data. They distinguish either or both the ethnic and foreign origin of their populations in a more detailed manner, while using different techniques. Norway is an exception, using the immigrant concept by distinguishing the birthplaces of parents and grandparents (Jacobs et al, 2009). Ireland and France show another picture of measurement practices. Barrett et al. (2006) define immigrants as those who (1) describe their nationality as being other than Irish, (2) were not born in Ireland, and (3) have lived here for less than 10 years. They compare these to people who (1) describe themselves as Irish and (2) who say they were born here (Barrett et al, 2006). In France and in most Southern European countries, the most common statistical categorizations merely distinguish individuals based on their nationality (Haug, 2000; Jacobs et al, 2009).
Simon (2007) tried to classify countries by their measurement strategies of the ethnic and immigrant variable. He distinguished a ‘state-centered type’ (EU-15, except the Northern European countries) in which country of birth and citizenship variables are collected; a ‘mosaic type’ in which variables on nationality, ethnicity and language are collected (Baltic countries, central and eastern Europe, the Balkans); and a ‘post-migration multicultural type’ (the UK, Ireland, the Netherlands and the Scandinavian countries), in which information on ethnic group and either or both religion and parents’ country of birth is gathered (Simon, 2007).
Despite substantial differences in countries’ measuring practices, an example of cross-national comparisons about immigrant and ethnic differences in the labor market can be found. Comparisons were possible only if a common definition of the target variable about immigrant and ethnic status has been chosen. In the literature reviewed, the demographic concept has mostly been used, as individuals were born either in the host country or in a foreign country (Adsera & Chiswick, 2007; Filipa, 2008; Bisin et al, 2011; Reyneri & Fullin, 2011; Guzi et al, 2015). In addition, Guzi et al. (2015) also used the distinction of citizenship (possession of host country citizenship or

23Measuring Integration in the Labor Market – Which to Use, the Demographic or the Ethnic Concept?
not), using it as an additional criterion for the target group (Guzi et al, 2015). For the same reason, Bisin et al. (2011) used the additional division of whether the respondent was born in the EU or not.
Several of the authors mentioned also refer to difficulties with cross-national comparisons. Guzi et al. (2015) stress that the findings from the analyses, however, may hide important differences stemming from the immigrants’ origin. Bisin et al. (2011) reveal problems with the often limited size of the immigrant samples in the different European countries, which do not allow immigrants to be differentiated by ethnic group. Adsera and Chiswick (2007) found information for some variables, like mother tongue, was available in some countries but not in others.
Problems relating to cross national analysis can be summarized by Kogan’s (2007) conclusions using German and Danish databases – these databases allow for deeper and more detailed analysis than would be possible from, for example, cross-country Eurostat datasets. In other words, cross-national comparison is applicable, but due to the differences in the formations of the immigrant populations and differences in the definitions used by different countries, cross-national analyses should always be compared to results that take the country-specific contexts and practices into consideration. Another problem is that international data sources operationalize international migrants according to the current territorial borders of independent nation states.
The aim of the previous literature review was to highlight and describe the problem areas identified by different authors in measuring integration. They range from different definitions to differences between countries. Thus, problems exist, and the research questions in this article contribute to possible solutions.
The Estonian context
Before WWII Estonia was ethnically relatively homogeneous (Estonians comprised 97% of the population in 1940). The greatest flows of immigrants into Estonia – up to 45,000 people a year (Kulu, 2001) – took place immediately after the war. In the period 1945-1989, the number of Russian speakers in Estonia grew from 26,000 to 602,000 (Vetik, 1993). The majority of them remained in Estonia after the collapse of the Soviet Union and overwhelmingly constitute the biggest ethnic minority group at present. This fundamental change in the ethnic composition of the population was attributed to the colonial policies of the Soviet Union, which aimed to reconstruct Estonia – both economically and socially – as an integral part of the Soviet Union (Mettam and Williams, 2001; Kuzio, 2002). Thus, the current integration context has certain features of the postcolonial condition. However, this condition differs from the Western European context, where immigrants arrived in the host countries from the former colonies. In Estonia, the flow of migration was in the opposite direction.
Since Estonia was part of the Soviet Union after WWII, at the time of their arrival Russian-speaking people were not immigrants in the legal sense, but internal migrants instead. They were ascribed the status of first-generation immigrants after the fall of the Soviet Union, which makes them quite different to first-generation immigrants in Western countries. They also considered themselves to be members of the majority nation of the Soviet Union and were merely moving from one part of the Soviet Union to another (Pettai & Hallik, 2002). They were not obliged by either official policies or institutions to consider themselves as immigrants. Indeed, Estonian language requirements were not officially stated in the labor market, and educational credentials achieved outside Estonia were relevant in Estonia (Vetik & Helemäe, 2011a). Using data from the European Social Survey, Gorodzeisky and Leykin (2019) calculated that 13.8% of the Estonian population comprised of people who arrived in Estonia as internal migrants from other Soviet republics when Estonia was part of the Soviet Union, and only approximately 2% were international migrants (arrived from other states).
After Estonia regained its independence in 1991, the context of integration changed radically. The collapse of the Soviet Union and the marketization of the Estonian economy drastically changed

24 Siim Krusell
the political, social and economic hierarchy of ethnic groups. The transition to a market economy took place at the same time as the creation of a new nation state model (Vetik & Helemäe, 2011b). The transition for Russians was not just about moving from a planned economy to a free market, but one which meant moving from being a privileged national ethnic group within a large ‘empire’ to an ethnic minority within a new nation state (Kennedy, 2002). Rebuilding a state also meant imposing a new legislative framework, including laws regulating acquiring citizenship and using the official language. The Citizenship Law adopted in 1992 was exclusive, in the sense that citizenship was granted only to those residents and their descendants who were citizens of Estonia before the Soviet occupation. The Law also requires knowledge of the Estonian language, and this effectively resulted in the majority of the Russian-speaking population living in Estonia becoming stateless (Vetik & Kionka, 1996). From a legal standpoint, these changes meant that the Russian-speaking population became immigrants.
The post-factum redefinition of the legal status of Russian speakers had important socioeconomic consequences for the whole ethnic group of Russians, contributing to their moving into an inferior status in the labor market. With the restoration of the Estonian Republic, legal requirements for accessing many labor market segments were established. For example, proficiency in the Estonian language and Estonian citizenship were required for many labor market segments, especially for higher status occupational positions. The difficulties that first-generation immigrants often have to face in Western labor markets became real for many Russian-speaking migrants in Estonia, regardless of their immigrant generation.
One of the recent studies (Saar et al, 2017) shows that while in most Western countries there are tendencies of convergence between natives and second-generation immigrants regarding structural integration, in Estonia the dynamics are different. The net disadvantage of young second-generation immigrants relative to their Estonian counterparts is either more pronounced compared to the disadvantage of their parents’ age cohort relative to their Estonian peers (with regard to the risks of unemployment or chances of obtaining a high occupational position).
Therefore, it could be alleged that using the ethnic rather than the demographic concept in previous studies has been justified, since it measures differences in labor market in the most accurate way. It could be asked why should such a research question be posed, as it is in current study. The main reason is that there is already a significantly sizeable third generation, who by definition belong to the titular population and whose labor market positions may differ from the first and second generations.
Data and methods
The data source for the analysis was the Labor Force Survey (LFS). The LFS is a sample survey, which collects data from individuals, and provides an extensive overview on labor market indicators. Data from 2013–2014 was used, and the sample size of the targeted groups allowed a thorough comparison of the subgroups. Depending on the year, the sample size was 15,000–19,000 persons. Target groups for the analysis were aggregated following the main research question, which was whether to use the demographic or the ethnic concept for measuring labor market divisions between ethnic groups. The core variables used to identify and measure the ethnic and demographic concepts are as follows: ethnicity is considered as a self-reported answer from a respondent to a question about ethnicity in the LFS. One value of the ethnic variable is Estonians and the second non-Estonians (Russian speaking).
The main reason why the analysis includes Russian-speaking residents as a comparison is that using this group in particular it is possible to compare the ethnic and demographic concept, because in the case of Russian-speaking residents the third generation can be distinguished from the data.

25Measuring Integration in the Labor Market – Which to Use, the Demographic or the Ethnic Concept?
In the demographic concept, the native or immigrant dimension considers natives as those respondents and their parents who were born in Estonia. Belonging to the immigrant population is therefore clear – it presumes that the respondent’s parents were born abroad. The immigrant population covers both first- and second-generation immigrants. First-generation immigrants are those who actively immigrated and were born abroad. Second-generation immigrants are those who were born in Estonia, but whose both parents were born abroad. It can be arguable whether those born in the country can be called immigrants. Although they are not directly persons who have immigrated to the country, the terms first-, second- and third-generation immigrants are often used by researchers.
We need to emphasize that natives who are not Estonians are mostly third-generation immigrants but by definition they are classified as natives. To summarize, the demographic concept consists three groups: 1) Native Estonians, 2) Native Russian-speaking non-Estonians, and 3) Russian- speaking immigrants (non-Estonians). The term ‘Russian-speaking non-Estonians’ includes several ethnic groups: Russians, Ukrainians, and Byelorussians whose domestic language is Russian, who were all selected to comprise this variable.
In further analysis, the term ‘non-Estonians’ is not used, in the interest of better readability.
The age structure of both the demographic and ethnic concept groups should be mentioned. Age-specific features, especially for the young and the elderly, can have a significant influence on the overall results. Therefore, it is important that the age structure of the groups to be compared is the same. In the current case, they are not, as the group of immigrants clearly included a larger proportion of elderly people and a smaller proportion of young people, and in the native Russian- speaking population, the distribution was the opposite, with a smaller proportion of elderly people and a larger proportion of young people.
Table 1: Age composition by concept. N, %
Demographic concept Ethnic Concept
Native Estonians
Native Russian-speaking
population
Russian- speaking
immigrants
AllNatives
AllImmi-grants
EstoniansRussian- speaking
population
15-24 17 29 5 18 5 17 13
25-59 63 64 66 63 66 63 66
60-74 20 7 29 18 30 20 22
15-74(samplesize)
28834 2860 5689 31694 7114 29371 8549
Source: own calculations, based on ELFS2013-2014
To minimize these differences, mostly the age group 25–59 was used for the analysis (that is, from prime age up to women’s early retirement age), and the age variable was used as a control variable in the regression models.
The selection of dependent variables, which allow estimations regarding labor market positions, is briefly explained in the following paragraphs. Unemployment figures can be viewed as one of the main indicators for measuring and comparing the difficulties that different groups, including ethnic groups, face in the labor market. Therefore, one of the indicators selected for the analysis was unemployment.

26 Siim Krusell
Occupations can be ranked in different ways; for instance, according to average earnings, the amount of human capital or the prestige of the occupation (Sicherman & Galor, 1990). Managers and professionals are quite prestigious positions and relatively well paid; therefore, reaching such positions can also be used as a labor market indicator for estimating ethnic differences.
The third selected indicator was a mismatch between education and job assignments (overeducation). This indicator has previously been used in analyses of the labor market success of immigrants, for example, by Chiswick et al. (2008) and Green et al. (2007). This indicator is used only for those with higher education. In the current article, what is important for the author is how higher education has been put into practice and implemented in the labor market.
Previous research (see Lindemann & Täht, 2014) has shown that non-Estonians have a lower efficiency of higher education. This is one of the reasons why overeducation has been analyzed for people with higher education.
The article features a descriptive and logistic regression analysis. The descriptive analysis consists of a general overview of the figures regarding unemployment, occupational attainment and overeducation, and a comparison of these by using the demographic and ethnic concepts. Here the main attention is paid to whether occupational structure and the percentage of overeducated and unemployed differs depending on the concept used. Two versions of the regression models were conducted, using either the ethnic or the demographic variable. The dependent variables for the regression models characterizing the labor market positions in this analysis were overeducation, unemployment risks and the probability of having a managerial or professional position. The regression model also included the control variables of gender, age, education, occupational status (not applicable in the probability of holding a managerial or professional position), economic activity and place of residence. The main purpose of the control variables was to test whether the ethnic or demographic variable remains significant in the model. After this step, the main objectives of the current analysis were about to be fulfilled. Using predicted probabilities, the probabilities for either unemployment risks, reaching a managerial or professional position and overeducation by the ethnic and the demographic variable were calculated. The possible differences in the probabilities of the categories for both the ethnic and the demographic variables were the focus.
Variables for regression analysis
Core variables• Ethnic variable (based on ethnic concept) – 1) Estonians, 2) Russian-speaking population.• Demographic variable (based on demographic concept) – 1. Native Estonians, 2. Native
Russian-speaking population, 3. Russian-speaking immigrants.
Explanatory, controlling variables• Gender: 1) Males, 2) Females• Age group: 1) 25–39, 2) 40–49, 3) 50–59• Education: 1) General secondary, 2) Primary or basic, 3) Vocational secondary, 4) Specialized
secondary, 5) Higher education• Residence: 1) Harju County, 2) Ida–Viru County, 3) Other counties• Occupational group: 1) Managers and professionals 2) Clerks, associate professionals and
technicians 3) Service and sales workers 4) Skilled workers and machine operators 5) Elementary occupations
• Economic sector: 1) Agriculture, hunting and forestry, fishing, 2) Mining and quarrying, manufacturing, electricity, gas and water supply, 3) Construction, 4) Wholesale and retail trade, hotels and restaurants, transportation, storage and communication, 5) Financial services, real estate, renting and business activities, 6) Public administration and defense, education, health and social work.

27Measuring Integration in the Labor Market – Which to Use, the Demographic or the Ethnic Concept?
Results
Descriptive overview
The main and the most basic labor market indicators to estimate the opportunities of any social group in the labor market are employment, unemployment and inactivity figures. In Table 2, it can be seen that it did not matter much which concept was used when considering the Russian-speaking groups and comparing them with Estonians. By both concepts, the Russian-speaking population had lower employment and higher unemployment and inactivity figures compared to Estonians and, more importantly, these figures were very similar for both concepts. There was a one percent lower unemployment rate among the native Russian-speaking population, but it could not be considered significant. In Table 2, the overeducation figures show a completely different picture. Although the percentage of overeducated among the highly educated native Russian-speaking population was significantly higher than that of Estonians, the difference was bigger when comparing Russian speakers by the ethnic concept and Russian-speaking immigrants by the demographic concept (Table 2).
Table 2: Employment status and overeducation in Estonia by proportions (%) of native an immigrant population, aged 25-59 years old
Demographic concept Ethnic Concept
NativeEstonians
NativeRussian-speaking
population
Russian- speaking
immigrantsAll
NativesAll
Immigrants EstoniansRussian-speaking
population
Employed 82 76 75 81 75 82 75
Unemployed 5 9 10 6 10 5 10
Inactive 13 15 15 14 15 13 15
Overeducated 7 14 29 9 20 7 24
Notes: Percentage of overeducated persons, includes only respondents with tertiary education
Source: own calculations, based on ELFS2013-2014
Success in an occupational career can be marked by the proportion of managers and professionals. The overall picture was similar to that of the unemployment and employment figures. Whichever concept was used, the Russian-speaking population had an equally lower percentage of managers and professionals compared to Estonians. The prevalence of blue collars, especially the industrial skilled workers was evident regardless of the ethnic or demographic concept (Table 3). The percentage of those with higher education among the native Russian-speaking population was higher, and the percentage of overeducated was significantly lower compared to other Russian speaking groups. This suggests that the percentage of managers and professionals among the native Russian-speaking population should have been higher. In addition, the analysis showed that there was not much difference in the percentages of semi-professionals and clerks among the native Russian-speaking group and the Russian-speaking immigrants, and these occupations are obviously seen as suitable for those with higher education.

28 Siim Krusell
Table 3: Occupational position in Estonia by proportions (%) of native and immigrant population, aged 25-59 years’ old
Demographic concept Ethnic Concept
Native Estonians
Native Russian-speaking
population
Russian-speaking
immigrantsAll
NativesAll
Immigrants EstoniansRussian-speaking
population
Managers 14 6 6 13 6 14 6
Professionals 22 14 12 21 13 22 12
Semi-professionals 14 12 11 14 11 14 11
Clerks 6 7 6 6 6 6 6
Service workers 12 12 14 12 14 12 14
Agricultural workers 2 1 0 2 0 2 0
Industrialskilled workers
24 40 38 26 37 24 39
Unskilledworkers 6 9 13 7 12 6 12
Total 100 100 100 100 100 100 100
N 14126 1293 2793 15542 3432 14367 4053
Source: own calculations, based on ELFS2013-2014
What can already be seen based on the descriptive analysis is that there were some differences when comparing the native Russian-speaking population with Russian-speaking immigrants. However, the differences between native Estonians and the native Russian-speaking population were in a range wide enough to make it problematic to keep native Estonians and the native Russian-speaking population in same group.
Results from regression models using predicted probabilities
In the regression models, which were constructed to estimate the probability of becoming unemployed, reaching the position of a manager or professional and for being overeducated, the ethnic and demographic variables remained significant after adding individual and structural control variables. In other words, for example, even though blue-collar workers had greater unemployment risks compared to white-collar workers, the disadvantages for the Russian-speaking population (both by the ethnic and the demographic concept) compared to native Estonians were still evident.

29Measuring Integration in the Labor Market – Which to Use, the Demographic or the Ethnic Concept?
Figure 1: Probability of becoming unemployed by ethnic and demographic concept
Notes: The figure is based on models presented in Appendix 1Source: own calculations, based on ELFS2013-2014
For Estonians, the predicted probabilities of becoming unemployed were significantly lower than for the Russian-speaking population, regardless of the concept used. The native Russian-speaking population followed Estonians. Their figures were also significantly lower than those of Russian- speaking immigrants. However, most important here is that the differences compared to Estonians were bigger than compared to Russian-speaking immigrants (Figure 1).
The probability of reaching a managerial or professional position was highest for Estonians. Unlike the comparison of unemployment risks, the native Russian-speaking population did not have significantly better probabilities of reaching managerial or professional positions than the Russian- speaking immigrants. In Figure 2, there is a visible difference, however, a test for statistical significance for the two Russian-speaking groups showed that there were no significant differences between the two groups regarding the probability of reaching managerial or professional positions (see also regression tables in Appendix).

30 Siim Krusell
Figure 2: Probability of reaching managerial/professional positions by ethnic and demographic concept
Notes: The figure is based on models presented in Appendix 1 Source: own calculations, based on ELFS2013-2014
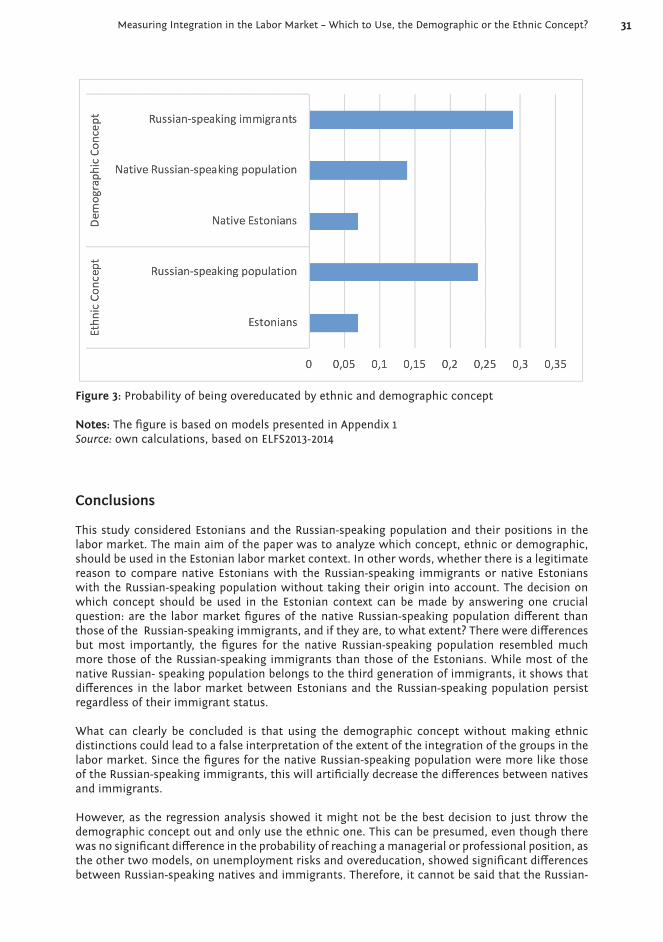
The results from the analysis of overeducation showed that there was a significant difference between the ability of highly educated Estonians and the native Russian-speaking population to exert their educational potential to secure expected positions. Estonians were able to manage this far better, which meant that the probability of being overeducated was lowest for Estonians. Compared to an analysis conducted about unemployment and reaching managerial/professional positions, there was a difference in the figures of the native Russian-speaking population: they were more similar to Estonians than to Russian-speaking immigrants. In other words, if members of the native Russian-speaking population were able to achieve higher education, they managed to convert their educational capital to suitable positions significantly better than the Russian-speaking immigrants (Figure 3).
31Measuring Integration in the Labor Market – Which to Use, the Demographic or the Ethnic Concept?
Figure 3: Probability of being overeducated by ethnic and demographic concept
Notes: The figure is based on models presented in Appendix 1 Source: own calculations, based on ELFS2013-2014
Conclusions
This study considered Estonians and the Russian-speaking population and their positions in the labor market. The main aim of the paper was to analyze which concept, ethnic or demographic, should be used in the Estonian labor market context. In other words, whether there is a legitimate reason to compare native Estonians with the Russian-speaking immigrants or native Estonians with the Russian-speaking population without taking their origin into account. The decision on which concept should be used in the Estonian context can be made by answering one crucial question: are the labor market figures of the native Russian-speaking population different than those of the Russian-speaking immigrants, and if they are, to what extent? There were differences but most importantly, the figures for the native Russian-speaking population resembled much more those of the Russian-speaking immigrants than those of the Estonians. While most of the native Russian- speaking population belongs to the third generation of immigrants, it shows that differences in the labor market between Estonians and the Russian-speaking population persist regardless of their immigrant status.
What can clearly be concluded is that using the demographic concept without making ethnic distinctions could lead to a false interpretation of the extent of the integration of the groups in the labor market. Since the figures for the native Russian-speaking population were more like those of the Russian-speaking immigrants, this will artificially decrease the differences between natives and immigrants.
However, as the regression analysis showed it might not be the best decision to just throw the demographic concept out and only use the ethnic one. This can be presumed, even though there was no significant difference in the probability of reaching a managerial or professional position, as the other two models, on unemployment risks and overeducation, showed significant differences between Russian-speaking natives and immigrants. Therefore, it cannot be said that the Russian-
32 Siim Krusell
speaking population is a completely unified group from the generational success view. If one could choose, assuming that the data was available, the ethnic concept would be preferable, but if possible, one would want to control possible differences inside the Russian-speaking group by generation. In the Estonian context, researchers have mostly used the ethnic concept using only the comparison between Estonians and the Russian-speaking population in labor market analysis, and this will be sufficient to reach conclusions about general divisions by most of the indicators. However, accuracy will be improved if generational differences within the Russian-speaking group are taken into account. There is also another point why both concepts should at least be tested. It is related to increasing migration to Estonia both from the former Soviet Union and from other countries outside the European Union. Therefore, the immigrant population established during the Soviet Union is no longer the only remarkable group that can and should be analyzed. Using the 2011 Census, it was already possible to distinguish different newly arrived immigrants by group of countries and analyze their labor market positions (Krusell, 2014).
As shown in the literature review, the definitions and practices about which concept to use vary by country. According to Haug (2000), there can be limitations for using and testing both concepts. These limitations are political in nature and they are due to the close relationship between a country’s policy on minorities and the availability of official statistical data (Haug, 2000). Even if this problem could be solved, the best solution for measurement in one country may not improve international comparability. For international comparison, it would be a good idea to have studies that use both concepts or combine them. However, it will always be important to point out the possible limitations, etc. This is especially important if the national borders have changed. As indicated by Gorodzeisky and Leykin (2019), major aggregated international data sources ignore the historical dynamics of recent geopolitical changes. The result is that the seemingly neutral international migrant category may shape new forms of social exclusion, potentially drawing boundaries between persons with a migration background and the imagined national community. As Gromme and Scheel (2020) indicate, the migrant category contrasts with alternative categories such as mother tongue or ethnicity, which are based on language knowledge or self-identification – criteria that can be changed. These categories are more fluid and permeable.
To sum up, one suggestion for forthcoming research based on the findings and conclusions from this study would be to acknowledge the importance of how to define target groups and to consider which concept would most accurately measure the research issue that the authors want to address, keeping in mind the temporal and spatial contextual changes.
References
Aavik, K., & Ubakivi–Hadachi, P. (2018). Responding to ethnicity–based stigmatisation: The case of Russian speaking women in Estonia. Trames, 22(1), 25-44.
Adsera, A., & Chiswick, B. R. (2007). Are there gender and country of origin differences in immigrant labor market outcomes across European destinations. Journal of Population Economics, 20(3), 495-526.
Alba, R., & Nee, V. (1997). Rethinking assimilation theory for a new era of immigration. International Migration Review, 31(4), 826-847.
Barrett, A., Bergin, A., & Duffy, D. (2006). The labour market characteristics and labour market impacts of immigrants in Ireland. Economic & Social Review, 37(1), 1-26.
Bergh, A. (2017). Explaining the labor market gaps between immigrants and natives in the OECD. Migration Letters, 14(2), 251–262.
Bisin, A., Patacchini, E., Verdier, T., & Zenou, Y. (2011). Formation and persistence of oppositional identities, European Economic Review, 55(8), 1046-1071.
Chiswick, B. (1978). The effect of Americanization on the earnings of foreign–born men. Journal of Political Economy, 86(5), 897–921.

33Measuring Integration in the Labor Market – Which to Use, the Demographic or the Ethnic Concept?
Connelly, R., Gayle, V., & Lambert, P. (2016). Ethnicity and ethnic group measures in social survey research. Methodological Innovations, 9, 1–14.
Dahinden, J. (2016). A plea for the ‘de–migratization’ of research on migration and integration. Ethnic and Racial Studies, 39(13), 2207-2225.
De Bustillo, R. M., & Antón, J. I. (2012). Immigration and labour market segmentation in the European Union. In E. Fernández–Macías, J. Hurley & D. Storrie D. (Eds.), Transformation of the employment structure in the EU and USA, 1995–2007 (pp. 115-157). Palgrave Macmillan.
Dustmann, C., & Fabbri, F. (2003). Language proficiency and labour market performance of immigrants in the UK. The Economic Journal, 113(489), 695–717.
Elrick, J., & Schwartzman, L.F. (2015). From statistical category to social category: organized politics and official categorizations of ‘persons with a migration background’ in Germany. Ethnic and Racial Studies, 38(9), 1539-1556.
Espenberg, K. (2013). Inequalities on the labour market in Estonia during the Great Recession. Phd Thesis. University of Tartu.
Esser, H. (2004). Does the “New” immigration require a “new” theory of intergenerational integration? International Migration Review, 38(3), 1126–1159.
Favell, A. (2016). Just like the USA? Critical notes on Alba and Foner’s cross-Atlantic research agenda. Ethnic and Racial Studies, 39(13), 2352-2360.
Filipa, S. (2008). Does employment protection help immigrants? Evidence from European labor markets. IZA Discussion Paper, 3414.
Gorodzeisky, A., & Leykin, I. (2020). When borders migrate: Reconstructing the category of ‘international migrant’. Sociology, 54(1), 142-158.
Green, C., Kler, P., & Leeves, G. (2007). Immigrant overeducation: Evidence from recent arrivals to Australia. Economics of Education Review, 26(4), 420–432.
Gromme, F., & Scheel, S. (2020). Doing statistics, enacting the nation: the performative powers of categories. Nations and Nationalism, 26(3), 576-593.
Guzi, M., Kahanec, M., & Kurekova, M. (2015). What explains immigrant–native gaps in European labor markets: The role of institutions. IZA Discussion Papers, 8847.
Haug, W. (2000). National and immigrant minorities: problems of measurement and definition. Genus, 56(1/2), 133-147.
Heath, A., & Cheung, S. (2007). The comparative study of ethnic minority disadvantage. In A. F. Heath and S.Y. Cheung (Eds.), Unequal chances: Ethnic minorities in western labour markets (pp. 1-44). Oxford University Press.
Horvath, K. (2019). Migration background – Statistical classification and the problem of implicity ethnising categorisation in educational context. Ethnicities, 19(3), 558-574.
Jacobs, D., Swyngedouw, M., Hanquinet, L., Vandezande, V., Andersson, R., Horta, A., Berger, M., Diani, M., Ferrer, A., Giugni, M., Morariu, M., Pilati, K., & Statham, P. (2009). The challenge of measuring immigrant origin and immigration–related ethnicity in Europe. Journal of International Migration and Integration, 10(1), 67-88.
Kennedy, M. (2002). Cultural Formations of Postcommunism. University of Minnesota Press.
Kogan, I. (2007). Working through Barriers: Host Country Institutions and Immigrant Labour Market Performance in Europe. Springer.
Krusell, S. (2014). Labour market position of those who immigrated after Estonia regained independence. Quarterly bulletin of Statistics Estonia, 3, 26-50.
Kulu, H. (2001). Sõjajärgne sisseränne Eestisse võrdlevas perspektiivis [Postwar immigration to Estonia in comparative perspective], Akadeemia, 11(152), 2379-2395.
Kuzio, T. (2002). History, memory and nation building in the post-Soviet colonial space. Nationalities Papers, 30(2), 241-264.
Lindemann, K. (2014). The effects of ethnicity, language skills and spatial segregation on labour market entry success in Estonia. European Sociological Review, 30(1), 35–48.
34 Siim Krusell
Lindemann, K., & Unt, M. (2013). Kõrgharidusega noorte teerajad viimasel kümnendil [Pathways of young people with higher education in the last decade]. TööKõrgEEL toimetised, 12.
Luuk, M. (2008). Immigrantide töötururiskid [Unemployment risks of immigrants]. In Saar E. (Ed.), Immigrantrahvastik Eestis [Immigrant population in Estonia] (pp. 92-112). Statistics Estonia.
Mettam, C.W., & Williams, S.W. (2001). A colonial perspective on population migration in Soviet Estonia. Journal of Ethnic and Migration Studies, 27(1), 133-150.
Pettai, V., & Hallik, K. (2002). Understanding processes of ethnic control: segmentation, dependency and co-optation in post-communist Estonia. Nations and Nationalism, 8(4), 505-529.
Piore, M. J. (1979). Birds of passage: Migrant labour and industrial societies. Cambridge.
Platt, L., Simpson, L., & Akinwale, B. (2010). Stability and change in ethnic groups in England and Wales. Population Trends, 121, 35-46.
Reyneri, E., & Fullin, G. (2011). Labour market penalties of new immigrants in new and old receiving West European countries. International Migration, 49(1), 31–57.
Saar, E., Krusell, S., & Helemae, J. (2017). Russian-speaking immigrants in post-soviet Estonia: towards generation fragmentation or integration in Estonian society. Sociological Research Online, 22(2), 1–22.
Schinkel, W. (2018). Against ‘immigrant integration’: for an end to neo-colonial knowledge production. Comparative Migration Studies, 6.
Sicherman, N., & Galor, O. (1990). A theory of career mobility. Journal of Political Economy, 98(1), 169-192.
Simon, P. (2007). “Ethnic” statistics and data protection in the Council of Europe countries. European Council.
Simpson, L., Peach, C., Mateos, P., Singleton, A., & Longley, P. (2009). Uncertainty in the analysis of ethnicity classifications: issues of extent and aggregation of ethnic groups. Journal of Ethnic and Migration Studies, 35(9), 1437-1460.
Süssmuth, R. (2007). Ethnic Minorities in the labour market. An Urgent Call for Better Social Inclusion. Report of the High Level Advisory Group of Experts on the Social Integration of Ethnic Minorities and their Full Participation in the Labour Market. Brussels: European Commission.
Tribalat, M. (1997). Appropriate tools for measuring assimilation and integration: the French experience. In Measurement and indicators of integration (pp. 95-112). Directorate of Social and Economic Affairs. Council of Europe Publishing.
Vetik, R. (1993). Ethnic conflict and accommodation in post-communist Estonia. Journal of Peace Research, 30(3), 271-280.
Vetik, R., & Helemäe, J. (2011a). Introduction. In Vetik, R. & Helemäe, J. (Eds.), The Russian Second Generation in Tallinn and Kohtla-Järve: The TIES Study in Estonia (pp. 13-25). University of Amsterdam.
Vetik, R., & Helemäe, J. (Eds.) (2011b). The Russian second generation in Tallinn and Kohtla-Järve: The TIES study in Estonia. University of Amsterdam.
Vetik, R., & Kionka, R. (1996). Estonia and Estonians. In G. Smith (Ed.), The nationalities question in the post-Soviet states (pp. 129-146). Longman.
Siim Krusell is a PhD student at Tallinn University. His general research interests are processes in the labor market, including minorities’ success compared to the main population. Siim Krusell has been the co-author of several applied research publications. The latest journal article “Russian-Speaking Immigrants in Post-Soviet Estonia: Towards Generation Fragmentation or Integration in Estonian Society” was published in Sociological Research Online.

35Measuring Integration in the Labor Market – Which to Use, the Demographic or the Ethnic Concept?
Appendix 1
Table 4: Unemployment risks, educational mismatch and reaching to managerial/ professional group, odds ratios. Ethnic model
* significant at level 0.001Source: own calculations, based on ELFS2013-2014.
Unemployment risk Overeducation Having a managerial/
professional position
Ethnic status
Estonians (reference group)
Russian speaking Non-Estonians 1.46* 1.73* 0.36*
Age group
25–34 (reference group)
35–49 0.77* 1.10* 1.64*
50–59 0.78* 1.31* 1.17*
Gender
Males (reference group)
Females 1.13* 1.78* 0.61*
Educational level
Higher (reference group)
Primary or basic 1.68* 0.04*
General secondary 1.14* 0.15*
Vocational secondary 1.26* 0.98*
Specialised secondary 1.01 0.18*
Place of residence
Harju county (reference group)
Ida-Viru county 1.50* 0.81*
Other counties 0.86* 0.68*
Occupational group
Managers and professionals (reference group)
Clerks/associate professionals/technician’s 2.03* 5.84*
Service and sales workers 2.03* 19.14*
Skilled workers, machine operators 2.14* 30.26*
Elementary occupations 3.29* 72.92*
Economic activity
Agriculture (reference group)
Mining, manufacturing 0.98 1.55* 1.33*
Construction 1.66* 0.76* 1.65*
Wholesale and retail trade; hotels and restaurants; transportation, storage and communication 1.02 1.57* 2.29*
Financial intermediation, business activities 1,26* 1,55* 3.48*
Public administration, education, health and social work 0.86* 0,95 3.85*
R Square .071 .358 0.361
N (sample size) 23203 2427 18489

36 Siim Krusell
Table 5: Unemployment risks, educational mismatch and reaching to managerial/ professional group, odds ratios. Demographic model
* significant at level 0.001Source: own calculations, based on ELFS2013-2014.
Unemployment risks Overeducation Having a managerial/
professional position
Ethnic status
Native Estonians (reference group)
Non-Estonians natives (Russian speaking) 1.23* 0.97 0.39*
Non-Estonians immigrants (Russian speaking) 1.71* 2.44* 0.35*
Age group (years)
25–34 (reference group)
35–49 0.69* 0.96 1.65*
50–59 0.75* 1.11* 1.18*
Gender
Males (reference group)
Females 1.27* 1.75* 0.62*
Educational level
Higher (reference group)
Primary or basic 1.82* 0.04*
General secondary 1.19* 0.15*
Vocational secondary 1.19* 0.10*
Specialised secondary 0.96* 0.18*
Place of residence
Harju county (reference group)
Ida-Viru county 1.63* 1.02 0.80*
Other counties 0.94* 0.89* 0.67*
Occupation
Managers and professionals (reference group)
Clerks/associate professionals/technician’s 1.99* 5.85*
Service and sales workers 2.16* 18.90*
Skilled workers, machine operators 2.17* 29.36*
Elementary occupations 3.39* 73.19*
Economic activity
Agriculture (reference group)
Mining, manufacturing 0.96 1.59* 1.65*
Construction 1.63* 0.76* 1.62*
Wholesale and retail trade; hotels and restaurants; transportation, storage and communication 1.02* 1.55* 2.28*
Financial intermediation, business activities 1.27* 1.55* 3.39*
Public administration, education, health and social work 0.75* 0.95 3.83*
R Square .073 .103 .360
N (sample size) 22899 2404 18248

37Measuring Integration in the Labor Market – Which to Use, the Demographic or the Ethnic Concept?
Table 6: Unemployment risks, educational mismatch and reaching to managerial/ professional group, odds ratios. Demographic model
* significant at level 0.001Source: own calculations, based on ELFS2013-2014.
Unemployment risks Overeducation Having a managerial/
professional position
Ethnic status
Non-Estonians natives (Russian speaking) (reference group)
Non-Estonians immigrants (Russian speaking) 1.36* 2.44* 0.95
Age group (years)
25–34 (reference group)
35–49 0.80* 1.53* 1.10*
50–59 0.59* 0.93 0.94*
Gender
Males (reference group)
Females 1.42* 1.95* 0.50*
Educational level
Higher (reference group)
Primary or basic 1.49* 0.07*
General secondary 1.23* 0.32*
Vocational secondary 1.11* 0.12*
Specialised secondary 0.96 0.18*
Place of residence
Harju county (reference group)
Ida-Viru county 1.40* 0.89* 0.89*
Other counties 0.69* 0.52* 0.75*
Occupation
Managers and professionals (reference group)
Clerks/associate professionals/technician’s 1.60* 4.85*
Service and sales workers 1.62* 19.90*
Skilled workers, machine operators 1.86* 34.36*
Elementary occupations 2.32* 41.19*
Economic activity
Agriculture (reference group)
Mining, manufacturing 0.35* 0.26* 1.52
Construction 0.73* 0.62* 1.62*
Wholesale and retail trade; hotels and restaurants; transportation, storage and communication 0.44* 0.18*
3.19*
Financial intermediation, business activities 0.56* 0.42* 3.52*
Public administration, education, health and social work 0.36* 0.15* 7.77*
Language skills
Fluent (reference group)
Average 1.32* 1.41* 1.33*
Poor 1.46* 1.52* 1.46*
R Square .051 .448 .250
N (sample size) 5449 391 4058