Embed Size (px)
Citation preview

Measuring Hubs – for TyreTesting with the Highest Precision
B.Eng F. Furter
Kistler Instruments

Content
• Intro & Basics
• Motivation
• Comfort Measurements
• Efficiency Measurements
• Trends
• Summary

1959foundation of Kistler Switzerland
1500employees worldwide
57years of technology know-how
70%of sales to the automotive industry
56locations worldwide

Measurable physical variables
Force
Pressure
Torque
Acceleration
Electrical pulse
Displacement
Speed
…

• Sensor located as close to the tirecontact patch reduces impacts frommachine structure and eliminatesparasitic losses
• Compact design results in a stiffstructure with high eigenfrequency

Motivation
• Quality
• Performance / Comfort
• Economic Lifetime, Rolling Resistance
• Safety braking/ friction
• Fullfil local and global Regulations
• Verification of Tire Models

Application: Comfort measurements
• High speed uniformity HSU
• Flat spot

Application: Comfort measurements, HSU, RFV
Test parameters: Fz static 6300N, 120kph, 6 revolutions

Application: Comfort measurements, HSU, LFV
• Fz 4 kN
• Average of 10measurements
Sourc
e:
IPW
(2014)
Application: Comfort measurements, HSU
• Fz 4 kN
• Average of 10measurements
• 25,1N / ±0,6%=± 0.15N
± 0,00375%of 4000N !
Sourc
e:
IPW
(2014)
+/-
0.1
5 N

Application: Comfort measurements, HSU, RFV
• Fz 4 kN
• 120 kph
Sourc
e:
IPW
(2014)

Application: Comfort measurements, HSU, RFV
• Fz 4 kN
• 120 kph
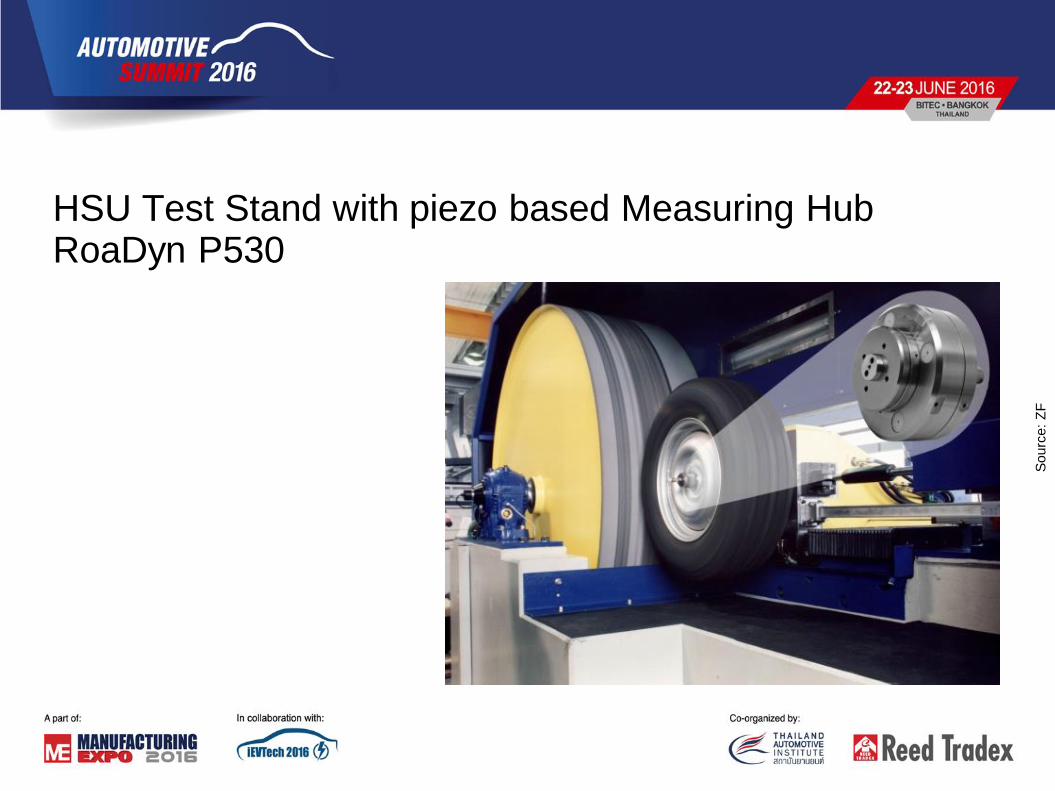
HSU Test Stand with piezo based Measuring Hub RoaDyn P530
Sourc
e:
ZF

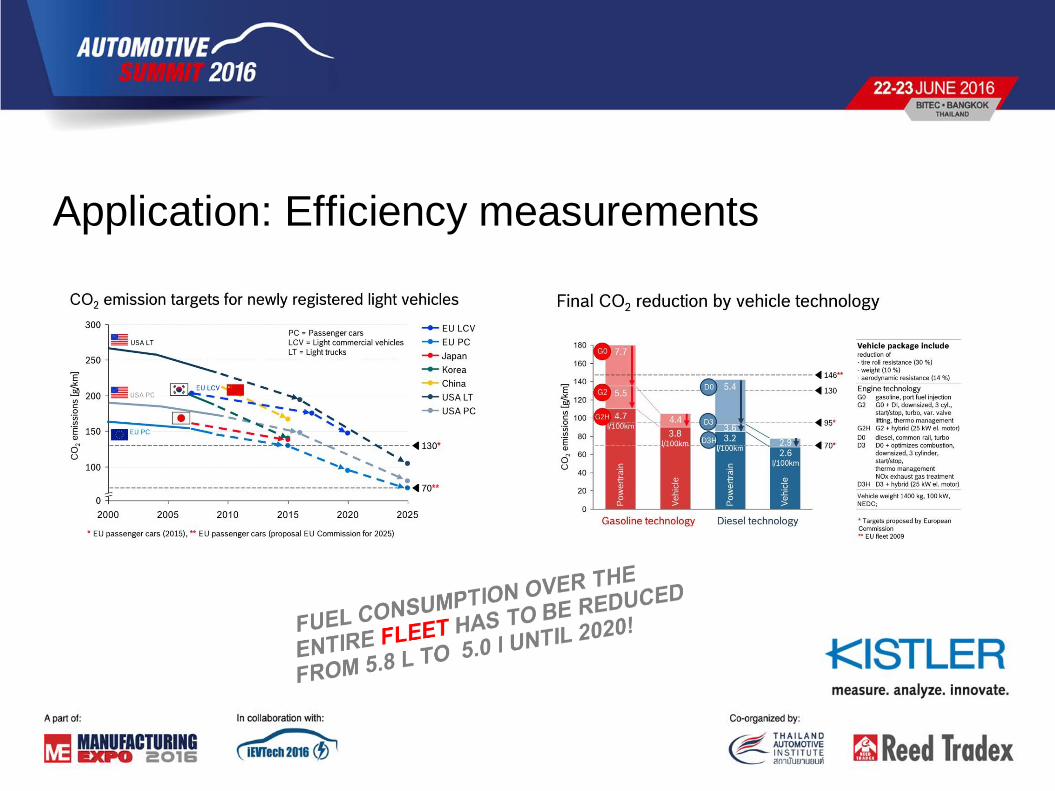
Application: Efficiency measurements
• Rolling resistance RR
• Tire wear

Application: Efficiency measurements
Sourc
e:
Sandberg
(2011)
RR based componet
Application: Efficiency measurements

Application: Efficiency measurements
• Wet grip
• Rolling Noise
• Fuel Efficiency

Laboratory methods according ISO 28580
• Deceleration up to standstill
• Electrical power for constant drum rotation
• Breaking torque on drum hub
• Resistive force at tire spindle
3 + 1 Sourc
e:
Gent (2
005)

Comparison of the methods
• Reference Machine – e.g. Tire Manufacturer
• Candidate Machine – e.g. OEM
• Round Robin Test
• Min. 10 Tires for Pass. Cars
• > 3 Measurements
• Min. RRC Range 3 N/kN
• Standard Deviation < 0.075 N/kN Sourc
e:
BiA
(2013)

Used sensors
• Torque Method: Non-Contact Torque Meter
• Loading Range 500 Nm
• Accuracy 0.01 %
• Speed Controll < 0.1 km/h
• Force Method Measurement: RoaDyn® S220
• Strain gauge technology
• Fz 15 kN; Fx±400 N for, 0,5 N/± 0.5%

Repeatibility Results
Avg. of Standard Deviation
• Deceleration 0.036 N/kN
• Power 0.022 N/kN
• Torque 0.022 N/kN
• Force 0.019 N/kN
Sourc
e:
BiA
(2013)

Alignment Results
Reference Laboratory
• Deceleration method only
Alignment Target
• Average deviation < 0.5 N/kN
• Correlation coefficient > 0.95
Method Average Deviation Correlation Coefficient
Force 0.10 kg/T 0.997
Torque 0.21 kg/T 0,998
Power 0.20 kg/T 0.997
Deceleration 0.15 kg/T 0.998
Sourc
e:
BiA
(2013)

Performance and repeatabillity check with two position RR test stand (force)
24
STEP Direction Time Speed Load Tractive Value-skim Tractive [Value-skim]
[sec] [km/h] [kgf] [kgf] [kgf] [kgf] [kgf]
Warm-Up CW 1200 80 411.5
Skim CW 60 80 9.6 1.09 1.35
1 CW 300 80 411.4 5.32 4.23 5.38 4.03
2 CW 60 80 411.5 5.21 4.12 5.31 3.96
3 CW 60 80 411.4 5.27 4.18 5.28 3.93
Warm-Up CCW 300 80 411.6
Skim CCW 60 80 9.7 -2.00 -1.53
1 CCW 300 80 411.5 -6.25 -4.25 -5.98 -4.45
2 CCW 60 80 411.6 -6.20 -4.20 -5.99 -4.46
3 CCW 60 80 411.6 -6.32 -4.32 -5.97 -4.44
Ave. RR 4.22 4.21
Ave. load 401.85 401.52
RR/% 1.049% 1.049%
Station BStation A

Trends in Tire Testing
• Tire wear
• Increased demand ofmeasuring equipment forRR according force method
• Truck and bus more andmore in focus of wear and RR
Drum
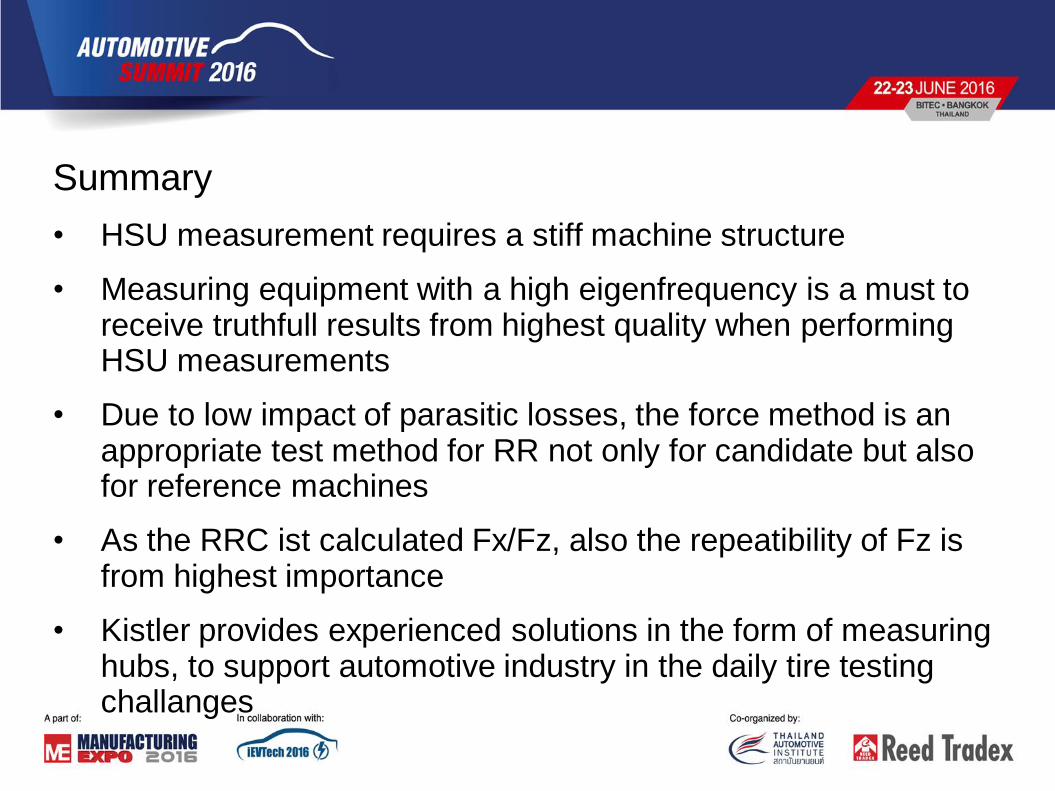
Summary
• HSU measurement requires a stiff machine structure
• Measuring equipment with a high eigenfrequency is a must toreceive truthfull results from highest quality when performingHSU measurements
• Due to low impact of parasitic losses, the force method is an appropriate test method for RR not only for candidate but also for reference machines
• As the RRC ist calculated Fx/Fz, also the repeatibility of Fz isfrom highest importance
• Kistler provides experienced solutions in the form of measuringhubs, to support automotive industry in the daily tire testingchallanges

Thank You