Embed Size (px)
Citation preview

P a g e | 64 Vol. 10 Issue 5 Ver. 1.0 July 2010 Global Journal of Computer Science and Technology
GJCST Computing Classification F.4.2, F.4.3
Measuring Helpfulness of Personal Decision Aid
Design Model Siti Mahfuzah Sarif
1
Norshuhada Shiratuddin 2
Abstract-The existence of countless computerized personal
decision aids has triggered the interest to investigate which
decision strategy and technique are ideal for a personal
decision aid and how helpful is decision aid to non-expert
users? Two categories of decision strategies have been
reviewed; compensatory and non-compensatory, which results
in fusing the two strategies in order to get the best of both
worlds. Findings from the study of focus groups show that
multi criteria decision method (MCDM) known as Pugh matrix
and lexicographic have been identified as two most preferred
techniques in solving personal decision problems. Both, the
strategies and techniques, are incorporated in the development
of a personal decision aid design model (PDADM). The
proposed model is then validated through prototyping method
in two different case studies (choosing development
methodology in mobile computing course; and purchasing a
mobile phone). In measuring the helpfulness of the prototypes,
this study is looking at four dimensions; reliability, decision
making effort, confidence, and decision process awareness. The
findings show that the respondents from different decision
situations perceived PDADM driven prototypes as helpful.
Keywords-Computerized decision aid, decision strategy,
multi criteria decision method, helpfulness
I. INTRODUCTION
uman commonly makes decisions of varying
importance on daily basis, thus, making the idea of
seeing personal decision making as a researchable matter
seems odd. However, studies have proven that most humans
are much poorer at decision making than they think. An
understanding of what decision making involves, together
with a few effective techniques, will help produce better
decisions. Thus, explains the existence of decision support
technology at different levels in various fields; for instance
in management, engineering and medicine.
To date, the attentions given to the improvement of decision
support at organization level has been enormous. On the
contrary, the study in improving the performance of decision
aid in personal decision making is still lacking and out of
date (Jungermann, 1980; Wooler, 1982; Bronner & de _______________________________
About-1 Department of Computer Science, College of Arts and Sciences,
Universiti Utara Malaysia, and is currently pursuing her PhD degree. She specializes in software application development and multimedia design.
(email: [email protected]) About-2 Professor and Applied Science Chair at the College of Arts and
Sciences, Universiti Utara Malaysia. She obtained her PhD from
University of Strathclyde, Glasgow, UK and has published more than 100 papers in journals and proceedings. She specializes in design research and
application engineering.
(email: [email protected])
Hoog, 1983; Alidrisi, 1987; Todd & Benbasat, 1991). The
existence of countless computerized personal decision aids
(either in the form of website, software or spreadsheet) these
days, has triggered the interest to investigate the suitability
and helpfulness of this technology to users, especially to the
non-expert users.
II. BACKGROUND OF STUDY
Although most personal decisions made are minor in nature
and in terms of its consequences, but still, being able to
make an actual decision out of any situation is indeed
essential (Rich,1999). Living in the 21st century, it is almost
impossible not to associate anything with computer
technology and this includes decision making. The evidence
of human limitations in information processing is
unquestionable, thus, the advantage of computerized
decision aids can be a major benefit for decision maker.
A. Research Problem Statement
Decisions are part of human life. Decision majorly involves
choices, and the hardest part is to make the right choice. It
can be demanding to choose without being clear about what
to choose and how to go about it, which later, may lead to
being indecisive. Moreover, indecisiveness may cause failed
actions and tendency of being controlled by others
(McGuire, 2002; Arsham, 2004). This shows that, under
appropriate circumstances, it is essential to apply decision
aid in making decision.
Over decades, there are countless of studies on decision
support technology that proposed the methods of improving
the performance of such technology at organization level.
However, in more recent years, the existence of
computerized personal decision aids (more examples and
reviews in section 3.2) are mushrooming and progressively
getting attention from users; for example like ―hunch‖
(www.hunch.com) and ―Let Simon Decide‖
(www.letsimondecide.com). This shows the relevance of
study in issues related to computerized decision aids
pertaining to personal decisions.
For more than five decades, most of research that have been
carried out on decision process focuses either only on
descriptive aspect (studying how decisions are being made)
or normative aspect (studying how some ideally logical
decider would make decisions). Decider in this context is
referring to decision aid. Prescriptive research on decision
processes, on how to help the decider progress from the
descriptive to the normative has, however, been scarce
(Brown, 2008). This is also has been mentioned earlier in
(Bell et al., 1988).
H

Global Journal of Computer Science and Technology Vol. 10 Issue 5 Ver. 1.0 July 2010 P a g e | 65
The term computerized decision aid refers to a very diverse
set of tools based on a varying techniques and complexity.
Generally, decision aids are designed with aims to help
human choosing the best decision possible with the
knowledge they have available. However, creating effective
decision aids is more than meet the eyes (Power, 1998).
Complex and structured mathematical techniques that
correspond to the uncertainty of a decision situation have
long held great theoretical appeal for helping decision
makers make better decisions. Studies by Hayes and Akhavi
(2008), Adam and Humphreys (2008), Zannier et al., (2007)
and Law (1996) do not agree with the earlier statement.
Hayes and Akhavi (2008) also affirmed that “decision aids
based on mathematically correct and sophisticated models
do not actually improve the decision making performance.
This is due to how the decision aids frame the problem in a
way that does not fit human decision making approaches”.
Furthermore, although uncertainty can be tackled using
complex mathematical tools, but more often than not,
decision maker will not have the time to implement the
structured mathematical strategies (McGuire, 2002; Arsham,
2004). These are further supported in Alidrisi (1987) and
Adam and Humphreys (2008). All the researchers agreed
that as far as personal decision making is concerned,
complex and structured mathematical techniques are not
preferred. Evidently, this indicates that a simple decision
making model is a more needed solution when compared to
the rigorous criteria weighing analysis.
All else being equal, decision makers prefer more accurate
and less effortful choices. Since these desires are
conflicting, thus selecting suitable strategy for the aid
strategy can be a tricky task (Payne, 1993; Naude, 1997; Al-
Shemmeri et al., 1997; Zanakis et al., 1998). Then again, the
appropriate use of decision strategies can contribute to
effective decision making (Cosier & Dalton, 1986).
B. Research Objectives
With the nature of the problem in mind, this study aims to
propose a personal decision aid design model that is
perceived helpful. The following specific aims are outlined
in means to support the general aim:
i. To identify the appropriate decision strategy and
decision technique for personal decision making
ii. To incorporate identified decision strategy and
technique in the development of the personal
decision aid design model
iii. To validate the personal decision aid design model
in different situations via prototyping method
iv. To measure the users‘ perceived helpfulness of the
prototypes
III. INTRODUCTION TO DECISION TECHNIQUES
Apparently, a working knowledge of decision theory is
needed before embarking into developing a decision aid
design model. The design of the model includes two
important expectations which are to accomplish a better
decision and ensuring the helpfulness of the model via
prototyping method.
Among the topics reviewed from the literatures include
decision making, multi criteria decision making (MCDM)
methods, computerized decision aids, related decision
theories, and aspects of helpfulness of information systems
in general and decision support in particular.
A. Decision Strategies and Techniques
Personal decision normally involves evaluation of many
choices and making selection out of many. Generally, there
are various strategies and techniques in making decision.
This study focuses on decision making problems when the
number of the criteria and alternatives is finite, and the
alternatives are given explicitly. Problems of this type are
called multi attribute decision making problems.
Compensatory and Non-compensatory Strategies
The decision strategies are commonly divided into two
broad categories, non-compensatory and compensatory.
Ullman (2002) defines non-compensatory strategies using
the example of one well documented non-compensatory
strategy; the lexicographic method.
As for compensatory strategies, Ullman (2002) defines it as
strategy which allows decision makers to evaluate the
alternatives by balancing the strong features of the
alternatives with its weaker features. Example of methods
that support compensatory strategy is decision matrix and
utility theory methods.
Lexicographic method
In the lexicographic method, criteria are ranked in the order
of their importance. The alternative with the best
performance score on the most important criterion is chosen.
If there are ties with respect to this criterion, the
performance of the tied alternatives on the next most
important criterion will be compared, and so on, till a unique
alternative is found (Linkov et al., 2004).
Maut
Multi-attribute utility theory (MAUT) is seen as an ideal
approach for personal decision making by many previous
researchers due to the nature of the decision problem. This is
supported in a number of studies (Bronner & Hoog, 1983;
Alidrisi, 1987; Işıklar & Büyüközkan, (2007); Adam &
Humphreys, 2008). In a study, Adam and Humphreys
(2008) described that, “MAUT is simple enough to
implement as compared to other model of decision making
which requires a more rigorous criteria weighing analysis
that is not necessarily needed for the role of decision
making”.
Pugh’s Method
Pugh's method is known as the simplified MAUT which was
first introduced by Pugh (1990) as the method for concept
selection in engineering decision. In Pugh approach, all
alternatives are compared to a datum alternative on each
P a g e | 66 Vol. 10 Issue 5 Ver. 1.0 July 2010 Global Journal of Computer Science and Technology
criterion. Alternatives are either better (+1), worse (-1), or the same (0) as the datum for a given criterion. The score for
each alternative is calculated as the number of occurrence of
(+1) minus the occurrence of (-1). Emphasis was placed on
using these comparisons to try to improve the weaknesses
(i.e., the –1‘s) of an alternative without weakening any
strength (i.e., +1‘s).
Weighted Decision Method
Weighted decision matrix involves mathematical reasoning
in solving single or multi attribute decision problems. Two
examples of weighted decision matrix are Weighted Sum
Model (WSM) and Weighted Product Model (WPM). WSM
is probably the most widely used approach, especially in
single dimensional problems (Triantaphyllou, 2000). If there
are m alternatives and n criteria then, the best alternative is
the one that satisfies the following expression (Fishburn,
1967):
n
j
jijiWSMscore
waA1
*max
, for i = 1, 2, 3 …m
WPM shares almost similar concept with WSM. The main
difference is that instead of addition in the model there is
multiplication. Each alternative is compared with the others
by multiplying a number of ratios, one for each criterion.
Each ration is raised to the power equivalent to the relative
weight of the corresponding criterion. In general, in order to
compare two alternatives AK and AL, the following product
has to be calculated according to this expression (Bridgman,
1992; Miller & Star, 1969):
jwn
j
LjKjLK aaAAR
1
||
,
where n is the number of criteria, aij is the actual value of i-
th alternative in terms of j-th criterion, and wj is the weight
of importance of the j-th criterion. If the term R (AK|AL) is
greater than or equal to one, then it indicates that alternative
AK is more desirable than alternative AL. The best
alternative is the one that is better than or at least equal to all
other alternatives.
Analytic Hierarchical Process
The Analytic Hierarchy Process (AHP) is a multi-criteria
decision-making approach and was introduced by Saaty
(1977 and 1994). The AHP has attracted the interest of
many researchers mainly due to the careful mathematical
properties of the method and the fact that the required input
data are rather easy to obtain. The AHP is a decision support
tool which can be used to solve complex decision problems.
It uses a multi-level hierarchical structure of objectives,
criteria, sub-criteria and alternatives.
Pros and Cons Analysis
Pros and Cons Analysis is a qualitative comparison method
in which good things (pros) and bad things (cons) are
identified about each alternative. Lists of the pros and cons,
based on the input of subject matter experts, are compared
one to another for each alternative. The alternative with the
strongest pros and weakest cons is preferred. The decision
documentation should include an exposition, which justifies
why the preferred alternative‘s pros are more important and
its cons are less consequential than those of the other
alternatives. Pros and Cons Analysis is suitable for simple
decisions with few alternatives and few discriminating
criteria of approximately equal value. It requires no
mathematical skill and can be implemented rapidly (Baker
et al., 2002).
B. Computerized Personal Decision Aids
A number of computerized decision aids have been
identified. The aids come in varying mediums like website,
spreadsheet, software and web application. All of the
identified aids can be used to assist in personal decision
making and also in other type of decision problems like
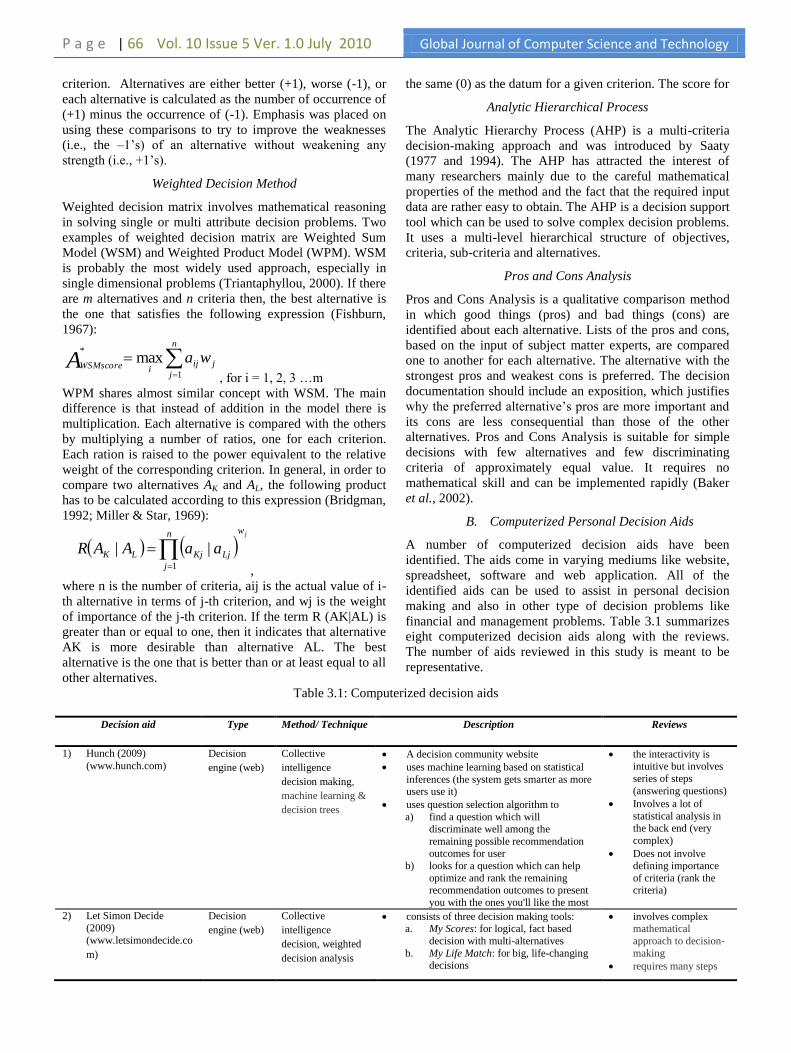
financial and management problems. Table 3.1 summarizes
eight computerized decision aids along with the reviews.
The number of aids reviewed in this study is meant to be
representative.
Table 3.1: Computerized decision aids
Decision aid Type Method/ Technique Description Reviews
1) Hunch (2009)
(www.hunch.com)
Decision
engine (web)
Collective
intelligence
decision making,
machine learning &
decision trees
A decision community website
uses machine learning based on statistical
inferences (the system gets smarter as more users use it)
uses question selection algorithm to
a) find a question which will discriminate well among the
remaining possible recommendation outcomes for user
b) looks for a question which can help
optimize and rank the remaining recommendation outcomes to present
you with the ones you'll like the most
the interactivity is intuitive but involves
series of steps
(answering questions)
Involves a lot of
statistical analysis in the back end (very
complex)
Does not involve defining importance
of criteria (rank the criteria)
2) Let Simon Decide
(2009)
(www.letsimondecide.co
m)
Decision
engine (web)
Collective
intelligence
decision, weighted
decision analysis
consists of three decision making tools: a. My Scores: for logical, fact based
decision with multi-alternatives
b. My Life Match: for big, life-changing decisions
involves complex mathematical
approach to decision-
making
requires many steps

Global Journal of Computer Science and Technology Vol. 10 Issue 5 Ver. 1.0 July 2010 P a g e | 67
c. My Points of View: for quick decision
combines user qualitative input with a
weighted, mathematical formula (weighs
alternatives against proprietary profile)
enables collective learning – share decision
summary with others
provides action plan for every decision
although the process is intuitive
3) Choose It! (1999)
(chooseit.sitesell.com/)
Web
application
Decision Matrix Online decision making tool that use decision matrix concept
can be used to make important business, financial, and personal life decisions
does not acknowledge the distinct difference
between subjective
and objective factors
4) Management For The Rest of Us
(MFTROU.com)
Decision Making Tool (n.d.)
(www.mftrou.com/decisi
on-making-tool.html)
Spreadsheet Decision Matrix based on classic decision grid concept
in Excel spreadsheet format which contains:
a. Overview of how to make decisions b. Decision Making Example
c. Template for Making Your Own
Decision
crowded text in the visual presentation
Very formal presentation (in excel
environment)
5) Decision Oven (2008)
(decisionoven.com/)
Software Decision matrix
with mathematical
reasoning
Off the shelf decision support software
can be used to support personal or business
decisions
acknowledge the
difference between
defining subjective
criteria and objective criteria
6) EduTools Decision
Engine (2009)
http://ocep.edutools.info/
summative/index.jsp?pj=
4
Web
application
Weighted decision
matrix
use a rational decision making process Only focus on
selecting a course management system,
not for generic
decision
User have to be
familiar with the products and features
that they wish to
compare
7) Career Decision Making Tool (CDMT) (n.d.)
(http://cte.ed.gov/acrn/cd
mt/tool.htm)
Instructor-
led,
classroom-
based online
tool
Guidelines and
teaching/learning
material
It‘s a career decision making tool
It suggests the following decision cycles:
a) Engaging b) Understanding
c) Exploring
d) Evaluating e) Acting
f) Reflecting
Only focus on career decision making, not
for generic decision
To be implemented in
teaching/learning
environment
8) Super Decisions (2004)
http://www.superdecisio
ns.com/
Software Analytic Network
Process
It extends the Analytic Hierarchy Process (AHP)
Uses same fundamental prioritization process based on deriving priorities through
judgments on pairs of elements or from
direct measurements.
Use complex decision analysis with rigorous
mathematical
reasoning
Solve for complex
decision problem
C. Theories in Modeling Decision Aid Process
Decision theory is an attempt to explicate how human make
decision, and in helping us understand the process of
decision making. A grasp of the fundamentals of decision
making is crucial to the effective design of the decision aid.
Therefore, this study discusses a number of related theories
that contribute to understanding multi criteria decision
making. The related literature is summarized in Table 3.2.
Table 3.2: Literature survey of related decision theories
Decision Theories References
Multi Attribute Utility
Theory
Baker et al. (2001); Alidrisi (1987); Dyer et al.
(1992); Keeney & Raiffa (1993); Collins et al. (2006)
Behavioral Decision
Theory
Einhorn & Hogarth (1981); Westaby (2005)
Bounded Rationality
Model
Bahl & Hunt (1984); March & Simon (1958);
Newell & Simon (1972) Implicit Favorite Model Bahl & Hunt (1984); Soelberg (1967)
Dominance Theory Easwaran (2007); Zsambok et al. (1992) Satisficing Theory Zsambok et al. (1992); Simon (1956)

P a g e | 68 Vol. 10 Issue 5 Ver. 1.0 July 2010 Global Journal of Computer Science and Technology
IV. RESEARCH METHODOLOGY
This study employed design science approach to address the
research questions posed earlier. The selection of a suitable
approach is based on the nature of a research, phases
involved and research outcomes. March and Smith (1995)
described design science research as a process which aims to
“produce and apply knowledge of tasks or situations in
order to create effective artifacts” in order to enhance
practice.
In general, process in design science research can be
structured into three main phases include ―problem
identification‖, ―solution design‖ and ―evaluation‖. Clearly,
design science research consists of a series of steps but in
practice they are not always executed in sequence; they
often are performed iteratively. This study implemented the
following steps, adapted from Offermann et al. (2009), and
driven by design science research approach.
A. Problem Identification
The phase is divided into the following steps: ―identify
problem‖, ―literature research‖ and ―expert interviews‖. It
specifies a research question and verifies its practical
relevance. As a result of this phase, the research questions
are defined.
Identify Problem
The existence of countless computerized personal decision
aids, these days, has triggered the interest to investigate the
relevance and helpfulness of ICT assistance in personal
decision making. Offermann et al. (2009) provides the
support for the identification of research problem in this
study, of which, they stated that researchable material ―may
arise from a current business problem or opportunities
offered by new technology‖.
Literature Search
In order to identify the research problem, literature search is
used. As a summary, a number of decision strategies,
decision techniques (MCDM methods), computerized
personal decision aids, and decision making related theories
were reviewed in this study. This results in strengthening the
needs for a solution to propose a proper decision making
model for personal decisions.
Expert Interview
Interviews with experts in the related field were conducted
to identify relevancies of the addressed problems.
Discussion with the experts involves brainstorming of idea,
approval of idea and reviews on research material. Three
experts have been referred to during this stage and also at
certain stage of this study. The experts are professors and
academics specializing in one of these fields: model-based
systems and qualitative reasoning, quantitative analysis; and
artificial intelligence.
B. Solution Design
In the second phase, the solution is designed and proposed.
After identifying the research problems and evaluating its
relevance, a solution is developed in the form of artifacts.
Varying methods are used to come out with all the artifacts
including content analysis, expert review, focus group study,
participatory design, prototyping and elicitation work.
C. Evaluation
In this study, evaluation is achieved by the mean of case
studies and laboratory experiments. The findings of this
stage are further explained in Result section.
V. DEVELOPMENT OF PERSONAL DECISION AID DESIGN
MODEL (PDADM)
This section describes the process in developing the
PDADM. Prior to this, an appropriate decision strategies for
personal decision making need to be identified, and
followed by a selection of appropriate decision technique
(i.e. MCDM method). Afterward, both will be incorporated
in the development of the decision aid design model. The
method used in developing PDADM involves content
analysis, participatory design and expert review.
A. Decision Strategy Selection
From the literature search, two common decision strategy
groups are studied; non-compensatory and compensatory.
Findings indicate that non-compensatory strategies do not
allow very good performance relative to one criterion to
make up for poor performance on another. In other words,
no matter how good an alternative is, if it fails on one
evaluative criterion, it is eliminated from consideration.
As for compensatory strategies, they allow the decision
makers to balance the good features of an alternative with its
weaker features. Additionally, the compensatory strategies
give greater accuracy in decision but the non-compensatory
strategies take the least time to accomplish decision.
In responding to the earlier discussion, this study decided to
combine the implementation of compensatory and non-
compensatory strategies in order to obtain the ―best of both
worlds‖. This is supported by Ullman (2002) in his work
which stated that “a method that gives the accuracy of the
compensatory strategy with the effort of the non-
compensatory strategy would add value to human decision
making activities”.
B. Decision Technique Selection
In light of the numerous decision techniques available to
decision makers, study of focus groups is used in order to
get some understanding of which kind of techniques that is
more preferred by the (non-expert) decision maker. This
study also decided that introducing more than one would

Global Journal of Computer Science and Technology Vol. 10 Issue 5 Ver. 1.0 July 2010 P a g e | 69
enhance focus groups abilities to understand that there is not
a single right way to resolve a decision.
There are five techniques that were introduced to the focus
group of 51 (non-expert) participants of varying
demographic background; weighted sum method (WSM),
Pugh matrix (PUG), Analytic Hierarchy Process (AHP), pro
and cons analysis (PCA), and lexicographic (LEX). All
methods involve defining criteria on which to compare a set
of alternatives. The group was encouraged to solve the same
decision scenario (choosing a laptop from 4 different
brands) using each or at least three of the techniques
mentioned above one at a time. This study did not make it
compulsory for them to use all the techniques, because of
varying rate of understanding of the techniques after first
time being introduced to them. Hence, unutilized techniques
show respondents‘ difficulty to understand and to get
familiar with it.
After establishing the focus group previous experience with
each decision technique, the group was asked which
technique helped the most and which they had more
confidence in. Next, the group was asked which tool they
think is ―least prone to bias‖.
The results from the survey are summarized for each
question. The first two questions concerned (i) which
technique that they think helped the most if they were to use
it in real decision and (ii) which technique they had the most
confidence in. As shown in Table 5.1, technique PUG and
LEX scored among the highest number of respondents for
both questions.
Table 5.1: Helpful and Confidence
WSM PUG AHP PCA LEX
Helpful 21 39 3 19 43
More
confidence in
14 31 3 15 45
The next question asked the group which technique they felt
was least prone to bias (that is, is the most difficult to
manipulate to achieve preconceived results). These results
are shown in Table 5.2.
Table 5.2: Bias
WSM PUG AHP PCA LEX
Least prone to bias 34 41 2 18 22
Interestingly, even though majority of the participants had
more confidence in LEX, the score changes when it comes
to biasness of the technique. More than half of them felt that
PUG was less prone followed by second the highest scored
technique; the WSM. Nevertheless, the participants noted
that it would take even more time and effort to achieve
decision with the PUG and WSM. It is noted that AHP
scores the lowest response for all three questions, which is
due to refusal of most respondents to utilize it. Evidently,
from this focus group study, PUG and LEX are selected as
the potential techniques to be incorporated in the design of
proposed personal decision aid design model.
PUG or Pugh matrix is originally a concept selection
method used by engineers for design decision (Pugh, 1990).
Since it was introduced, there have been many different
modified versions of Pugh matrix analysis in various
examples of its applications. In line with this, a participatory
design study was conducted to learn which implementation
of the Pugh matrix is preferred and suitable with the non-
expert decision is making style. There are five versions (see
Appendix) of Pugh matrix approach (including the original)
used in this participatory design study. A total of 66
participants of varying demographic background were
involved in this study.
Firstly, the participants were briefly explained about the
different implementations of the Pugh matrix method. Then,
they were asked to solve a designated decision problem
(choosing a laptop from four different brands) using all four
versions; one at a time. Later, the participants were asked
ten questions (refer Table 5.3) based on their experience
using the different implementation of Pugh matrix and also
three additional demographic questions on gender, IT skill
and age.
Table 5.3: Questions asked in the participatory design study
No. Question
Q1 Are you familiar with the use of Pugh matrix?
Q2 Do you find it difficult to choose the first reference?
Q3 Do you prefer to weigh or not to weigh the criteria?
Q4 Do you prefer to use percentage (%) or scaled
values (e.g. 1 to 5) as weight?
Q5 Do you prefer to use comparative symbols (+, -, S)
or scaled values (e.g. 1 to 5) to rate the alternatives?
Q6 Which version of Pugh matrix do you think is most
helpful?
Q7 Which version of Pugh matrix you had more
confidence in?
Q8 In your opinion, which version is least prone to
bias?
Q9 Would you use either of these Pugh matrix approach
in your real life decision?
Q10 Would it be easier if Pugh matrix process is
automated (i.e. in a computerized format)?
All the responses from participants were recorded and
summarized in the following tables (Table 5.4 to 5.12). The
first question dealt with the previous experience of the
participants with Pugh matrix method. As shown in Table
5.4, majority of the participants had not used the Pugh
approach before this study.

P a g e | 70 Vol. 10 Issue 5 Ver. 1.0 July 2010 Global Journal of Computer Science and Technology
Table 5.4: Familiar with Pugh matrix
Yes No NA*
Familiar? 9 57 0
*=No answer
The next question asked about participants experience
during the study when they were required to choose their
own reference for comparative analysis in Pugh matrix take
place. As shown in Table 5.5, more than half of the
participants claimed that it is not a problem for them to
perform that task. But the number of participants who
claimed the opposite was not far behind.
Table 5.5: Difficulty to choose first reference
Yes No NA
Difficult? 24 42 0
The third and fourth questions asked about participants
experience with the use of weight in defining the importance
of each of the evaluative criteria. As shown in Table 5.6,
majority of the participants preferred to weigh their criteria
during the process. From this majority group, 35 of them
preferred weighing the criteria using scaled values than
using percentage (Table 5.7). This number represented more
than half of the participants.
Table 5.6: Weighing criteria
Yes No NA
Weighing criteria 42 21 3
Table 5.7: Use percentage or scaled values for weighing
Percentage Scaled
Values
NA
Preferred
weighing
criteria
26 35 5
The fifth question asked the participants if they prefer to use
symbols; + for better, - for worse and + for equal); or scaled
value to perform the comparative analysis of alternatives
against the reference on each criterion. Majority agreed that
the use of symbols is more convenience for the comparative
analysis.
Table 5.8: Use symbols or scaled values
Symbols Scaled Values NA
Preferred
evaluation
styles
52 12 2
The next two questions (question 6 and 7) dealt with
participants experience after using the Pugh approach to
solve the decision problem. As shown in Table 5.9, the
obviously dominant choice for both questions is the original
version. The participants, as a whole, not only felt like the
original version helped the most in assisting them with
decision problem, but they had more confidence in it.
Table 5.9: Helpful and confidence
Original MV1 MV2 MV3 MV4 NA
Helpful 22 11 13 7 8 5
More
confidence in
21 10 14 8 10 3
MV=modified version
Even though majority has more confidence in the original
version, but when asked about which version they think is
least prone to bias, the majority score shows contrasting
response. One third of the participants agreed MV2
(modified version #2) is the one least prone to bias.
Table 5.10: Bias
Original MV1 MV2 MV3 MV4 NA
Least prone
to bias
15 11 22 10 4 4
Concerning the use of Pugh approach in real decision
situation, 49 of 66 indicated that they will consider using
this approach, 16 indicated that they would not, and one did
not respond to this question (refer Table 5.11).
Table 5.11: Will use Pugh matrix in real situation
Yes No NA
Will use Pugh approach in
real situation?
49 16 1
Lastly, when asked whether the participants think that by
automating the process of Pugh matrix (in computerized
format) will make it easier to use this approach, majority of
them answered yes. From 12 of the remaining participants
who answered no, 7 of them appeared to claim themselves
as having very less IT skill.
Table 5.12: Automate Pugh matrix
Yes No NA
Automating Pugh approach
makes it easier?
54 12 0
(5)
C. Incorporating the Decision Strategy and Decision
Technique in PDADM
The results; decision strategies and techniques, obtained
from previous focus group study are incorporated in the
development of personal decision aid design model. The
model comprises of the flow of the decision process and the
relationship between input and outcome of each step of the
process. Figure 5.1 illustrates the previous statement clearer.

Global Journal of Computer Science and Technology Vol. 10 Issue 5 Ver. 1.0 July 2010 P a g e | 71
Figure 5.1: Personal Decision Aid Design Model (PDADM)
VI. IMPLEMENTING PDADM IN DIFFERENT SITUATIONS
The proposed PDADM is validated through development of
two prototypes in two different case studies; choosing
development methodology in mobile computing course; and
purchasing a mobile phone. These case studies involved two
very different decision situations which were intended to
showcase the flexibility and functionality of the proposed
model.
A. Case study 1: Choosing a Development Methodology in
Mobile Programming Course
Over the last decade, mobile computing has received
significant interest in the academic and industrial research
community. As a result, demands from the industry for
graduates of mobile computing course are rising (Gillespie,
2007).
The graduates who are entering the mobile development
world are expected to put up with the challenges imposed by
the mobile environment. Heyes (2002) reported that mobile
developers face twice as much as challenges than
developing traditional system application due to the specific
demand and technical constraints of mobile environment. In
addition to that, inadequate research in assisting developers
with the mobile development issues is also highlighted in
the GI Dagstuhl Research Seminar in 2007 (König-Ries,
2009). Within this perspective, it is believed that selecting a
suitable development methodology is the key to these issues.
The use of a methodology is important, as a project can be
structured into small, well-defined activities where the
sequence and interaction of these activities can be specified
(Avison & Fitzgerald, 1990). Hence, students should be
exposed to the importance of adopting a suitable
methodology for a mobile development project.
development project is another challenge in itself (Bertini et
al., 2006; Heikkinen & Still, 2005; Atkinson & Olla, 2004;
Heyes, 2002; Afonso et al., 1998). Less experienced
developers will find the task even more challenging, thus,
this study seeks to propose a solution by implementing the
proposed PDADM via a development of prototype named as
md-Matrix (as in mobile development methodology matrix).
Features and Screenshots of md-Matrix
This decision-making tool is mainly aimed at assisting
developers (especially the novice) in choosing the most
appropriate development methodology for mobile
development project. The numbers of available development
methodologies in md-Matrix are meant to be representative;
only for the purpose of demonstrating the decision process
that occur in selecting a mobile development methodology.
The prototype of md-Matrix features the following (see
Table 6.1):
Table 6.1: Features of md-Matrix
md-Matrix
Alternatives filter Mobile application technologies: Generic
J2ME*
Flash Lite* Native
Web based
Object Oriented Platform dependent
Criteria 12 objective
12 subjective
Alternatives Flash Lite (4 methodologies)
J2ME (4 methodologies)
Feedback Pop-up window
On screen text
Interface agent
* enabled in this prototype
P a g e | 72 Vol. 10 Issue 5 Ver. 1.0 July 2010 Global Journal of Computer Science and Technology
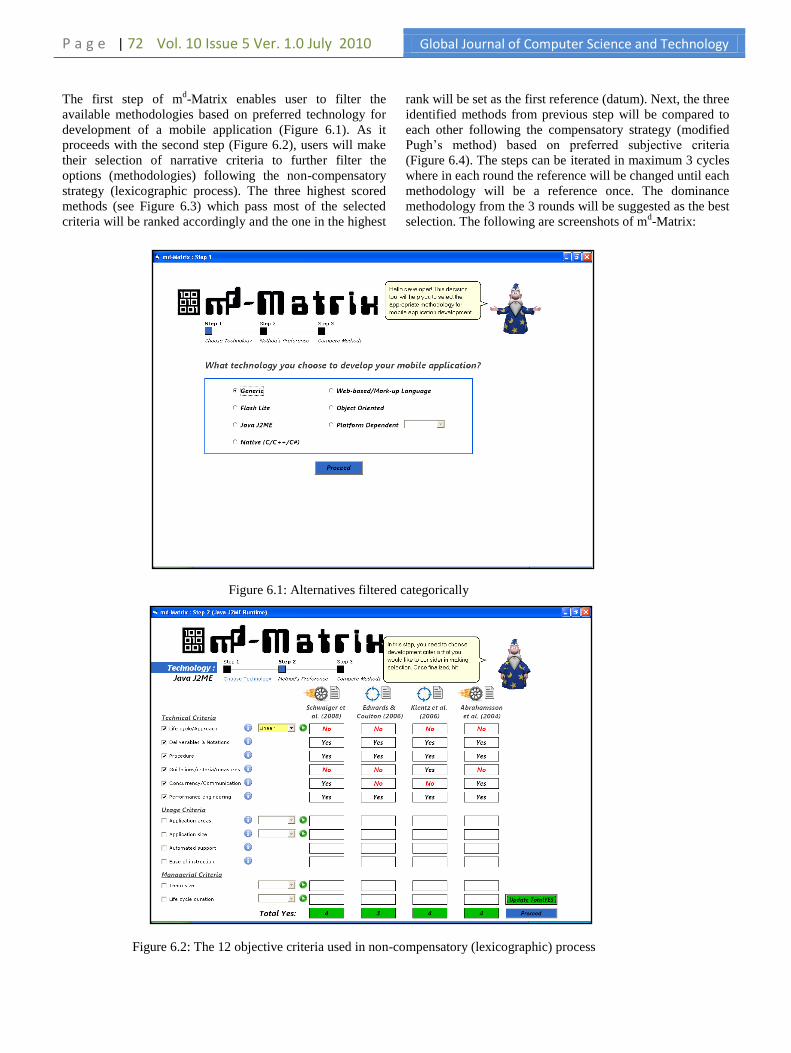
The first step of md-Matrix enables user to filter the
available methodologies based on preferred technology for
development of a mobile application (Figure 6.1). As it
proceeds with the second step (Figure 6.2), users will make
their selection of narrative criteria to further filter the
options (methodologies) following the non-compensatory
strategy (lexicographic process). The three highest scored
methods (see Figure 6.3) which pass most of the selected
criteria will be ranked accordingly and the one in the highest
rank will be set as the first reference (datum). Next, the three
identified methods from previous step will be compared to
each other following the compensatory strategy (modified
Pugh‘s method) based on preferred subjective criteria
(Figure 6.4). The steps can be iterated in maximum 3 cycles
where in each round the reference will be changed until each
methodology will be a reference once. The dominance
methodology from the 3 rounds will be suggested as the best
selection. The following are screenshots of md-Matrix:
Figure 6.1: Alternatives filtered categorically
Figure 6.2: The 12 objective criteria used in non-compensatory (lexicographic) process

Global Journal of Computer Science and Technology Vol. 10 Issue 5 Ver. 1.0 July 2010 P a g e | 73
Figure 6.3: Result obtained in non-compensatory process
Figure 6.4: The 12 subjective criteria used in compensatory process
md-Matrix as a Learning Tool
Along providing solution to the selection of development
methodology, md-Matrix also can be utilized as an
educational tool either in academic or industry. Learning
institutions can utilize it for teaching purposes to educate
students on the need to have a well-structured process of
developing mobile applications. As for the industry, this tool
can be used as one of the materials for training of new
interns and apprentice developers.
P a g e | 74 Vol. 10 Issue 5 Ver. 1.0 July 2010 Global Journal of Computer Science and Technology
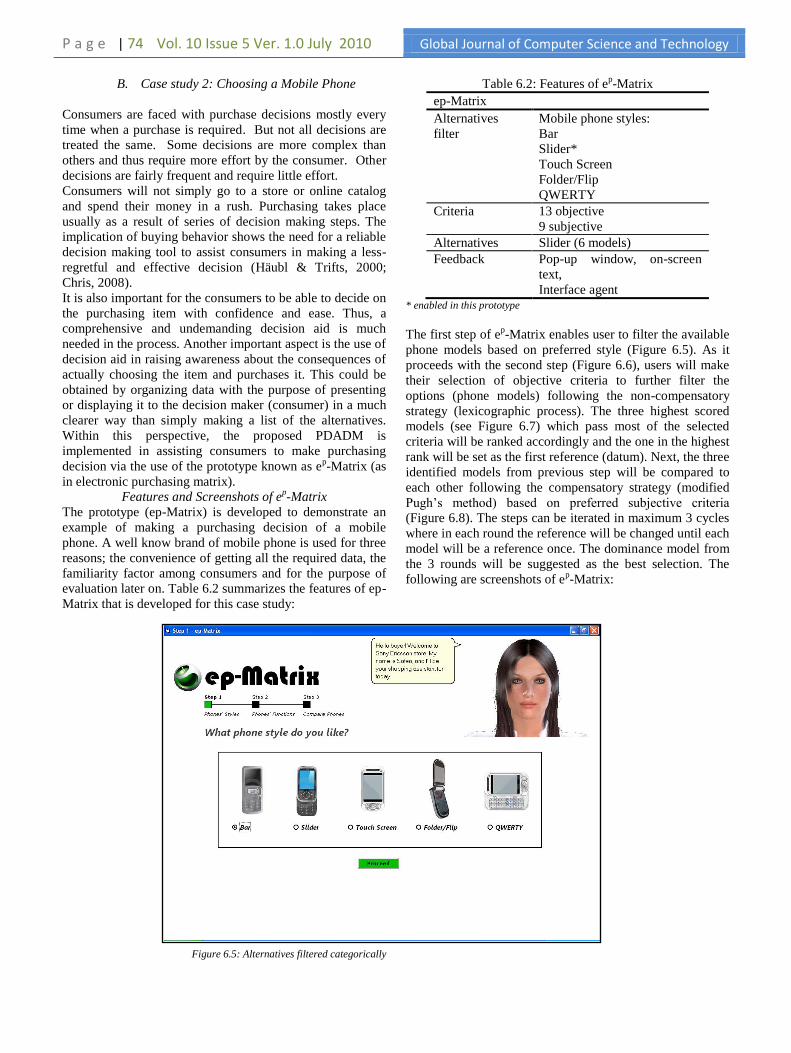
B. Case study 2: Choosing a Mobile Phone
Consumers are faced with purchase decisions mostly every
time when a purchase is required. But not all decisions are
treated the same. Some decisions are more complex than
others and thus require more effort by the consumer. Other
decisions are fairly frequent and require little effort.
Consumers will not simply go to a store or online catalog
and spend their money in a rush. Purchasing takes place
usually as a result of series of decision making steps. The
implication of buying behavior shows the need for a reliable
decision making tool to assist consumers in making a less-
regretful and effective decision (Häubl & Trifts, 2000;
Chris, 2008).
It is also important for the consumers to be able to decide on
the purchasing item with confidence and ease. Thus, a
comprehensive and undemanding decision aid is much
needed in the process. Another important aspect is the use of
decision aid in raising awareness about the consequences of
actually choosing the item and purchases it. This could be
obtained by organizing data with the purpose of presenting
or displaying it to the decision maker (consumer) in a much
clearer way than simply making a list of the alternatives.
Within this perspective, the proposed PDADM is
implemented in assisting consumers to make purchasing
decision via the use of the prototype known as ep-Matrix (as
in electronic purchasing matrix).
Features and Screenshots of ep-Matrix
The prototype (ep-Matrix) is developed to demonstrate an
example of making a purchasing decision of a mobile
phone. A well know brand of mobile phone is used for three
reasons; the convenience of getting all the required data, the
familiarity factor among consumers and for the purpose of
evaluation later on. Table 6.2 summarizes the features of ep-
Matrix that is developed for this case study:
Table 6.2: Features of ep-Matrix
ep-Matrix
Alternatives
filter
Mobile phone styles:
Bar
Slider*
Touch Screen
Folder/Flip
QWERTY
Criteria 13 objective
9 subjective
Alternatives Slider (6 models)
Feedback Pop-up window, on-screen
text,
Interface agent * enabled in this prototype
The first step of ep-Matrix enables user to filter the available
phone models based on preferred style (Figure 6.5). As it
proceeds with the second step (Figure 6.6), users will make
their selection of objective criteria to further filter the
options (phone models) following the non-compensatory
strategy (lexicographic process). The three highest scored
models (see Figure 6.7) which pass most of the selected
criteria will be ranked accordingly and the one in the highest
rank will be set as the first reference (datum). Next, the three
identified models from previous step will be compared to
each other following the compensatory strategy (modified
Pugh‘s method) based on preferred subjective criteria
(Figure 6.8). The steps can be iterated in maximum 3 cycles
where in each round the reference will be changed until each
model will be a reference once. The dominance model from
the 3 rounds will be suggested as the best selection. The
following are screenshots of ep-Matrix:
Figure 6.5: Alternatives filtered categorically

Global Journal of Computer Science and Technology Vol. 10 Issue 5 Ver. 1.0 July 2010 P a g e | 75
Figure 6.6: The 13 objective criteria used in non-compensatory (lexicographic) process
Figure 6.7: Result obtained in non-compensatory process

P a g e | 76 Vol. 10 Issue 5 Ver. 1.0 July 2010 Global Journal of Computer Science and Technology
Figure 6.8: The 9 subjective criteria used in compensatory process (modified Pugh’s method)
VII. HELPFULNESS OF PDADM DRIVEN PROTOTYPES
This study intends to investigate users‘ perception towards helpfulness of the PDADM driven prototypes in
both case studies. In measuring helpfulness, quantitative
data need to be gathered
through an instrument. In addition to that, subjective input
through interviews and observations might help enriching
the collected data. To develop the instrument for measuring
helpfulness, an elicitation work as summarized in Figure 7.1
was performed (Ariffin, 2009).
Figure 7.1: Summary of elicitation work
Figure 7.1 illustrates the processes involved in the
instrument development; beginning with elicitation works to
determine measuring items until the instrument is ready for
pilot testing. The instrument was constructed based on the
dimensions identified from elicitation work. Later,
measuring items were added based on the reviewed
literatures. Some modifications are made to the measuring
items, in terms of rewording some items and repositioning
some items into another dimension of the instrument. In
measuring the helpfulness of the PDADM driven
prototypes, this study is looking at four important
dimensions; reliability, decision making effort, confidence,
and decision process awareness. The instrument was then
named as Q-HELP, which contains four dimensions:
reliability, decision making effort, confidence, and decision
process awareness

Global Journal of Computer Science and Technology Vol. 10 Issue 5 Ver. 1.0 July 2010 P a g e | 77
Table 7.1 illustrates the reliability of Q-HELP by each
dimension. In the evaluation, respondents are required to
rate the helpfulness level based on each dimensions using
the seven point Likert scales; which are 1 = strongly
disagree, 2 = disagree, 3 = somewhat disagree, 4 =
undecided, 5 = somewhat agree, 6 = agree and 7 = strongly
agree. Respective measuring items can be seen in Table 7.2.
Table 7.1: Reliability of dimensions in Q-HELP
Dimensions Cronbach Alpha value
Reliability 0.755
Decision making effort 0.689
Confidence 0.906
Decision process
awareness
0.771
One hundred and seven respondents participated in the lab
experiment; 63 of them were evaluated for the first case
study where as 44 for the second case study. The experiment
proceeded in two steps for each case study. In the first step,
participants were required to accomplish the selection task
aided by other tool or material. The main concern is to study
the process that they went through before they can actually
make a selection. In the second step, participants solved the
same decision problem by making selection with the
assistance of proposed PDADM driven prototypes in each
case study.
Upon completion of both steps, participants were requested
to answer 26 questions from all four dimensions of
helpfulness in Q-HELP. The instrument recorded their
perceptions and experiences of making a selection for the
same decision problem in the experiment. Table 7.2 also
depicts the mean responses for each item in Q-HELP
answered by participants in respective case studies.
Table 7.2: Q-HELP items and mean responses by each item for each case study
Reliability md-Matrix
n=63
ep-Matrix
n=44
{name of prototype}* can be relied to function properly. 5.22 5.84
{name of prototype}* is suitable to my style of decision making. 5.02 5.43
{name of prototype}* is capable of helping me in making a choice. 5.25 5.80
{name of prototype}* provides the help that I need to make a selection. 5.33 5.75
{name of prototype}* provides the advice that I require to make my decision. 5.08 5.64
I would use {name of prototype}* if I were attempting to make a choice that is ―good enough‖ but
not necessarily the best.
4.95 5.82
{name of prototype}* is suitable even during limited time to make a decision. 5.03 5.82
Group Mean A 5.13 5.73 Decision making effort It was very time consuming to choose a {item} from the available options. 4.81 5.39 It was very difficult to choose a {item} from the available options. 4.43 5.27
{name of prototype}* allowed me to carefully consider the decision made. 5.35 5.84
The decision process in {name of prototype}* is logical to me. 5.30 6.14
The decision process in {name of prototype}* is simple to me. 5.19 5.91
I understand how decision process in {name of prototype}* works. 5.17 5.70
I found it very easy to interpret the decision justification provided by {name of prototype}*. 5.06 5.77
Group Mean B 5.04 5.72 Confidence
I am satisfied with the recommended solution. 5.27 5.75
The recommended solution reflects my initial preferences. 5.16 5.61
I am confident that I am able to make selection with {name of prototype}*. 5.17 5.86
I am confident that I can justify the selection that I made with {name of prototype}*. 5.17 5.93
I feel that the problem in making selection is solved. 5.05 5.45
I am very pleased with my experience using {name of prototype}*. 5.48 5.77
Group Mean C 5.22 5.73 Decision process awareness
{name of prototype}* makes me realize I cannot get everything from just one alternative. 5.44 5.93
{name of prototype}* is an aid for me in clarifying what I want. 5.27 5.84
{name of prototype}* shows my subconscious decision process. 5.11 5.73
{name of prototype}* helps me not to be easily influenced by others in making selection. 5.29 5.98
{name of prototype}* makes me more independent of others in making a selection. 5.22 6.00
I learned a lot about the problem using {name of prototype}*. 5.48 6.00
Group Mean D 5.30 5.91 *replaced with md-Matrix or ep-Matrix based on respective case studies
P a g e | 78 Vol. 10 Issue 5 Ver. 1.0 July 2010 Global Journal of Computer Science and Technology
Perceived Reliability of Both Decision Aids
5.225.33
5.84
5.43
5.03
4.95
5.08
5.02
5.25
5.82
5.82
5.64
5.755.8
4.4
4.6
4.8
5
5.2
5.4
5.6
5.8
6
1 2 3 4 5 6 7
Items in instrument
Avera
ge
md-Matrixep-Matrix
Perceived Confidence of Both Decision Aids
5.48
5.93
5.77
5.05
5.17
5.175.16
5.27
5.455.86
5.61
5.75
4.6
4.8
5
5.2
5.4
5.6
5.8
6
1 2 3 4 5 6
Items in instrument
Avera
ge
md-Matrixep-Matrix
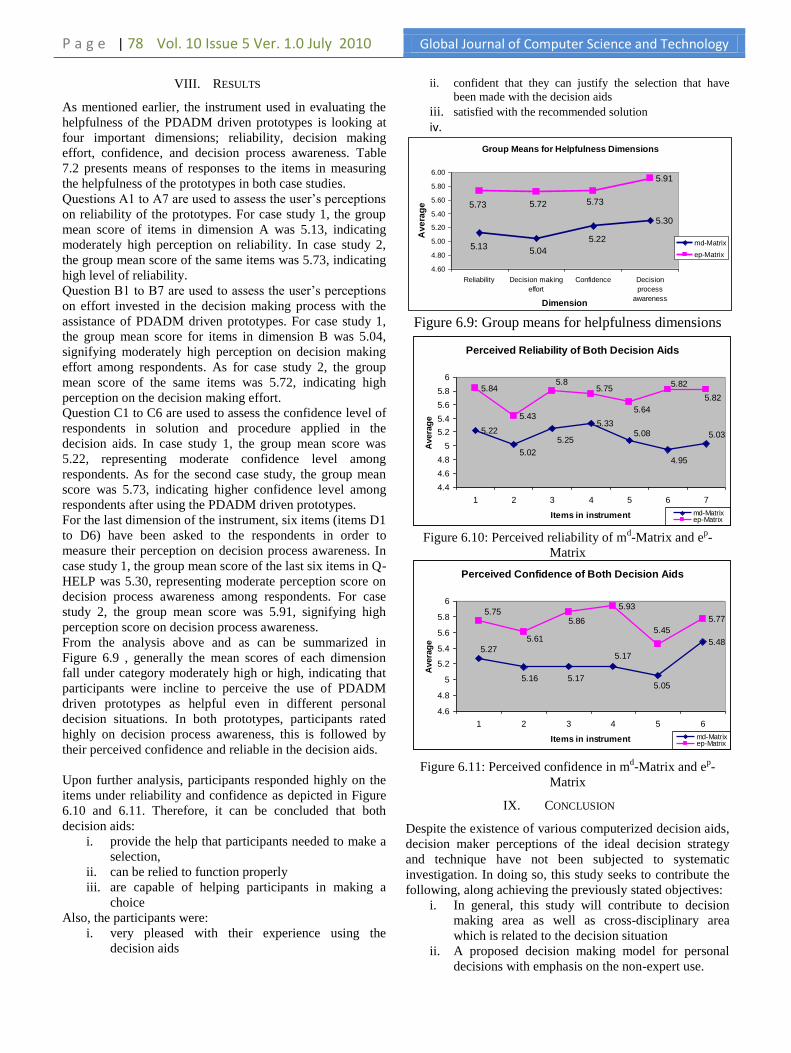
VIII. RESULTS
As mentioned earlier, the instrument used in evaluating the
helpfulness of the PDADM driven prototypes is looking at
four important dimensions; reliability, decision making
effort, confidence, and decision process awareness. Table
7.2 presents means of responses to the items in measuring
the helpfulness of the prototypes in both case studies.
Questions A1 to A7 are used to assess the user‘s perceptions
on reliability of the prototypes. For case study 1, the group
mean score of items in dimension A was 5.13, indicating
moderately high perception on reliability. In case study 2,
the group mean score of the same items was 5.73, indicating
high level of reliability.
Question B1 to B7 are used to assess the user‘s perceptions
on effort invested in the decision making process with the
assistance of PDADM driven prototypes. For case study 1,
the group mean score for items in dimension B was 5.04,
signifying moderately high perception on decision making
effort among respondents. As for case study 2, the group
mean score of the same items was 5.72, indicating high
perception on the decision making effort.
Question C1 to C6 are used to assess the confidence level of
respondents in solution and procedure applied in the
decision aids. In case study 1, the group mean score was
5.22, representing moderate confidence level among
respondents. As for the second case study, the group mean
score was 5.73, indicating higher confidence level among
respondents after using the PDADM driven prototypes.
For the last dimension of the instrument, six items (items D1
to D6) have been asked to the respondents in order to
measure their perception on decision process awareness. In
case study 1, the group mean score of the last six items in Q-
HELP was 5.30, representing moderate perception score on
decision process awareness among respondents. For case
study 2, the group mean score was 5.91, signifying high
perception score on decision process awareness.
From the analysis above and as can be summarized in
Figure 6.9 , generally the mean scores of each dimension
fall under category moderately high or high, indicating that
participants were incline to perceive the use of PDADM
driven prototypes as helpful even in different personal
decision situations. In both prototypes, participants rated
highly on decision process awareness, this is followed by
their perceived confidence and reliable in the decision aids.
Upon further analysis, participants responded highly on the
items under reliability and confidence as depicted in Figure
6.10 and 6.11. Therefore, it can be concluded that both
decision aids:
i. provide the help that participants needed to make a
selection,
ii. can be relied to function properly
iii. are capable of helping participants in making a
choice
Also, the participants were:
i. very pleased with their experience using the
decision aids
ii. confident that they can justify the selection that have
been made with the decision aids
iii. satisfied with the recommended solution
iv.
Figure 6.9: Group means for helpfulness dimensions
Figure 6.10: Perceived reliability of md-Matrix and e
p-
Matrix
Figure 6.11: Perceived confidence in md-Matrix and e
p-
Matrix
IX. CONCLUSION
Despite the existence of various computerized decision aids,
decision maker perceptions of the ideal decision strategy
and technique have not been subjected to systematic
investigation. In doing so, this study seeks to contribute the
following, along achieving the previously stated objectives:
i. In general, this study will contribute to decision
making area as well as cross-disciplinary area
which is related to the decision situation
ii. A proposed decision making model for personal
decisions with emphasis on the non-expert use.
Group Means for Helpfulness Dimensions
5.30
5.91
5.22
5.045.13
5.735.725.73
4.60
4.80
5.00
5.20
5.40
5.60
5.80
6.00
Reliability Decision making
effort
Confidence Decision
process
awarenessDimension
Av
era
ge
md-Matrix
ep-Matrix
Global Journal of Computer Science and Technology Vol. 10 Issue 5 Ver. 1.0 July 2010 P a g e | 79
iii. Two prototypes which utilizing the proposed
decision model in two different situations;
purchasing decision and educational decision.
iv. Algorithms of the developed prototypes.
v. Instruments to measure users‘ perceived
helpfulness of the prototypes.
vi. A comparative analysis of five decision strategies
which provides research basis for related future
studies.
X. REFERENCES
1) Adam, F. and Humphreys, P. (2008). Encyclopedia
of Decision Making and Decision Support
Technologies. Idea Group Inc.
2) Alidrisi, M.M. (1987). Use of multi attribute utility
theory for personal decision making. International
Journal of Systems Science, 18(12), 2229—2237.
3) Al-Shemmeri, T., Al-Kloub, B. and Pearman, A.
(1997). Model Choice in Multicriteria Decision
Aid. European Journal of Operational Research,
97, 550-560.
4) Afonso, A.P., Regateiro, F.S., and Silva, M.J.
(1998). Dynamic Channels: A New Development
Methodology for Mobile Computing Applications.
Retrieved, Jan 22, 2007, from
http://www.di.fc.ul.pt/biblioteca/tech-reports.
5) Ariffin, A.M. (2009). Conceptual Design Model of
Reality Learning Media (RLM): Towards
Entertaining and Fun Electronic Learning
Materials (eLM) (Ph.D. Dissertation, Universiti
Utara Malaysia)
6) Arsham, H. (2004). Decision Making: Overcoming
Serious Indecisiveness. Retrieved March 10, 2009
from
http://home.ubalt.edu/ntsbarsh/opre640/partXIII.ht
m.
7) Atkinson, C. and Olla, P. (2004). Developing a
wireless reference model for interpreting
complexity in wireless projects. Industrial
Management & Data Systems, 104, 262-272.
8) Avison, D.E. and Fitzgerald, G. (1990).
Information Systems Development: Methodologies,
Techniques and Tools. London: Blackwell.
9) Bahl, H.C. and Hunt, R.G. (1984). Decision-
Making Theory and DSS Design. Data Base, 15(4),
10-14.
10) Baker, D., Bridges, D., Hunter, R., Johnson, G.,
Krupa, J., Murphy, J. and Sorenson, K. (2002)
Guidebook to Decision-Making Methods, WSRC-
IM-2002-00002, Retrieved from Department of
Energy, USA website: http://emi-
web.inel.gov/Nissmg/Guidebook_2002.pdf.
11) Bell, D.E., Raiffa, H., and Tversky, A. (1988).
Descriptive, normative, and prescriptive
interactions in decision making. In D. Bell, Raiffa,
H., and A. Tversky (Eds.), Decision making:
descriptive, normative, and prescriptive
interactions (pp. 9-32). Cambridge: Cambridge
University Press.
12) Bertini, E., Gabrielli, S., and Kimani, S. (2006).
Appropriating and Assessing Heuristics for Mobile
Computing. Proceedings of the working
Conference on Advanced Visual Interfaces AVI’06,
Venezia, Italy. 119-126.
13) Bridgman, P. W. (1922). Dimensional analysis.
New Haven, CT: Yale University Press.
14) Brown, R. (2008). Decision Aiding Research
Needs. In. Adam F. and Humphreys P. (Eds.),
Encyclopedia of Decision Making and Decision
Support Technologies (pp. 141-147). IGI Global.
15) Bronner, F. & de Hoog, R. (1982). Non-Expert Use
of a Computerized Decision Aid. In Humphreys,
P., Svenson, O. and Anna Vári, A. (Eds.),
Analysing and Aiding Decision Processes (pp. 281-
299). North Holland: Amsterdam.
16) Christ, P. (2008). KnowThis: Marketing Basics.
KnowThis Media.
17) Collins, T.R., Rossetti, M.D., Nachtmann, H.L. &
Oldham J.R. (2006). The use of multi-attribute
utility theory to determine the overall best-in-class
performer in a benchmarking study.
Benchmarking: An International Journal, 13, 431-
446.
18) Cosier, R.A. and Dalton, D.R. (1986). The
Appropriate Choice and Implementation of
Decision Strategies. Journal of Industrial
Management & Data Systems, 86(3/4), 18-21.
Abstract retrieved from
http://www.emeraldinsight.com/10.1108/eb057436
19) Dyer, J.S., Fishburn, P.C., Steuer, R.E., Wallenius,
J. and Zionts, S. (1992). Multiple Criteria Decision
Making, Multiattribute Utility Theory: The Next
Ten Years. Management Science, 38(5), 645-654.
20) Easwaran, Kenny (2009). Dominance-based
Decision Theory. Unpublished manuscript.
Retrieved from
http://www.ocf.berkeley.edu/~easwaran/papers/dec
ision.pdf
21) Einhorn, H.J. and Hogarth, R.M. (1981).
Behavioral Decision Theory: Process of Judgment
and Choice. Annual Reviews Psychology, 32, 53-
88.
22) Fishburn, P.C. (1967). Additive Utilities with
Incomplete Product Set: Applications to Priorities
and Assignments. American Society of Operations
Research (ORSA), Baltimore, MD: U.S.A.
23) Gillespie, M. (2007). Resource Guide for the
UMPC Software Developer. Intel.com
24) Häubl, G. and Trifts, V. (2000). Consumer
Decision Making in Online Shopping
Environments: The Effects of Interactive Decision
Aids. Marketing Science, 19(1), 4-21.
25) Hayes, C.C. & Akhavi, F. (2008). Creating
Effective Decision Aids for Complex Tasks.
Journal of Usability Studies. 3 (4), 152 - 172.
P a g e | 80 Vol. 10 Issue 5 Ver. 1.0 July 2010 Global Journal of Computer Science and Technology
26) Heikkinen, M.T. and Still, J. (2005). Business
Networks and New Mobile Service Development.
Proceedings of the International Conference on
Mobile Business (ICMB’05). 144 -151.
27) Heyes, I.S. (2002). Just Enough Wireless
Computing. Upper Saddle River, NI: Prentice Hall.
28) Işıklar, G. and Büyüközkan, G. (2007). Using a
multi-criteria decision making approach to evaluate
mobile phone alternatives. Computer Standards &
Interfaces, 29, 265-274.
29) Jungermann, H. (1980). Speculations about
Decision Theoretic Aids for Personal Decision
Making. In Acta Psychologica 45 (pp. 7-34). North
Holland.
30) Keeney, R. and Raiffa, H. (1993). Decisions with
Multiple Objectives : Preference and Value
Tradeoffs, Cambridge University Press,
Cambridge.
31) König-Ries, B. (2009). Challenges in Mobile
Application Development. it – Information
Technology, 51(2), 69-71.
32) Law, W. S. (1996). Evaluating imprecision in
engineering design (Ph.D. Dissertation, California
Institute of Technology, Pasadena, California).
33) Linkov, I., Varghese, A., Jamil, S., Seager, T.P.,
Kiker, G. and Bridges, T. (2004) Multi-criteria
decision analysis: A framework for structuring
remedial decisions at the contaminated sites, In:
Linkov, I. and Ramadan, A.B. (Eds.), Comparative
Risk Assessment and Environmental Decision
Making (pp. 15-54). New York: Springer.
34) March, S.T. and Smith, G. (1995). Design and
Natural Science Research on Information
Technology. Decision Support Systems, 15(4), 251-
266.
35) McGuire, R. (2002). Decision Making. The
Pharmaceutical Journal. 269, 647-649.
36) Miller, D.W., & Starr, M.K. (1969). Executive
decisions and operations research. Englewood
Cliffs, NJ: Prentice-Hall, Inc.
37) Naude, P., Lockett, G. and Holms, K. (1997). A
Case Study of Strategic Engineering Decision
Making Using Judgmental Modeling and
Psychological Profiling. Transactions on
Engineering Management, 44(3), 237-247.
38) Offermann, P., Levina, O., Schonherr, M. and Bub,
U. (2009). Outline of a Design Science Research
Process. Proceedings of DESRIST’09, Malvern,
PA: USA.
39) Payne, J.,Bettman, J. and Johnson, E. (1993). The
Adaptive Decision Maker. Cambridge University
Press.
40) Power, D.J. (1998). Designing and Developing a
Computerized Decision Aid - A Case Study.
Retrieved December 10, 2009 from
http://dssresources.com/papers/decisionaids.html.
41) Pugh, S. (1990). Total Design: Integrated Methods
for Successful Product Engineering. Great Britain:
Addison Wesley.
42) Rich, P. (1999). A Process for Effective Decision
Making. Retrieved 5 April 2009 from
http://www.selfhelpmagazine.com/article/decision-
making
43) Saaty, T.L. (1977). A Scaling Method for Priorities
in Hierarchical Structures. Journal of Mathematical
Psychology, 15, 57-68.
44) Saaty, T.L. (1994). Fundamentals of Decision
Making and Priority Theory with the AHP.
Pittsburgh, PA: RWS Publications.
45) Simon, H. A. (1956). Rational choice and the
structure of the environment. Psychological
Review, 63, 129–138.
46) Soelberg, P.O. (1967). Unprogrammed Decision
Making. Industrial Management Review, 8, 19-29.
47) Todd, P. & Benbasat, I. (1991). An Experimental
Investigation of the Impact of Computer Based
Decision Aids on Decision Making Strategies.
Information Systems Research, 2(2), 87-115.
48) Triantaphyllou, E. (2000). Multi-Criteria Decision
Making Methods: A Comparative Study. Norwell,
MA: Springer.
49) Ullman, D.G. (2002). The Ideal Engineering
Decision Support System. Retrieved March 10,
2009 from
http://citeseerx.ist.psu.edu/viewdoc/download?doi=
10.1.1.87.1827&rep=rep1&type=pdf
50) Westaby, J.D. (2005). Behavioral reasoning theory:
Identifying new linkages underlying intentions and
behavior. Organizational Behavior and Human
Decision Processes, 98, 97-120.
51) Wooler, S. (1982). A Decision Aid for Structuring
and Evaluating Career Choice Options. Journal of
Operational Research Society, 33(4), 343-351.
52) Zanakis, S.H., Solomon, A., Wishart, N. and
Dublish, S. (1998). Multi-attribute decision
making: A simulation comparison of select
methods. European Journal of Operational
Research, 107, 507-529.
53) Zannier, C, Chaisson, M. and Maurer, F. (2007). A
model of design decision making based on
empirical results on interviews with software
designers. Information and Software Technology,
49, 637-653.
54) Zsambok, C.E., Beach, L.R. & Klein, G. (1992) A
Literature Review of Analytical and Naturalistic
Decision Making. Final technical report, Fairborn,
OH: Klein Associates Inc.
![Untitled-1 [globaljournals.org]Title Untitled-1 Author Manoj Created Date 3/22/2017 6:15:40 PM](https://img.pdfslide.us/doc/110x75/5eccc297a35ac00989592a79/-untitled-1-title-untitled-1-author-manoj-created-date-3222017-61540-pm.jpg)


![Untitled-2 [globaljournals.org] · Title: Untitled-2 Author: Manoj Created Date: 3/22/2017 6:18:24 PM](https://img.pdfslide.us/doc/110x75/5ec53788c781e87490220a93/untitled-2-title-untitled-2-author-manoj-created-date-3222017-61824-pm.jpg)


![Untitled-2 [globaljournals.org] · Title: Untitled-2 Author: Manoj Created Date: 3/22/2017 6:21:56 PM](https://img.pdfslide.us/doc/110x75/5aecdd3b7f8b9a90318ed6ab/untitled-2-untitled-2-author-manoj-created-date-3222017-62156-pm.jpg)
![Untitled-2 [globaljournals.org] · Title: Untitled-2 Author: Manoj Created Date: 3/22/2017 6:11:45 PM](https://img.pdfslide.us/doc/110x75/5ecf473ff15f187cb06138a2/untitled-2-title-untitled-2-author-manoj-created-date-3222017-61145-pm.jpg)
![Untitled-1 [globaljournals.org] · Title: Untitled-1 Author: Manoj Created Date: 3/22/2017 6:09:16 PM](https://img.pdfslide.us/doc/110x75/5fa7ab98cb9c52497878c627/untitled-1-title-untitled-1-author-manoj-created-date-3222017-60916-pm.jpg)