Embed Size (px)
Citation preview
Copyright 2000, M. E. Sharpe This is the author-manuscript version of this paper. First published in: Worthington, Andrew and Dollery, Brian (2000) Measuring efficiency in local governments’ planning and function Public Productivity and Management Review 23(4):pp. 468-485.
MEASURING EFFICIENCY IN LOCAL GOVERNMENTS’ PLANNING AND
REGULATORY FUNCTION
ANDREW C. WORTHINGTON Queensland University of Technology
BRIAN E. DOLLERY University of New England
Public sector reform has now become an established dimension of policymaking in
many developed countries, including Australia. Although the ongoing program of
public sector reform is Australia has focused mainly on the Commonwealth government
and some state governments, especially Victoria, it is now being applied to local
government. Key aspects of this process have been administrative reforms (compulsory
competitive tendering and contracting-out), structural reforms (local council
consolidations), legislative reforms (fiscal transparency and accountability), and
workplace reform (labour market deregulation).
Another part has been the collection of new ideas associated with what has come to
be known as the ‘New Public Management’. Central ingredients in this movement have
been the notion of explicit standards and measures of performance in the public sector,
the greater emphasis on outputs rather than inputs, the shift to greater competition in the
public sector, an emphasis on private-sector styles of management practice (ie. ‘letting
managers manage’), and a stress on greater discipline and parsimony in resource use
(Hood, 1991). Finally, there is a greater awareness on the behalf of the Commonwealth
PPMR 2
government of the desirability of promoting efficiency through the system of
intergovernmental financial assistance. In common with the other pressures for greater
efficiency and effectiveness in local public service provision, this process can be used
for accurate and meaningful measures of local government efficiency for the purposes
of comparative performance assessment and process benchmarking.
This paper is centrally concerned with the evaluation of technical and scale
efficiency in New South Wales local government using the nonparametric approach to
efficiency measurement. We examine technical and scale efficiency for a single
function of Australian local government: namely, planning and regulatory services. The
paper itself is divided into four main parts. The first section outlines the nonparametric
approach to efficiency measurement for local public services and provides the
formulation of the model employed. The second section provides the specification of
inputs and outputs for planning and regulatory services. The results obtained from this
analysis are discussed in the third section. The paper ends with some brief concluding
remarks.
The Nonparametric Approach to Efficiency Measurement
Economists have developed three main measures of efficiency. Firstly, technical or
productive efficiency refers to the use of productive resources in the most
technologically efficient manner. Put differently, technical efficiency implies the
maximum possible output from a given set of inputs. In cost terms, this means that an
organisation should produce a specified level of output in the cheapest possible manner,
Secondly, allocative efficiency refers to the distribution of productive resources
amongst alternative uses so as to produce the optimal mix of output. In other words,
allocative efficiency is concerned with choosing between the different technically
efficient combinations of outputs. Taken together, allocative efficiency and technical
efficiency determine the degree of economic efficiency. Thus, if an agency uses its
resources completely allocatively and technically efficiently, then it can be said to have
achieved total economic efficiency. Alternatively, to the extent that either allocative or
technical inefficiency is present, then the organisation will be operating at less than total
economic efficiency. Thirdly, and in contrast to both allocative efficiency and technical
efficiency, dynamic efficiency is a much less precise concept. In general, dynamic
Worthington, Dollery / LOCAL GOVERNMENT EFFICIENCY 3
efficiency refers to the economically efficient usage of scare resources through time and
thus embraces allocative and technical efficiency in an intertemporal dimension.
The empirical measurement of economic efficiency centres on determining the extent
of either allocative efficiency or technical efficiency or both in a given organisation or a
given industry. Economists have employed production possibility frontiers, production
functions and cost functions in their attempts to measure efficiency in actual
organisations and industries. Production possibility frontiers map a locus of potentially
technically efficient output combinations an organisation is capable of producing at any
point in time. To the extent an organisation fails to achieve an output combination on its
production possibility frontier, and falls beneath this frontier, it can be said to be
technically inefficient. Similarly, to the extent to which it produces some combination
of goods and services on its production frontier, but which do not coincide with the
wants of its clients (usually expressed in terms of the prices they are willing to pay), it
can be said to be allocatively inefficient. Production functions provide an analogous
means of relating inputs to outputs in a production process by including input prices.
Cost functions transform the quantitative physical information in production frontiers
into monetary values. Cost functions can thus convey information about the allocative
and technical efficiencies of organisations in pecuniary terms.
Accordingly, if we can determine production frontiers, production functions, or cost
functions that represent total economic efficiency using the best currently known
production techniques, then we can use this idealised yardstick to evaluate the economic
performance of actual organisations and industries. By comparing the actual behaviour
of organisations against the idealised benchmark of economic efficiency we can
determine the degree of economic efficiency exhibited by some real-world agency. This
general approach to efficiency measurement has been termed the ‘deterministic frontier
approach’ (DFA). However, it may well be that deviation away from a given efficiency
frontier may be due not to inefficiency by the organisation in question but rather
external factors beyond its control. This has led to the development of the ‘stochastic
frontier approach’ (SFA) which seeks to take these external factors into account when
estimating the efficiency of given real-world organisation.
In contrast to both the DFA and SFA techniques, which attempt to determine the
absolute economic efficiency of organisations against some given benchmark of
efficiency, the ‘data envelopment analysis’ (DEA) approach seeks to evaluate the
PPMR 4
efficiency of an organisation relative to other organisations in the same industry. DEA
thus calculates the economic efficiency of a given organisation relative to the
performance of other organisations producing the same good or service rather than
against an idealised standard of performance.
The method used here to measure efficiency at the local level is based upon DEA, a
mathematical programming approach to frontier estimation pioneered in Charnes,
Cooper and Rhodes (1978) and extended in Banker, Charnes and Cooper (1984). There
are several advantages of the DEA approach in evaluating the efficiency of government
service providers. These include: its ability to handle the multiple inputs and outputs
characteristic of public sector production, especially where it is difficult or impossible
to assign prices to many of these factors; its capability of decomposing technical
efficiency into scale effects and the effects of unwanted inputs which a service provider
cannot dispose of; and its capacity to incorporate differences in operating environments
beyond management control, particularly for the purposes of comparative performance
assessment and process benchmarking (SCRSCCP, 1997). Measuring efficiency in this
manner is consistent with both the literature associated with the efficiency analysis of
government service providers in general, such as Ganley and Cubbin (1992), Kittelson
and Forsund (1992) and Mensah and Li (1993), and with the majority of past empirical
approaches to efficiency measurement in the local public sector, notably Charnes,
Cooper and Li (1989), Cook, Roll and Kazakov (1990), Grosskopf and Yaisawarng
(1990), Vanden Eeckaut, Tulkens and Jamar (1993), and De Borger and Kerstens
(1996).
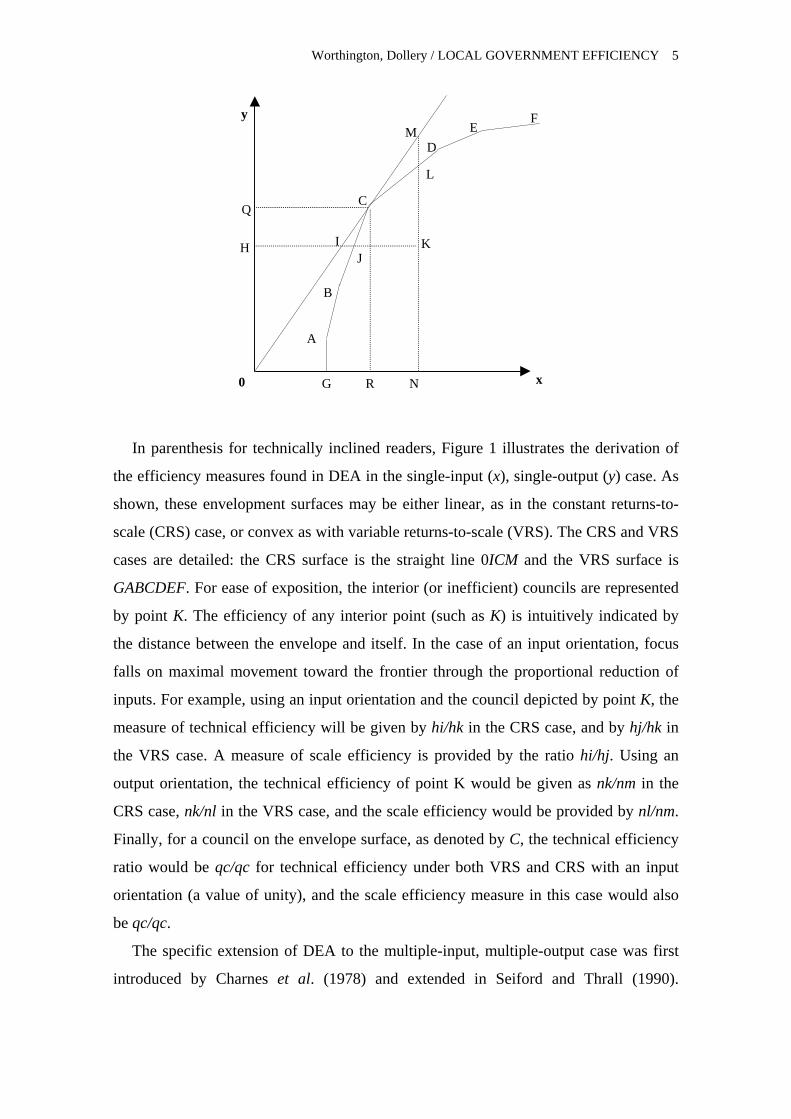
Figure 1. Technical and Scale Efficiency in Local Government
Worthington, Dollery / LOCAL GOVERNMENT EFFICIENCY 5
F E
D
C
B
A
0
M
L
JKIH
G N
Q
R x
y
In parenthesis for technically inclined readers, Figure 1 illustrates the derivation of
the efficiency measures found in DEA in the single-input (x), single-output (y) case. As
shown, these envelopment surfaces may be either linear, as in the constant returns-to-
scale (CRS) case, or convex as with variable returns-to-scale (VRS). The CRS and VRS
cases are detailed: the CRS surface is the straight line 0ICM and the VRS surface is
GABCDEF. For ease of exposition, the interior (or inefficient) councils are represented
by point K. The efficiency of any interior point (such as K) is intuitively indicated by
the distance between the envelope and itself. In the case of an input orientation, focus
falls on maximal movement toward the frontier through the proportional reduction of
inputs. For example, using an input orientation and the council depicted by point K, the
measure of technical efficiency will be given by hi/hk in the CRS case, and by hj/hk in
the VRS case. A measure of scale efficiency is provided by the ratio hi/hj. Using an
output orientation, the technical efficiency of point K would be given as nk/nm in the
CRS case, nk/nl in the VRS case, and the scale efficiency would be provided by nl/nm.
Finally, for a council on the envelope surface, as denoted by C, the technical efficiency
ratio would be qc/qc for technical efficiency under both VRS and CRS with an input
orientation (a value of unity), and the scale efficiency measure in this case would also
be qc/qc.
The specific extension of DEA to the multiple-input, multiple-output case was first
introduced by Charnes et al. (1978) and extended in Seiford and Thrall (1990).
PPMR 6
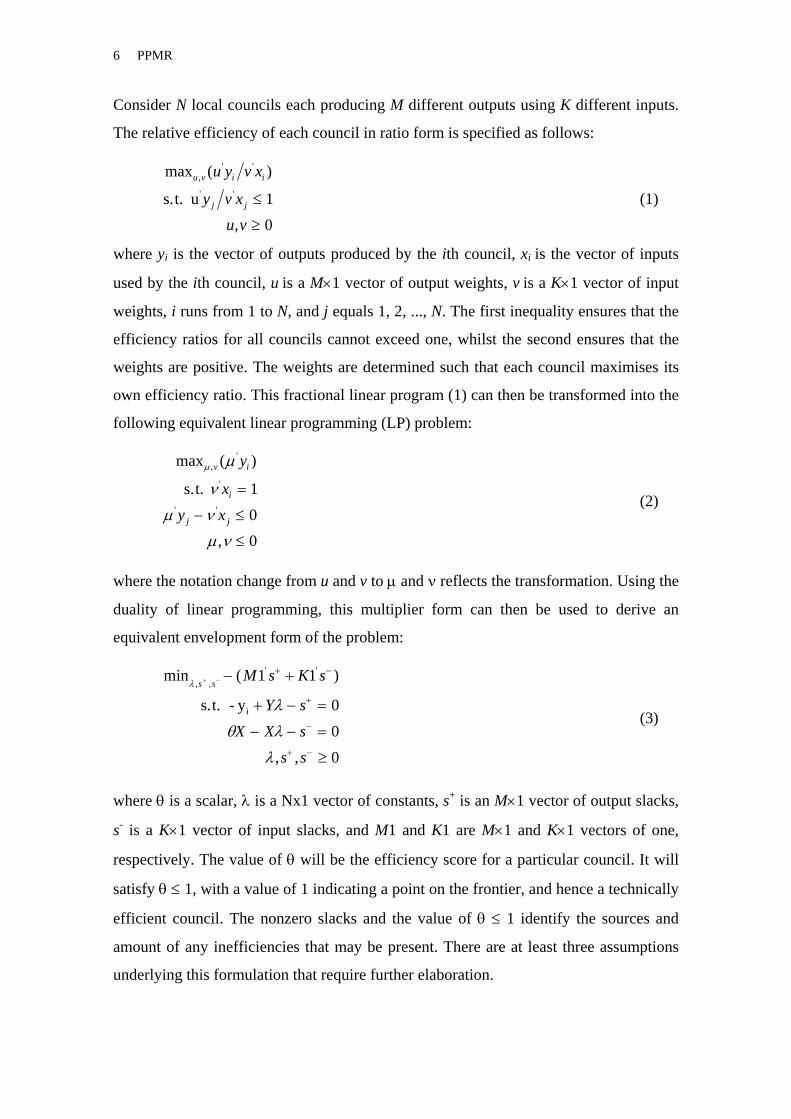
Consider N local councils each producing M different outputs using K different inputs.
The relative efficiency of each council in ratio form is specified as follows:
max ( )
,
,' '
'
u v i i
j j
u y v x
y v xu v
s.t. u' ≤
≥
10
(1)
where yi is the vector of outputs produced by the ith council, xi is the vector of inputs
used by the ith council, u is a M×1 vector of output weights, v is a K×1 vector of input
weights, i runs from 1 to N, and j equals 1, 2, ..., N. The first inequality ensures that the
efficiency ratios for all councils cannot exceed one, whilst the second ensures that the
weights are positive. The weights are determined such that each council maximises its
own efficiency ratio. This fractional linear program (1) can then be transformed into the
following equivalent linear programming (LP) problem:
max ( )
,
,'
'
' '
μ μ
ν
μ ν
μ ν
v i
i
j j
y
xy xs.t. =
− ≤
≤
100
(2)
where the notation change from u and v to μ and ν reflects the transformation. Using the
duality of linear programming, this multiplier form can then be used to derive an
equivalent envelopment form of the problem:
min ( )
, ,
, ,' '
λ
λ
θ λ
λ
s sM s K s
Y sX X s
s s
+ − − +
+ − =
− − =
≥
+ −
+
−
+ −
1 1
000
s.t. - yi (3)
where θ is a scalar, λ is a Nx1 vector of constants, s+ is an M×1 vector of output slacks,
s- is a K×1 vector of input slacks, and M1 and K1 are M×1 and K×1 vectors of one,
respectively. The value of θ will be the efficiency score for a particular council. It will
satisfy θ ≤ 1, with a value of 1 indicating a point on the frontier, and hence a technically
efficient council. The nonzero slacks and the value of θ ≤ 1 identify the sources and
amount of any inefficiencies that may be present. There are at least three assumptions
underlying this formulation that require further elaboration.
Worthington, Dollery / LOCAL GOVERNMENT EFFICIENCY 7
Firstly, these programs provide the input-orientated constant returns to scale
envelopment surface, and a measure of overall technical efficiency (Ts). That is,
emphasis is placed on the equiproportionate reduction of local government inputs. An
input orientation is adopted since it is assumed that local governments take outputs as
exogenous and have a larger degree of control over the level of inputs, especially within
functional areas. In particular, one would expect that for a local government in
Australia, the imposition of rate capping and other constraints on revenue raising would
tend to restrict the amount of output possible in any one time period. Hence, a suitable
behavioural objective for these institutions would be that of input minimisation, rather
than output maximisation. The input measures thus provided can then detect failures to
minimise inputs resulting from discretionary power and incomplete monitoring, and
thereby provide an indication of possible gains from exploiting technical and scale
efficiencies (De Borger and Kerstens, 1996, p. 11). For example, Ganley and Cubbin
(1992) used an input-orientation to study the efficiency of U.K. local education
authorities (LEAs). They argued inter alia that the initial emphasis in government
policy is usually on the input dimension, since inputs are more amenable to scrutiny
whereas outputs are often disputed (Ganley and Cubbin, 1992, p. 45). Other local public
sector studies which employed an input-orientated approach include Pestieau and
Tulkens’ (1990; 1993), Rouse, Putterill and Ryan’s (1995), and Ruggiero’s (1996)
respective studies of Belgian, New Zealand and New York State local authorities.
Secondly, the measure of technical efficiency detailed in (3) also assumes that any
scaled-up or scaled-down versions of the input combinations are also included in the
production possibility set. Overall technical efficiency can then be further divided into
pure technical (PTs) and scale efficiency (Ss), following Banker et al. (1984). Adding
the convexity constraint (N1′λ=1) to (3) allows for variable returns-to-scale and
provides a measure of pure technical efficiency (PTs), whilst dividing overall technical
efficiency by pure technical efficiency yields a measure of scale efficiency (Ss= Ts/PTs).
One shortcoming of this measure of scale efficiency is that its value does not indicate
whether the council is operating in an area of increasing or decreasing returns to scale.
This may be determined by imposing non-increasing returns-to-scale in (3) by replacing
the N1′λ=1 restraint with N1′λ≤1. The NIRS surface is represented by 0CDEFI in
Figure 1. If the technical efficiency score under an assumption of non-increasing
returns-to-scale is equal to the score obtained under variable returns-to-scale then
PPMR 8
decreasing returns to scale apply. If they are unequal (as for point K in Figure 1) then
increasing returns-to-scale exist for that council.
Lastly, the model formulation detailed in (3) also implicitly assumes that all inputs
and outputs are discretionary, i.e. controlled by the management of each council and
varied at its discretion. However, in most circumstances there may exist exogenously
fixed or non-discretionary inputs and/or outputs that are beyond managerial control
[see, for example, Golany and Roll (1993)]. In the case of the input-orientated models
we have discussed, it is not relevant to maximise the proportional decrease in the entire
input vector: rather maximisations should only be determined with respect to the sub-
vector that is composed of discretionary inputs. Examples in the Australian local public
sector include the regulatory constraints imposed by state-based legislation, the
geographic and demographic characteristics of a given local government area, and
accounting standards. The specific formulation employed to incorporate non-
discretionary variables in the input-oriented BCC model may be found in Charnes, et al.
(1993) and Ali and Seiford (1993).
An important task that arises after the calculation of the DEA measures is to attribute
variations in efficiency to specific characteristics of local councils and the environment
in which they operate. Several linear regression models have been employed to examine
these relationships. In the first approach a logistic regression of general form:
l z ei i i* '= +β (4)
is estimated, where li = 1 if the ith council is efficient on the basis of a DEA measure of
pure technical, scale or overall technical efficiency (θ =1), and li = 0 is the ith firm is
inefficient (θ <1). Past approaches that have employed nonparametric techniques to
measure government service efficiency followed by parametric techniques to assign
variation in efficiency include Bjurek, Kjulin and Gustafsson (1992), De Borger,
Kerstens, Moesen and Vanneste (1994), De Borger and Kerstens (1996) and
Athanassopoulos and Karkazis (1997).
The second regression approach seeks to explain the slack inefficiency in each
council: that is, slack in the form of excessive utilisation of specific resources or
underprovision of outputs. This analysis is likely to illuminate areas of particular
concern to management, and has been employed by Fried et al. (1993; 1996) in the
Worthington, Dollery / LOCAL GOVERNMENT EFFICIENCY 9
analysis of efficiency in U.S. credit unions. This requires estimation of ordinary least
squares (OLS) equations of the form:
s z ei i i+ − = +, 'β (5)
where si is the total slack (both radial and non-radial) in the output (+) or input (-), and
all other variables are as previously defined.
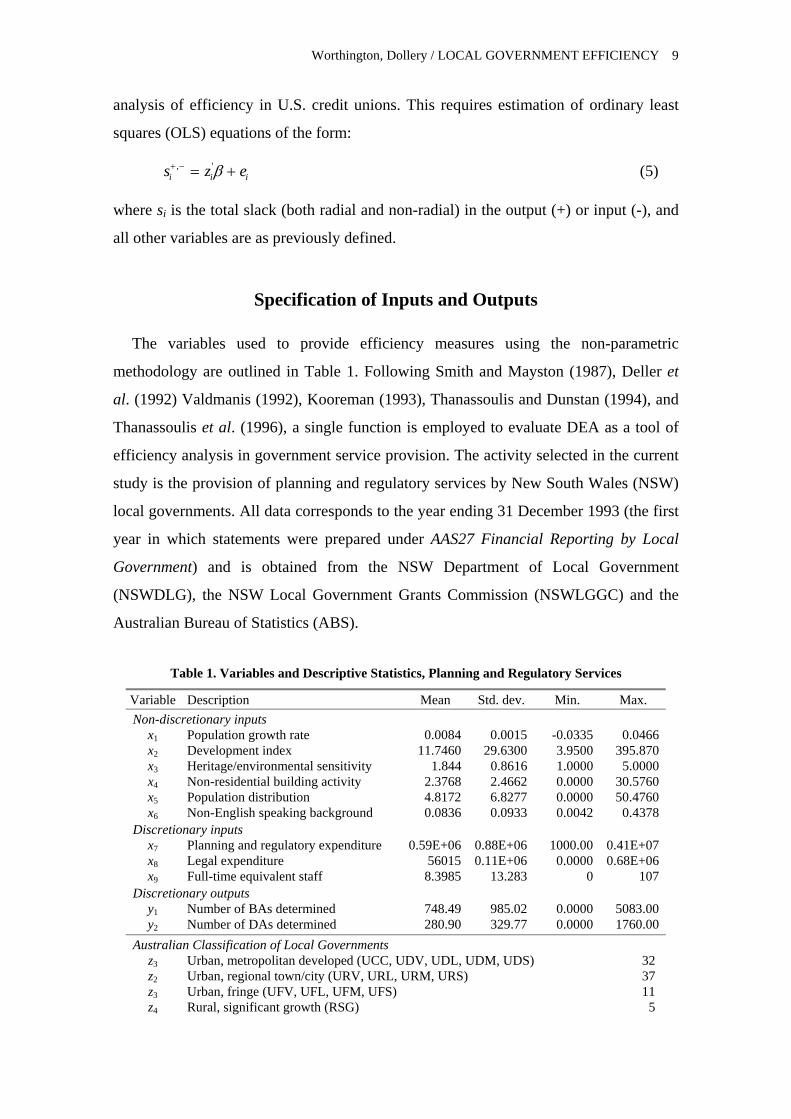
Specification of Inputs and Outputs
The variables used to provide efficiency measures using the non-parametric
methodology are outlined in Table 1. Following Smith and Mayston (1987), Deller et
al. (1992) Valdmanis (1992), Kooreman (1993), Thanassoulis and Dunstan (1994), and
Thanassoulis et al. (1996), a single function is employed to evaluate DEA as a tool of
efficiency analysis in government service provision. The activity selected in the current
study is the provision of planning and regulatory services by New South Wales (NSW)
local governments. All data corresponds to the year ending 31 December 1993 (the first
year in which statements were prepared under AAS27 Financial Reporting by Local
Government) and is obtained from the NSW Department of Local Government
(NSWDLG), the NSW Local Government Grants Commission (NSWLGGC) and the
Australian Bureau of Statistics (ABS).
Table 1. Variables and Descriptive Statistics, Planning and Regulatory Services
Variable Description Mean Std. dev. Min. Max. Non-discretionary inputs
x1 Population growth rate 0.0084 0.0015 -0.0335 0.0466 x2 Development index 11.7460 29.6300 3.9500 395.870 x3 Heritage/environmental sensitivity 1.844 0.8616 1.0000 5.0000 x4 Non-residential building activity 2.3768 2.4662 0.0000 30.5760 x5 Population distribution 4.8172 6.8277 0.0000 50.4760 x6 Non-English speaking background 0.0836 0.0933 0.0042 0.4378
Discretionary inputs x7 Planning and regulatory expenditure 0.59E+06 0.88E+06 1000.00 0.41E+07 x8 Legal expenditure 56015 0.11E+06 0.0000 0.68E+06 x9 Full-time equivalent staff 8.3985 13.283 0 107
Discretionary outputs y1 Number of BAs determined 748.49 985.02 0.0000 5083.00 y2 Number of DAs determined 280.90 329.77 0.0000 1760.00
Australian Classification of Local Governments z3 Urban, metropolitan developed (UCC, UDV, UDL, UDM, UDS) 32 z2 Urban, regional town/city (URV, URL, URM, URS) 37 z3 Urban, fringe (UFV, UFL, UFM, UFS) 11 z4 Rural, significant growth (RSG) 5
PPMR 10
z5 Rural, agricultural (RAV, RAL, RAM, RAS) 85 z6 Rural, remote (RTL, RTM, RTS, RTX) 3
The planning and regulatory services provided by NSW local governments may be
broadly referred to as an ‘economic’ service. The issue of the local approvals process
has been under review in NSW for some time, “with the aim of improving consistency
in decision-making, efficiency, and planning outcomes” (IPART, 1997, p. 94). For
example, two group studies have recently developed frameworks for benchmarking
planning and regulatory processes. One was undertaken by the Shore Regional
Organisation of Councils (SHOROC), and the other by the Western Sydney Regional
Organisations of Councils (WSROC). Both of these projects were funded by the Federal
Government's Local Government Development Program (LGDP) and applied to two
groups of four councils each. By contrast, the data set analysed in the current study
applies to the entire sample of 173 local governments.
The set of nondiscretionary contextual factors which are likely to impact upon
measured efficiency are included in Table 1. These are: average population growth over
the previous five years (x1); a regression-based index of development activity (x2); the
NSWLGGC’s subjective assessment of the areas subject to heritage/environment
sensitivity (x3); the proportion of properties classified as ‘commercial or industrial’ (x4);
a disability factor indicating the proportion of the population from a NESB (x5), and
population distribution (x6). All other things being equal, these factors indicate the
needs for higher inputs imposed upon a council’s planning and regulatory function by
additional costs in development control (development activity), forward planning
(population growth), the provision of supplementary information (NESB), the
duplication of services and staff travel (distribution), and additional complexities related
to plan preparation and development control (heritage/environment). Some indication of
the marginal impact of these factors on inputs can be discerned from the NSWLGGC’s
calculation of expenditure disabilities for building control and planning activity, with
the three highest weightings in standard costs calculations being given to building and
development activity, the proportion of non-residential properties, and the proportion of
the population from a NESB.
Three discretionary inputs and two discretionary outputs are specified in the model
of local government’s planning and regulatory function. The inputs are: (i) planning and
regulatory expenditures (x7); (ii) legal expenditures related to the planning and

Worthington, Dollery / LOCAL GOVERNMENT EFFICIENCY 11
regulatory function (as an indicator of the level of disputation in the planning process)
(x8); and (iii) the number of full-time equivalent staff employed in the planning and
regulatory function (x9). A relatively efficient council ceteris paribus will therefore
minimise the costs associated with planning and regulation, the amount of staff
employed, and the level of legal disputation involved, all within the confines of the
factors not subject to managerial discretion. The incorporation of the ‘legal cost’ input
is particularly important since the majority of councils’ legal costs are concerned with
planning and regulatory activities [where the balance is largely associated with costs
arising from conveyancing, resumptions, leases and general legal advice] (NSWDLG,
1998, p. 32). The outputs employed are twofold. The first of these is the number of
building applications (BAs) determined and approved (y1); and the second is the number
of development applications (DAs) likewise determined and approved (y2). As a general
rule, most planning and regulatory expenditures involve DAs, with other costs split
between enforcement and building matters (NSWDLG, 1998). Once again, the
efficiency of providing the planning and regulatory function will only be measured in
regard to the discretionary decisions taken by a council, not to the characteristics of the
LGA for which the council has responsibility. It may also be useful to reiterate the fact
that the focus of the present study is on the efficiency of service provision, and bears no
regard for effectiveness, encompassing as it does matters of outcomes, quality,
appropriateness or accessibility.
These issues are highlighted with reference to the recent SHOROC and WSROC
benchmarking projects (NSWDLG, 1997). Both of these projects specified that the
performance of the local approvals process consists of four key aspects. These were: (i)
the number of applications processed and processing times, (ii) the overall cost of the
planning and regulatory process; (iii) customer satisfaction with the local planning and
building approvals process; and (iv) adequate planning outcomes (IPART, 1997, p. 98).
The focus of the current analysis is only on the first two aspects, relating as they do to
the ‘efficiency’ of the planning and regulatory function. The focus of the second and
third aspects, assessing whether approvals outcomes are consistent with area plans and
using community surveys to measure satisfaction with the level of community
involvement with the outcome of development approvals, is clearly associated with
ideas of ‘appropriateness’ and ‘quality’, or the ‘effectiveness’ dimension of
performance.
PPMR 12
The final set of variables (z1 – z6) detailed in Table 1 relate to the Australian
Classification of Local Government (ACLG) categories, which are in turn based upon
objective geographic/demographic criteria. It is argued that other considerations may
still have an influence on a council’s efforts to attain an efficient outcome, even after
the vector of non-discretionary inputs is taken into account. For example, in the case of
planning and regulatory services, large councils may have a secondary CBD or other
commercial concentrations which serve to complicate the planning and regulatory
function. If the vector of dummy variables in either of these cases proves to be an
insignificant influence on efficient outcomes, then local governments across New South
Wales should be able to be compared solely on the basis of the input/output vector and
individual disability factors. Alternatively, evidence of a systematic relationship
between one or more ACLG categories may focus the search for excluded disability
factors, or analysis of managerial conditions unique to that local government
classification.
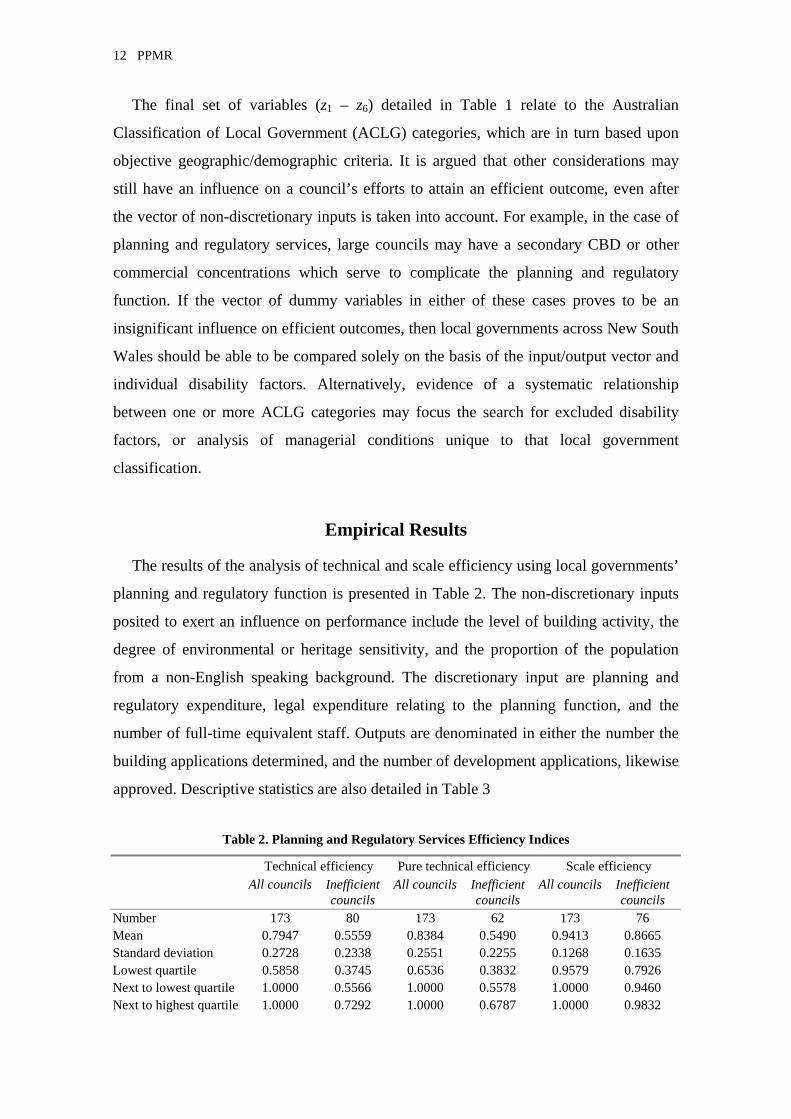
Empirical Results
The results of the analysis of technical and scale efficiency using local governments’
planning and regulatory function is presented in Table 2. The non-discretionary inputs
posited to exert an influence on performance include the level of building activity, the
degree of environmental or heritage sensitivity, and the proportion of the population
from a non-English speaking background. The discretionary input are planning and
regulatory expenditure, legal expenditure relating to the planning function, and the
number of full-time equivalent staff. Outputs are denominated in either the number the
building applications determined, and the number of development applications, likewise
approved. Descriptive statistics are also detailed in Table 3
Table 2. Planning and Regulatory Services Efficiency Indices
Technical efficiency Pure technical efficiency Scale efficiency All councils Inefficient
councils All councils Inefficient
councils All councils Inefficient
councils Number 173 80 173 62 173 76 Mean 0.7947 0.5559 0.8384 0.5490 0.9413 0.8665 Standard deviation 0.2728 0.2338 0.2551 0.2255 0.1268 0.1635 Lowest quartile 0.5858 0.3745 0.6536 0.3832 0.9579 0.7926 Next to lowest quartile 1.0000 0.5566 1.0000 0.5578 1.0000 0.9460 Next to highest quartile 1.0000 0.7292 1.0000 0.6787 1.0000 0.9832
Worthington, Dollery / LOCAL GOVERNMENT EFFICIENCY 13
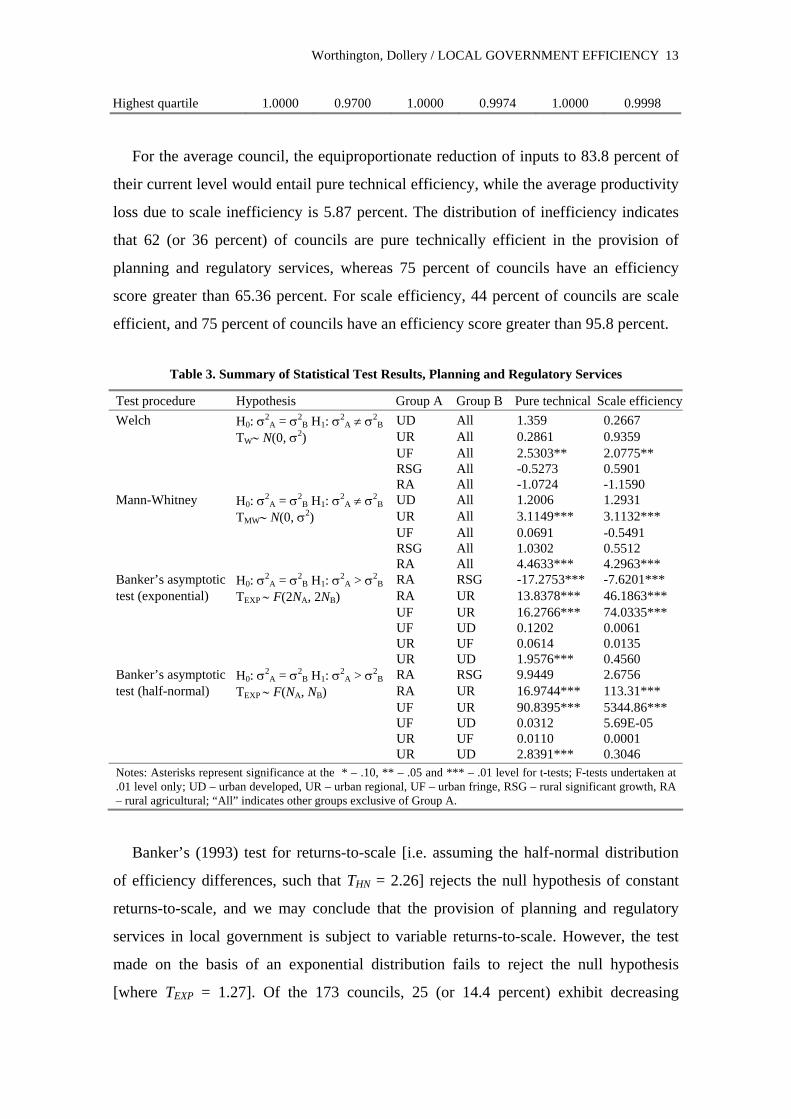
Highest quartile 1.0000 0.9700 1.0000 0.9974 1.0000 0.9998
For the average council, the equiproportionate reduction of inputs to 83.8 percent of
their current level would entail pure technical efficiency, while the average productivity
loss due to scale inefficiency is 5.87 percent. The distribution of inefficiency indicates
that 62 (or 36 percent) of councils are pure technically efficient in the provision of
planning and regulatory services, whereas 75 percent of councils have an efficiency
score greater than 65.36 percent. For scale efficiency, 44 percent of councils are scale
efficient, and 75 percent of councils have an efficiency score greater than 95.8 percent.
Table 3. Summary of Statistical Test Results, Planning and Regulatory Services
Test procedure Hypothesis Group A Group B Pure technical Scale efficiencyWelch H0: σ2
A = σ2B H1: σ2
A ≠ σ2B UD All 1.359 0.2667
TW∼ N(0, σ2) UR All 0.2861 0.9359 UF All 2.5303** 2.0775** RSG All -0.5273 0.5901 RA All -1.0724 -1.1590 Mann-Whitney H0: σ2
A = σ2B H1: σ2
A ≠ σ2B UD All 1.2006 1.2931
TMW∼ N(0, σ2) UR All 3.1149*** 3.1132*** UF All 0.0691 -0.5491 RSG All 1.0302 0.5512 RA All 4.4633*** 4.2963*** Banker’s asymptotic H0: σ2
A = σ2B H1: σ2
A > σ2B RA RSG -17.2753*** -7.6201***
test (exponential) TEXP ∼ F(2NA, 2NB) RA UR 13.8378*** 46.1863*** UF UR 16.2766*** 74.0335*** UF UD 0.1202 0.0061 UR UF 0.0614 0.0135 UR UD 1.9576*** 0.4560 Banker’s asymptotic H0: σ2
A = σ2B H1: σ2
A > σ2B RA RSG 9.9449 2.6756
test (half-normal) TEXP ∼ F(NA, NB) RA UR 16.9744*** 113.31*** UF UR 90.8395*** 5344.86*** UF UD 0.0312 5.69E-05 UR UF 0.0110 0.0001 UR UD 2.8391*** 0.3046 Notes: Asterisks represent significance at the * – .10, ** – .05 and *** – .01 level for t-tests; F-tests undertaken at .01 level only; UD – urban developed, UR – urban regional, UF – urban fringe, RSG – rural significant growth, RA – rural agricultural; “All” indicates other groups exclusive of Group A.
Banker’s (1993) test for returns-to-scale [i.e. assuming the half-normal distribution
of efficiency differences, such that THN = 2.26] rejects the null hypothesis of constant
returns-to-scale, and we may conclude that the provision of planning and regulatory
services in local government is subject to variable returns-to-scale. However, the test
made on the basis of an exponential distribution fails to reject the null hypothesis
[where TEXP = 1.27]. Of the 173 councils, 25 (or 14.4 percent) exhibit decreasing

PPMR 14
returns-to-scale, 51 (or 29.4 percent) are subject to increasing returns-to-scale, and the
remainder are operating at the correct scale of operations. Those councils with
decreasing returns-to-scale include Burwood, North Sydney and Botany in the urban
developed category, Armidale, Byron Bay and Port Stephens in the urban regional
category, Wollondilly in the urban fringe category, Nymboida and Maclean in the rural
councils with significant growth, and Bellingen and Nambucca in the rural agricultural
category.
Worthington, Dollery / LOCAL GOVERNMENT EFFICIENCY 15
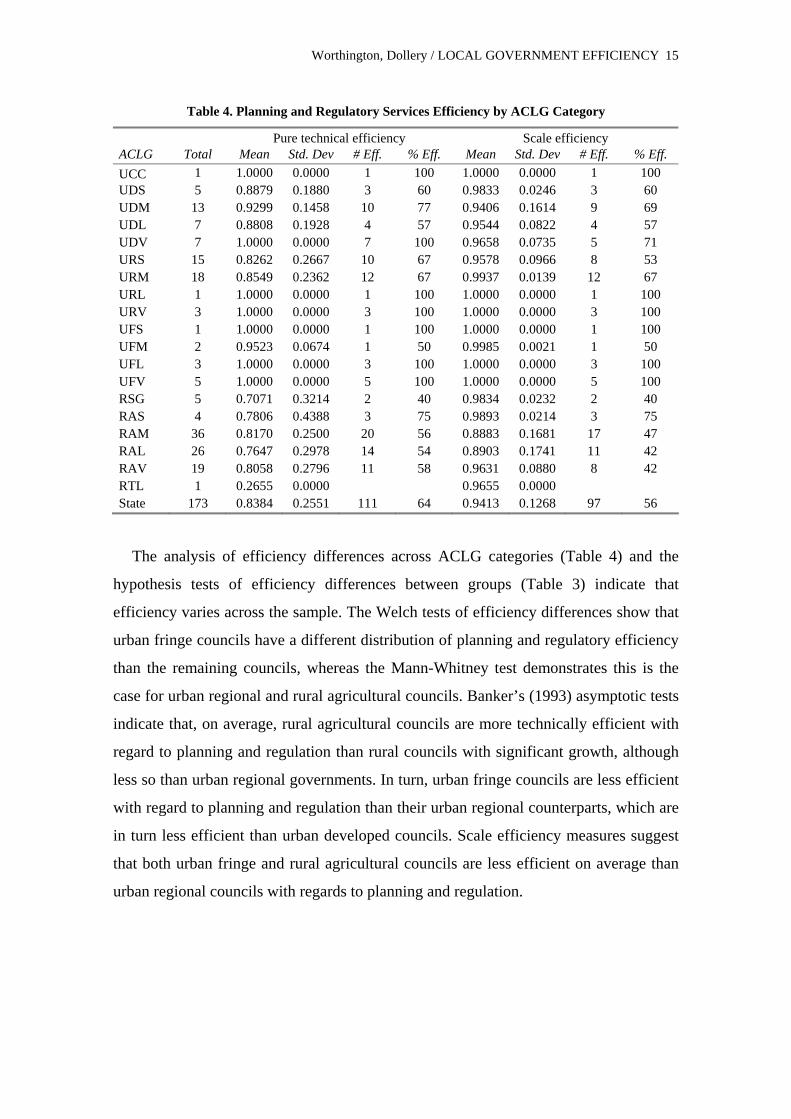
Table 4. Planning and Regulatory Services Efficiency by ACLG Category
Pure technical efficiency Scale efficiency ACLG Total Mean Std. Dev # Eff. % Eff. Mean Std. Dev # Eff. % Eff. UCC 1 1.0000 0.0000 1 100 1.0000 0.0000 1 100 UDS 5 0.8879 0.1880 3 60 0.9833 0.0246 3 60 UDM 13 0.9299 0.1458 10 77 0.9406 0.1614 9 69 UDL 7 0.8808 0.1928 4 57 0.9544 0.0822 4 57 UDV 7 1.0000 0.0000 7 100 0.9658 0.0735 5 71 URS 15 0.8262 0.2667 10 67 0.9578 0.0966 8 53 URM 18 0.8549 0.2362 12 67 0.9937 0.0139 12 67 URL 1 1.0000 0.0000 1 100 1.0000 0.0000 1 100 URV 3 1.0000 0.0000 3 100 1.0000 0.0000 3 100 UFS 1 1.0000 0.0000 1 100 1.0000 0.0000 1 100 UFM 2 0.9523 0.0674 1 50 0.9985 0.0021 1 50 UFL 3 1.0000 0.0000 3 100 1.0000 0.0000 3 100 UFV 5 1.0000 0.0000 5 100 1.0000 0.0000 5 100 RSG 5 0.7071 0.3214 2 40 0.9834 0.0232 2 40 RAS 4 0.7806 0.4388 3 75 0.9893 0.0214 3 75 RAM 36 0.8170 0.2500 20 56 0.8883 0.1681 17 47 RAL 26 0.7647 0.2978 14 54 0.8903 0.1741 11 42 RAV 19 0.8058 0.2796 11 58 0.9631 0.0880 8 42 RTL 1 0.2655 0.0000 0.9655 0.0000 State 173 0.8384 0.2551 111 64 0.9413 0.1268 97 56
The analysis of efficiency differences across ACLG categories (Table 4) and the
hypothesis tests of efficiency differences between groups (Table 3) indicate that
efficiency varies across the sample. The Welch tests of efficiency differences show that
urban fringe councils have a different distribution of planning and regulatory efficiency
than the remaining councils, whereas the Mann-Whitney test demonstrates this is the
case for urban regional and rural agricultural councils. Banker’s (1993) asymptotic tests
indicate that, on average, rural agricultural councils are more technically efficient with
regard to planning and regulation than rural councils with significant growth, although
less so than urban regional governments. In turn, urban fringe councils are less efficient
with regard to planning and regulation than their urban regional counterparts, which are
in turn less efficient than urban developed councils. Scale efficiency measures suggest
that both urban fringe and rural agricultural councils are less efficient on average than
urban regional councils with regards to planning and regulation.
PPMR 16
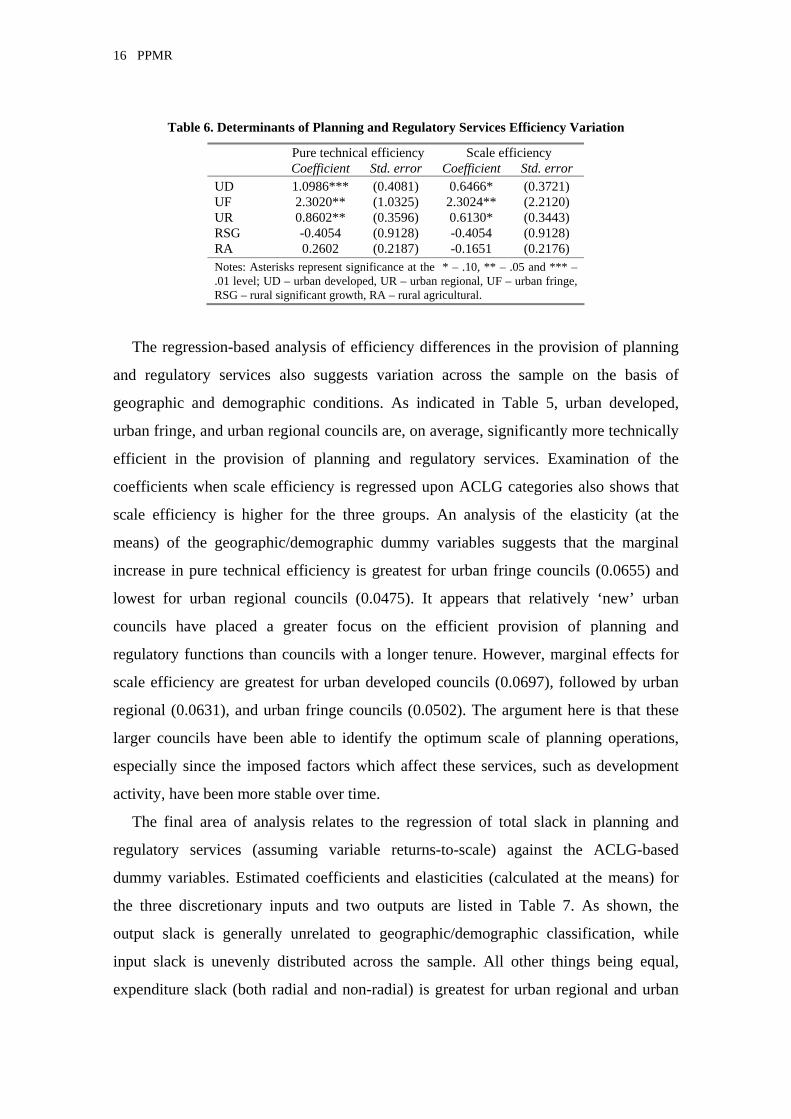
Table 6. Determinants of Planning and Regulatory Services Efficiency Variation
Pure technical efficiency Scale efficiency Coefficient Std. error Coefficient Std. error
UD 1.0986*** (0.4081) 0.6466* (0.3721) UF 2.3020** (1.0325) 2.3024** (2.2120) UR 0.8602** (0.3596) 0.6130* (0.3443) RSG -0.4054 (0.9128) -0.4054 (0.9128) RA 0.2602 (0.2187) -0.1651 (0.2176) Notes: Asterisks represent significance at the * – .10, ** – .05 and *** – .01 level; UD – urban developed, UR – urban regional, UF – urban fringe, RSG – rural significant growth, RA – rural agricultural.
The regression-based analysis of efficiency differences in the provision of planning
and regulatory services also suggests variation across the sample on the basis of
geographic and demographic conditions. As indicated in Table 5, urban developed,
urban fringe, and urban regional councils are, on average, significantly more technically
efficient in the provision of planning and regulatory services. Examination of the
coefficients when scale efficiency is regressed upon ACLG categories also shows that
scale efficiency is higher for the three groups. An analysis of the elasticity (at the
means) of the geographic/demographic dummy variables suggests that the marginal
increase in pure technical efficiency is greatest for urban fringe councils (0.0655) and
lowest for urban regional councils (0.0475). It appears that relatively ‘new’ urban
councils have placed a greater focus on the efficient provision of planning and
regulatory functions than councils with a longer tenure. However, marginal effects for
scale efficiency are greatest for urban developed councils (0.0697), followed by urban
regional (0.0631), and urban fringe councils (0.0502). The argument here is that these
larger councils have been able to identify the optimum scale of planning operations,
especially since the imposed factors which affect these services, such as development
activity, have been more stable over time.
The final area of analysis relates to the regression of total slack in planning and
regulatory services (assuming variable returns-to-scale) against the ACLG-based
dummy variables. Estimated coefficients and elasticities (calculated at the means) for
the three discretionary inputs and two outputs are listed in Table 7. As shown, the
output slack is generally unrelated to geographic/demographic classification, while
input slack is unevenly distributed across the sample. All other things being equal,
expenditure slack (both radial and non-radial) is greatest for urban regional and urban
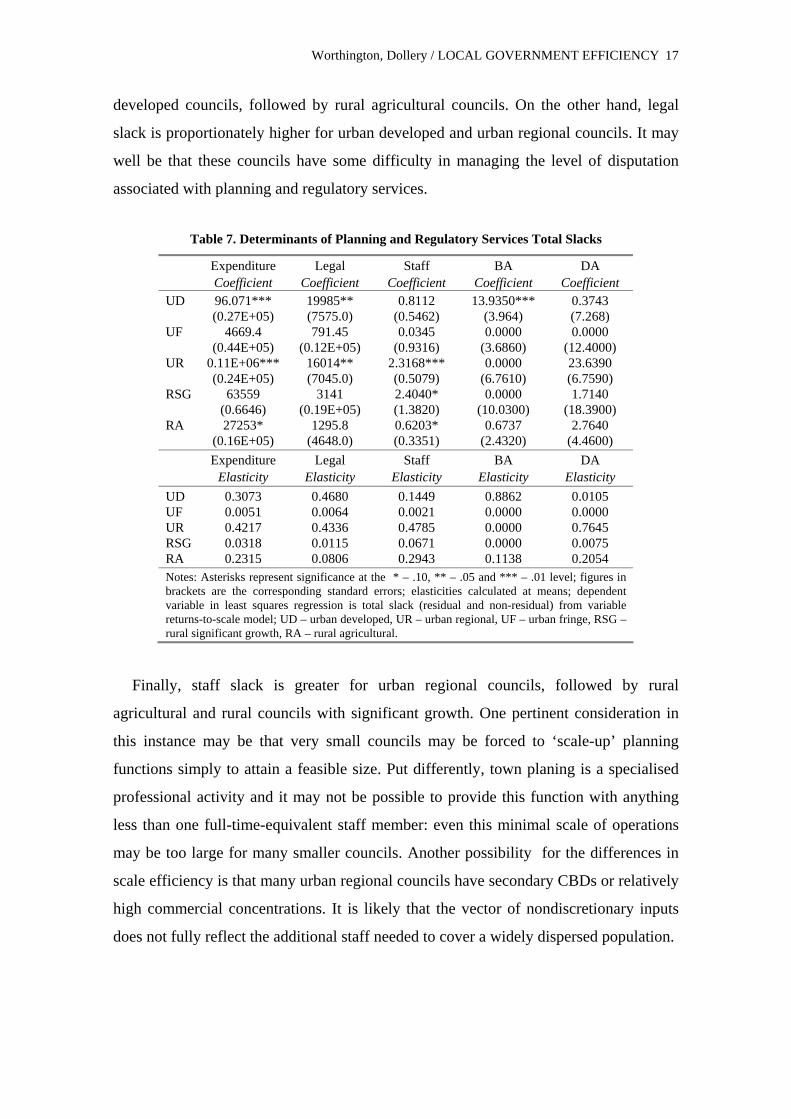
Worthington, Dollery / LOCAL GOVERNMENT EFFICIENCY 17
developed councils, followed by rural agricultural councils. On the other hand, legal
slack is proportionately higher for urban developed and urban regional councils. It may
well be that these councils have some difficulty in managing the level of disputation
associated with planning and regulatory services.
Table 7. Determinants of Planning and Regulatory Services Total Slacks
Expenditure Legal Staff BA DA Coefficient Coefficient Coefficient Coefficient Coefficient
UD 96.071*** (0.27E+05)
19985** (7575.0)
0.8112 (0.5462)
13.9350*** (3.964)
0.3743 (7.268)
UF 4669.4 (0.44E+05)
791.45 (0.12E+05)
0.0345 (0.9316)
0.0000 (3.6860)
0.0000 (12.4000)
UR 0.11E+06*** (0.24E+05)
16014** (7045.0)
2.3168*** (0.5079)
0.0000 (6.7610)
23.6390 (6.7590)
RSG 63559 (0.6646)
3141 (0.19E+05)
2.4040* (1.3820)
0.0000 (10.0300)
1.7140 (18.3900)
RA 27253* (0.16E+05)
1295.8 (4648.0)
0.6203* (0.3351)
0.6737 (2.4320)
2.7640 (4.4600)
Expenditure Legal Staff BA DA Elasticity Elasticity Elasticity Elasticity Elasticity UD 0.3073 0.4680 0.1449 0.8862 0.0105 UF 0.0051 0.0064 0.0021 0.0000 0.0000 UR 0.4217 0.4336 0.4785 0.0000 0.7645 RSG 0.0318 0.0115 0.0671 0.0000 0.0075 RA 0.2315 0.0806 0.2943 0.1138 0.2054 Notes: Asterisks represent significance at the * – .10, ** – .05 and *** – .01 level; figures in brackets are the corresponding standard errors; elasticities calculated at means; dependent variable in least squares regression is total slack (residual and non-residual) from variable returns-to-scale model; UD – urban developed, UR – urban regional, UF – urban fringe, RSG – rural significant growth, RA – rural agricultural.
Finally, staff slack is greater for urban regional councils, followed by rural
agricultural and rural councils with significant growth. One pertinent consideration in
this instance may be that very small councils may be forced to ‘scale-up’ planning
functions simply to attain a feasible size. Put differently, town planing is a specialised
professional activity and it may not be possible to provide this function with anything
less than one full-time-equivalent staff member: even this minimal scale of operations
may be too large for many smaller councils. Another possibility for the differences in
scale efficiency is that many urban regional councils have secondary CBDs or relatively
high commercial concentrations. It is likely that the vector of nondiscretionary inputs
does not fully reflect the additional staff needed to cover a widely dispersed population.
PPMR 18
Concluding Remarks
A number of conclusions emerge from the present study. Firstly, just as the
geographic, demographic and socioeconomic characteristics of Australian councils vary
widely, so too does the level of technical and scale efficiency across councils. All other
things being equal, urban developed, fringe and regional councils are relatively more
technically and scale efficient than rural councils in the provision of planning and
regulatory services than rural, non-urban councils. This holds even when factors that
may impact upon the efficiency of planning services, such as population dispersion, are
taken into account.
Secondly, in terms of the function analysed, namely, planning and regulatory
services, pure technical inefficiency contributed the most to technical inefficiency, with
scale inefficiency being relatively less important. This would suggest that the inability
to combine inputs and outputs in optimal proportions is the main cause of inefficiency
in most council economic services, rather than the inability to attain an optimal scale of
operations. Finally, the main source of efficiency in urban councils would appear to be
excessively large legal expenses related to the planning process, whilst for rural
councils the main source is excessively large planning staff numbers. One reason that
this latter finding is the requirement to maintain a minimum feasible planning
department, regardless of a council’s planning requirements.
These conclusions have very different policy implications. For example, the failure
to achieve an optimal scale of operations in the provision of planning services may be
an argument supporting a greater degree of resource-sharing and regional co-operation
in these services. Likewise, the fact that councils may be obliged to provide a minimum
scale of planning operations has important implications for Australia’s system of
intergovernmental grants and the stated objective of ‘horizontal equalisation’ (whereby
factors beyond a council’s control are factored into relative grants). However, one of the
main findings of this analysis is the significant amount of efficiency variation between
councils that exists even when nondiscretionary factors are taken into account. That is,
when variables postulated to affect the provision of local public sector functions are
included in the mathematical constraints, and efficiency improvements are only
measured against those variables over which a council exerts managerial control,
efficiency differences remain. More particularly, these efficiency differences are often
systemic to particular categories of local governments in New South Wales.
Worthington, Dollery / LOCAL GOVERNMENT EFFICIENCY 19
Two possibilities seem feasible. Firstly, the vectors of nondiscretionary variables
included have some how inadvertently excluded some relevant factors. Alternatively,
those variables which are included inappropriately proxy the disabilities imposed upon
particular councils. The second possibility is that discretionary factors unique to
individual councils are distributed in a non-random manner across the sample. For
example, whereas councils may share geographic and demographic characteristics, they
may also have other factors in common. These may include the political characteristics
of elected representatives, the financial profile of the council, or the quality of
managerial inputs. These additional considerations would provide useful starting points
for future empirical studies.
References
Ali, A.I., & Seiford, L.M. (1993). The mathematical programming approach to efficiency analysis. In H.O. Fried, C.A.K. Lovell and S.S. Schmidt (Eds.), The measurement of productive efficiency (pp. 120-159). New York: Oxford University Press.
Athanassopoulos, A.D., & Karkazis, J. (1997). The efficiency of social and economic image projection in spatial configurations. Journal of Regional Science, 37(1), 75-97.
Banker, R.D. (1996). Hypothesis tests using data envelopment analysis. Journal of Productivity Analysis, 7(2-3), 133-159.
Banker, R.D., Charnes, A., & Cooper, W.W. (1984). Some models for estimating technical and scale inefficiencies in data envelopment analysis. Management Science, 30(9), 1078-1092.
Bjurek, H., Kjulin, U., & Gustafsson, B. (1992). Efficiency, productivity and determinants of inefficiency at public day care centers in Sweden. Scandinavian Journal of Economics, 94(Supplement), 173-187.
Charnes, A., Cooper, W.W., & Li, S. (1989). Using data envelopment analysis to evaluate efficiency in the economic performance of Chinese cities. Socio-Economic Planning Science, 23(6), 325-344.
Charnes, A., Cooper, W.W., & Rhodes, E. (1978). Measuring the efficiency of decision making units. European Journal of Operational Research, 2(6), 429-444.
Charnes, A., Cooper, W.W., Lewin, A.Y., & Seiford, L.M. (1993). Data envelopment analysis: Theory, methodology and applications. Boston: Kluwer.
Cook, W.D., Roll, Y., & Kazakov, A. (1990). A DEA model for measuring the relative efficiency of highway maintenance patrols. Informational Systems and Operational Research, 28(1), 113-124.
De Borger, B., & Kerstens, K. (1996a). Cost efficiency of Belgian local governments: A comparative analysis of FDH, DEA and econometric approaches. Regional Science and Urban Economics, 26(2), 145-170.
De Borger, B., & Kerstens, K. (1996b). Radial and nonradial measures of technical efficiency: An empirical illustration for Belgian local governments using an FDH reference technology. Journal of Productivity Analysis, 7(1), 5-18.
De Borger, B., Kerstens, K., Moesen, W., & Vanneste, J. (1994). Explaining differences in productive efficiency: An application to Belgian municipalities. Public Choice, 80, 339-358.
Domberger, S., Meadowcroft, S.A., & Thompson, D.J. (1986). Competitive tendering and efficiency: The case of refuse collection. Fiscal Studies, 7(4), 69-87.
Fried, H.O., Lovell, C.A.K., & Turner, J.A. (1996). An analysis of the performance of university-affiliated credit unions. Computers and Operations Research, 23(4), 375-384.
PPMR 20
Fried, H.O., Lovell, C.A.K., & Vanden Eekaut, P. (1993). Evaluating the performance of US credit unions. Journal of Banking and Finance, 17(2-3), 251-265.
Ganley, J.A., & Cubbin, J.S. (1992). Public sector efficiency measurement: Applications of data envelopment analysis. Amsterdam: North Holland.
Golany, B., & Roll, Y. (1993). Some extensions of techniques to handle non-discretionary factors in data envelopment analysis. Journal of Productivity Analysis, 4(4), 419-432.
Grosskopf, S., & Yaisawarng, S. (1990). Economies of scope in the provision of local public services. National Tax Journal, 43(1), 61-74.
Hood, L. (1991). A public management for all seasons. Public Administration, 69(1), 3-19. Independent Pricing and Regulatory Tribunal of New South Wales (1997). Benchmarking local
government performance in New South Wales: Interim report. Sydney: IPART. Kittelsen, S.A.C., & Førsund, F.R. (1992). Efficiency analysis of Norwegian district courts. Journal of
Productivity Analysis, 3(3), 277-306. Kooreman, P. (1994) Nursing home care in The Netherlands: A nonparametric efficiency analysis,
Journal of Health Economics, 13, 301–316. Mensah, Y.M., & Li, S.H. (1993). Measuring production efficiency in a not-for-profit setting: An
extension. The Accounting Review, 68(1), 66-88. Neutze, M. (1997). Funding urban services: Options for physical infrastructure. Sydney: Allen and
Unwin. NSW Department of Local Government (1993). Comparative information on NSW local government
councils 1992. Sydney: Department of Local Government and Co-operatives. NSW Local Government Grants Commission (1994). Annual report 93/94. Sydney: Department of Local
Government. Pestieau, P., & Tulkens, H. (1990). Assessing the performance of public sector activities: Some recent
evidence from the productive efficiency viewpoint. Centre for Operations Research and Econometrics Discussion Paper No. 9060, Universite Catholique de Louvain, Louvain-la-Neuve (Belgium).
Pestieau, P., & Tulkens, H. (1993). Assessing and explaining the performance of public enterprises. Finanz Archiv, 50(3), 293-323.
Rouse, P., Putterill, M., & Ryan, D. (1995). Measuring the performance of New Zealand local authority maintenance activities in roading using data envelopment analysis. Paper presented to the New England Conference on Efficiency and Productivity, 23-24 November, University of New England.
Ruggiero, J. (1996). On the measurement of technical efficiency in the public sector. European Journal of Operational Research, 90(3), 553-565.
Seiford, L.M., & Thrall, R.M. (1990). Recent developments in DEA: The mathematical programming approach to frontier analysis. Journal of Econometrics, 46(1-2), 7-38.
Smith, P., & Mayston, D. (1987). Measuring efficiency in the public sector. OMEGA Journal of Management Science, 15(3), 181-189.
Steering Committee for the Review of Commonwealth/State Service Provision (1997). Report on Commonwealth/state service provision: Volume 1. Canberra: AGPS.
Thanassoulis, E., & Dunstan, P. (1994). Guiding schools to improved performance using data envelopment analysis: An illustration with data from a local education authority. Journal of the Operational Research Society, 45(11), 1247-1262.
Thanassoulis, E., Boussofiane, A., & Dyson, R.G. (1996). A comparison of data envelopment analysis and ratio analysis as tools for performance measurement. OMEGA, International Journal of Management Science, 24(3), 229-244.
Valdmanis, V. (1992). Sensitivity analysis for DEA models. An empirical example using public vs. NFP hospitals. Journal of Public Economics, 48(2), 185-205.
Vanden Eeckaut, P.J., Tulkens, H., & Jamar, M.A. (1993). Cost efficiency in Belgian municipalities. In H.O. Fried, C.A. Lovell and S.S. Schmidt (Eds.), The measurement of productive efficiency: Techniques and applications (pp. 300-334). New York: Oxford University Press.
Worthington, Dollery / LOCAL GOVERNMENT EFFICIENCY 21
Andrew C. Worthington is a senior lecturer in the School of Economics and Finance at the Queensland University of Technology, Brisbane, Queensland, Australia. His research interests include public sector efficiency and productivity measurement and performance frameworks. His work has been published in Public Choice, Financial Accountability and Management, Local Government Studies, Journal of Public Budgeting, Accounting and Financial Management, Public Budgeting and Finance, Public Finance/Finances Publiques, and Publius: The Journal of Federalism. [email protected]
Brian E. Dollery is an associate professor in the School of Economics and Related Studies at the University of New England, Armidale, New South Wales, Australia and Director of the Centre for Local Government. His research interests focus on public sector reform and the empirical analysis of public sector efficiency. His work has been published in Public Choice, Public Administration, Public Finance/Finances Publiques, Governance, and Publius: The Journal of Federalism. Email. [email protected]