Embed Size (px)
Citation preview

Measuring Effectiveness of Kaizen Events within the Wood Products
IndustrySevtap Erdogan, MS student*
Henry Quesada-Pineda, Associate Professor*Brian Bond, Professor*
*Virginia Tech
SWST Conference. Curitiba, Brazil. March 2016
Background
• Key features of Kaizen
Elimination of waste
5S framework
Standardization
TeamworkSelf-discipline
Improved moraleQuality circles
Improvement suggestions
Background
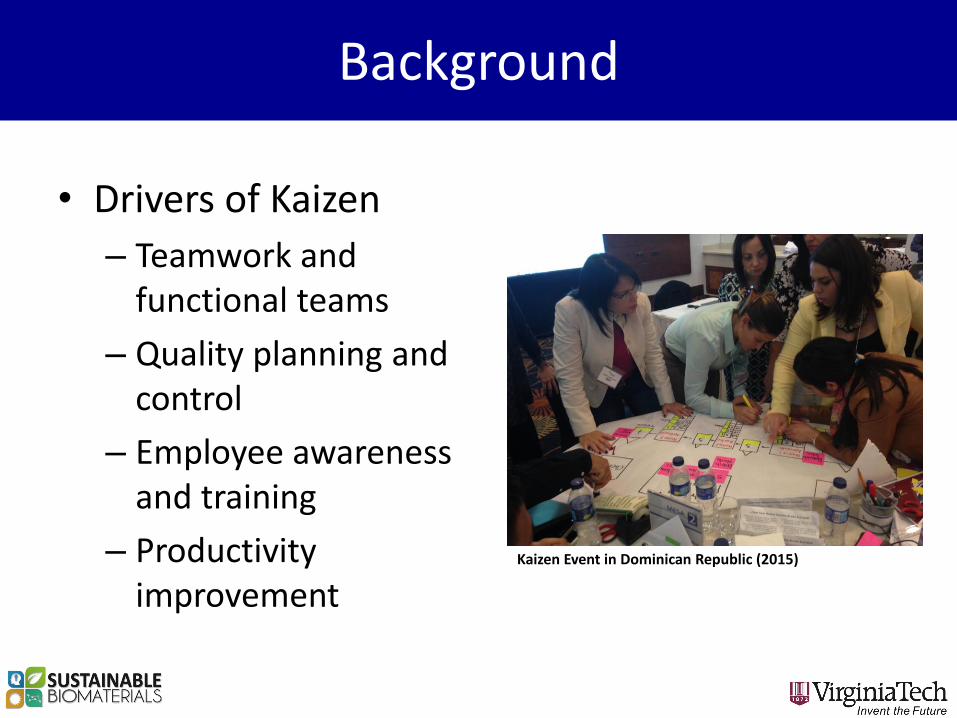
• Drivers of Kaizen
– Teamwork and functional teams
– Quality planning and control
– Employee awareness and training
– Productivity improvement
Kaizen Event in Dominican Republic (2015)
Problem Statement
• Competiveness: Imported products, waste reduction, high fuel costs, lack of innovation, environmental issues, raw material costs
• Kaizen sustainability issues:
– Barriers to Kaizen and Continuous Improvement (CI)
– Motivators for Kaizen events and CI
– Effectiveness of Kaizen events
– Drivers of Kaizen events
Goal and objectives
• Goal: to develop a tool to measure the effectiveness of Kaizen events
• Objectives:1. Identify motivators and barriers impacting Kaizen events2. Develop a tool to measure the effectiveness of Kaizen
events3. Apply the tool to case study companies in the wood
products secondary sector• H1: Perception on motivators and barriers to Kaizen are the same
for production and non-production employees• H2: The perceptions of production versus non-production staff are
the same regarding Kaizen effectiveness.• H3: Effectiveness of Kaizen =b0+ b1(Teamwork) + b2(Employee
awareness and training)+ b3(Productivity improvement)+ b4(Quality planning and control) + Error
6
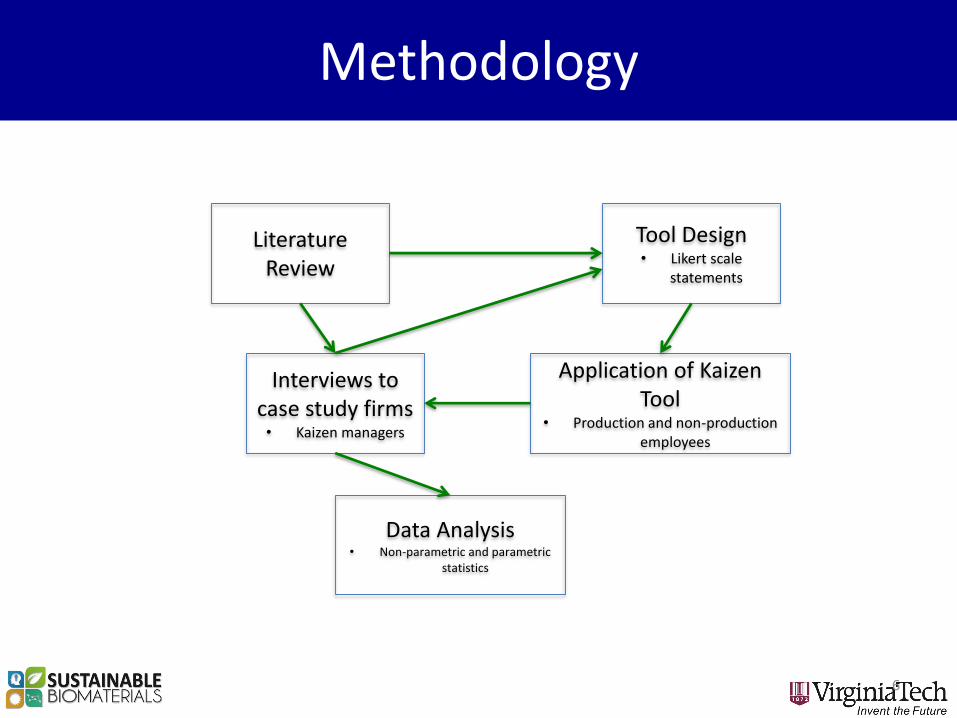
Methodology
Literature Review
Tool Design• Likert scale
statements
Interviews to case study firms• Kaizen managers
Application of Kaizen Tool
• Production and non-production employees
Data Analysis• Non-parametric and parametric
statistics
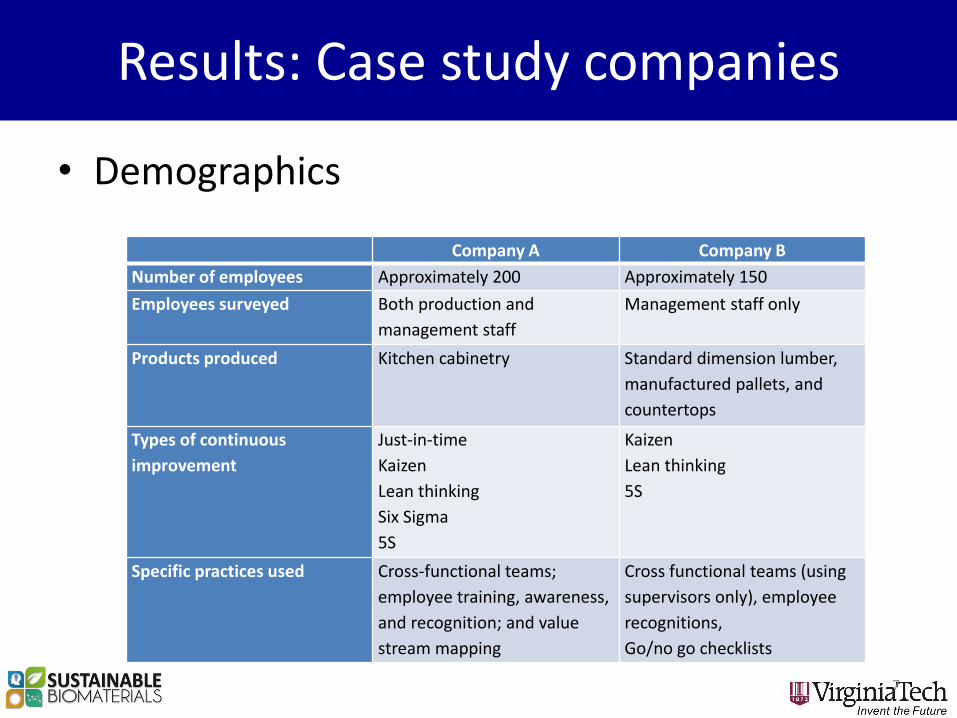
Results: Case study companies
• Demographics
7
Company A Company B
Number of employees Approximately 200 Approximately 150
Employees surveyed Both production and
management staff
Management staff only
Products produced Kitchen cabinetry Standard dimension lumber,
manufactured pallets, and
countertops
Types of continuous
improvement
Just-in-time
Kaizen
Lean thinking
Six Sigma
5S
Kaizen
Lean thinking
5S
Specific practices used Cross-functional teams;
employee training, awareness,
and recognition; and value
stream mapping
Cross functional teams (using
supervisors only), employee
recognitions,
Go/no go checklists
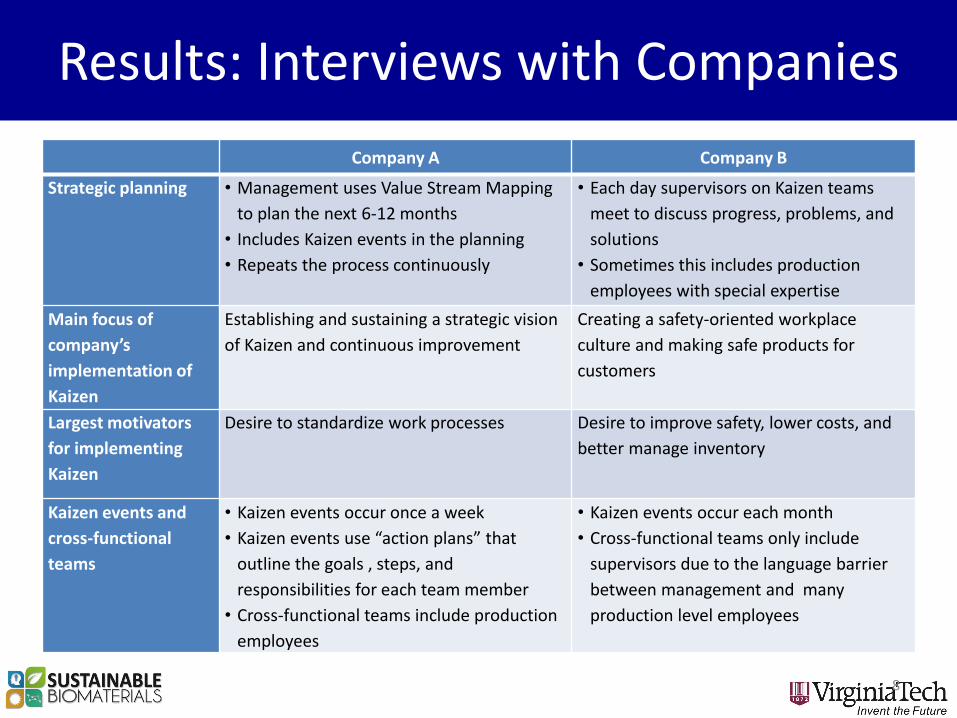
Results: Interviews with Companies
8
Company A Company B
Strategic planning • Management uses Value Stream Mapping
to plan the next 6-12 months
• Includes Kaizen events in the planning
• Repeats the process continuously
• Each day supervisors on Kaizen teams
meet to discuss progress, problems, and
solutions
• Sometimes this includes production
employees with special expertise
Main focus of
company’s
implementation of
Kaizen
Establishing and sustaining a strategic vision
of Kaizen and continuous improvement
Creating a safety-oriented workplace
culture and making safe products for
customers
Largest motivators
for implementing
Kaizen
Desire to standardize work processes Desire to improve safety, lower costs, and
better manage inventory
Kaizen events and
cross-functional
teams
• Kaizen events occur once a week
• Kaizen events use “action plans” that
outline the goals , steps, and
responsibilities for each team member
• Cross-functional teams include production
employees
• Kaizen events occur each month
• Cross-functional teams only include
supervisors due to the language barrier
between management and many
production level employees
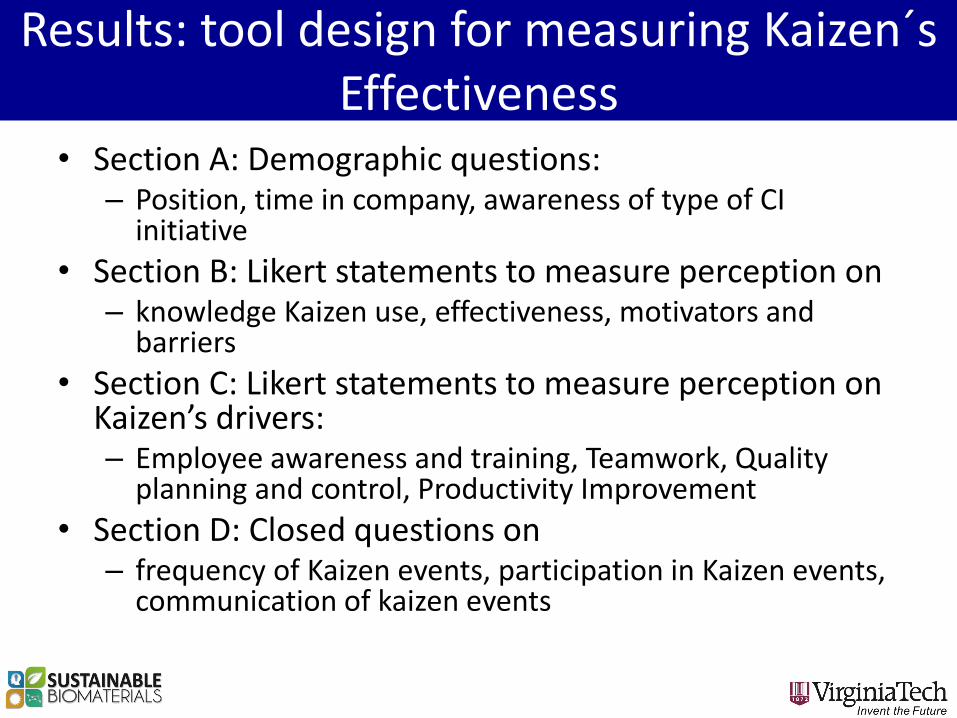
Results: tool design for measuring Kaizen´sEffectiveness
• Section A: Demographic questions: – Position, time in company, awareness of type of CI
initiative
• Section B: Likert statements to measure perception on– knowledge Kaizen use, effectiveness, motivators and
barriers
• Section C: Likert statements to measure perception on Kaizen’s drivers: – Employee awareness and training, Teamwork, Quality
planning and control, Productivity Improvement
• Section D: Closed questions on – frequency of Kaizen events, participation in Kaizen events,
communication of kaizen events
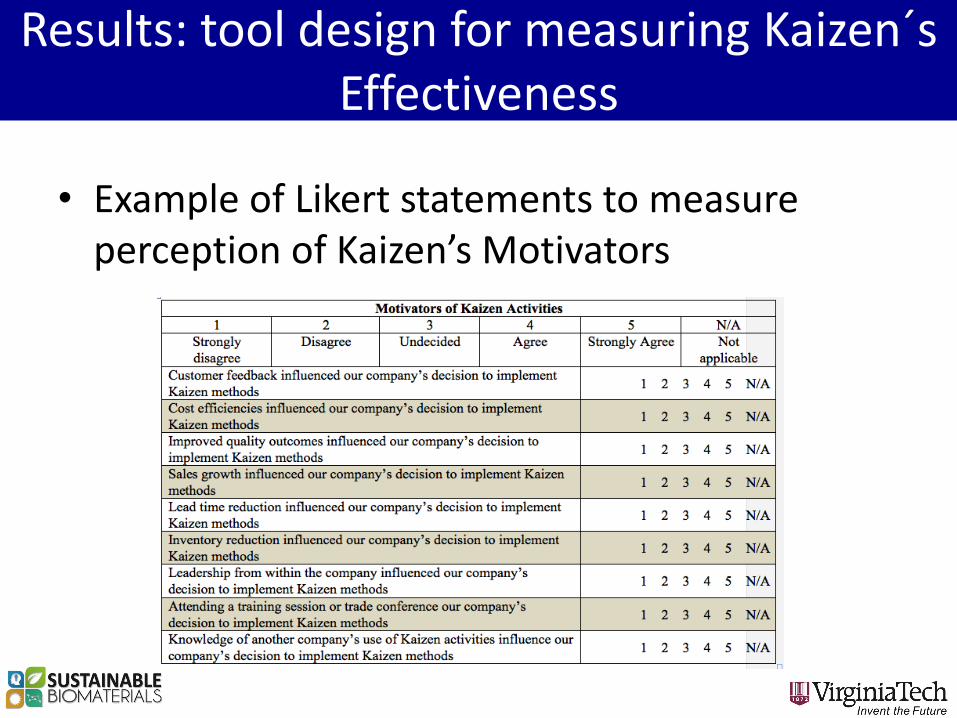
• Example of Likert statements to measure perception of Kaizen’s Motivators
Results: tool design for measuring Kaizen´sEffectiveness
Results: Application of tool
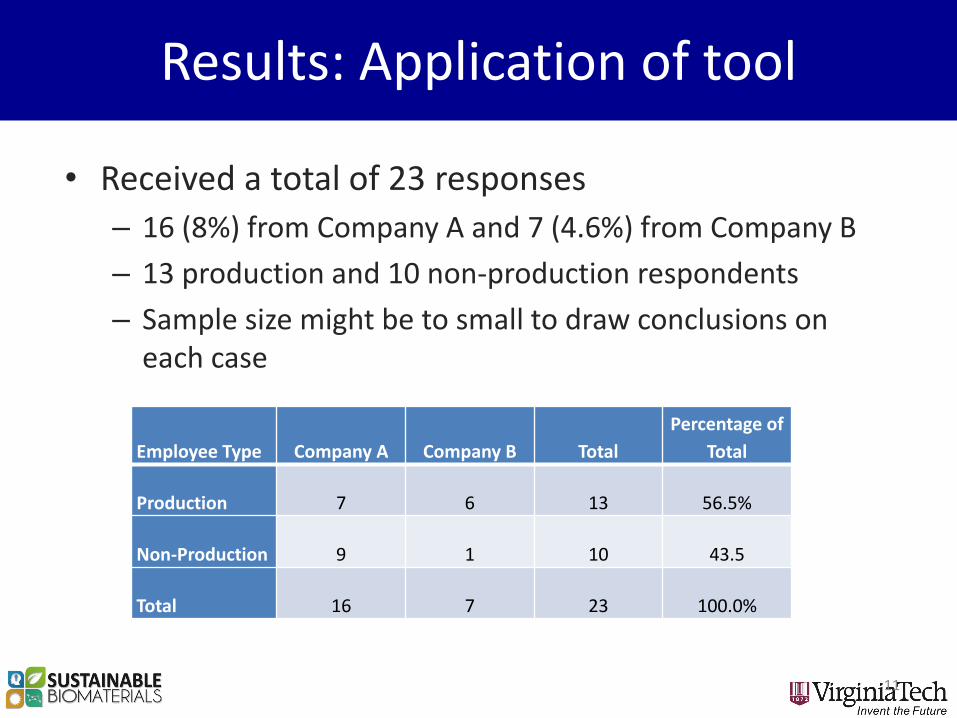
• Received a total of 23 responses
– 16 (8%) from Company A and 7 (4.6%) from Company B
– 13 production and 10 non-production respondents
– Sample size might be to small to draw conclusions on each case
11
Employee Type Company A Company B Total
Percentage of
Total
Production 7 6 13 56.5%
Non-Production 9 1 10 43.5
Total 16 7 23 100.0%
Results: Application of tool
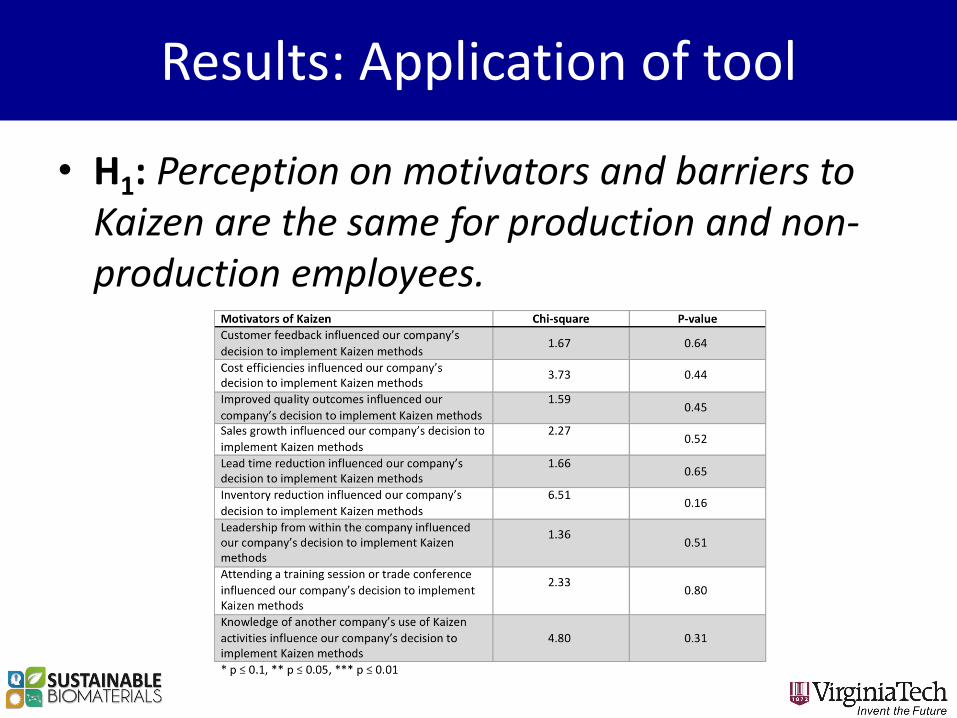
• H1: Perception on motivators and barriers to Kaizen are the same for production and non-production employees.
Results: Application of tool
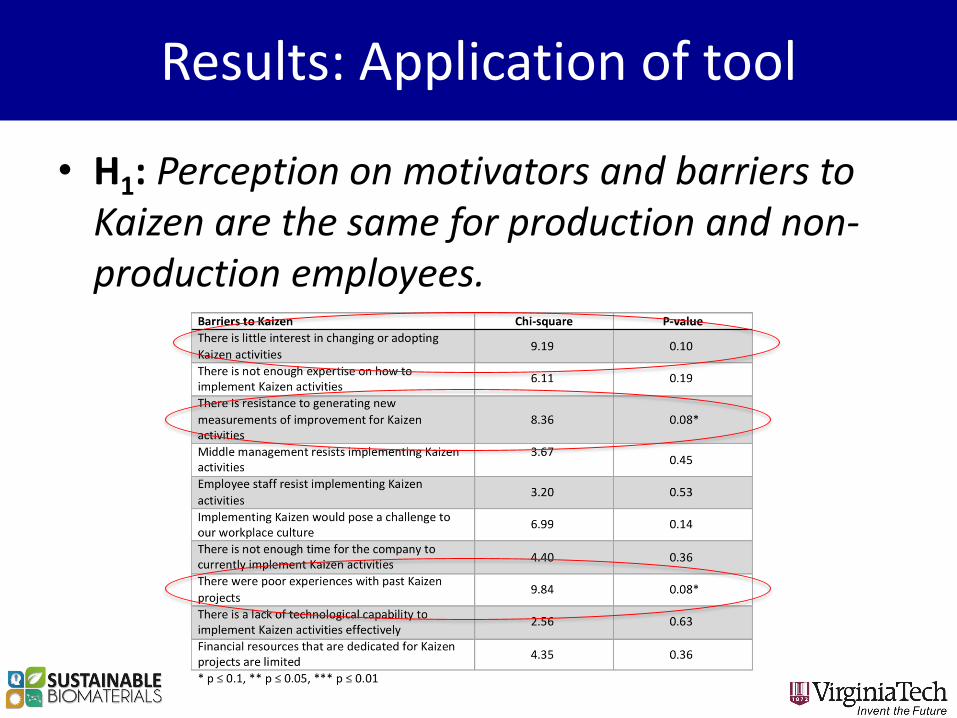
• H1: Perception on motivators and barriers to Kaizen are the same for production and non-production employees.
Results: Application of tool
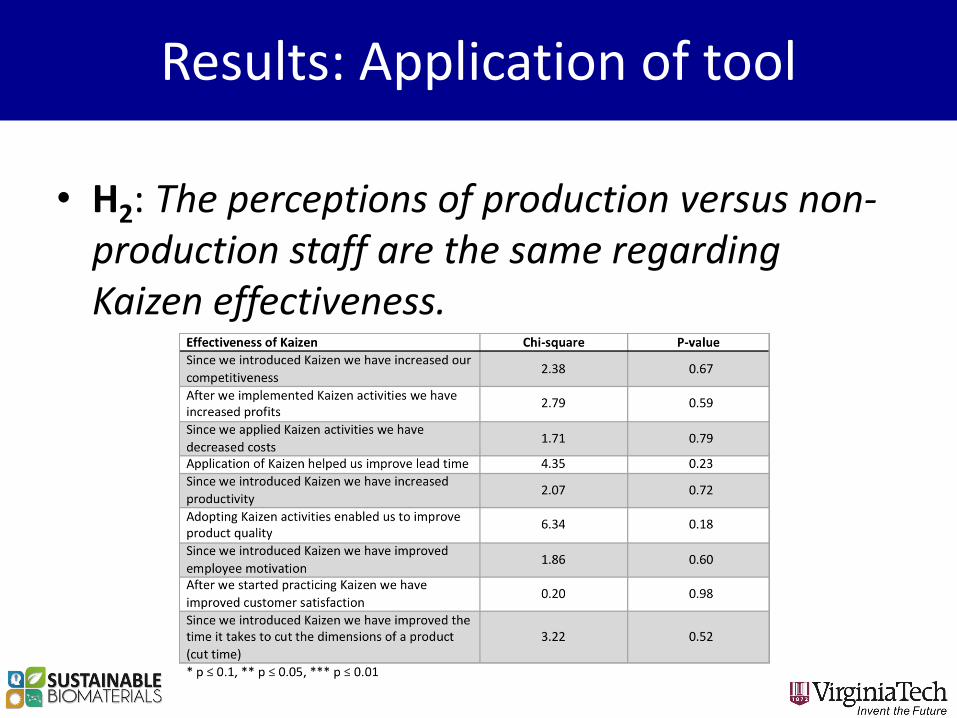
• H2: The perceptions of production versus non-production staff are the same regarding Kaizen effectiveness.
Results: Application of tool
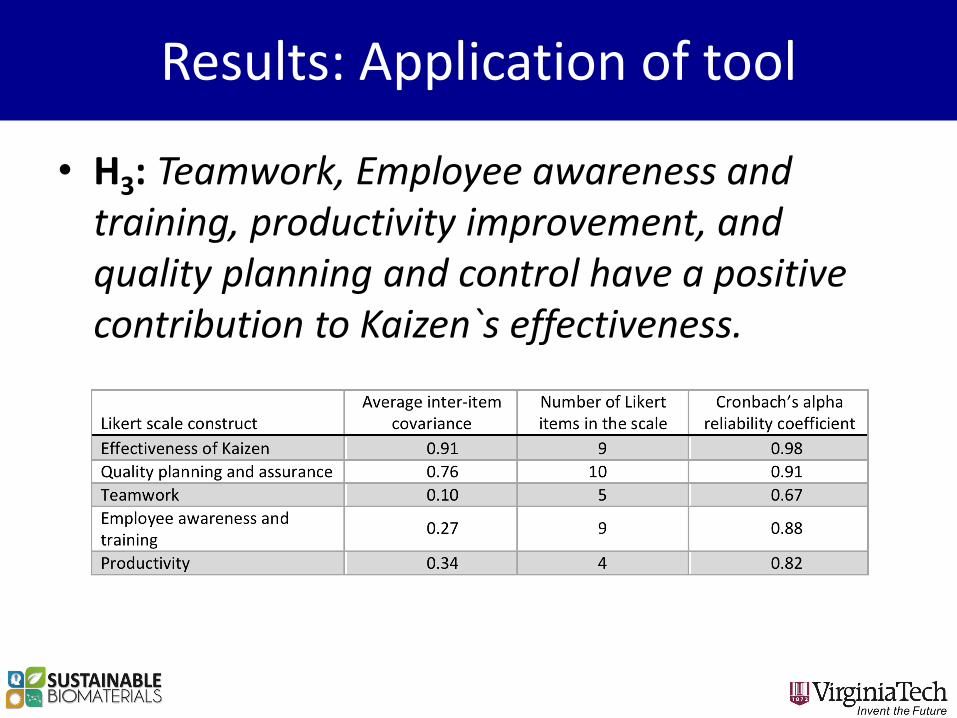
• H3: Teamwork, Employee awareness and training, productivity improvement, and quality planning and control have a positive contribution to Kaizen`s effectiveness.
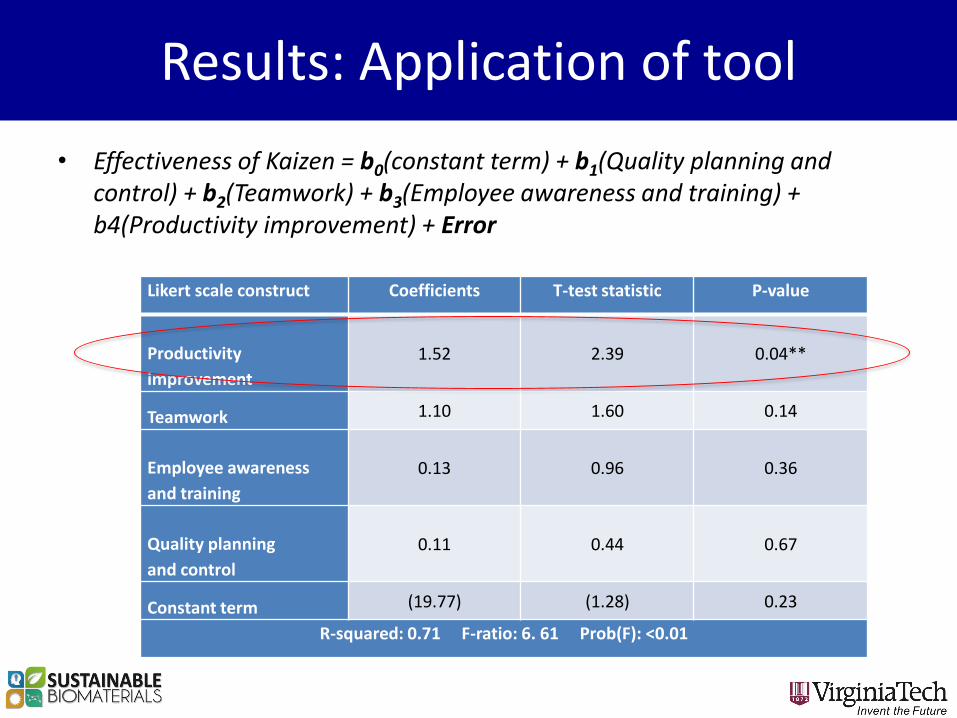
Likert scale construct Coefficients T-test statistic P-value
Productivity
improvement
1.52 2.39 0.04**
Teamwork 1.10 1.60 0.14
Employee awareness
and training
0.13 0.96 0.36
Quality planning
and control
0.11 0.44 0.67
Constant term (19.77) (1.28) 0.23
R-squared: 0.71 F-ratio: 6. 61 Prob(F): <0.01
Results: Application of tool
• Effectiveness of Kaizen = b0(constant term) + b1(Quality planning and control) + b2(Teamwork) + b3(Employee awareness and training) + b4(Productivity improvement) + Error
Conclusions
• Sustainability of Kaizen events are affected by
– Motivators, barriers, and drivers to Kaizen
• Drivers to Kaizen are:
• Employee awareness and training, Teamwork, Quality planning and control, Productivity Improvement
• A tool to measure the effectiveness of Kaizen events was created and applied to two secondary wood products companies
Conclusions
• Nonparametric and parametric statistics were used to measure the effectiveness of Kaizen events. Main results indicate that:– Sample size is too small
– Barriers (production vs non-production workers): • No interesting in changing or adopting Kaizen events
• Resistance to generate new measurements for Kaizen events
• Poor experiences with previous Kaizen events
– Perceptions of productivity improvement were positively and significantly related to perceptions of the effectiveness of Kaizen

Acknowledgments
• Research funded by the Turkish Government and the Department of Sustainable Biomaterials at Virginia Tech

Thanks for your time
Sevtap Erdogan, [email protected]
Henry Quesada-Pineda, [email protected]
Brian Bond, [email protected]