Embed Size (px)
Citation preview
MEASURING COST EFFECTIVENESS OF
PRODUCT WHEELS IN FOOD
MANUFACTURING
By
EMILIE JENSEN
B.S., University of Minnesota, 2009
A THESIS
Submitted in partial fulfillment of the requirements
for the degree
MASTER OF AGRIBUSINESS
Department of Agricultural Economics
College of Agriculture
KANSAS STATE UNIVERSITY
Manhattan, Kansas
2014
Approved by:
Major Professor
Dr. Keith Harris
ABSTRACT
The focus of this research is to create a production schedule that will increase
capacity while staying within business constraints of shelf life and warehouse space in a
industrial food processing environment. The results support that product wheels maximize
process responsiveness by lengthening production runs, and increasing safety stock
inventory. In doing so, it maintains acceptable customer service levels and minimizes
overtime costs.
This study develops a model that simulates the relevant variables impacting the
performance of the operation. The results show significant cost reductions are achieved by
eliminating changeovers, increasing line capacity, safety stock levels protect against 99%
of order variation, and warehouse space is available to house increased cycle stock and
safety stock. Given the results on this line, I recommend expanding the model to other food
processing locations within the business to further increase capacity and decrease overtime
expenses.
iii
TABLE OF CONTENTS
List of Figures .......................................................................................................................... v
List of Tables .......................................................................................................................... vi
Acknowledgments ................................................................................................................. vii
Chapter I: Introduction ......................................................................................................... 1
1.1 Company Background .................................................................................................. 1
1.2 DSO’s Objective .......................................................................................................... 1
1.3 Research Objective ...................................................................................................... 2
1.4 Thesis Outline ............................................................................................................... 3
Chapter II: Literature Review .............................................................................................. 4
2.1 Capacitated Planning and Scheduling in the Food Industry ....................................... 4
2.2 Resource-Constrained Production Planning in Semi-Continuous Food Industries ... 4
2.3 Developing Product Wheels for Process Industry Operations .................................... 5
2.4 Revisiting the shelf life constrained multi-product problem ....................................... 5
2. 5 Multi-Product Lot Scheduling with Backordering and Shelf-Life Constraints ......... 6
2.6 Interview with DSO Scheduling Manager................................................................... 6
2.7 Summary of Literature Review .................................................................................... 7
Chapter III: Theory ................................................................................................................ 8
3.1 Hypothesis .................................................................................................................... 8
3.2 Product Wheels ............................................................................................................. 8
iv
3.3 Safety stock ................................................................................................................... 9
Chapter IV: Methods ........................................................................................................... 12
4.1 Developing a Trial Product Wheel ............................................................................ 12
4.2 Outlining Business Constraints .................................................................................. 12
4.2.1 Ship Shelf Life Constraint ........................................................................... 13
4.2.2 Customer Service Level Constraint ............................................................. 13
4.2.3 Warehousing Constraint .............................................................................. 14
4.3 Collecting Data ........................................................................................................... 15
4.4 Creating the Model ..................................................................................................... 15
Chapter V: Analysis & Results ........................................................................................... 19
5.1 Proposed Solution ....................................................................................................... 19
5.2 Cost Effectiveness of the Proposed Solution ............................................................. 20
5.3 Sensitivity Analysis on Customer Service Level ...................................................... 22
5.3 Practical Application .................................................................................................. 23
5.3 Lessons Learned from Trial Product Wheel .............................................................. 26
Chapter VI: Conclusion ....................................................................................................... 27
6.1 Final Recommendations ............................................................................................. 27
6.2 Further Research ......................................................................................................... 27
6.3 Final Thoughts ............................................................................................................ 28
Works Cited ........................................................................................................................... 29
v
LIST OF FIGURES
Figure 3.1: Product Wheel Including Both Make-to-Stock and Make-to-Order Items 9
Figure 3.2: Safety Stock Equation ...................................................................................... 10
Figure 3.3: Inventory designed for a 95 percent service level ......................................... 11
Figure 5.1: Current Make-To-Order Sales Order & Scheduler Response Process
Flow .................................................................................................................................... 24
Figure 5.2: Proposed Solution: Sales Order & Scheduler Response Process ............... 25
vi
LIST OF TABLES
Table 4.1: Proposed Model Using Methodology Outlined in Chapter 4 ....................... 15
Table 5.1: Proposed Solution: Product Wheel Results Derived from Sample Model .. 20
Table 5.2: Current State: Actual Cup Line Schedule Month of November 2013 ........ 20
Table 5.3: Cup Line Changeover/Setup Cost Calculation ............................................. 21
Table 5.4: Economic Implications of the Proposed Model versus Current State ........ 22
Table 5.5: Level of Service Sensitivity on Warehousing Costs ...................................... 23
vii
ACKNOWLEDGMENTS
The author wishes to thank the following people for their contributions and support
throughout the thesis process:
- I would like to thank my amazing husband, Michael Jensen, for all of your support
on every assignment, lecture, and chat session throughout the MAB program. I
couldn’t have done it without your encouragement and procrastination patrol.
- On the Cargill side I would like to thank the DSO Commercial Manager, Juan
Colmenares, for his guidance throughout the project. From brainstorming all the
way to implementation support, and overall his deep rooted belief in my success.
- Next, I would like thank Dr. Arlo Biere and Dr. Jason Bergtold for serving on my
thesis committee and providing invaluable feedback to make this paper a true
academic contribution.
- Last but not least, I would like to thank Dr. Keith Harris for serving as my Major
Professor. The progress from organized chaos to a fully articulate work was not an
easy one, after editing countless drafts and working nights and weekends, I am
proud to say that we have arrived safely at our destination.
1
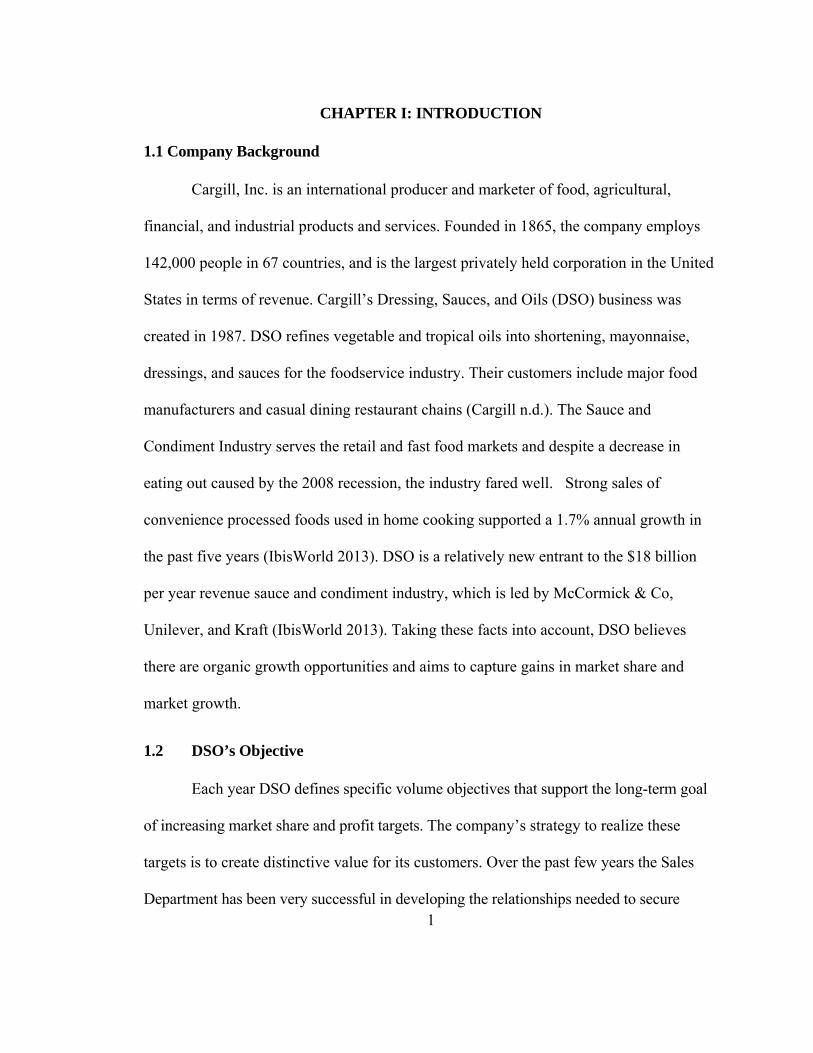
CHAPTER I: INTRODUCTION
1.1 Company Background
Cargill, Inc. is an international producer and marketer of food, agricultural,
financial, and industrial products and services. Founded in 1865, the company employs
142,000 people in 67 countries, and is the largest privately held corporation in the United
States in terms of revenue. Cargill’s Dressing, Sauces, and Oils (DSO) business was
created in 1987. DSO refines vegetable and tropical oils into shortening, mayonnaise,
dressings, and sauces for the foodservice industry. Their customers include major food
manufacturers and casual dining restaurant chains (Cargill n.d.). The Sauce and
Condiment Industry serves the retail and fast food markets and despite a decrease in
eating out caused by the 2008 recession, the industry fared well. Strong sales of
convenience processed foods used in home cooking supported a 1.7% annual growth in
the past five years (IbisWorld 2013). DSO is a relatively new entrant to the $18 billion
per year revenue sauce and condiment industry, which is led by McCormick & Co,
Unilever, and Kraft (IbisWorld 2013). Taking these facts into account, DSO believes
there are organic growth opportunities and aims to capture gains in market share and
market growth.
1.2 DSO’s Objective
Each year DSO defines specific volume objectives that support the long-term goal
of increasing market share and profit targets. The company’s strategy to realize these
targets is to create distinctive value for its customers. Over the past few years the Sales
Department has been very successful in developing the relationships needed to secure
2
contracts/commitments to purchase DSO products; however, the commitments have
outpaced DSO’s production capacity. In July 2013, DSO was awarded a large contract with
a fast food chain, and to meet increased sales the production personnel worked an average
20 hours per week of overtime, costing the company $50,000- $100,000 per month in
wages. Due to the industry’s notably low profit margin, this unbudgeted expense can
reduce profitability up to 5% annually. In order to meet the FY 2013-2014 market share
targets, while still meeting budget, DSO is looking for ideas on how to quickly increase
production volume and decrease overtime. There are a variety of capital projects underway
to help achieve these goals in the long run including building additional storage capacity
and increasing operational efficiencies. However, the more pressing issue is to find a short-
term solution without infringing upon current budget objectives.
1.3 Research Objective
Capital projects are out of the scope for this study given the short timeline. The
focus of this study is to capture the value on the shop floor in the most efficient way
possible. DSO needs to ensure it effectively uses its current assets to produce the 2000+
SKU’s the business handles every year within budget. The objective of this thesis is to
identify a production schedule for DSO that will increase production capacity while
managing ship-shelf life, warehouse capacity, and customer service levels.
In the current organizational structure, the scheduling department is responsible for
planning the production of each SKU. To ensure a practical solution, it is important to work
closely with them throughout the project. The production schedulers at DSO know when
3
products will be made, how much is in inventory, and act as a mediator between operations
and sales when customer orders are late.
1.4 Thesis Outline
Chapter 2 of this thesis will examine past studies on reducing production line
overtime including changing scheduling models and effectively balancing the cost of
efficiency with the cost of capital. Chapter 3 will explain the details of the theory, outline
the assumptions of the model, and then collect product data. Chapter 4 will sample a
production line experiencing overtime and apply a scheduling solution to create a new
production schedule. Chapter 5 will analyze the resulting model, make adjustments for
practical application, determine the economic implications, and outline how this process
could be implemented throughout the business.
4
CHAPTER II: LITERATURE REVIEW
This review of literature is not intended to be exhaustive. It is intended to identify
the recent research contributions related to production scheduling and it will serve as basis
for the initial hypothesis development.
2.1 Capacitated Planning and Scheduling in the Food Industry
This case study reviews the informal scheduling practices of a company with large
product variety and pressured profit margins. Soman et al. (2006) develop a more formal
approach by first dividing products into Make-to-Order (MTO) and Make-to-Stock (MTS)
categories then assigning lot sizes and safety stocks. To address inventory and customer
service issues, the authors used an interesting method to determine the MTO/MTS division
of products involving setup time, holding costs, and ship shelf life. This paper provided a
framework to understand and recognize areas of improvement, which included the
confirmation of the link between scheduling and capacity, delineation the need for
improvement, explanation of the idea of feasibility checks, and demonstration of how a
flowchart could be applied to this study’s problem (Soman, VanDonka and Gaalman 2006).
2.2 Resource-Constrained Production Planning in Semi-Continuous Food Industries
This research was “concerned with the allocation over time of scarce resources
between competing activities to meet customer orders in an efficient fashion” (Kopanos
and Puigjaner 2011). The authors suggest the “topic has received new impetus as
enterprises attempt to optimize their overall supply chains in response to competitive
pressures” (Kopanos and Puigjaner 2011). Kopanos and Puigjaner added an additional
focus of business constraints, saying, “Despite the significant literature in the broad area of
5
process planning and scheduling very few contributions model resource constraints in
addition to the classical production constraints” (Kopanos and Puigjaner 2011). The key
focus of this study was the constraint of labor resources, as absences caused huge
variability in their production schedule.
2.3 Developing Product Wheels for Process Industry Operations
In a 2007 presentation by DuPont Corporation, Bennett Foster uses production
scheduling examples and the application of economic lot size to demonstrate how product
wheels work; it outlines that a product wheel should be used when transitions are costly
and impacted by sequence, and that economic order quantity focuses on cost to determine
the most economical wheel. Foster also mentions the management principles needed to
make sure the plan is feasible, and an important discussion with operations and the
scheduling department is needed when considering this solution.
2.4 Revisiting the shelf life constrained multi-product problem
Sanjay Sharma reviewed three methods to manage production with a shelf life
constraint, which includes a reduction in the production rate, a reduction in the cycle time,
or a simultaneous reduction in production rate and cycle time. Sharma, stated, “Enormous
improvements are possible by synchronizing production activities sequentially in a cycle
time” (Sharma 2009). Similarly, the shelf life constrained products in this research would
be on separate cycles according to product line. These findings provided insight into the
manner in which DSO adopted the current MTO scheduling model.
6
2. 5 Multi-Product Lot Scheduling with Backordering and Shelf-Life Constraints
Yan and Banerjee managed shelf life by deriving the appropriate number of setups
for each item in a cycle instead of creating multiple cycles. There were two key
assumptions in their research that the demand rate for each item is known and that the setup
time for each item is known. Although this research included a methods section, the
process was admittedly unscientific. The research used “a greedy heuristic of successively
choosing the activities, one at a time until a feasible schedule is obtained” (Yan and
Banerjee 2013). Yan and Banerjee’s research focused on running a product multiple times
per cycle as opposed to the typical operations literature suggesting multiple cycles.
2.6 Interview with DSO Scheduling Manager
In a November 2013 interview with Dan Polak, the DSO scheduling manager
regarding current scheduling practices revealed that due to the high cost of working capital,
Cargill had worked with a consulting firm in 2007 to develop an action plan to reduce
inventory in the plants and warehouses. He stated, “The directive to eliminate all necessary
inventories was supported by popular lean manufacturing theories, and the impact on our
ability to react to customer demands took the backseat. Over the years as customer service
became top priority we maintained the MTO model despite increasing costs” (Polak 2013).
These factors make long term planning very challenging and created a day-to-day flux
reacting to order changes. Later in the interview he mentioned, “As our facilities began
reaching capacity, the cost of overtime has increased, and it has become apparent that our
practices must be reviewed” (Polak 2013). Six years ago “the current cost of working
7
capital puts a premium on holding inventory”, but times have changed and the cost of
capital is down while the cost of customer responsiveness has increased.
2.7 Summary of Literature Review
Research shows that reviewing production planning is a common optimization tool
for businesses (Kopanos and Puigjaner 2011), and that facilities experiencing inventory and
customer service issues often find a solution moving from a MTO to MTS production
schedule (Soman, VanDonka and Gaalman 2006). The food industry has additional
constraints such as procurement limitations and shelf life. A proven way to address these
concerns include synchronizing production to cycles (Sharma 2009), creating feasible
product wheels (Foster 2007), and backing into product wheels based on product shelf-life
(Yan and Banerjee 2013). It seems straightforward to analyze inventories, shipment
histories and produce an accurate production schedule, and many researchers have taken on
the challenge, but constraints make this especially challenging and a one size fits all
solution has yet to modernize the food processing industry.
8
CHAPTER III: THEORY
3.1 Hypothesis
The literature indicated a variety of opportunities to increase efficiencies within
scheduling, and verified that a scheduling solution could reduce changeovers, minimize
schedule variability, reducing overtime. I hypothesize that running an exercise with product
wheels, a tool commonly used in the literature, can help in determining the appropriate
balance of production asset utilization and warehouse utilization. Achieving this goal
would allow DSO to meet its market share goals and maintain profitability. The focus of
this chapter will examine how product wheels could help create additional capacity while
maintaining the desired customer service levels.
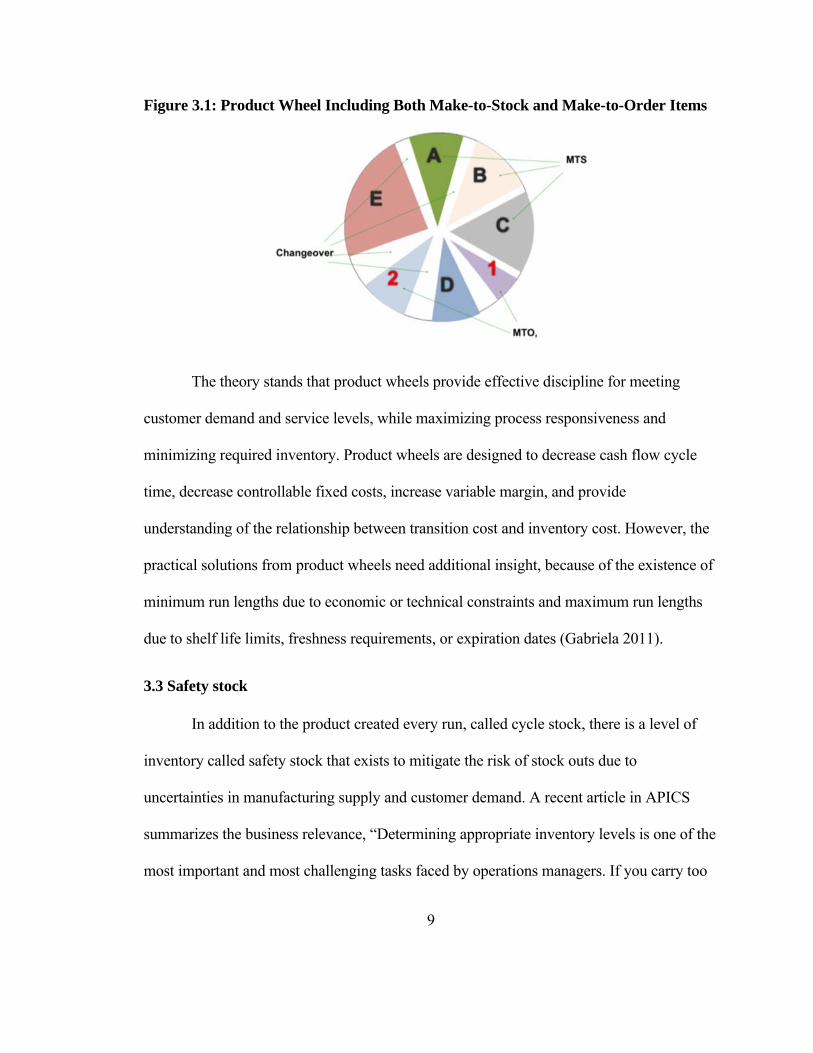
3.2 Product Wheels
According to the product wheel research presented by Bennett Foster for DuPont
Corporation, “A production wheel is a production sequence used by manufacturing
operations when multiple products are made on a single line/piece of equipment using a
consistent sequence and repetitive time cycle” (Foster 2007). In other words, product
wheels help allocate products to its best manufacturing option and schedule the assigned
products on the right resource in an optimal sequence (Snapp 2009). See Figure 3.1 for a
visual representation of a product wheel, showing the interaction of make-to-stock
products, make-to-order products, and the relevant changeover times.
9
Figure 3.1: Product Wheel Including Both Make-to-Stock and Make-to-Order Items
The theory stands that product wheels provide effective discipline for meeting
customer demand and service levels, while maximizing process responsiveness and
minimizing required inventory. Product wheels are designed to decrease cash flow cycle
time, decrease controllable fixed costs, increase variable margin, and provide
understanding of the relationship between transition cost and inventory cost. However, the
practical solutions from product wheels need additional insight, because of the existence of
minimum run lengths due to economic or technical constraints and maximum run lengths
due to shelf life limits, freshness requirements, or expiration dates (Gabriela 2011).
3.3 Safety stock
In addition to the product created every run, called cycle stock, there is a level of
inventory called safety stock that exists to mitigate the risk of stock outs due to
uncertainties in manufacturing supply and customer demand. A recent article in APICS
summarizes the business relevance, “Determining appropriate inventory levels is one of the
most important and most challenging tasks faced by operations managers. If you carry too
10
much inventory, you tie up money in working capital; if you don’t carry enough
inventories, you face stock outs” (King 2011). In addition, products which are stored too
long can spoil or expire, while too little safety stock can result in lost sales.
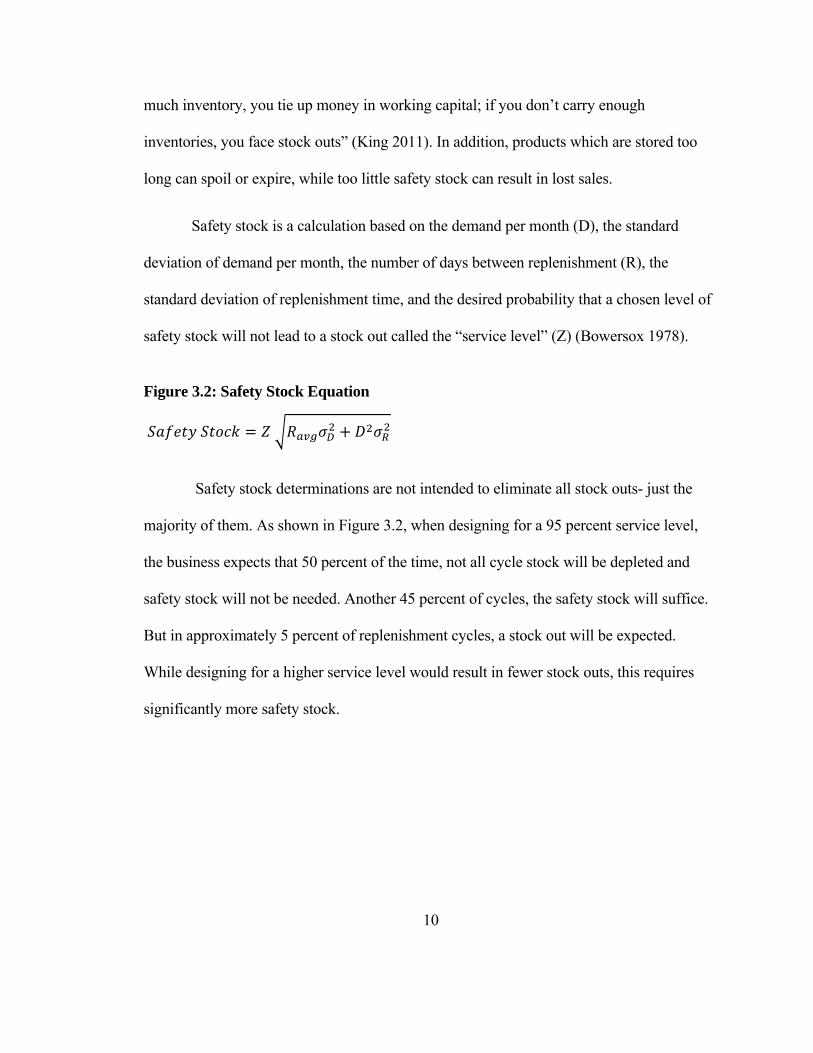
Safety stock is a calculation based on the demand per month (D), the standard
deviation of demand per month, the number of days between replenishment (R), the
standard deviation of replenishment time, and the desired probability that a chosen level of
safety stock will not lead to a stock out called the “service level” (Z) (Bowersox 1978).
Figure 3.2: Safety Stock Equation
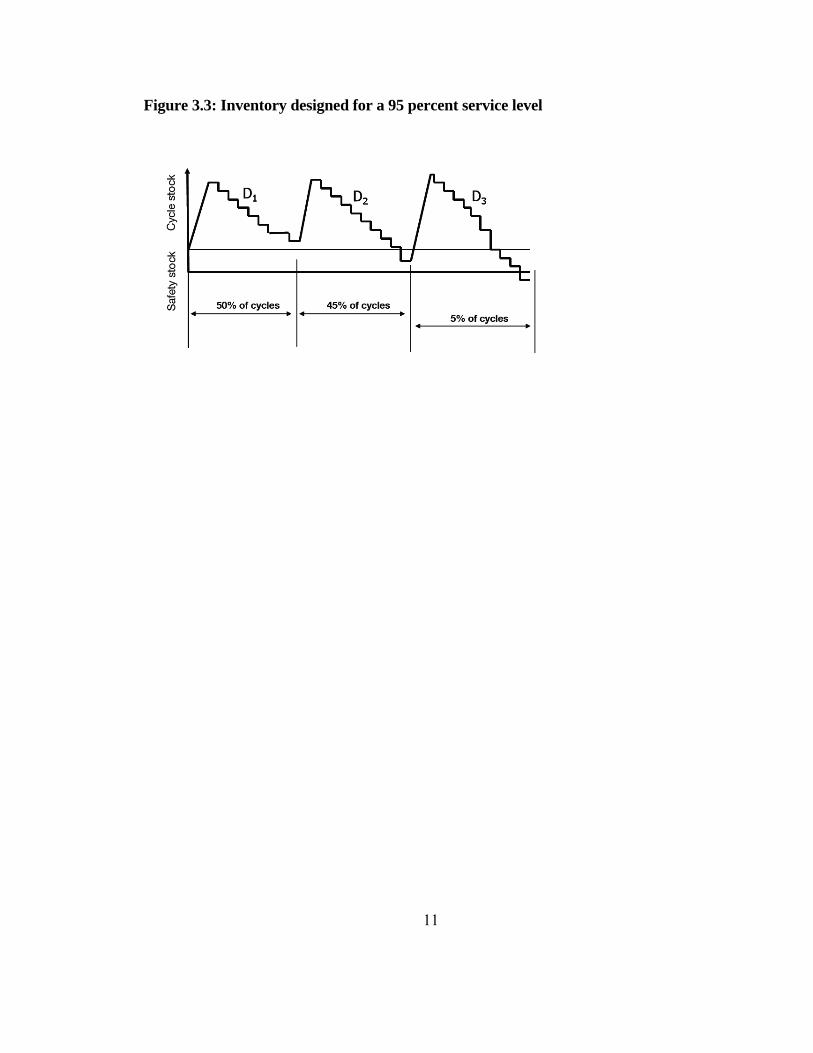
Safety stock determinations are not intended to eliminate all stock outs- just the
majority of them. As shown in Figure 3.2, when designing for a 95 percent service level,
the business expects that 50 percent of the time, not all cycle stock will be depleted and
safety stock will not be needed. Another 45 percent of cycles, the safety stock will suffice.
But in approximately 5 percent of replenishment cycles, a stock out will be expected.
While designing for a higher service level would result in fewer stock outs, this requires
significantly more safety stock.
11
Figure 3.3: Inventory designed for a 95 percent service level
12
CHAPTER IV: METHODS
4.1 Developing a Trial Product Wheel
After reviewing relevant theory, it is hypothesized that creating a product wheel and
optimizing production run lengths provides a viable option to reduce plant operation costs,
and satisfy customer service requirements. Given the complexity of the business unit i.e.
number of plant SKU’s, production lines, and changing demand requirements, it is
necessary to verify the optimal solution by running a trial model and analyzing the impacts
on one of the highest margin at-capacity lines. The cup line packs ranch and buffalo sauces
into dipping cups for large fast food chains. In the past six months, the cup line has run 1-2
days of overtime each week, eliminating the line’s profitability. Although this line only
runs 15 SKU’s, it accounts for 5% of the business units profit and holds over 20% market
share in the industry with committed volume growth in the next 2-3 years. Creating an
effective sample model requires a thorough outline of business constraints. This will
facilitate creating a template, using the cup line as an example, which fosters easy
expansion to include the business’s remaining 20+ production lines and thousands of
additional SKU’s.
4.2 Outlining Business Constraints
The first step in developing the model requires a deep understanding of the
constraints the solution must meet in order for it to be successful. In this research there
are business constraints on ship shelf life, warehousing, and customer service that have
consequences regarding production scheduling.
13
4.2.1 Ship Shelf Life Constraint
Dressings and sauces need to be consumed within a certain amount of time or the
product spoils and is not fit for human consumption. Product shelf life is different for each
DSO SKU. The customer establishes how much of that time is available for DSO to hold
each product before it needs to arrive at its distribution center, this is called the “ship shelf
life”. Total shelf life ≥ ship shelf life + time spent at distribution center + time spent before
used at local store. For the cup line products, ship shelf life varies between 40 to 90 days.
A draft model presented to DSO addressed the ship shelf life constraint; however,
the product wheel rotations utilized the full ship shelf life allowed for each product. The
Scheduling Department is accountable for any product expirations. The departmental
thinking is that an aggressive approach towards ship- shelf will lead to an increase in
expirations and a negative personal performance review. This concern led to a rejection of
the draft proposal. After several working sessions and analyzing the effects of various
utilization levels, the schedulers agreed to review a solution that uses up to 60% of the
customer mandated ship shelf life. This will be addressed by creating product wheels based
on 60% of ship-shelf life instead of creating product wheels constrained by ship shelf life.
As the teams get more comfortable with the idea, there is room to work with the forecasting
department to optimize this figure.
4.2.2 Customer Service Level Constraint
In an effort to distinguish DSO in the industry as a supplier of choice, there was a
business directive that stated DSO must have 100 percent order fill rates no matter the cost.
This is especially challenging for the Scheduling Department given the high demand
14
variability in the past 6 months. The current MTO process exists because customer demand
swings have rendered forecasting unusable, and the company has negotiated 14 day lead
times that allow a reasonable schedule to be assembled to meet anticipated demand. The
Scheduling Department is hesitant to utilize a make to stock production plan that depends
on forecast because forecast errors are costly and reflect poorly on scheduler performance.
If forecast is 10% lower than expected, and the plant had produced to that forecast, some
product could expire. If orders are 10% higher than expected, the product may stock out
which could cause customer turnover. This issue will be addressed by determining safety
stock using a 99% customer service level to cover moderate demand or supply changes.
4.2.3 Warehousing Constraint
Finding the balance in safety stock is important due to the costs of holding a large
amount of inventory purely for emergency situations. The large size of the orders and
number of SKU’s produced limits the responsiveness to short term changes in customer
demand. Currently, the warehouse can hold about 15,000 pallet spots, and but only 5% or
750 pallet spots are allocated for the cup line. At the moment very little safety stock is
carried as the facility operates as MTO, any changes to current operations would have to be
fully analyzed to ensure stocks are not expiring, the warehouse is not over capacity, and
that personnel are following FIFO procedures. In September 2014, a warehouse
expansion to 25,000 pallet spots will be operational and will help alleviate the capacity
constraint.
15
4.3 Collecting Data
With the objective outlined and the constraints established, next comes the
challenge of collecting the accurate data necessary to build a functioning sample model.
The first step is collecting data on each product including: historical daily demand, setup
costs including labor shrink testing and opportunity costs, contribution margin, allergens,
changeover parameters, and storage cost. This information is in the Advanced Scheduling
module of Adage 3.0.1 and within the institutional knowledge of personnel in different
departments including warehousing, quality, product development, and operations.
4.4 Creating the Model
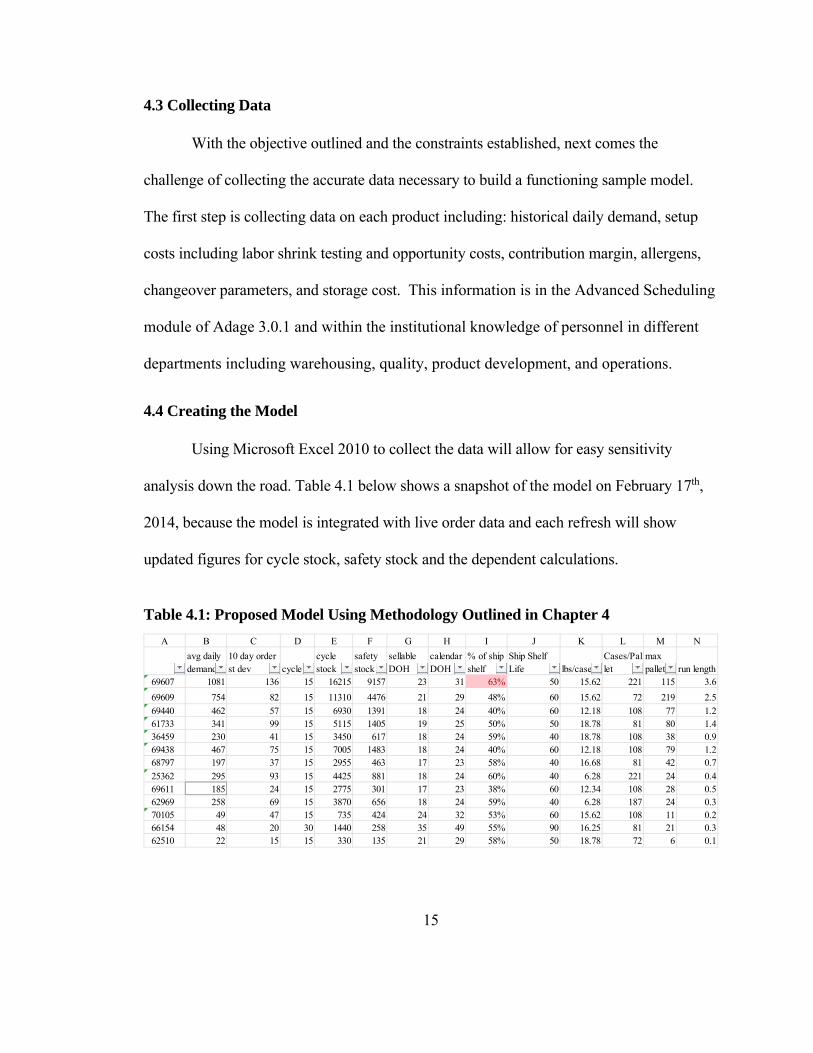
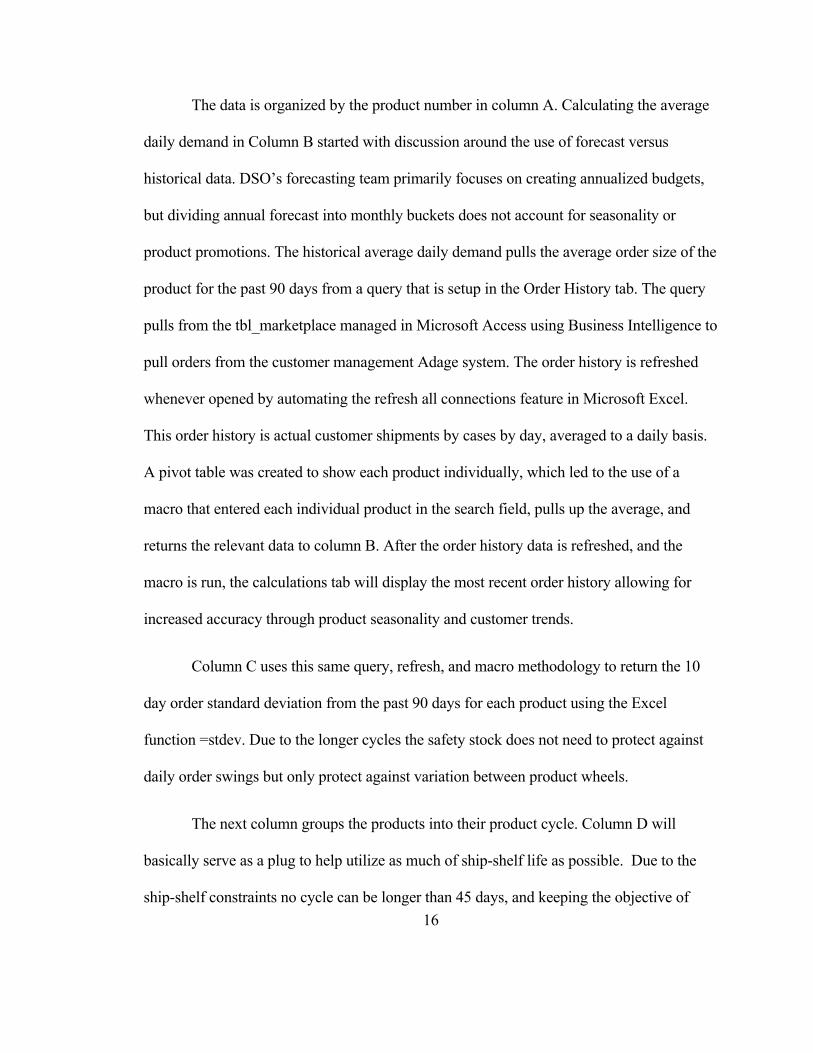
Using Microsoft Excel 2010 to collect the data will allow for easy sensitivity
analysis down the road. Table 4.1 below shows a snapshot of the model on February 17th,
2014, because the model is integrated with live order data and each refresh will show
updated figures for cycle stock, safety stock and the dependent calculations.
Table 4.1: Proposed Model Using Methodology Outlined in Chapter 4
A B C D E F G H I J K L M N
avg daily demand
10 day order st dev cycle
cycle stock
safety stock
sellable DOH
calendar DOH
% of ship shelf
Ship Shelf Life lbs/case
Cases/Pallet
max pallets run length
69607 1081 136 15 16215 9157 23 31 63% 50 15.62 221 115 3.6
69609 754 82 15 11310 4476 21 29 48% 60 15.62 72 219 2.5
69440 462 57 15 6930 1391 18 24 40% 60 12.18 108 77 1.261733 341 99 15 5115 1405 19 25 50% 50 18.78 81 80 1.436459 230 41 15 3450 617 18 24 59% 40 18.78 108 38 0.969438 467 75 15 7005 1483 18 24 40% 60 12.18 108 79 1.268797 197 37 15 2955 463 17 23 58% 40 16.68 81 42 0.7
25362 295 93 15 4425 881 18 24 60% 40 6.28 221 24 0.469611 185 24 15 2775 301 17 23 38% 60 12.34 108 28 0.562969 258 69 15 3870 656 18 24 59% 40 6.28 187 24 0.370105 49 47 15 735 424 24 32 53% 60 15.62 108 11 0.266154 48 20 30 1440 258 35 49 55% 90 16.25 81 21 0.362510 22 15 15 330 135 21 29 58% 50 18.78 72 6 0.1
16
The data is organized by the product number in column A. Calculating the average
daily demand in Column B started with discussion around the use of forecast versus
historical data. DSO’s forecasting team primarily focuses on creating annualized budgets,
but dividing annual forecast into monthly buckets does not account for seasonality or
product promotions. The historical average daily demand pulls the average order size of the
product for the past 90 days from a query that is setup in the Order History tab. The query
pulls from the tbl_marketplace managed in Microsoft Access using Business Intelligence to
pull orders from the customer management Adage system. The order history is refreshed
whenever opened by automating the refresh all connections feature in Microsoft Excel.
This order history is actual customer shipments by cases by day, averaged to a daily basis.
A pivot table was created to show each product individually, which led to the use of a
macro that entered each individual product in the search field, pulls up the average, and
returns the relevant data to column B. After the order history data is refreshed, and the
macro is run, the calculations tab will display the most recent order history allowing for
increased accuracy through product seasonality and customer trends.
Column C uses this same query, refresh, and macro methodology to return the 10
day order standard deviation from the past 90 days for each product using the Excel
function =stdev. Due to the longer cycles the safety stock does not need to protect against
daily order swings but only protect against variation between product wheels.
The next column groups the products into their product cycle. Column D will
basically serve as a plug to help utilize as much of ship-shelf life as possible. Due to the
ship-shelf constraints no cycle can be longer than 45 days, and keeping the objective of
17
expanding run lengths should avoid cycles shorter than 10 days. The next calculation in
column E takes the days in the cycle multiplied by the average daily demand to calculate
the cycle stock necessary to produce each product wheel rotation.
Safety stock calculated in column F utilizes the equation outlined in the theory
section applied in Microsoft Excel as the Normative inverse of customer service level *
SQRT((# of day between cycles *order st dev^2)+ (cycle time st dev ^2 * avg order size
^2)) = NORM.S.INV(.99) *SQRT((D*C^2)+(N^2*B^2).
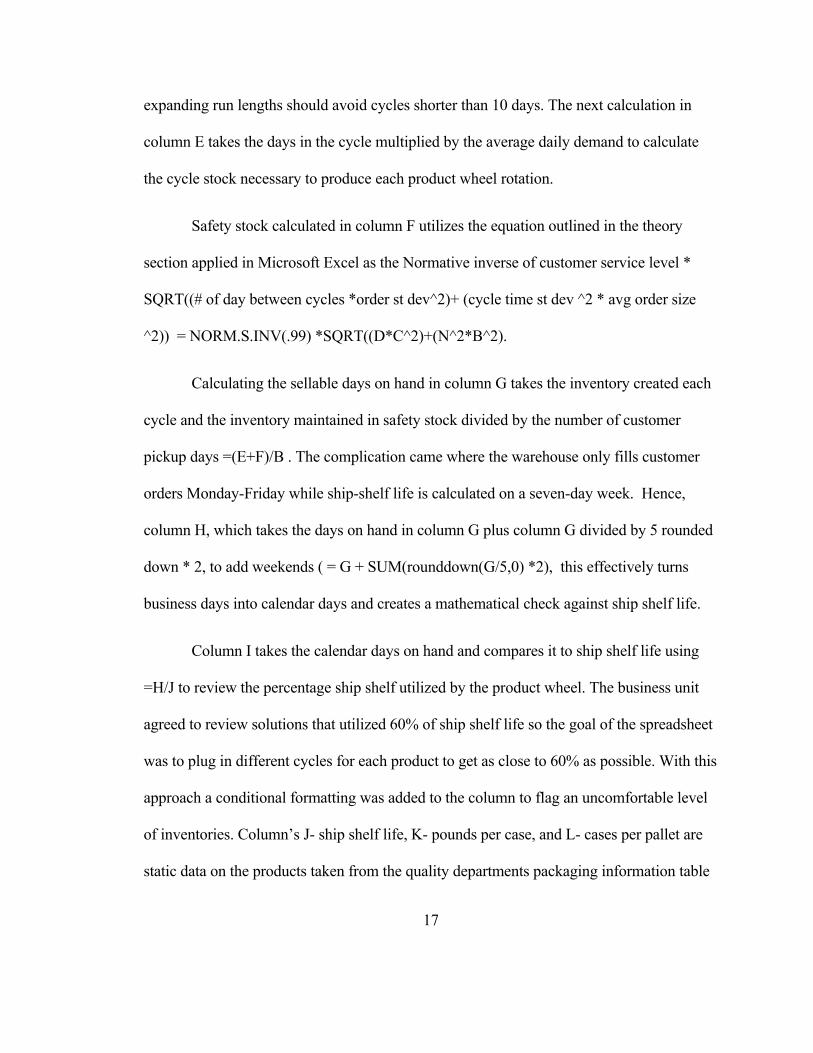
Calculating the sellable days on hand in column G takes the inventory created each
cycle and the inventory maintained in safety stock divided by the number of customer
pickup days =(E+F)/B . The complication came where the warehouse only fills customer
orders Monday-Friday while ship-shelf life is calculated on a seven-day week. Hence,
column H, which takes the days on hand in column G plus column G divided by 5 rounded
down * 2, to add weekends ( = G + SUM(rounddown(G/5,0) *2), this effectively turns
business days into calendar days and creates a mathematical check against ship shelf life.
Column I takes the calendar days on hand and compares it to ship shelf life using
=H/J to review the percentage ship shelf utilized by the product wheel. The business unit
agreed to review solutions that utilized 60% of ship shelf life so the goal of the spreadsheet
was to plug in different cycles for each product to get as close to 60% as possible. With this
approach a conditional formatting was added to the column to flag an uncomfortable level
of inventories. Column’s J- ship shelf life, K- pounds per case, and L- cases per pallet are
static data on the products taken from the quality departments packaging information table
18
within Adage. Although infrequent- the schedulers will need to be alerted of any changes
within their products as this is not directly linked to a table but manually updated.
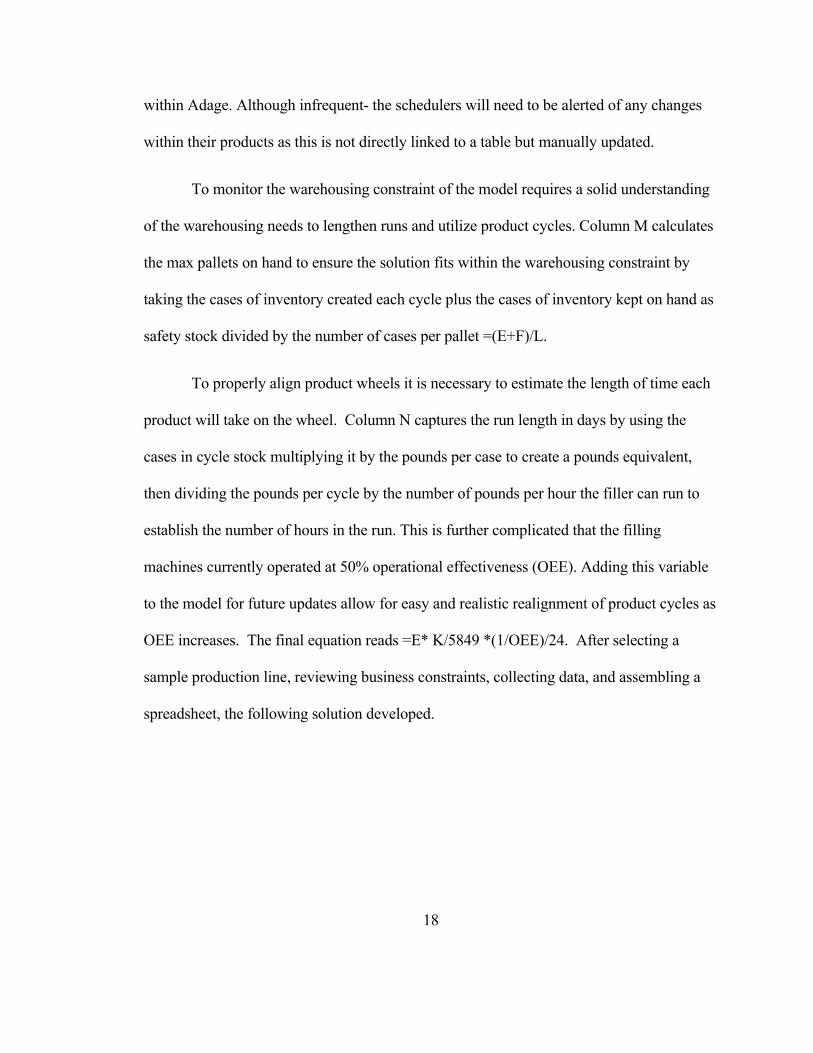
To monitor the warehousing constraint of the model requires a solid understanding
of the warehousing needs to lengthen runs and utilize product cycles. Column M calculates
the max pallets on hand to ensure the solution fits within the warehousing constraint by
taking the cases of inventory created each cycle plus the cases of inventory kept on hand as
safety stock divided by the number of cases per pallet =(E+F)/L.
To properly align product wheels it is necessary to estimate the length of time each
product will take on the wheel. Column N captures the run length in days by using the
cases in cycle stock multiplying it by the pounds per case to create a pounds equivalent,
then dividing the pounds per cycle by the number of pounds per hour the filler can run to
establish the number of hours in the run. This is further complicated that the filling
machines currently operated at 50% operational effectiveness (OEE). Adding this variable
to the model for future updates allow for easy and realistic realignment of product cycles as
OEE increases. The final equation reads =E* K/5849 *(1/OEE)/24. After selecting a
sample production line, reviewing business constraints, collecting data, and assembling a
spreadsheet, the following solution developed.
19
CHAPTER V: ANALYSIS & RESULTS
This chapter will compare the proposed sample model to current conditions and
provide an analysis to determine economic implications, make adjustments for practical
application, and outline how this process could be implemented throughout the business.
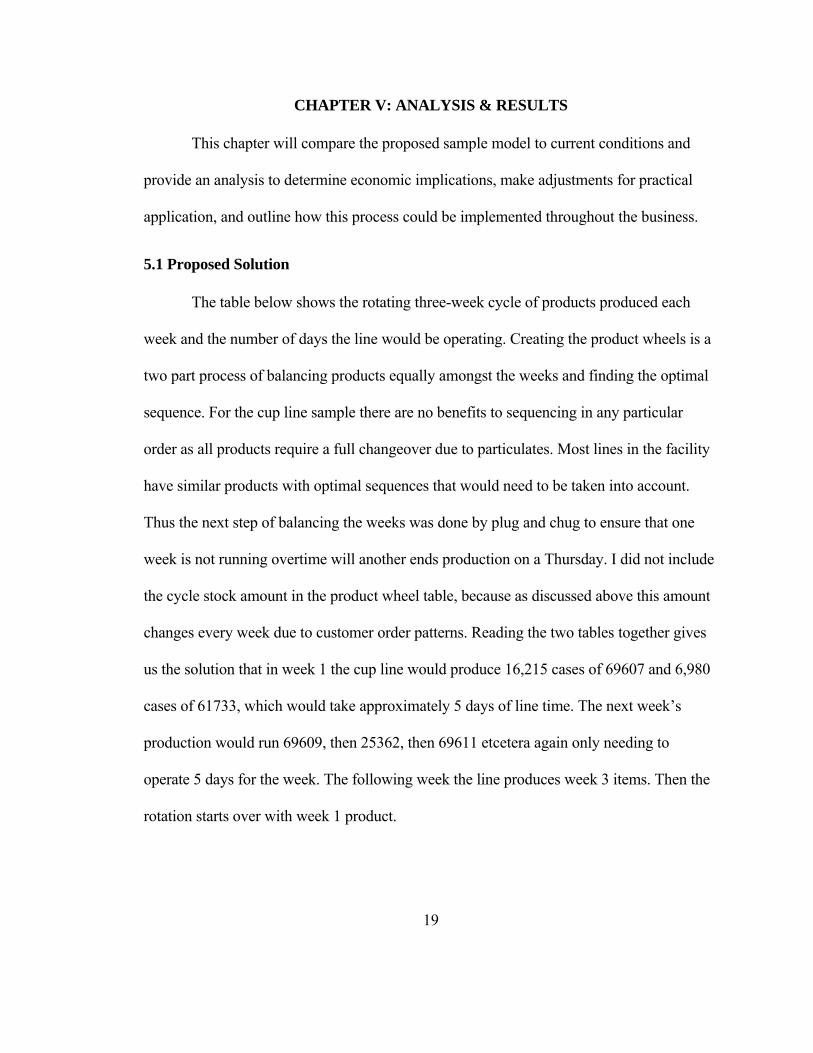
5.1 Proposed Solution
The table below shows the rotating three-week cycle of products produced each
week and the number of days the line would be operating. Creating the product wheels is a
two part process of balancing products equally amongst the weeks and finding the optimal
sequence. For the cup line sample there are no benefits to sequencing in any particular
order as all products require a full changeover due to particulates. Most lines in the facility
have similar products with optimal sequences that would need to be taken into account.
Thus the next step of balancing the weeks was done by plug and chug to ensure that one
week is not running overtime will another ends production on a Thursday. I did not include
the cycle stock amount in the product wheel table, because as discussed above this amount
changes every week due to customer order patterns. Reading the two tables together gives
us the solution that in week 1 the cup line would produce 16,215 cases of 69607 and 6,980
cases of 61733, which would take approximately 5 days of line time. The next week’s
production would run 69609, then 25362, then 69611 etcetera again only needing to
operate 5 days for the week. The following week the line produces week 3 items. Then the
rotation starts over with week 1 product.
20
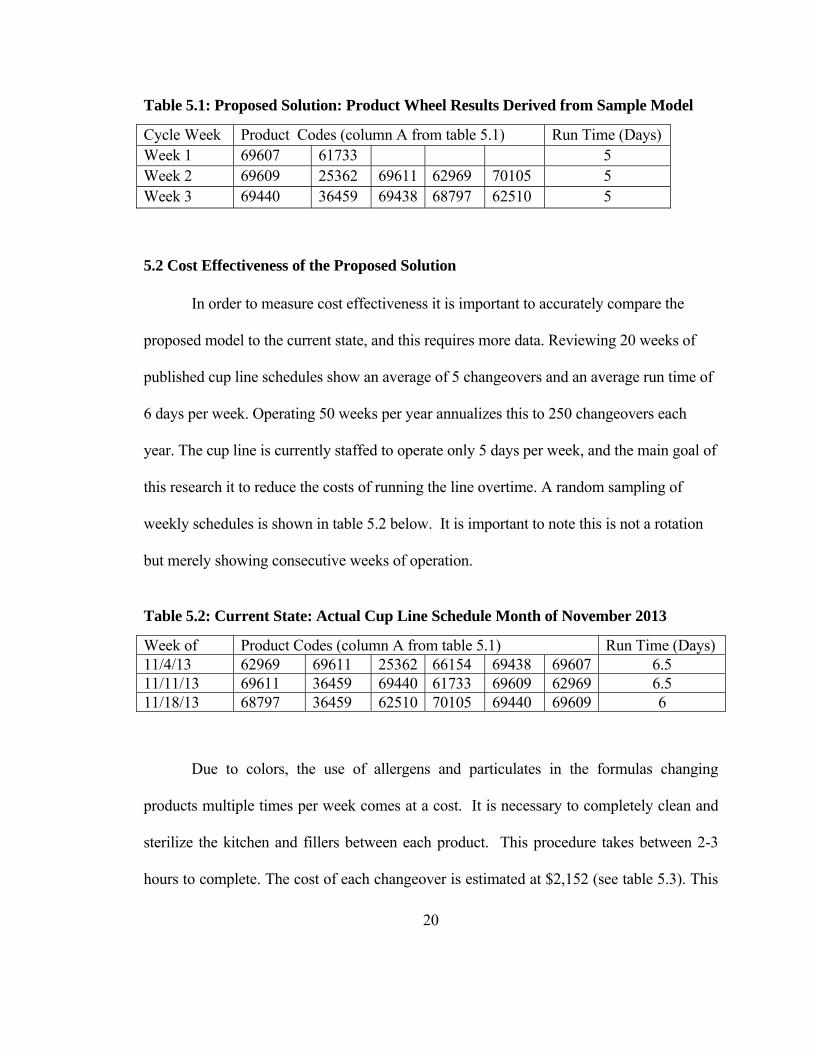
Table 5.1: Proposed Solution: Product Wheel Results Derived from Sample Model
Cycle Week Product Codes (column A from table 5.1) Run Time (Days) Week 1 69607 61733 5 Week 2 69609 25362 69611 62969 70105 5 Week 3 69440 36459 69438 68797 62510 5
5.2 Cost Effectiveness of the Proposed Solution
In order to measure cost effectiveness it is important to accurately compare the
proposed model to the current state, and this requires more data. Reviewing 20 weeks of
published cup line schedules show an average of 5 changeovers and an average run time of
6 days per week. Operating 50 weeks per year annualizes this to 250 changeovers each
year. The cup line is currently staffed to operate only 5 days per week, and the main goal of
this research it to reduce the costs of running the line overtime. A random sampling of
weekly schedules is shown in table 5.2 below. It is important to note this is not a rotation
but merely showing consecutive weeks of operation.
Table 5.2: Current State: Actual Cup Line Schedule Month of November 2013
Week of Product Codes (column A from table 5.1) Run Time (Days) 11/4/13 62969 69611 25362 66154 69438 69607 6.5 11/11/13 69611 36459 69440 61733 69609 62969 6.5 11/18/13 68797 36459 62510 70105 69440 69609 6
Due to colors, the use of allergens and particulates in the formulas changing
products multiple times per week comes at a cost. It is necessary to completely clean and
sterilize the kitchen and fillers between each product. This procedure takes between 2-3
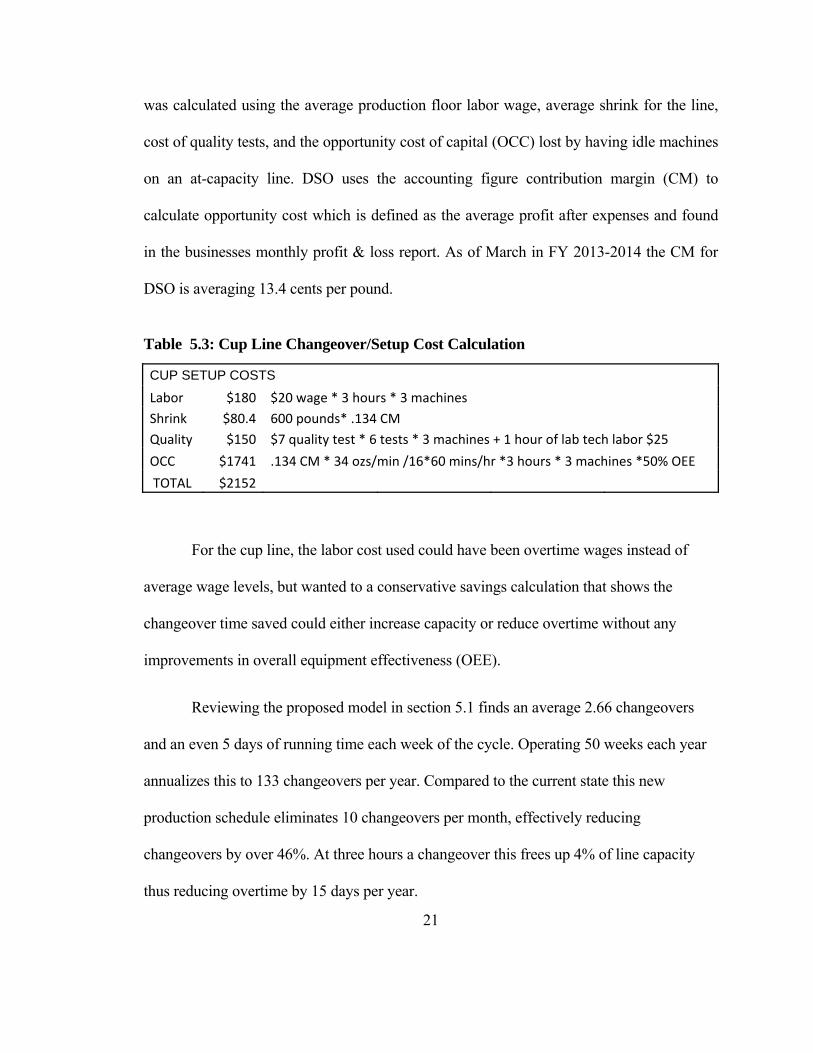
hours to complete. The cost of each changeover is estimated at $2,152 (see table 5.3). This
21
was calculated using the average production floor labor wage, average shrink for the line,
cost of quality tests, and the opportunity cost of capital (OCC) lost by having idle machines
on an at-capacity line. DSO uses the accounting figure contribution margin (CM) to
calculate opportunity cost which is defined as the average profit after expenses and found
in the businesses monthly profit & loss report. As of March in FY 2013-2014 the CM for
DSO is averaging 13.4 cents per pound.
Table 5.3: Cup Line Changeover/Setup Cost Calculation
CUP SETUP COSTS
Labor $180 $20 wage * 3 hours * 3 machines
Shrink $80.4 600 pounds* .134 CM
Quality $150 $7 quality test * 6 tests * 3 machines + 1 hour of lab tech labor $25
OCC $1741 .134 CM * 34 ozs/min /16*60 mins/hr *3 hours * 3 machines *50% OEE
TOTAL $2152
For the cup line, the labor cost used could have been overtime wages instead of
average wage levels, but wanted to a conservative savings calculation that shows the
changeover time saved could either increase capacity or reduce overtime without any
improvements in overall equipment effectiveness (OEE).
Reviewing the proposed model in section 5.1 finds an average 2.66 changeovers
and an even 5 days of running time each week of the cycle. Operating 50 weeks each year
annualizes this to 133 changeovers per year. Compared to the current state this new
production schedule eliminates 10 changeovers per month, effectively reducing
changeovers by over 46%. At three hours a changeover this frees up 4% of line capacity
thus reducing overtime by 15 days per year.
22
As detailed in the theory section lengthening production runs requires a right sizing
of inventories and as seen in the model this solution does comes with a warehousing
expense due to increased safety stock and cycle stock. According to the location warehouse
manager, the cost of holding 1 pallet in storage is estimated at $637.60 per year. This
includes all relevant costs for incremental storage including pallet movement, and truck
transportation cost. Given the current 750 pallets positions reserved for the cup line, only,
the cost of 15 incremental pallet spaces should be included in the comparison.
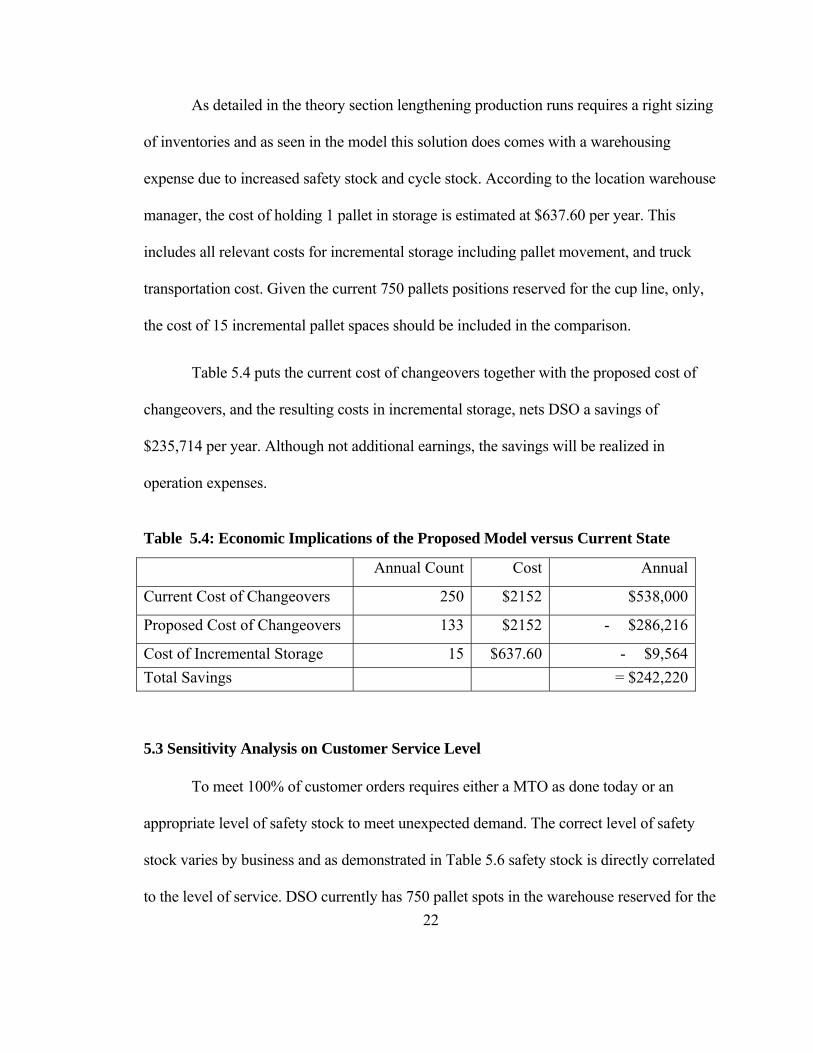
Table 5.4 puts the current cost of changeovers together with the proposed cost of
changeovers, and the resulting costs in incremental storage, nets DSO a savings of
$235,714 per year. Although not additional earnings, the savings will be realized in
operation expenses.
Table 5.4: Economic Implications of the Proposed Model versus Current State
Annual Count Cost Annual
Current Cost of Changeovers 250 $2152 $538,000
Proposed Cost of Changeovers 133 $2152 - $286,216
Cost of Incremental Storage 15 $637.60 - $9,564
Total Savings = $242,220
5.3 Sensitivity Analysis on Customer Service Level
To meet 100% of customer orders requires either a MTO as done today or an
appropriate level of safety stock to meet unexpected demand. The correct level of safety
stock varies by business and as demonstrated in Table 5.6 safety stock is directly correlated
to the level of service. DSO currently has 750 pallet spots in the warehouse reserved for the
23
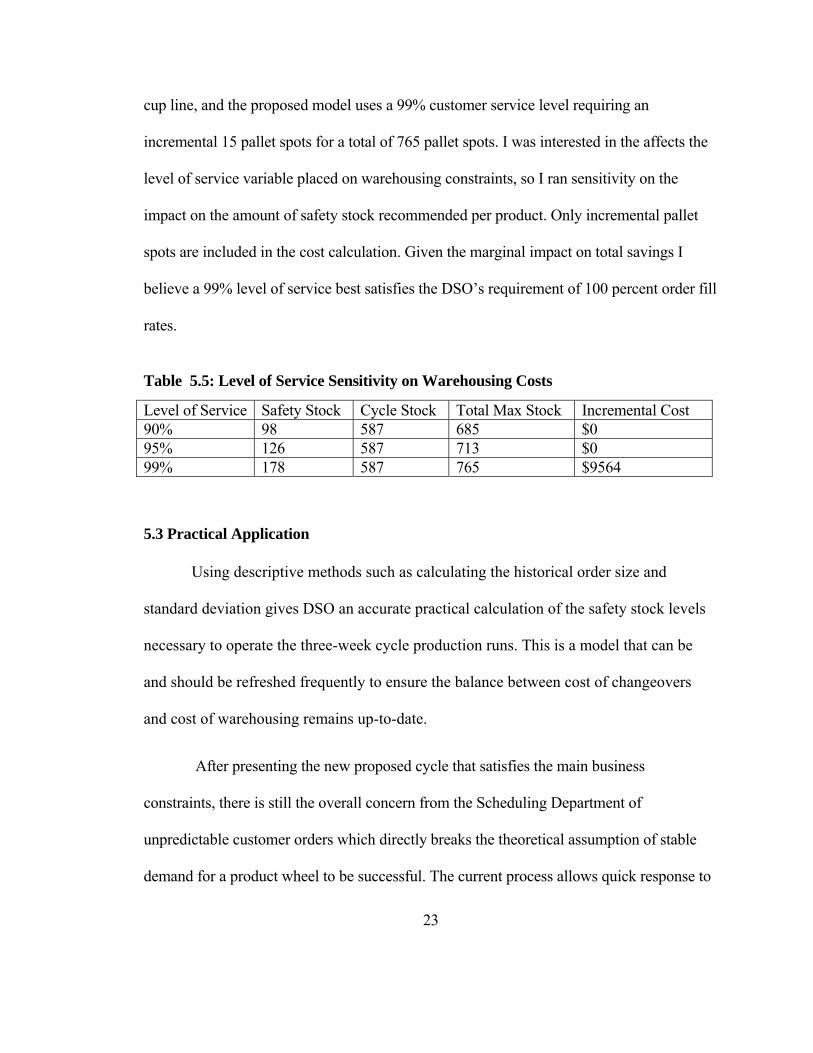
cup line, and the proposed model uses a 99% customer service level requiring an
incremental 15 pallet spots for a total of 765 pallet spots. I was interested in the affects the
level of service variable placed on warehousing constraints, so I ran sensitivity on the
impact on the amount of safety stock recommended per product. Only incremental pallet
spots are included in the cost calculation. Given the marginal impact on total savings I
believe a 99% level of service best satisfies the DSO’s requirement of 100 percent order fill
rates.
Table 5.5: Level of Service Sensitivity on Warehousing Costs
Level of Service Safety Stock Cycle Stock Total Max Stock Incremental Cost 90% 98 587 685 $0 95% 126 587 713 $0 99% 178 587 765 $9564
5.3 Practical Application
Using descriptive methods such as calculating the historical order size and
standard deviation gives DSO an accurate practical calculation of the safety stock levels
necessary to operate the three-week cycle production runs. This is a model that can be
and should be refreshed frequently to ensure the balance between cost of changeovers
and cost of warehousing remains up-to-date.
After presenting the new proposed cycle that satisfies the main business
constraints, there is still the overall concern from the Scheduling Department of
unpredictable customer orders which directly breaks the theoretical assumption of stable
demand for a product wheel to be successful. The current process allows quick response to
24
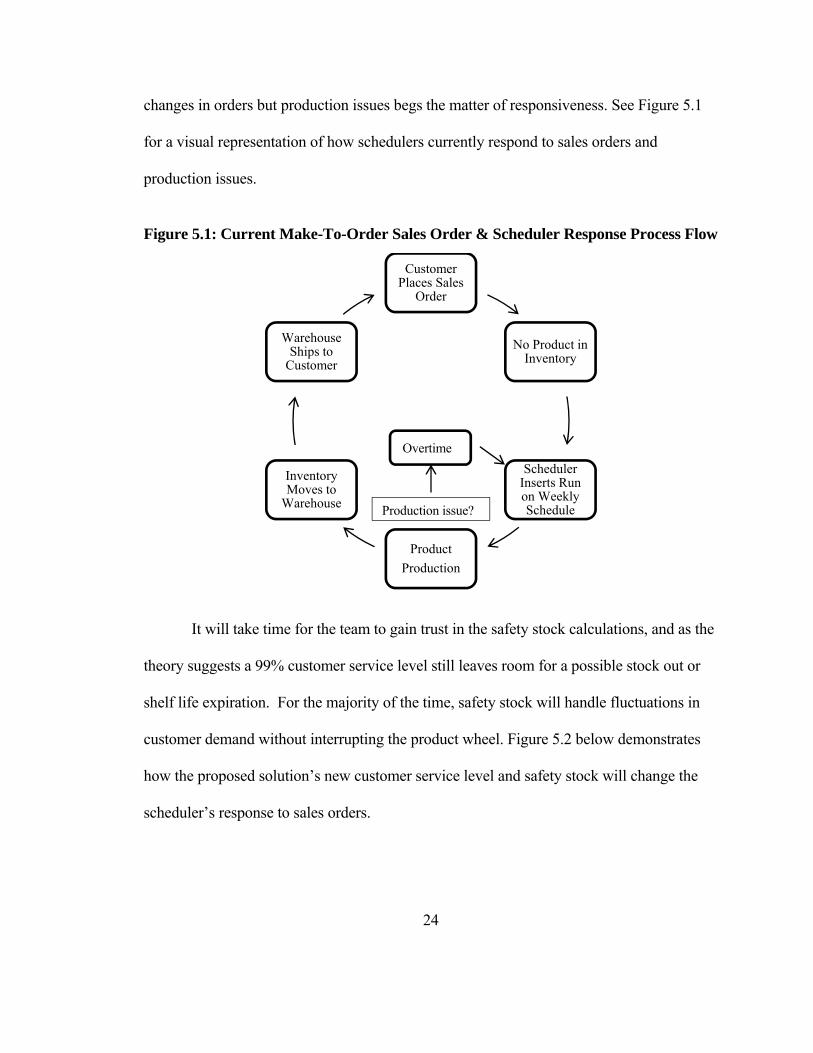
changes in orders but production issues begs the matter of responsiveness. See Figure 5.1
for a visual representation of how schedulers currently respond to sales orders and
production issues.
Figure 5.1: Current Make-To-Order Sales Order & Scheduler Response Process Flow
It will take time for the team to gain trust in the safety stock calculations, and as the
theory suggests a 99% customer service level still leaves room for a possible stock out or
shelf life expiration. For the majority of the time, safety stock will handle fluctuations in
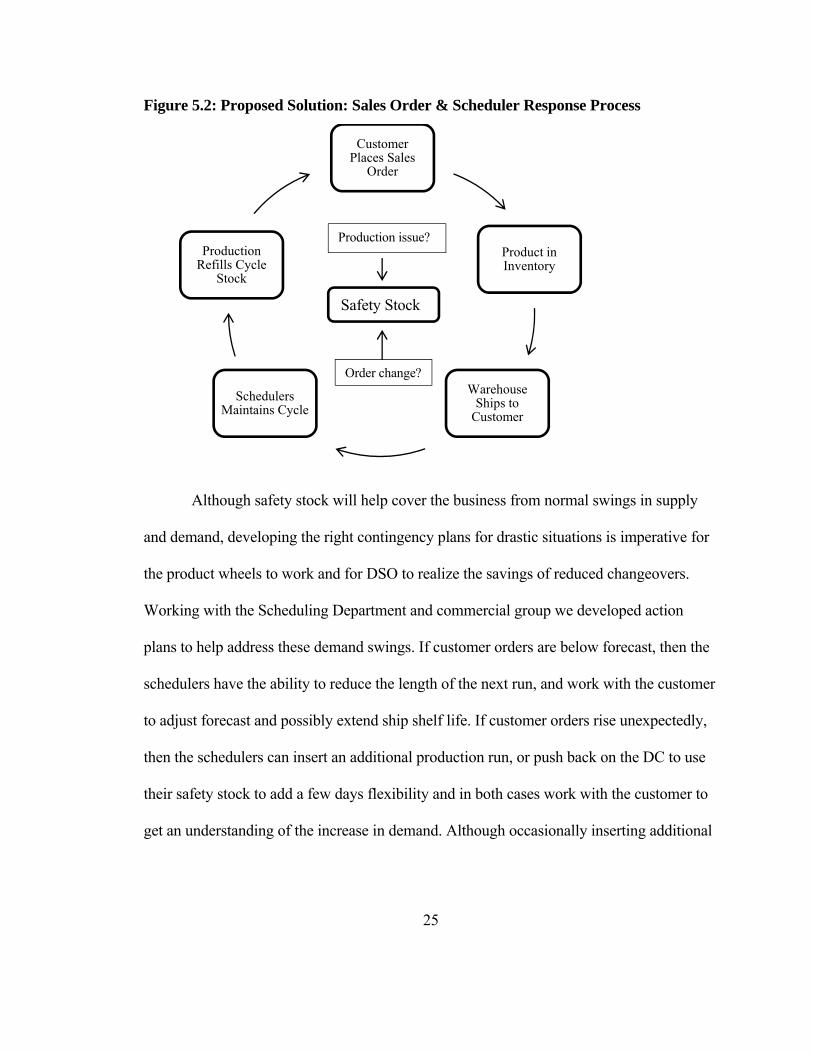
customer demand without interrupting the product wheel. Figure 5.2 below demonstrates
how the proposed solution’s new customer service level and safety stock will change the
scheduler’s response to sales orders.
Customer Places Sales
Order
No Product in Inventory
Scheduler Inserts Run on Weekly Schedule
Product
Production
Inventory Moves to
Warehouse
Warehouse Ships to
Customer
Overtime
Production issue?
25
Figure 5.2: Proposed Solution: Sales Order & Scheduler Response Process
Although safety stock will help cover the business from normal swings in supply
and demand, developing the right contingency plans for drastic situations is imperative for
the product wheels to work and for DSO to realize the savings of reduced changeovers.
Working with the Scheduling Department and commercial group we developed action
plans to help address these demand swings. If customer orders are below forecast, then the
schedulers have the ability to reduce the length of the next run, and work with the customer
to adjust forecast and possibly extend ship shelf life. If customer orders rise unexpectedly,
then the schedulers can insert an additional production run, or push back on the DC to use
their safety stock to add a few days flexibility and in both cases work with the customer to
get an understanding of the increase in demand. Although occasionally inserting additional
Customer Places Sales
Order
Product in Inventory
Warehouse Ships to
Customer
Schedulers Maintains Cycle
Production Refills Cycle
Stock
Order change?
Safety Stock
Production issue?
26
production run reduces potential savings, it is still better to implement the plan to capture
the efficiencies and have a backup for worst case scenarios.
5.3 Lessons Learned from Trial Product Wheel
The business chose to move forward with a trial implementation during a slower
demand season which allowed them to efficiently build up inventories to cycle stock
levels. Due to the stock build up the increase in capacity was not truly felt for 8 weeks,
but shortly thereafter production returned to an average 5 days per week with only
marginal overtime. The good news is that the product wheels were successful in
increasing capacity; the bad news is that the business has already filled this with new
products and has returned to 6.5 days per week operation.
The implementation of this plan required a significant change in process and
demanded extensive teamwork from individuals in each department. There was resistance
from several employees, due to a non-understanding of the reasoning behind the changes.
Going forward it is essential to stress the reasoning and importance of making these
changes as they will reduce the extensive overtime that DSO faces allowing production
employees more time to spend with their families and help DSO meet operational and
financial goals.
27
CHAPTER VI: CONCLUSION
6.1 Final Recommendations
This paper proves that a three-week product wheel will help DSO increase capacity
on the cup line while staying within customer service, shelf life and warehouse constraints.
The proposed product wheel is a marked improvement over existing MTO production
plans and will reduce overtime expenses associated with changeovers.
Given the cost effectiveness outlined in section 5.2, I recommend that DSO run the
same model on the remaining production lines in the business. Before declaring product
wheels a blanket solution to the businesses problems, DSO should review order history for
products with unusual order variability and smaller volume products that may need to stay
on a MTO system. Overall though, expanding the model and finding the ideal production
cycle for each product line will ensure effective product wheels and accurate safety stock
calculations. Warehousing constraints will become more of a factor as more production
lines come on board, increasing safety and cycle stocks such that warehouse capacity is
exceeded.
6.2 Further Research
It is generally understood that reducing overtime has a positive impact on safety
and employee engagement, but these benefits fell outside the scope of this research. If DSO
needs more evidence of the benefits of product wheels a few areas to expand upon include:
employee engagement, safety metrics, line efficiencies due to longer runs, and other
financial benefits regarding reduced employee turnover.
28
A second suggestion for future research include maximizing profit by optimizing
the amount of shelf life are used in the product wheels incorporating the risk of stock outs
versus expirations. The 60% negotiated with the business currently makes sense in the
short term, but an optimal solution could be discovered as the company gets more
comfortable with the idea of product wheels.
This research also serves as discussion point between the commercial team and the
customers. As the business transitions to Make-to-Stock production there could be some
adjustments in customer lead time policy, giving the customer a long amount of time to
place orders as long as order patterns remain consistent. This give and take demonstrates
the partner of choice relationship that Cargill aims to achieve.
6.3 Final Thoughts
Product wheels are an established concept in the manufacturing industry, and
although the theory is widely taught in operations courses around the world, the actual
implementation of the theory is much harder to realize. The additional complication of
ship-shelf life might lead managers towards other capacity projects, but the exercise of
balancing warehousing costs with the cost of changeovers for is good understanding for
any business. Over the past 20 years there has been a focus on increasing efficiencies and
designing responsive processes. The idea of lean operations with less inventory and more
responsive processes revolutionized production plans across the globe, but fewer
inventories isn’t cost efficient when there are large swings in demand, and more recently
finding the compromise between customer responsiveness and inventory time has gained
focus.
29
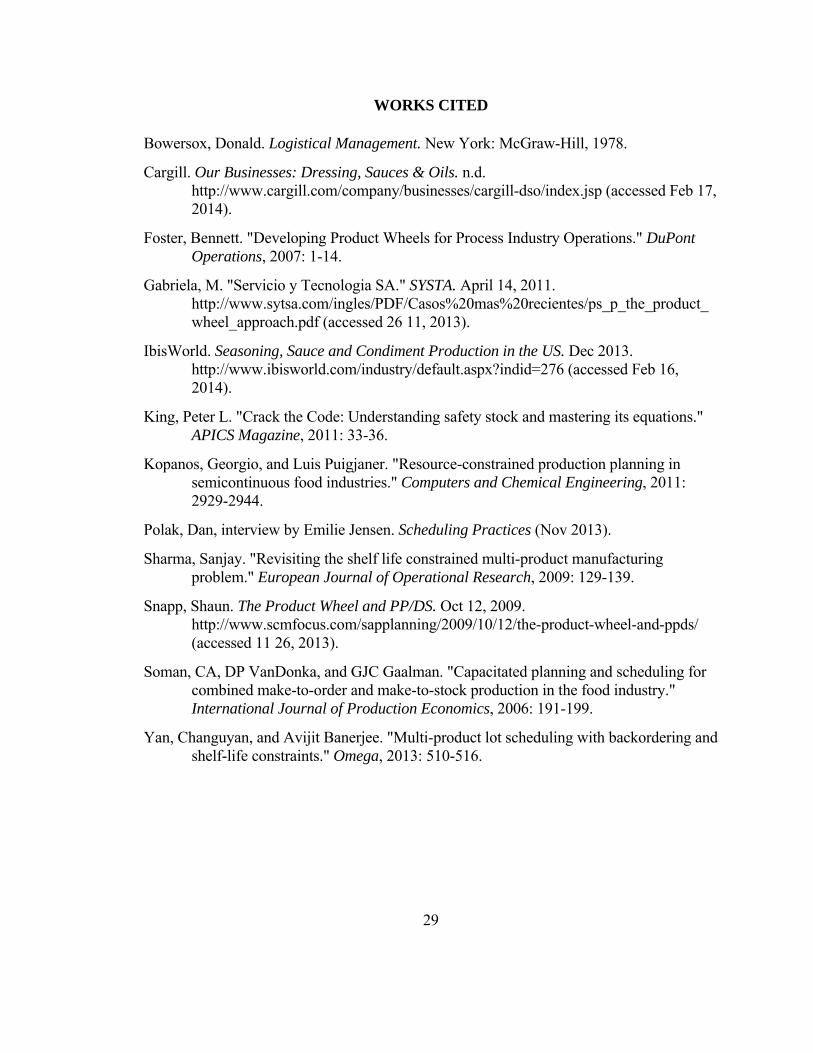
WORKS CITED
Bowersox, Donald. Logistical Management. New York: McGraw-Hill, 1978.
Cargill. Our Businesses: Dressing, Sauces & Oils. n.d. http://www.cargill.com/company/businesses/cargill-dso/index.jsp (accessed Feb 17, 2014).
Foster, Bennett. "Developing Product Wheels for Process Industry Operations." DuPont Operations, 2007: 1-14.
Gabriela, M. "Servicio y Tecnologia SA." SYSTA. April 14, 2011. http://www.sytsa.com/ingles/PDF/Casos%20mas%20recientes/ps_p_the_product_wheel_approach.pdf (accessed 26 11, 2013).
IbisWorld. Seasoning, Sauce and Condiment Production in the US. Dec 2013. http://www.ibisworld.com/industry/default.aspx?indid=276 (accessed Feb 16, 2014).
King, Peter L. "Crack the Code: Understanding safety stock and mastering its equations." APICS Magazine, 2011: 33-36.
Kopanos, Georgio, and Luis Puigjaner. "Resource-constrained production planning in semicontinuous food industries." Computers and Chemical Engineering, 2011: 2929-2944.
Polak, Dan, interview by Emilie Jensen. Scheduling Practices (Nov 2013).
Sharma, Sanjay. "Revisiting the shelf life constrained multi-product manufacturing problem." European Journal of Operational Research, 2009: 129-139.
Snapp, Shaun. The Product Wheel and PP/DS. Oct 12, 2009. http://www.scmfocus.com/sapplanning/2009/10/12/the-product-wheel-and-ppds/ (accessed 11 26, 2013).
Soman, CA, DP VanDonka, and GJC Gaalman. "Capacitated planning and scheduling for combined make-to-order and make-to-stock production in the food industry." International Journal of Production Economics, 2006: 191-199.
Yan, Changuyan, and Avijit Banerjee. "Multi-product lot scheduling with backordering and shelf-life constraints." Omega, 2013: 510-516.