Embed Size (px)
Citation preview
BIS Papers No 102
45
Measuring corporate bond liquidity in emerging market economies: price- vs quantity-based measures
By Allaudeen Hameed†, Jean Helwege‡, Ran Li§ and Frank Packer**
Abstract
Prior research suggests that corporate bond issuance in emerging market economies increases when the markets exhibit substantial liquidity. While the Malaysian corporate bond market has grown dramatically over the last few decades, having now become one of the largest among emerging market economies, its liquidity has not progressed at a similar pace. Illiquidity may hamper access to local currency debt financing, so its measurement is an important topic for regulators and issuers. We investigate the liquidity of corporate bonds in Malaysia and find that quantity-based measures of liquidity appear more reliable than price-based measures. Low liquidity appears to characterise both conventional and Islamic corporate bonds in Malaysia.
JEL classification: G12, G20, G15JEL classification: G12, G20, G15
Keywords: corporate bonds, bond liquidity, Islamic and conventional bonds, Malaysia
† National University of Singapore.
‡ University of California, Riverside.
§ World Bank.
** Bank for International Settlements.
This paper draws partially on a paper written for the Bank of Korea-BIS Conference on “Asia-Pacific fixed income markets: evolving structure, participation and pricing” on 19–20 Nov 2018. The authors would like to thank Amanda Liu for her invaluable assistance. The authors also wish to thank the Central Bank of Malaysia and Bursa Malaysia for helping to make the data available for the purposes of this research project, though the authors have sole responsibility for the quality of the analysis and conclusions reached. The views expressed in the paper are those of the authors and not necessarily those of the Bank for International Settlements, the National University of Singapore, or the World Bank.
46
BIS Papers No 102
1. Introduction
Nearly two decades ago, in the wake of the Asian financial crisis, then Federal Reserve Chairman Greenspan (1999) suggested that by fostering local currency bond markets, governments could develop an alternative to domestic bank lending that would make their financial systems more resilient to external shocks. Many other prominent economists drew similar conclusions, focusing on the related risks of external, foreign currency-denominated debt. Feldstein (1999) noted that banks, companies and governments in emerging market economies (EMEs) often borrow in foreign currency and risk a currency crisis. Kaminsky and Reinhart (2000) cite statistics for Thailand, Indonesia, Korea, Malaysia and the Philippines showing that prior to the Asian financial crisis, a reliance on Japanese bank loans left them exposed to credit outflows once the banks started calling in loans. Since then, the development of the corporate bond market has been continuously emphasised as a policy priority in Asia (eg Asia Development Bank (2015) and the Bank for International Settlements (2006, 2012 and 2016)).
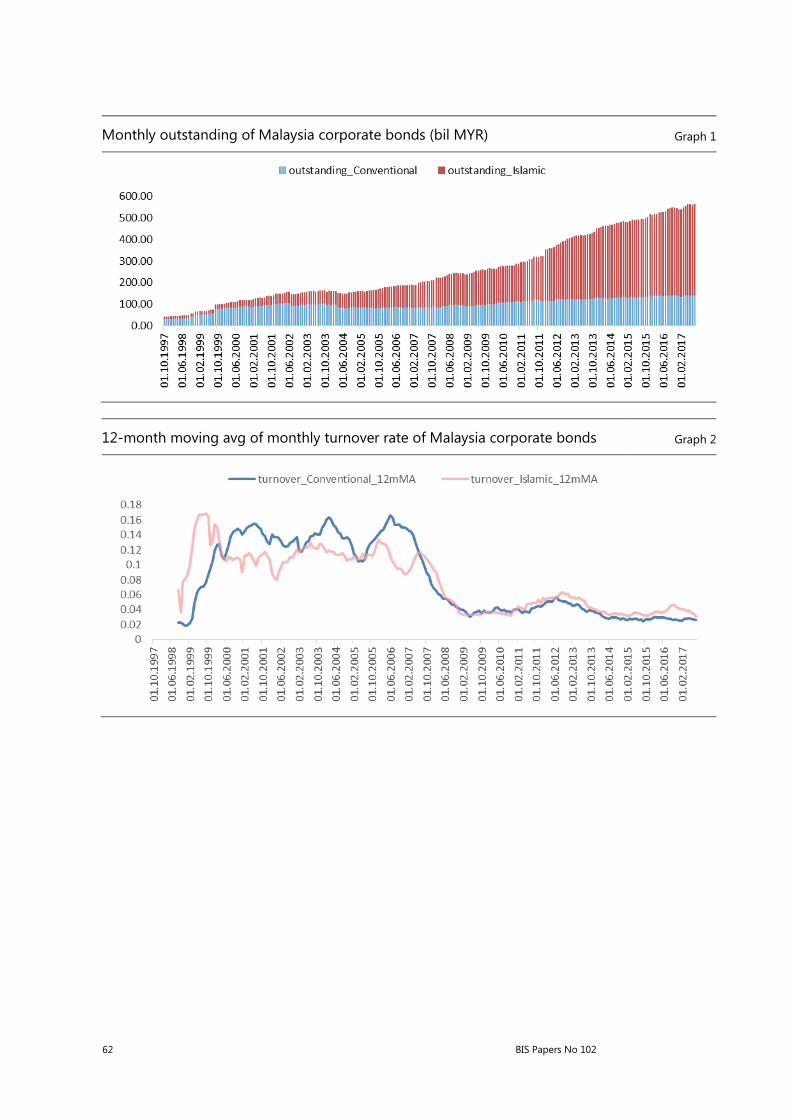
Consistent with these priorities, the size of local currency corporate bond markets has increased in Asia and the Pacific over the past two decades, and not least in the Federation of Malaysia. Corporate bonds outstanding as a proportion of GDP in Malaysia has increased steadily. After rising from 31.7% in 2005 to 37.7% in 2010, corporate bond debt to GDP subsequently grew to 43.8% in 2015. This percentage puts it at second among countries in Asia after Korea, and fairly close to the United States’ percentage of 46% (BIS (2016)). As a percent of GDP, the Malaysian corporate bond market is among the largest local currency bond markets among EMEs. The growth of bonds outstanding is documented in Graph 1, which shows the stock of the total amount outstanding has grown to around 560 billion Malaysian ringgit from around 220 billion in 2008, with Islamic bonds growing the most.1
Nonetheless, Malaysia’s corporate bond market is not large on an absolute basis, certainly not when compared to the markets of much larger economies such as China, Japan and Korea. One possible reason for the smaller size of its corporate bond market, besides the size of its economy, is low liquidity in this market. BIS (2012) provides evidence that Malaysia and other countries involved in the Asian Bond Fund Initiative 2 actively sought to improve the liquidity of their local currency bond markets as a way to promote these markets. Their evidence, however, suggests much greater progress towards increasing the liquidity of the government rather than the corporate bond market, a conclusion that was later reached in a follow-up study of corporate bond market development in Asia (BIS (2016)).
Evidence that corporate bond liquidity in Malaysia has been quite low can be seen in Graph 2, which shows the trend for one measure of liquidity: turnover (the amount of trading volume divided by the amount outstanding). While we will analyse the characteristics of this metric in more detail later at the individual bond level, in aggregate it gives a rough indication of the overall level of liquidity in a market and its trend over time. In Graph 2, we chart this aggregate measure (on a 12-month moving average basis) for both conventional and Islamic bonds. The graph indicates
1 The above numbers are nominal. In real terms, the Conventional (Islamic) corporate bond market
amounts outstanding grew by 29% (145%) between January 2008 and August 2017, and the combined amounts grew by 99% over the same period.
BIS Papers No 102
47
that the liquidity of both conventional and Islamic bonds has declined considerably since around 2006, and turnover has essentially been flat since 2010.
It is possible for a market to have low turnover but still be efficient and have fairly low transaction costs. Thus, the fact that corporate bond trading is sparse in an EME may not pose a high hurdle to the success of that market. In particular, bonds may not trade often but still be liquid in the sense that trades do not exhibit much price impact. Thus, in addition to considering the trading activity of the Malaysian corporate bond market, we also examine price-based measures of liquidity that may indicate greater liquidity.
In this paper, we examine the liquidity of the Malaysian corporate bond market, which we view as informative of large local currency bond markets in EMEs. Our emphasis is on measures of liquidity that are commonly used to describe the ease of transactions in corporate bond markets. Our data are from the Electronic Trading Platform (ETP), which was set up by the government of Malaysia as part of its efforts to improve corporate bond liquidity. The attributes of this database are similar to the US TRACE system.2 This transaction database of Malaysian corporate bond trades allows us to address fundamental questions about liquidity in EMEs.
Our analysis focuses on measures of liquidity that are constructed with data on the quantity of trading activity or with data on transaction prices. The price-based measures are meant to capture the potential for swings in prices that result from upward or downward price pressure arising from trading activity. Hotchkiss and Jostova (2017) show that issue size and age are by far the two most important determinants of liquidity for US corporate bonds. In general, larger bonds are more liquid because they have more investors and lower inventory costs. Bonds become less liquid as they age because less active portfolios (belonging to so-called buy and hold investors) absorb progressively more of the issue. We relate the quantity- and price-based measures of liquidity to age and size to determine which measures are the most reliable indicators of corporate bond liquidity in the emerging market of this study.
We find that all quantity-based measures of liquidity indicate that the Malaysian corporate bond market is illiquid. Most bonds do not trade more than a few times a year, which is significantly below the infrequent trading observed in the US corporate bond market. This leads to very unreliable price-based measures of liquidity, as few bonds have the minimum number of bonds required to calculate price-based measures. The price-based measures as a group are positively correlated with each other, but negatively correlated with metrics based on the quantity of trading activity. We interpret this result as evidence that quantity-based measures of liquidity are likely to be more reliable indicators for EME corporate bonds.
The rest of this paper is organised as follows. In the next section, we review the different measures of liquidity. Section 3 describes the data used. In Section 4, we present the main results from the empirical analysis. Finally, Section 5 concludes and presents some policy implications.
2 For a description of TRACE and its impact on US corporate bond liquidity, see Goldstein, Hotchkiss
and Sirri (2007), Edwards, Harris and Piwowar (2007), Bessembinder, Maxwell and Venkataraman (2006) and Hotchkiss and Jostova (2017).
48
BIS Papers No 102
2. Quantity- vs price-based measures of liquidity
The literature on corporate bonds often measures liquidity by two types of measures: those related to trading activity and those that require corporate bond prices to calculate.3 The quantity-based measures represent the average trading activity in a bond and gauge the intensity of trading in the bond. The higher the trading intensity the higher the liquidity of the bond. The price-based measures aim to capture the price impact and transaction cost dimensions of liquidity. Bonds that have low transactions costs are considered more liquid than other bonds. Bonds with a large price impact present a risk to bond dealers, which in turn leads to high transaction costs. Commonly used measures based on prices include the Amihud (2002) measure of illiquidity, the Roll (1984) measure of serial covariance of prices, and Lambda (Dick-Nielsen, Feldhutter and Lando (2012)).
In order to calculate price-based measures of liquidity, at least two prices are required. If the two prices are from transactions that occurred at two very different times, the return or dispersion that is calculated may reflect changes in the creditworthiness of an issuer rather than the liquidity of the bond. This factor that can distort price-based measures of liquidity is present even in US corporate bonds, which are more liquid than Malaysian corporate bonds. Thus, many measures of liquidity commonly used in the evaluation of liquidity for US stocks cannot be not reliably calculated in the case of corporate bonds. The price-based measures examined in this paper are: (i) the ratio of absolute returns and trading volume, or the Amihud price impact measure; (ii) the volume-weighted variance of traded bond price relative to the volume-weighted average price of the bond, or price dispersion, (iii) the spread in the monthly high and low traded bond prices as a percentage of the average of the two prices; (iv) the same dispersion measure, but calculated daily; and (v) the average realised bid-ask spread.
The quantity-based measures examined in this paper are: (i) the number of trades in a bond per year; (ii) the number of days a bond traded during the year; (iii) the trading for the bond divided by the outstanding amount of the bond, or turnover; (iv) the percentage of days with zero trading or zero returns during the year (the negative, or multiplied by –1), a close relative of the measure suggested by Lesmond, Ogden and Trzcinka (1999);4 and (v) the average number of days since the last trade on the bond, also multiplied by –1.
3 See Helwege and Wang (2018), Han and Zhou (2016), Helwege, Huang and Wang (2014), Houweling,
Mentink, and Vorst (2005) and Schestag, Schuster and Uhirg-Homburg (2016) for studies that use these variables.
4 Corporate bond studies that use these measures of corporate bond liquidity include Alexander, Edwards, and Ferri (2000), Bao Pan and Wang (2011), Bessembinder, Maxwell and Venkataraman (2006), Chakravarty and Sarkar (2003), Chen, Lesmond and Wei (2007), Crabbe and Turner (1995), DeJong and Driessen (2012), Dick-Nielsen, Feldhutter and Lando (2012), Edwards, Harris and Piwowar (2007), Ericsson and Renault (2006), Feldhutter (2012), Friewald, Jankowitsch and Subrhmanyam (2012), Goldstein and Hotchkiss (2007), Goldstein, Hotchkiss and Sirri (2007), Han and Zhou (2016), Helwege, Huang and Wang (2014), Hong and Warga (2000), Hotchkiss and Jostova (2017), Houweling, Mentick and Vorst (2005), Jacoby, Theocharides and Zheng (2009), Kozhanov and Ogden (2012), Lin, Wang and Wu (2011), Mahanti, Nashikkar, Subrahmanyam, Chacko and Mallik (2008), Nashikkar, Subrahmanyam and Mahanti (2011), Newman and Rierson (2004), O’Hara, Wang and Zhou (2015), Perraudin and Taylor (2003) Rossi (2014), and Schestag, Schuster and Uhrig-Homburg (2016).
BIS Papers No 102
49
3. ETP database
The main data at our disposal are transaction data from the Bursa Malaysia’s ETP, which was launched in 1997 as the Bond Information and Dissemination System under the aegis of the Central Bank of Malaysia. Later, in 2008, responsibility for managing and maintaining the platform was transferred to the Bursa Malaysia. Similar to TRACE in the United States, financial institutions (members) are required to report all transactions in the ringgit corporate bond market in Malaysia. We analyse ETP data from 1997 to 2017.
The strengths of this database are manifold. Not only is it, in principle, a comprehensive database that covers all transactions, but it includes the exact amount transacted for all deals. That is, there is no truncation of the ringgit value in cases of very large trades. Between 1997 and mid-2017, there were more than 375,840 transactions in 12,888 securities. The dataset includes numerous details about each transaction, including trade date and time, the face value of the trade, price and counterparty.
There are some limitations to the data set. Bid and offer quotes are not available, as only transaction prices are reported. Thus, while post-trade transparency is, in theory, ensured by ETP, pre-trade transparency is limited, and it does not allow for the estimation of effective spreads.
In addition to an issuer code and name, the ETP reports bond issue, maturity date, the type of instrument (asset-backed securities vs medium-term notes, loan notes, bonds etc), and whether the instrument is Islamic or conventional. The issue amount, the coupon, and the ratings on the instruments from each of Malaysia’s two largest rating agencies, MARC and RAM, are recorded as well. Information about the trade itself includes the trade date and time, the time of the valuation of the bond, the nominal amount, effective price, proceeds of the trade and the estimated yield to maturity.
Buyer and seller information are also available to an extent. The ETP includes an identification code for each, which, while it does not allow an identification of the name of the seller or buyer, allows us to determine cases when the buyer and seller is the same across different trades. Buyer and seller organisation type are also provided, indicating whether the trades involve commercial banks, finance company, investment banks or other investors.
Like the TRACE database, the ETP transaction data must be cleaned (eg Dick-Neilsen (2014)). In some cases, there are negative or zero yields, which we delete from our sample. Only transactions involving bonds are included and any fixed income instrument that is not a bond is deleted (ie if the instrument has a maturity of one year or less, it is not included). Cross-trades are also excluded (ie transactions where dealer A sells a bond to dealer B, and then buys the same bond from dealer B at the same price within a few minutes).
50
BIS Papers No 102
4. Efficacy of liquidity measures
4.1 Summary statistics
We start by generating two sets of bond liquidity measures: quantity- and price-based. The quantity-based measures represent the average trading activity of a bond in a year. Given the low trading activity in Malaysian corporate bonds, all bond-specific liquidity measures are computed on an annual basis. In each year, we generate the five quantity-based measures of liquidity, as reported in Section 2 above: (i) the number of trades per year for bond i in year y, denoted TradeNo; (ii) the number of days bond i traded during year y, TradeDay; (iii) trading volume for bond i in year y divided by the outstanding amount of the bond, Turnover; (iv) the percentage of days with zero trading or zero returns during year y for bond i multiplied by –1, NegZTD; and (v) the average number of days since the last trade on bond i in year y multiplied by –1, NegTradeInt. The first three proxies are increasing in bond liquidity. Since the percentage of zero trading (NegZTD) and the interval between trades (NegTradeInt) reflect illiquidity, these two measures are multiplied by –1 so that all five measures are positively related to liquidity. Finally, we compute an aggregate of all five quantity-based liquidity measures. Each year, all bonds are ranked from highest to lowest based on each liquidity measure and the average rank across all five measures represents the composite quantity-based measure of liquidity for each bond, and is labelled QtyLiq.
We also construct five proxies for price-based liquidity measures for each bond-year as described in Section 2: (i) the Amihud price impact measure for bond i in year y defined as the average ratio of absolute bond return and trading volume, NegAmihud; (ii) the volume-weighted variance of traded bond price relative to the volume-weighted average price of bond i in year y, NegPriceDisp; (iii) the spread in the monthly (daily) high and low traded bond prices during the year (month), as a percentage of the average of the two prices, NegSpdMth (NegSpdDay); and (iv) the average realised bid-ask spread inferred from dealer trades, NegRSpd. We multiply each of these five proxies by –1 to convert them to be positively related to liquidity. Similar to the quantity-based liquidity index, we also construct the average rank of bond i in year y across all five price-based liquidity measures to construct a composite measure, PriceLiq.
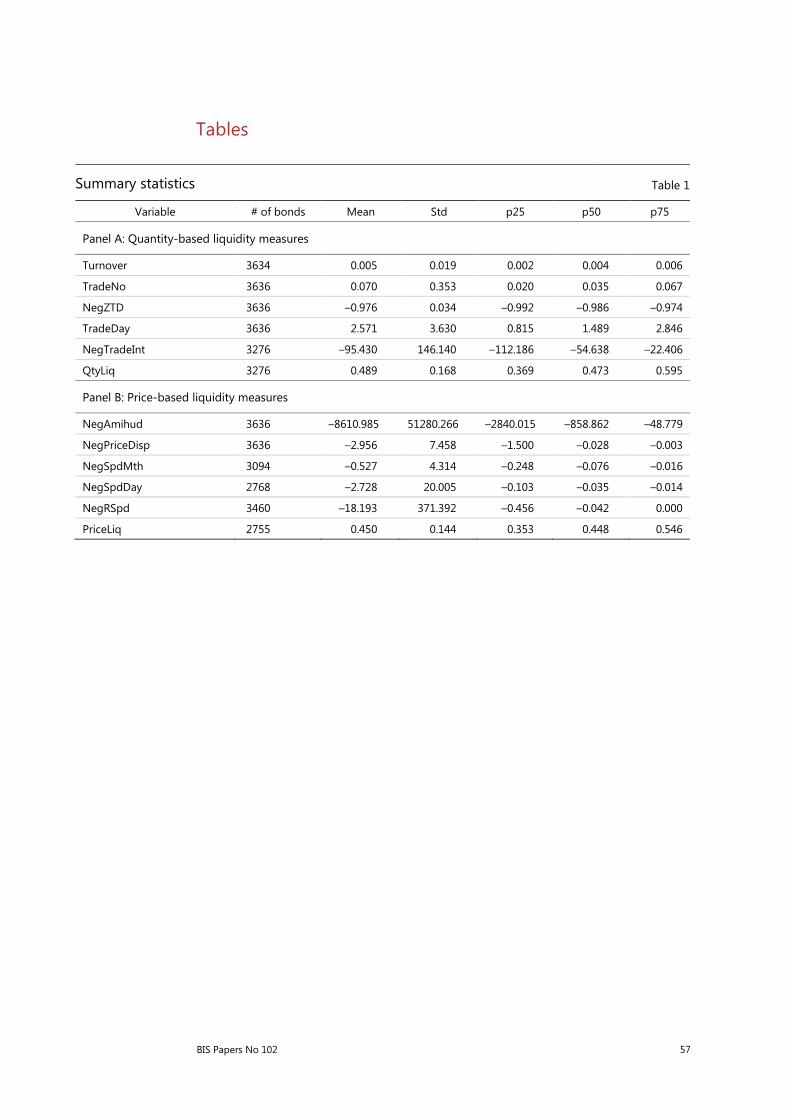
Table 1 presents the distribution of the liquidity measures for all corporate bonds traded on the Malaysian bond market during the sample period. The statistics for the quantity-based measures are presented in Panel A and the price-based measures in Panel B. The average number of bonds varies from 2,755 to 3,636 across the 12 liquidity proxies. The number of bonds with valid NegSpdDay observations is lowest because this measure requires that the bond be traded at least two times in one month during the sample period. As shown in Panel A, the distribution of the data reflects the sparsity of trading in the majority of bonds in the Malaysian market. The average Turnover of bonds is a low 0.5% per year, with the trading volume for the middle 50% of bonds lying between 0.2% and 0.6% of bonds outstanding. The TradeDay measure indicates that a typical (median) bond trades about 1.5 days a year, with the middle 50% of bonds trading between 0.8 days and 2.8 days per year. This is consistent with a low percentage of days during the year on which a bond trades, as indicated by NegZTD and TradeNo. The extremely low trading activity in these bonds is also reflected in the fact that the bonds do not trade for 97.6% of trading
BIS Papers No 102
51
days in a year. The number of days between two trades in a year, NegTradeInt, averages to a large interval of 95 days. Hence, Panel A underscores that the Malaysian corporate bond market is characterised by infrequently traded bonds. The average index of the five quantity-based liquidity measures, QtyLiq, captures the cross-sectional variation in bond liquidity. Here we find that QtyLiq varies across bonds, ranging from 0.37 to 0.60 for the middle 50% of the bonds.
The distribution of the price-based liquidity measures is reported in Panel B of Table 1. The average spread in high and low monthly prices for a bond within a year, NegSpdMth, has a median value of 7.6%, ranging from 1.6% to 24.8% for the middle 50% of bonds. The high-low spread based on daily traded prices within a month (NegSpdDay) is lower, with a range of 1.4% and 10% for the middle 50% of the bonds. Similarly, the realised spread, NegRSpd, for a median bond is 4.2%. The mean values of these spread measures are much higher than their median, suggesting that the distribution is highly skewed. For example, the mean of NegSpdDay (NegRSpd) is 78 (433) times the median value. We observe a similar skewness in the measure of dispersion in traded bond prices, with more than one-half of the bonds exhibiting low price variance. The 75th (25th) percentile of NegPriceDisp is 0.003 (1.5), and the median is 0.028. Chen et al (2018), for example, report that the equivalent price dispersion measures for Malaysian sovereign bonds, which is a more liquid market, have medians of 0.043 and 0.019 for conventional and Islamic sovereign bonds, respectively. These figures suggest that the variation in the prices of the highly illiquid Malaysian corporate bond market appears to be much lower than what we would expect. This is our first indication that price-based liquidity measures may be problematic when the security is rarely traded. The standard deviation of the price-based liquidity proxies in Panel B are substantially higher than those for quantity-based measures in Panel A. While the price-based liquidity measures appear to have a wider distribution of values across bonds, we are interested to know if these measures pick up the cross-sectional differences in corporate bond liquidity. Hence, it is also important to compare the aggregated measures of liquidity across the five proxies, which are standardised based on relative ranks. The aggregate of the relative ranks of all five price-based liquidity measures, PriceLiq, ranges between 0.35 and 0.55 for the middle 50% of bonds, similar to QtyLiq.
4.2 Correlations among quantity- and price-based liquidity measures
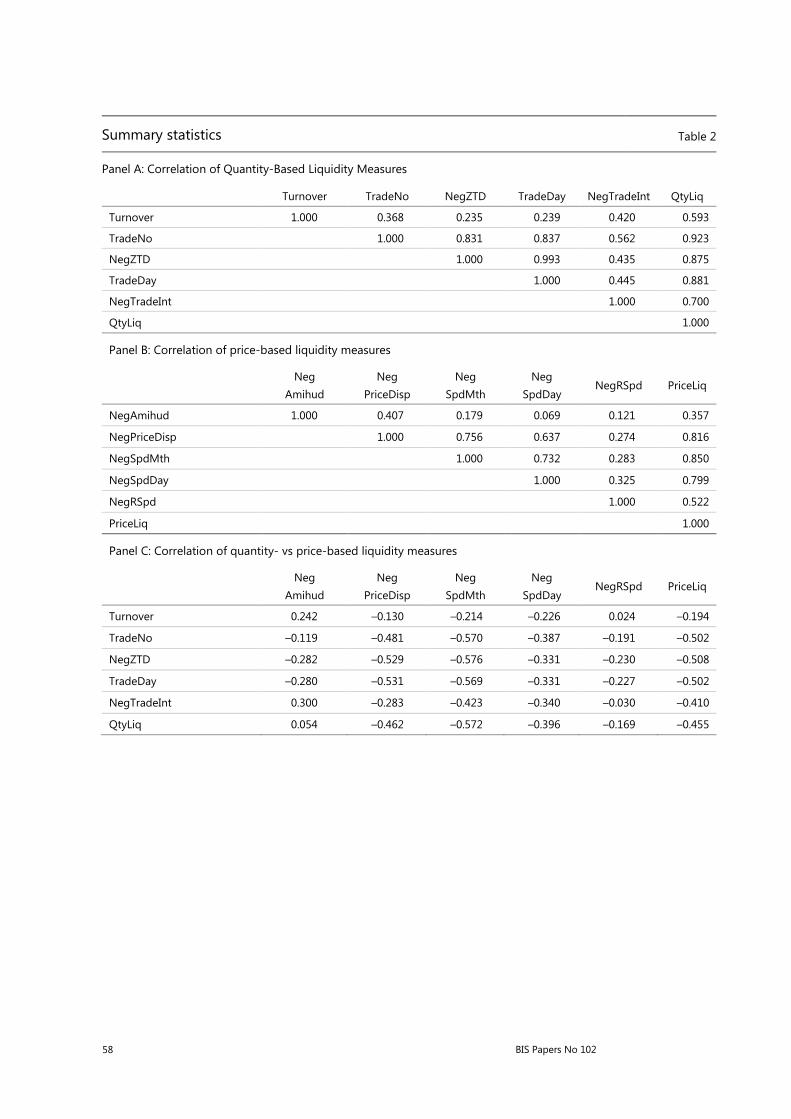
We report the correlation among the different liquidity proxies in Table 2. Since all proxies are increasing in liquidity, we expect the variables to be positively correlated, if they uniformly measure bond liquidity. In Panel A, we present the correlations among the quantity-based liquidity proxies. The five quantity-based liquidity proxies are all positively correlated, with the Spearman rank correlations ranging from 0.24 to 0.99. For example, bond Turnover is higher for bonds that trade more often (TradeDay), and higher for bonds that have a shorter interval between trades (NegTradeInt), resulting in correlations of 0.24 and 0.42, respectively. The index of the five quantity-based liquidity proxies, QtyLiq, is highly correlated with each of the five components, with correlations ranging from 0.59 to 0.92.
The correlations among the five price-based liquidity measures are also positive, ranging from 0.07 to 0.75 as shown in Panel B of Table 2. However, these correlations are generally lower than those among the quantity-based measures. The dispersion in prices, NegPriceDisp, is higher for bonds that have higher high-low spreads in the
52
BIS Papers No 102
transacted prices, NegSpdMth, or exhibit greater price impact, NegAmihud, with correlations of 0.76 and 0.41, respectively. These three proxies have positive, although lower magnitude, correlations with the realised spread measure, NegRSpd. The index of these price-based proxies, PriceLiq, is also positively correlated with the components, with correlation coefficients ranging from 0.36 to 0.85. Hence, within each type of liquidity proxy, the individual proxies are positively correlated.
Interestingly, we do not find evidence that the two classes of bond liquidity proxies are positively correlated with each other. In fact, as shown in Panel C of Table 2, the quantity- and price-based proxies are mostly negatively correlated. In other words, bonds that are more liquid based on the quantity of trading measures are less liquid based on the measures that rely on traded prices. For example, bonds with high dispersion in traded prices, NegPriceDisp, are illiquid based on the price measure but trade more often using any of the five quantity-based measures, with correlations ranging from –0.13 to –0.53. The correlation between NegPriceDisp and QtyLiq is –0.46. Similarly, the bonds with high spreads in monthly high and low prices, NegSpdMth, also trade more often, with a correlation of –0.57 with QtyLiq. The correlation between the composite indices of quantity- and price-based liquidity measures, QtyLiq and PriceLiq, is also negative at –0.46. One explanation for the negative relation is that bonds that do not trade often have less traded price observations and consequently fewer, and lower-quality price-based liquidity estimates. Recall that the median bond trades only 1.5 days and has zero returns in 98.6% of the days in the year. A low variation in traded prices or returns because of extreme non-trading makes it difficult to measure price impact (NegAmihud), dispersion in prices (NegPriceDisp) or proxies using high-low price spread (NegSpdMth, NegSpdDay, NegRSpd). Hence, the price-based measures of liquidity for a majority of these bonds are highly unreliable since these bonds are rarely traded.
4.3 Bond-level regressions
We investigate the efficacy of the quantity- and price-based liquidity measures in a multivariate regression setting. Specifically, we regress each of the bond level liquidity measures on the set of bond characteristics, which take the following form:
𝐿𝐿𝐿𝐿𝐿𝐿𝑖𝑖,𝑦𝑦 = 𝑎𝑎 + 𝑏𝑏1 ∗ 𝑆𝑆𝐿𝐿𝑆𝑆𝑆𝑆𝑖𝑖,𝑦𝑦 + 𝑏𝑏2 ∗ 𝐴𝐴𝐴𝐴𝑆𝑆𝑖𝑖,𝑦𝑦 + 𝑐𝑐 ∗ 𝑅𝑅𝑆𝑆𝑅𝑅𝑎𝑎𝐿𝐿𝑅𝑅 𝑅𝑅𝑎𝑎𝑚𝑚𝑚𝑚𝑚𝑚𝐿𝐿𝑚𝑚𝑚𝑚𝑖𝑖,𝑦𝑦 + 𝜀𝜀𝑖𝑖,𝑦𝑦 (1)
where Liq represents one of the 12 liquidity measures for bond i in year y (including the two composite indexes of the price- and quantity-based measures). The three independent variables in equation (1) correspond to the bond characteristics: Size, measured by the value of the bond outstanding in million Malaysian ringgit, Age, the number of years since the bond was first issued and Remain maturity, the number of years remaining till the bond matures. We hypothesise that bond liquidity, if correctly measured, should be increasing in Size and decreasing in Age. Helwege and Wang (2018), for example, show that larger bonds tend to be more liquid.
Long maturity bonds may be actively traded when recently issued (on-the-run bonds) and decline in liquidity as the bond gets older. This is consistent with the common observation that buy and hold investors buy the bonds as a long-term investment until maturity and do not trade in the interim period. However, bonds of varying maturity are issued and this can confound the effect of Age on bond liquidity. Consequently, we also control for the effect of Remain maturity of the bond in the regression. The key parameters of interest are b1 and b2. If the liquidity proxies measure liquidity, we expect b1 to be positive and b2 to be negative. The panel
BIS Papers No 102
53
regression model in (1) is estimated with and without year fixed effects (we report those without year fixed effects) and the robust standard errors are clustered by time to account for cross-sectional correlation of the residuals.
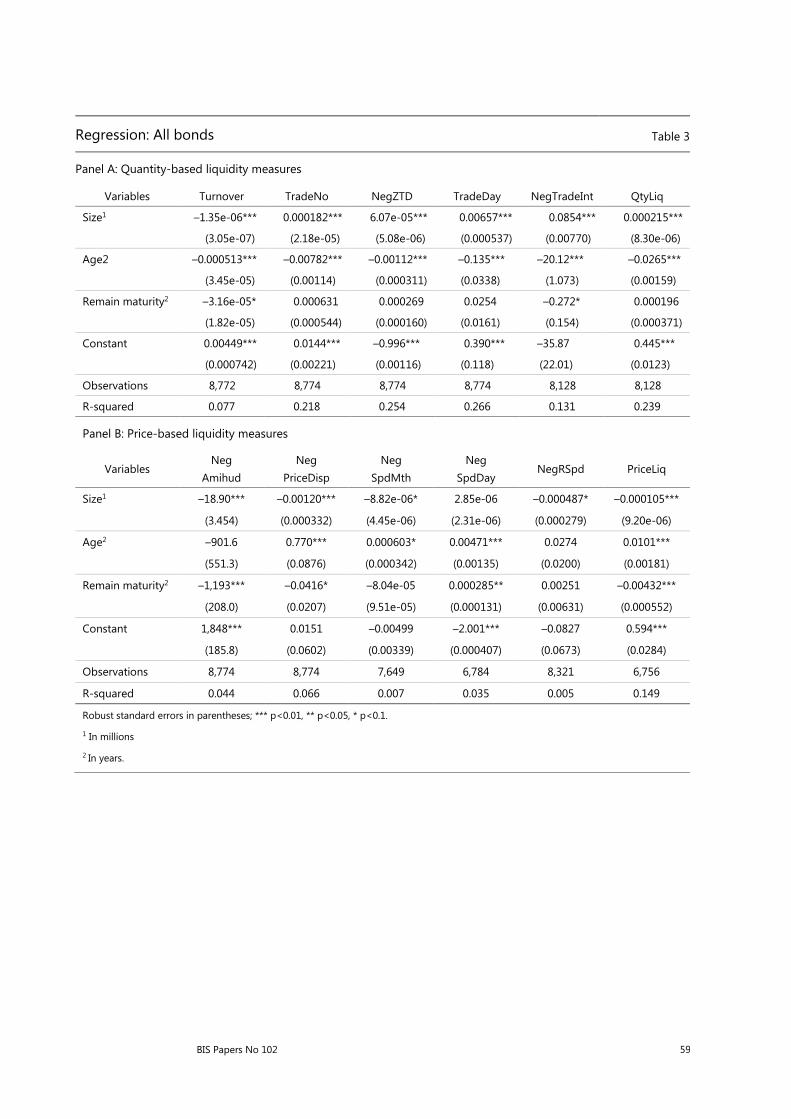
The estimates for equation (1) are reported in Table 3. In Panel A of Table 3, we present the regression results for the quantity-based liquidity measures. We find that bigger bonds are significantly positively related to liquidity for all the quantity-based liquidity measures, except for Turnover, which has the wrong sign. Bonds that are traded more often (high TradeNo, TradeDay), have a low percentage of days with zero returns or zero trades (NegZTD) or have a short interval between trades (NegTradeInt) tend to bigger bonds, consistent with these bonds being more liquid. The composite index of the five liquidity proxies, QtyLiq, is also positively related to Size. Consistent with being proxies of liquidity, all five quantity-based liquidity proxies and the composite of these proxies are significantly negatively related to Age. Controlling for the remaining maturity of the bonds, older bonds are less liquid according to all of the quantity-based liquidity proxies.
Panel B of Table 3 presents the estimates of equation (1) when we use the price-based liquidity proxies. The estimate of b1 is significantly negative for three of the price-based liquidity proxies, NegPriceDisp, NegSpdMth, NegRSpd. The only exception is NegAmihud, which is positively related to Size. The composite index, PriceLiq, is significantly negatively related to Size. The negative relation between the price-based liquidity proxies is inconsistent with these proxies measuring liquidity of the bonds. This is not surprising given the negative correlation between the price- and quantity-based liquidity proxies we observed in Table 3. Moreover, the relation between Age and liquidity is also generally of the wrong sign, as older bonds appear to be more liquid in these regressions. Bonds with low dispersion in traded prices (NegPriceDisp) and low spread between their monthly high and low traded prices during the year (eg NegSpdMth) are more likely to be bonds that do not trade often and hence are more illiquid rather than liquid. PriceLiq is significantly lower for bigger bonds and significantly higher for older bonds, inconsistent with PriceLiq being a reliable proxy for bond liquidity.
Table 3 also reports the regression R-squares for each of the liquidity proxies. We find that the goodness of fit for the quantity-based proxies is above that found for the price-based proxies. For example, across the five quantity-based proxies in Panel A, the regression R-square ranges from 7.7% (Turnover) to 26.6% (TradeDay). The regression R-squares are uniformly higher than those for the price-based proxies, which range from 0.5% (NegRSpd) to 6.6% (NegPriceDisp). Additionally, the QtyLiq regression R-square is higher at 23.9% compared to 14.9% for PriceLiq. Taken together, the results in Table 3 confirm that the quantity-based proxies for liquidity in the Malaysian corporate bond market measure liquidity reliably while the price-based proxies do not.
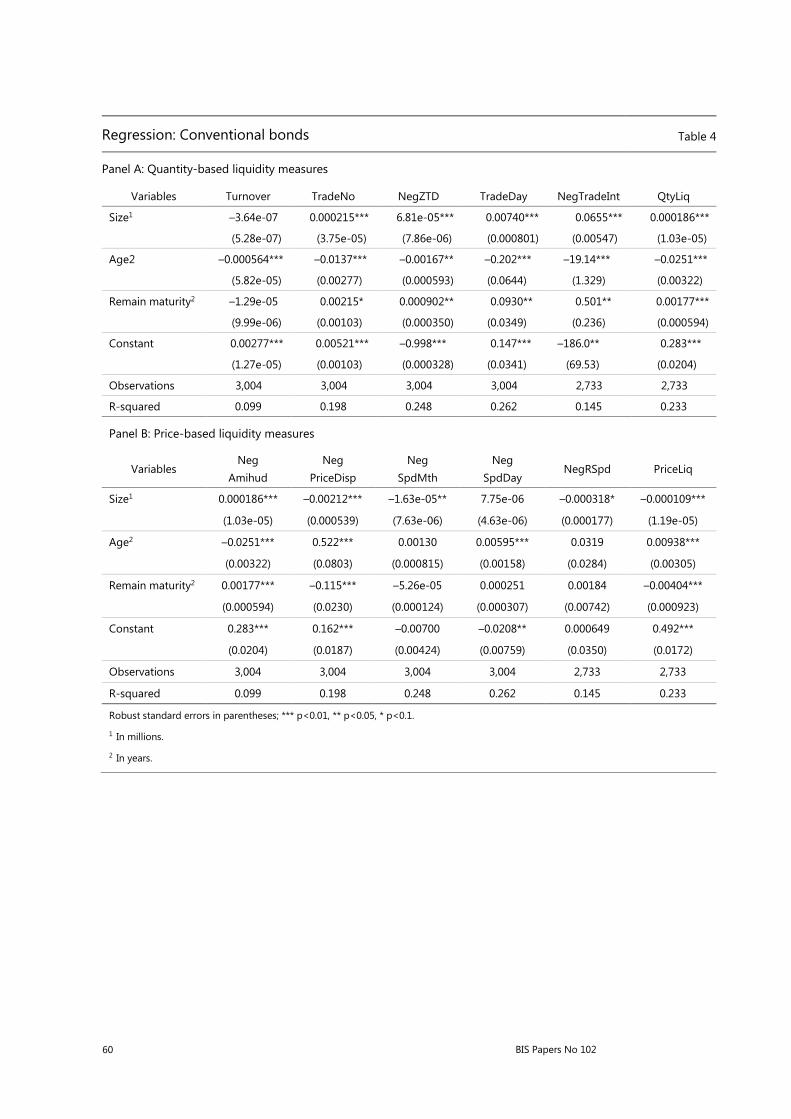
An interesting feature of the Malaysian bond market is that there are two types of bonds traded in the market: Islamic and conventional. As a robustness check, we investigate the relation in equation (1) separately for each type of bond. Table 4 reports the results for Islamic bonds and Table 5 for conventional bonds. Our major findings are almost identical across these two types of bonds. In Panel A of Tables 4 and 5, we find that all quantity-based proxies of liquidity are significantly positively related to Size (with the exception of Turnover) and significantly negatively related to Age. Panels B of Tables 4 and 5, on the other hand, show that the price-based liquidity has the wrong sign for the key parameters of interest: b1 and b2 in equation (1).
54
BIS Papers No 102
The efficacy of the quantity-based liquidity proxies in the Malaysian corporate bond market is substantially higher than that of the price-based liquidity proxies. Moreover, the quantity-based liquidity proxies capture liquidity differences among Malaysian corporate bonds equally well for both Islamic as well as conventional bonds. By contrast, price-based liquidity proxies do not measure bond liquidity differences well in either market.
5. Conclusion
We investigate the liquidity of the Malaysian ringgit corporate bond market using data from a trade reporting system that is similar to the TRACE system in the United States. This market is far less liquid than the US market, which itself is considered to be illiquid. Liquidity can be proxied by issue size or age, which are easily obtained measures that do not require a bond transaction database. We estimate various quantity- and price-based measures of liquidity using the data from the reporting system and we relate these to bond size and age. Correlation and regression analysis suggests that quantity-based measures do a better job in capturing bond liquidity differences than price-based measures. These results hold for both Islamic and conventional bonds. Our analysis of liquidity measures will help regulators to focus on the right metrics when evaluating changes over time as they attempt to improve the liquidity of their local currency bond markets.
References
Alexander, G, A Edwards and M Ferri (2000): “The determinants of trading volume of high-yield corporate bonds”, Journal of Financial Markets, vol 3, pp 177–204.
Amihud, Y (2002): “Illiquidity and stock returns”, Journal of Financial Markets, vol 5, pp 31–56.
Asian Development Bank (2015): Local currency bonds and infrastructure finance in ASEAN+3, July.
Bao, J, J Pan and J Wang (2011): “The illiquidity of corporate bonds”, Journal of Finance, vol 66, pp 911–46.
Bessembinder, H, W Maxwell and K Venkataraman (2006): “Optimal market transparency: evidence from the initiation of trade reporting in corporate bonds”, Journal of Financial Economics, vol 82, pp 251–88.
The Bank for International Settlements (2006): “Developing corporate bond markets in Asia,” Proceedings of a BIS/PBC seminar, Kunming, China, 17–18 November 2005.
——— (2012): “Weathering financial crises: bond markets in Asia and the Pacific”, BIS Papers, no 63, January.
——— (2016): “A spare tire for capital markets: fostering corporate bond markets in Asia”, BIS Papers, no 85, October.
Chakravarty, S and A Sarkar (2003): “A comparison of trading costs in the US corporate, municipal and treasury bond markets”, Journal of Fixed Income, vol 13, pp 39–48.
BIS Papers No 102
55
Chen, L, D Lesmond and J Wei (2007): “Corporate yield spreads and bond liquidity”, Journal of Finance, vol 62, pp 119–49.
Chen M, Cherian J, Shao Y and M Subrahmanyam (2018): “Is there a clientele effect in Islamic bonds? Evidence from the Malaysian sovereign bond market”, Working Paper.
Crabbe, L and C Turner (1995): “Does the liquidity of a debt issue increase with its size? evidence from the corporate bond and medium-term note markets”, Journal of Finance, vol 50, pp 1719–34.
DeJong, F and J Driessen (2012): “Liquidity risk premia in corporate bond markets”, Quarterly Journal of Finance, vol 2, no1250006.
Dick-Nielsen, J, P Feldhütter and D Lando (2012): “Corporate bond liquidity before and after the onset of the subprime crisis”, Journal of Financial Economics, vol 103, pp 471–92.
Edwards, A, L Harris and M Piwowar (2007): “Corporate bond market transaction costs and transparency”, Journal of Finance, vol 62, pp 1421–48.
Ericsson, J and O Renault (2006): “Liquidity and credit risk”, Journal of Finance, vol 61, pp 2219–50.
Feldhutter, P (2012): “The same bond at different prices: identifying search frictions and selling pressures”, Review of Financial Studies, vol 25, pp 1155–206.
Feldstein, M (1999): “Self-protection for emerging market economies”, NBER Working Paper, no 6907.
Friewald, N, R Jankowitsch and M Subrahmanyam (2012): “Illiquidity or credit deterioration: a study of liquidity in the US corporate bond market during financial crises”, Journal of Financial Economics, vol 105, pp 18–36.
Goldstein, M and E Hotchkiss (2007): “Dealer behavior and the trading of newly issued corporate bonds”, Working Paper.
Goldstein, M, E Hotchkiss and E Sirri (2007): “Transparency and liquidity: a controlled experiment on corporate bonds”, Review of Financial Studies, vol 20, pp 235–73.
Greenspan, A (1999): “Do efficient financial markets mitigate financial crisis?”, speech given before the 1999 Financial Markets Conference of the Federal Reserve Bank, Georgia, United States, 19 October.
Han, S and H Zhou (2016): “Effects of liquidity on the nondefault component of corporate yield spreads: evidence from intraday transactions data”, Quarterly Journal of Finance, vol 6, no 1650012.
Helwege, J, Huang J and Y Huang (2014): “Liquidity effects in corporate bond spreads”, Journal of Banking and Finance, vol 45, issue C, pp 105–16.
Helwege, J and L Wang (2018): “Liquidity and price pressure in the corporate bond market: evidence from mega-bonds”, Working Paper.
Hong, G and A Warga (2000): “An empirical study of bond market transactions”, Financial Analysts Journal, vol 56, pp 32–46.
Hotchkiss, E and G Jostova (2017): “Determinants of corporate bond trading: a comprehensive analysis”, Quarterly Journal of Finance, vol 7, no 1750003.
Houweling, P, A Mentink and T Vorst (2005): “Comparing possible proxies of corporate bond liquidity”, Journal of Banking and Finance, vol 29, pp 1331–58.
56
BIS Papers No 102
Jacoby, G, G Theocharides and S Zheng (2009): “Liquidity and liquidity risk for corporate bonds,” Working Paper.
Kaminsky, G and V Reinhart (2000): “On crises, contagion, and confusion”, Journal of International Economics, vol 51, pp 145–68.
Kozhanov, I and J Ogden (2012): “The pricing and performance of new corporate bonds: sorting out underpricing and liquidity effects”, Working Paper.
Lesmond, D, J Ogden and C Trzcinka. (1999): “A new estimate of transaction costs”, Review of Financial Studies, vol 12, pp 1113–41.
Lin, H, J Wang and C Wu (2011): “Liquidity risk and expected corporate bond returns”, Journal of Financial Economics, vol 99, pp 628–50.
Mahanti, S, A Nashikkar, M Subrahmanyam, G Chacko and G Mallik (2008): “Latent liquidity: a new measure of liquidity, with an application to corporate bonds”, Journal of Financial Economics, vol 88, pp 272–98.
Nashikkar, A, M Subrahmanyam and S Mahanti (2011): “Liquidity and arbitrage in the market for credit risk”, Journal of Financial and Quantitative Analysis, vol 46, pp 627–56.
Newman, Y and M Rierson (2004): Illiquidity spillovers: theory and evidence from European telecom bond issuance”, Working Paper.
O’Hara, M, Y Wang and X Zhou (2015): “The execution quality of corporate bonds”, Working Paper.
Perraudin, W and A Taylor (2003): “Liquidity and bond market spreads”, Working Paper.
Roll, R (1984): “A simple implicit measure of the effective bid-ask spread in an efficient market”, Journal of Finance, vol 39, pp 1127–39.
Rossi, M (2014): “Realized volatility, liquidity, and corporate yield spreads”, Quarterly Journal of Finance, vol 4, no 1450004.
Schestag, R, P Schuster and M Uhrig-Homburg (2016): “Measuring liquidity in bond markets”, Review of Financial Studies, vol 29, pp 1170–219.
BIS Papers No 102
57
Tables
Summary statistics Table 1
Variable # of bonds Mean Std p25 p50 p75
Panel A: Quantity-based liquidity measures
Turnover 3634 0.005 0.019 0.002 0.004 0.006
TradeNo 3636 0.070 0.353 0.020 0.035 0.067
NegZTD 3636 –0.976 0.034 –0.992 –0.986 –0.974
TradeDay 3636 2.571 3.630 0.815 1.489 2.846
NegTradeInt 3276 –95.430 146.140 –112.186 –54.638 –22.406
QtyLiq 3276 0.489 0.168 0.369 0.473 0.595
Panel B: Price-based liquidity measures
NegAmihud 3636 –8610.985 51280.266 –2840.015 –858.862 –48.779
NegPriceDisp 3636 –2.956 7.458 –1.500 –0.028 –0.003
NegSpdMth 3094 –0.527 4.314 –0.248 –0.076 –0.016
NegSpdDay 2768 –2.728 20.005 –0.103 –0.035 –0.014
NegRSpd 3460 –18.193 371.392 –0.456 –0.042 0.000
PriceLiq 2755 0.450 0.144 0.353 0.448 0.546
58
BIS Papers No 102
Summary statistics Table 2
Panel A: Correlation of Quantity-Based Liquidity Measures
Turnover TradeNo NegZTD TradeDay NegTradeInt QtyLiq
Turnover 1.000 0.368 0.235 0.239 0.420 0.593
TradeNo 1.000 0.831 0.837 0.562 0.923
NegZTD 1.000 0.993 0.435 0.875
TradeDay 1.000 0.445 0.881
NegTradeInt 1.000 0.700
QtyLiq 1.000
Panel B: Correlation of price-based liquidity measures
Neg
Amihud Neg
PriceDisp Neg
SpdMth Neg
SpdDay NegRSpd PriceLiq
NegAmihud 1.000 0.407 0.179 0.069 0.121 0.357
NegPriceDisp 1.000 0.756 0.637 0.274 0.816
NegSpdMth 1.000 0.732 0.283 0.850
NegSpdDay 1.000 0.325 0.799
NegRSpd 1.000 0.522
PriceLiq 1.000
Panel C: Correlation of quantity- vs price-based liquidity measures
Neg
Amihud Neg
PriceDisp Neg
SpdMth Neg
SpdDay NegRSpd PriceLiq
Turnover 0.242 –0.130 –0.214 –0.226 0.024 –0.194
TradeNo –0.119 –0.481 –0.570 –0.387 –0.191 –0.502
NegZTD –0.282 –0.529 –0.576 –0.331 –0.230 –0.508
TradeDay –0.280 –0.531 –0.569 –0.331 –0.227 –0.502
NegTradeInt 0.300 –0.283 –0.423 –0.340 –0.030 –0.410
QtyLiq 0.054 –0.462 –0.572 –0.396 –0.169 –0.455
BIS Papers No 102
59
Regression: All bonds Table 3
Panel A: Quantity-based liquidity measures
Variables Turnover TradeNo NegZTD TradeDay NegTradeInt QtyLiq
Size1 –1.35e-06*** 0.000182*** 6.07e-05*** 0.00657*** 0.0854*** 0.000215***
(3.05e-07) (2.18e-05) (5.08e-06) (0.000537) (0.00770) (8.30e-06)
Age2 –0.000513*** –0.00782*** –0.00112*** –0.135*** –20.12*** –0.0265***
(3.45e-05) (0.00114) (0.000311) (0.0338) (1.073) (0.00159)
Remain maturity2 –3.16e-05* 0.000631 0.000269 0.0254 –0.272* 0.000196
(1.82e-05) (0.000544) (0.000160) (0.0161) (0.154) (0.000371)
Constant 0.00449*** 0.0144*** –0.996*** 0.390*** –35.87 0.445***
(0.000742) (0.00221) (0.00116) (0.118) (22.01) (0.0123)
Observations 8,772 8,774 8,774 8,774 8,128 8,128
R-squared 0.077 0.218 0.254 0.266 0.131 0.239
Panel B: Price-based liquidity measures
Variables Neg
Amihud Neg
PriceDisp Neg
SpdMth Neg
SpdDay NegRSpd PriceLiq
Size1 –18.90*** –0.00120*** –8.82e-06* 2.85e-06 –0.000487* –0.000105***
(3.454) (0.000332) (4.45e-06) (2.31e-06) (0.000279) (9.20e-06)
Age2 –901.6 0.770*** 0.000603* 0.00471*** 0.0274 0.0101***
(551.3) (0.0876) (0.000342) (0.00135) (0.0200) (0.00181)
Remain maturity2 –1,193*** –0.0416* –8.04e-05 0.000285** 0.00251 –0.00432***
(208.0) (0.0207) (9.51e-05) (0.000131) (0.00631) (0.000552)
Constant 1,848*** 0.0151 –0.00499 –2.001*** –0.0827 0.594***
(185.8) (0.0602) (0.00339) (0.000407) (0.0673) (0.0284)
Observations 8,774 8,774 7,649 6,784 8,321 6,756
R-squared 0.044 0.066 0.007 0.035 0.005 0.149
Robust standard errors in parentheses; *** p<0.01, ** p<0.05, * p<0.1.
1 In millions
2 In years.
60
BIS Papers No 102
Regression: Conventional bonds Table 4
Panel A: Quantity-based liquidity measures
Variables Turnover TradeNo NegZTD TradeDay NegTradeInt QtyLiq
Size1 –3.64e-07 0.000215*** 6.81e-05*** 0.00740*** 0.0655*** 0.000186***
(5.28e-07) (3.75e-05) (7.86e-06) (0.000801) (0.00547) (1.03e-05)
Age2 –0.000564*** –0.0137*** –0.00167** –0.202*** –19.14*** –0.0251***
(5.82e-05) (0.00277) (0.000593) (0.0644) (1.329) (0.00322)
Remain maturity2 –1.29e-05 0.00215* 0.000902** 0.0930** 0.501** 0.00177***
(9.99e-06) (0.00103) (0.000350) (0.0349) (0.236) (0.000594)
Constant 0.00277*** 0.00521*** –0.998*** 0.147*** –186.0** 0.283***
(1.27e-05) (0.00103) (0.000328) (0.0341) (69.53) (0.0204)
Observations 3,004 3,004 3,004 3,004 2,733 2,733
R-squared 0.099 0.198 0.248 0.262 0.145 0.233
Panel B: Price-based liquidity measures
Variables Neg
Amihud Neg
PriceDisp Neg
SpdMth Neg
SpdDay NegRSpd PriceLiq
Size1 0.000186*** –0.00212*** –1.63e-05** 7.75e-06 –0.000318* –0.000109***
(1.03e-05) (0.000539) (7.63e-06) (4.63e-06) (0.000177) (1.19e-05)
Age2 –0.0251*** 0.522*** 0.00130 0.00595*** 0.0319 0.00938***
(0.00322) (0.0803) (0.000815) (0.00158) (0.0284) (0.00305)
Remain maturity2 0.00177*** –0.115*** –5.26e-05 0.000251 0.00184 –0.00404***
(0.000594) (0.0230) (0.000124) (0.000307) (0.00742) (0.000923)
Constant 0.283*** 0.162*** –0.00700 –0.0208** 0.000649 0.492***
(0.0204) (0.0187) (0.00424) (0.00759) (0.0350) (0.0172)
Observations 3,004 3,004 3,004 3,004 2,733 2,733
R-squared 0.099 0.198 0.248 0.262 0.145 0.233
Robust standard errors in parentheses; *** p<0.01, ** p<0.05, * p<0.1.
1 In millions.
2 In years.

BIS Papers No 102
61
Regression: Islamic bonds Table 5
Panel A: Quantity-based liquidity measures
Variables Turnover TradeNo NegZTD TradeDay NegTradeInt QtyLiq
Size1 –2.33e-06*** 0.000145*** 4.95e-05*** 0.00538*** 0.101*** 0.000244***
(1.82e-07) (1.33e-05) (4.62e-06) (0.000510) (0.0101) (1.27e-05)
Age2 –0.000487*** –0.00605*** –0.00110*** –0.130*** –20.73*** –0.0280***
(3.26e-05) (0.000559) (0.000233) (0.0267) (1.726) (0.00198)
Remain maturity2 –2.36e-05 –0.000105 –0.000121 –0.0157 –1.063*** –0.00144**
(2.86e-05) (0.000354) (0.000112) (0.0121) (0.281) (0.000600)
Constant 0.00764*** 0.0175*** –0.995*** 0.498*** –35.69 0.446***
(0.000663) (0.00218) (0.00134) (0.137) (22.30) (0.0128)
Observations 5,768 5,770 5,770 5,770 5,395 5,395
R-squared 0.080 0.350 0.300 0.306 0.126 0.250
Panel B: Price-based liquidity measures
Variables Neg
Amihud Neg
PriceDisp Neg
SpdMth Neg
SpdDay NegRSpd PriceLiq
Size1 –6.944** –0.000220 –1.78e-06* 9.90e-07 –0.000639 –0.000102***
(3.167) (0.000347) (8.53e-07) (5.41e-06) (0.000496) (1.12e-05)
Age2 –889.0** 0.926*** 0.000226 0.00418** 0.0290 0.0104***
(309.6) (0.110) (0.000165) (0.00183) (0.0213) (0.00240)
Remain maturity2 –556.1*** 0.0297 –0.000244** 0.000406 0.00216 –0.00425***
(184.4) (0.0234) (0.000107) (0.000260) (0.0128) (0.000690)
Constant 854.8*** –0.111 0.000633 –0.0137** –0.0198 0.593***
(289.7) (0.0861) (0.000940) (0.00605) (0.130) (0.0288)
Observations 5,770 5,770 5,082 4,521 5,528 4,514
R-squared 0.066 0.078 0.007 0.008 0.007 0.150
Robust standard errors in parentheses; *** p<0.01, ** p<0.05, * p<0.1.
1 In millions.
2 In years.
62
BIS Papers No 102
Monthly outstanding of Malaysia corporate bonds (bil MYR) Graph 1
12-month moving avg of monthly turnover rate of Malaysia corporate bonds Graph 2