Embed Size (px)
Citation preview
Measuring Computer Systems:How to Measure Performance
Margo Seltzer, Aaron Brown
Harvard UniversityDivision of Engineering and Applied Sciences
{margo,abrown}@eecs.harvard.edu
EV IR
T A S
Measuring Computer Systems
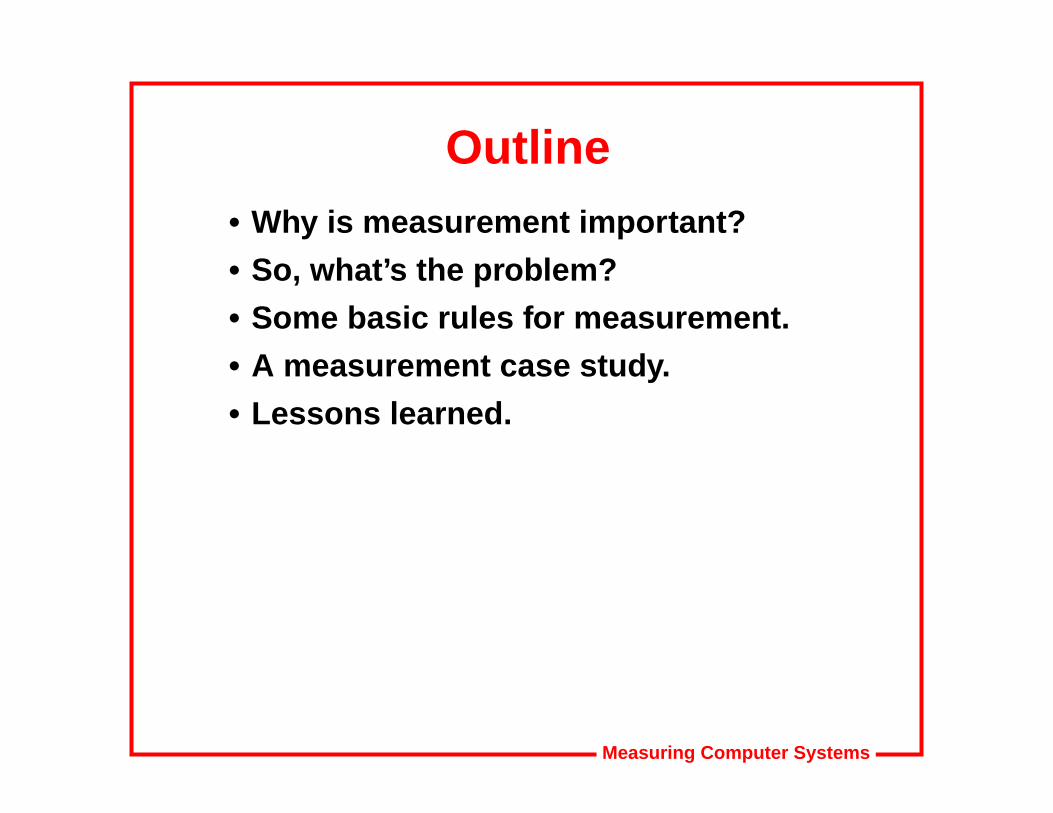
Outline• Why is measurement important?
• So, what’s the problem?
• Some basic rules for measurement.
• A measurement case study.
• Lessons learned.

Measuring Computer Systems
Why Benchmark?
“Benchmarks shape a field (forbetter or worse); they are howwe determine the value ofchange.”
—David Patterson, 1994

Measuring Computer Systems
Benchmarks Shape a Field• Database and TP Community
• Debit/Credit
• TP1
• TPC/A-B
• TPC/C
• 001
• TPC/D
• Architecture Community• Linpack
• SPEC

Measuring Computer Systems
Shaping a Field (2)• File System Community
• Trace-based analysis of the 4.2 file system
• Andrew File System Benchmark
• Bonnie
• LADDIS
• PC Community• Byte benchmarks
• PC Magazine Winstone and WinBench
• Spelling Community• Whetstone
• Dhrystone
• NHFSstone
Measuring Computer Systems
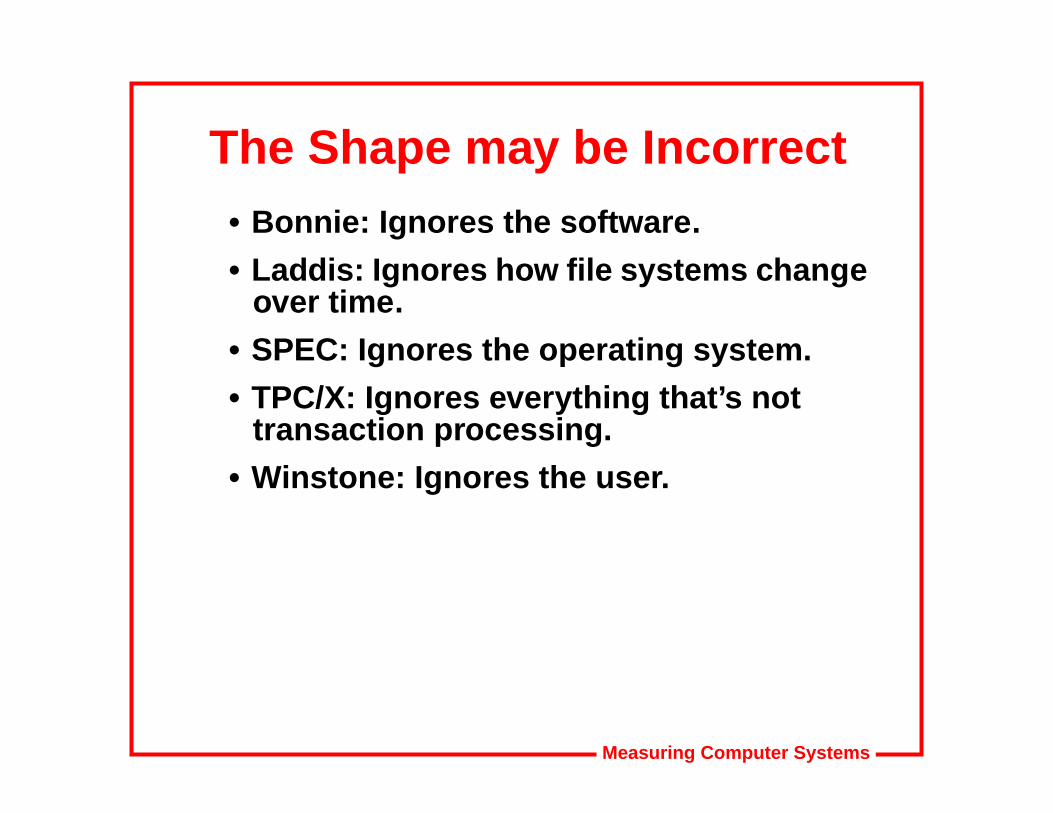
The Shape may be Incorrect• Bonnie: Ignores the software.
• Laddis: Ignores how file systems changeover time.
• SPEC: Ignores the operating system.
• TPC/X: Ignores everything that’s nottransaction processing.
• Winstone: Ignores the user.
Measuring Computer Systems
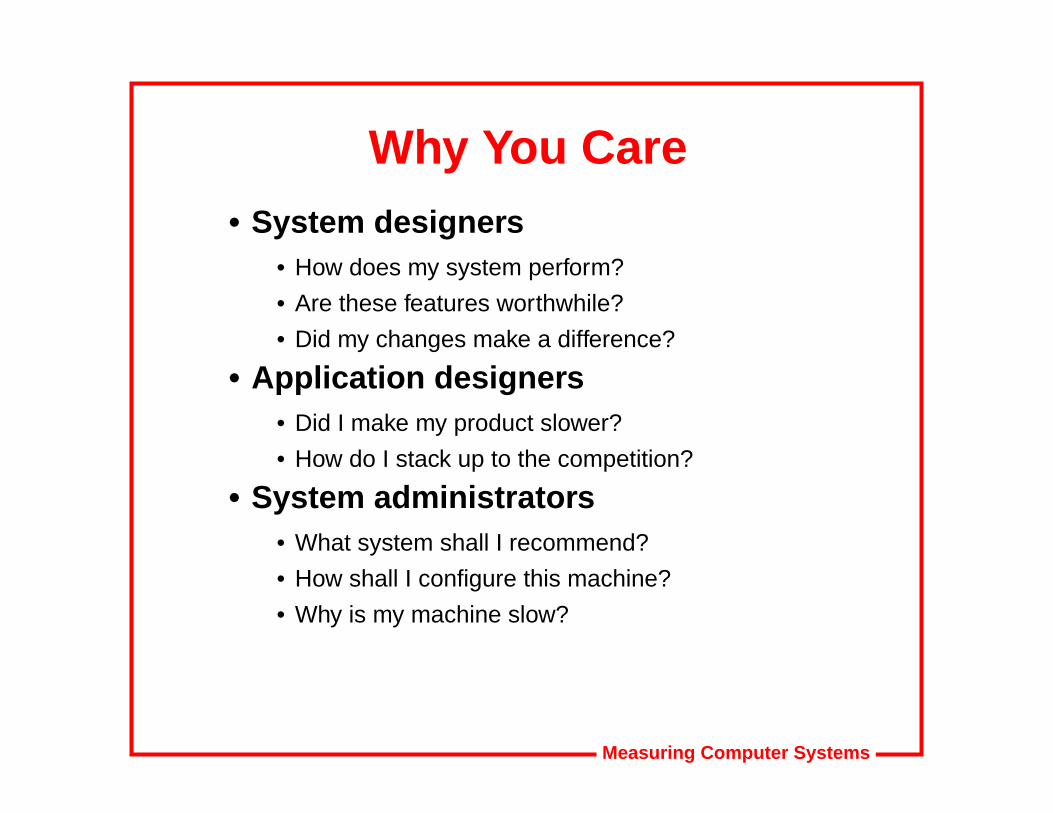
Why You Care• System designers
• How does my system perform?
• Are these features worthwhile?
• Did my changes make a difference?
• Application designers• Did I make my product slower?
• How do I stack up to the competition?
• System administrators• What system shall I recommend?
• How shall I configure this machine?
• Why is my machine slow?

Measuring Computer Systems
Why You Care (2)• Customers
• What system shall I buy?
• What software shall I buy?
Measuring Computer Systems
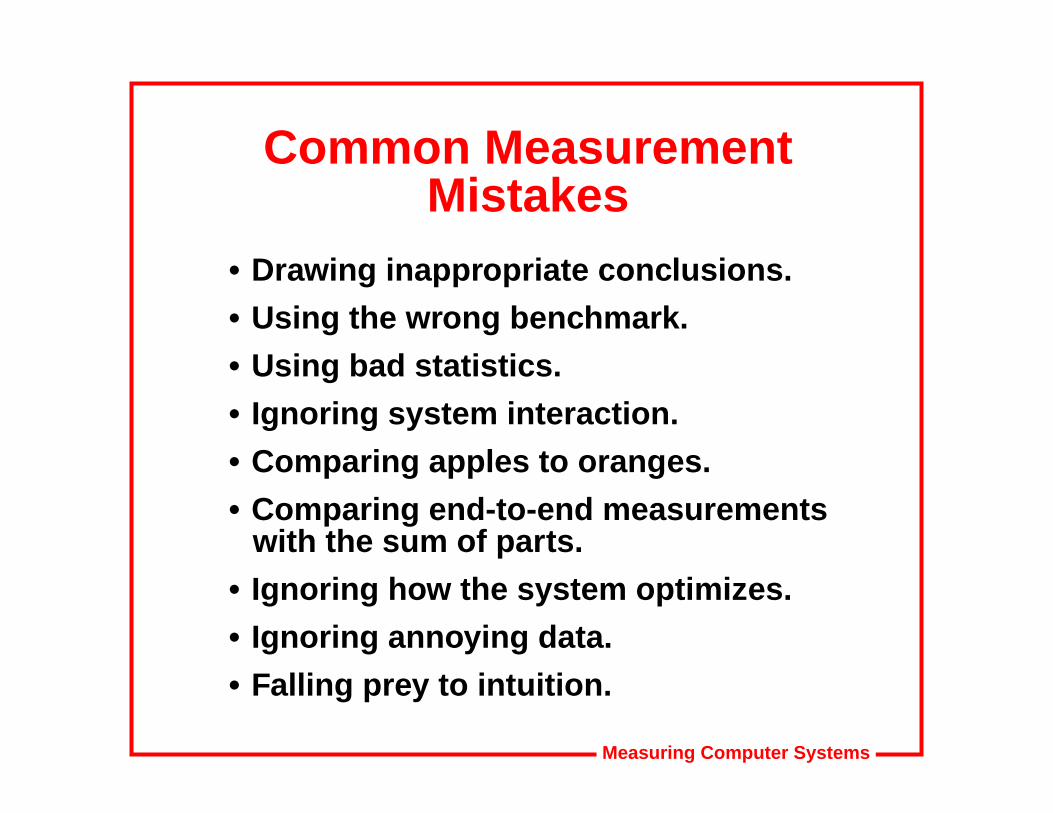
Common MeasurementMistakes
• Drawing inappropriate conclusions.
• Using the wrong benchmark.
• Using bad statistics.
• Ignoring system interaction.
• Comparing apples to oranges.
• Comparing end-to-end measurementswith the sum of parts.
• Ignoring how the system optimizes.
• Ignoring annoying data.
• Falling prey to intuition.
Measuring Computer Systems
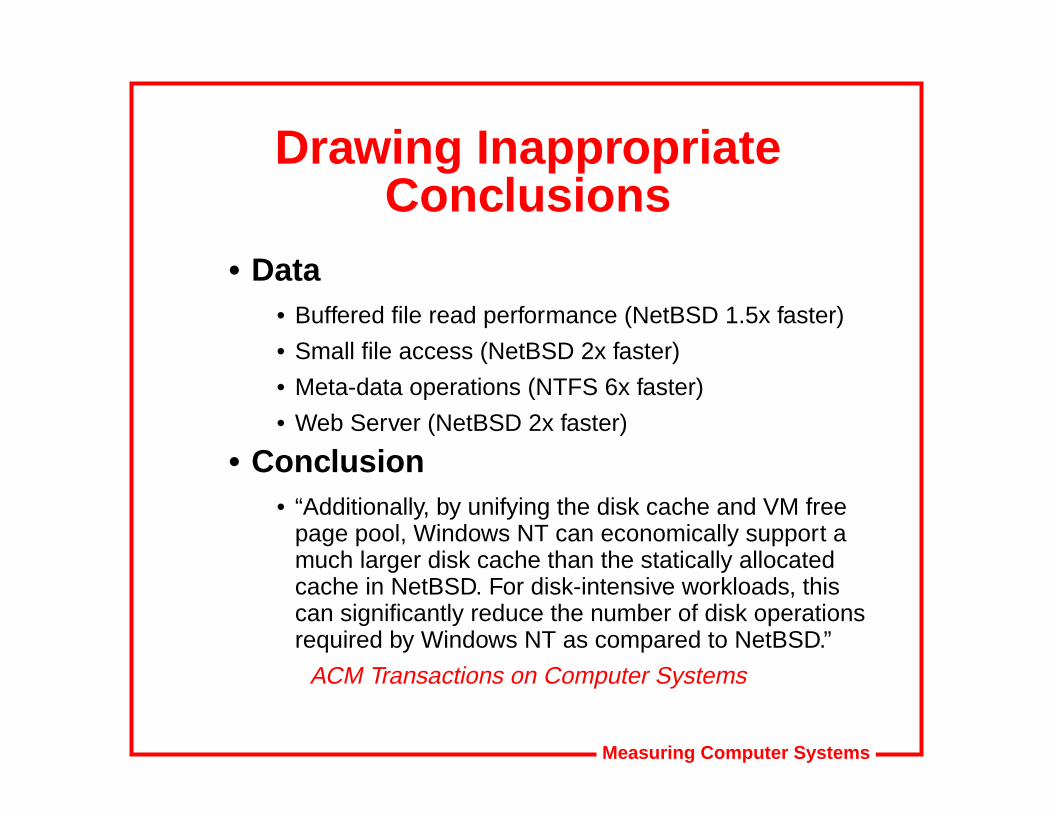
Drawing InappropriateConclusions
• Data• Buffered file read performance (NetBSD 1.5x faster)
• Small file access (NetBSD 2x faster)
• Meta-data operations (NTFS 6x faster)
• Web Server (NetBSD 2x faster)
• Conclusion• “Additionally, by unifying the disk cache and VM free
page pool, Windows NT can economically support amuch larger disk cache than the statically allocatedcache in NetBSD. For disk-intensive workloads, thiscan significantly reduce the number of disk operationsrequired by Windows NT as compared to NetBSD.”
ACM Transactions on Computer Systems
Measuring Computer Systems
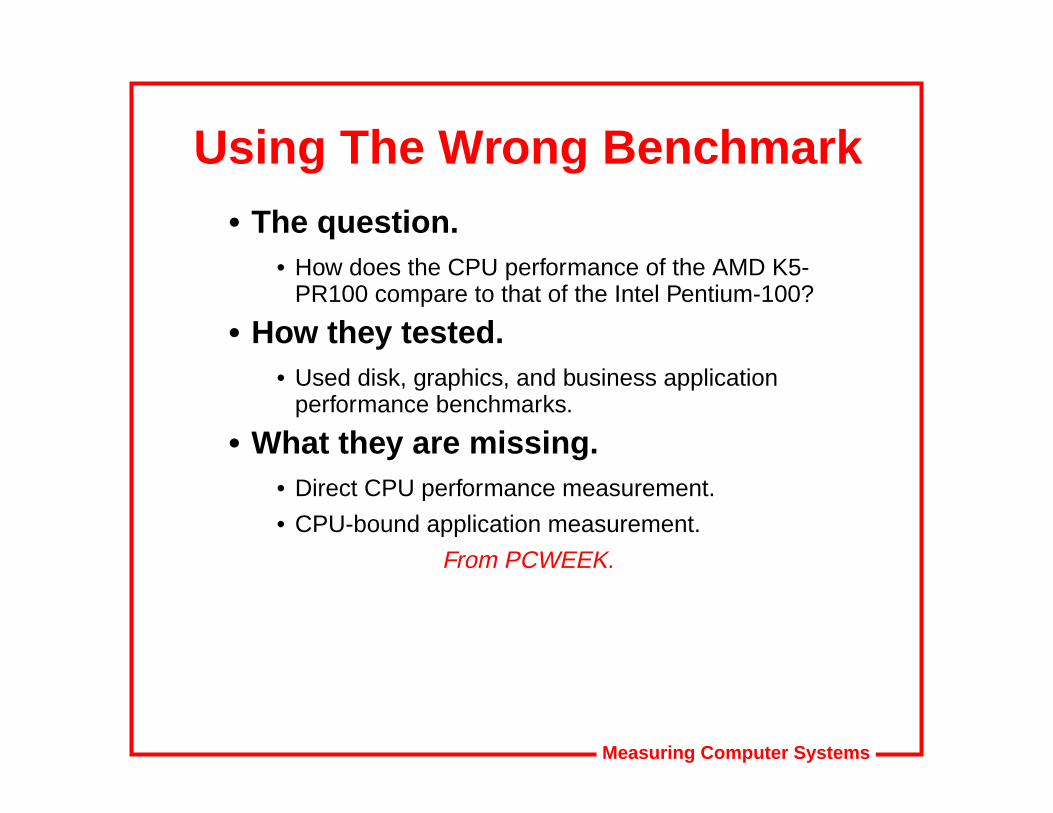
Using The Wrong Benchmark• The question.
• How does the CPU performance of the AMD K5-PR100 compare to that of the Intel Pentium-100?
• How they tested.• Used disk, graphics, and business application
performance benchmarks.
• What they are missing.• Direct CPU performance measurement.
• CPU-bound application measurement.
From PCWEEK.

Measuring Computer Systems
More Wrong Benchmarks• The question.
• How do these two file systems compare inperformance?
• How they tested.• Andrew benchmark.
• What they missed.• Andrew was designed to measure scalability of a
distributed file system.
• Andrew is mostly CPU bound (compile).
• Andrew data set fits in the cache.
From USENIX 90, 93, 95.
Measuring Computer Systems
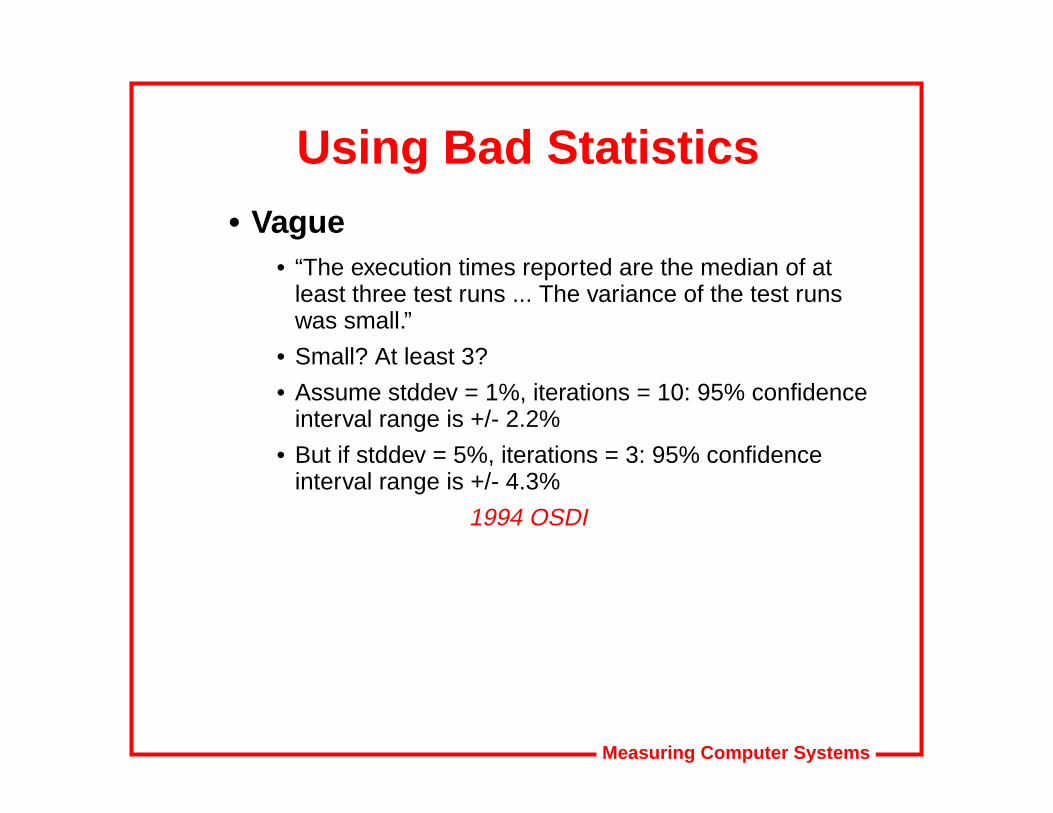
Using Bad Statistics• Vague
• “The execution times reported are the median of atleast three test runs ... The variance of the test runswas small.”
• Small? At least 3?
• Assume stddev = 1%, iterations = 10: 95% confidenceinterval range is +/- 2.2%
• But if stddev = 5%, iterations = 3: 95% confidenceinterval range is +/- 4.3%
1994 OSDI
Measuring Computer Systems
More Bad Statistics• Non-existent
• “Each reported measurement reflects the averageelapsed time per iteration of a loop that repeatedlyinvokes the associated primitive.”
• How many iterations?
• What were the standard deviations?
June, 1994 USENIX
Measuring Computer Systems
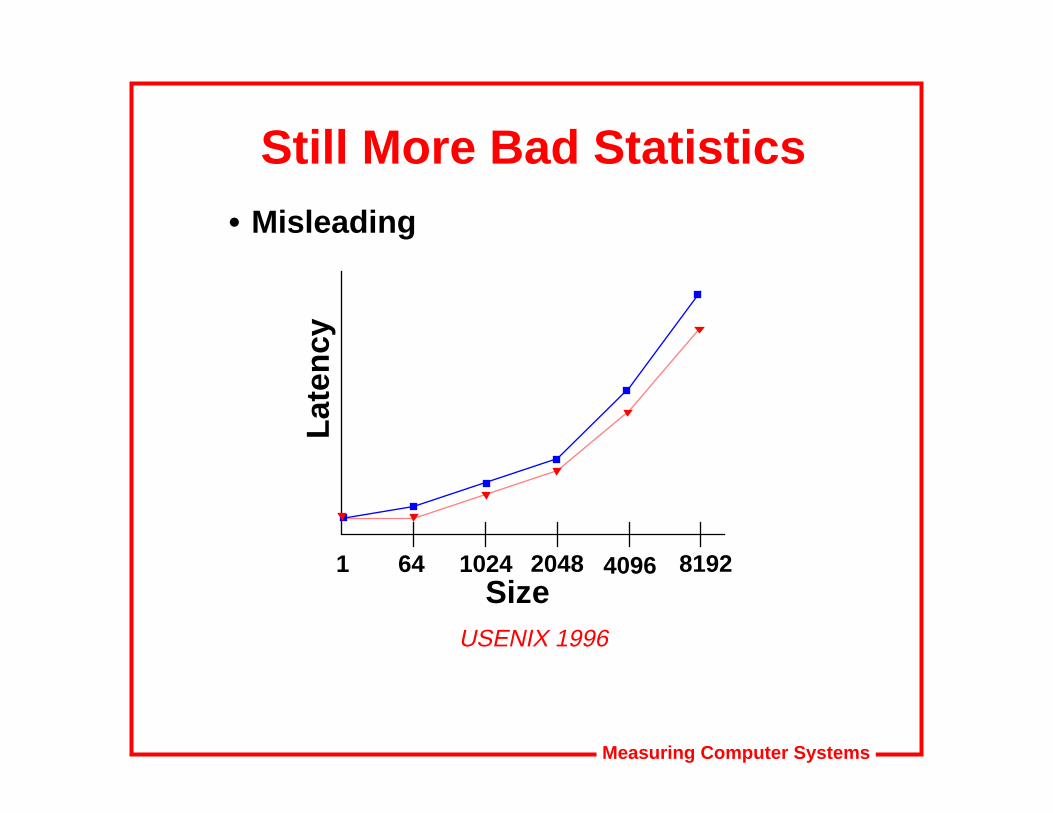
Still More Bad Statistics• Misleading
USENIX 1996
Late
ncy
Size1 64 1024 2048 4096 8192
Measuring Computer Systems
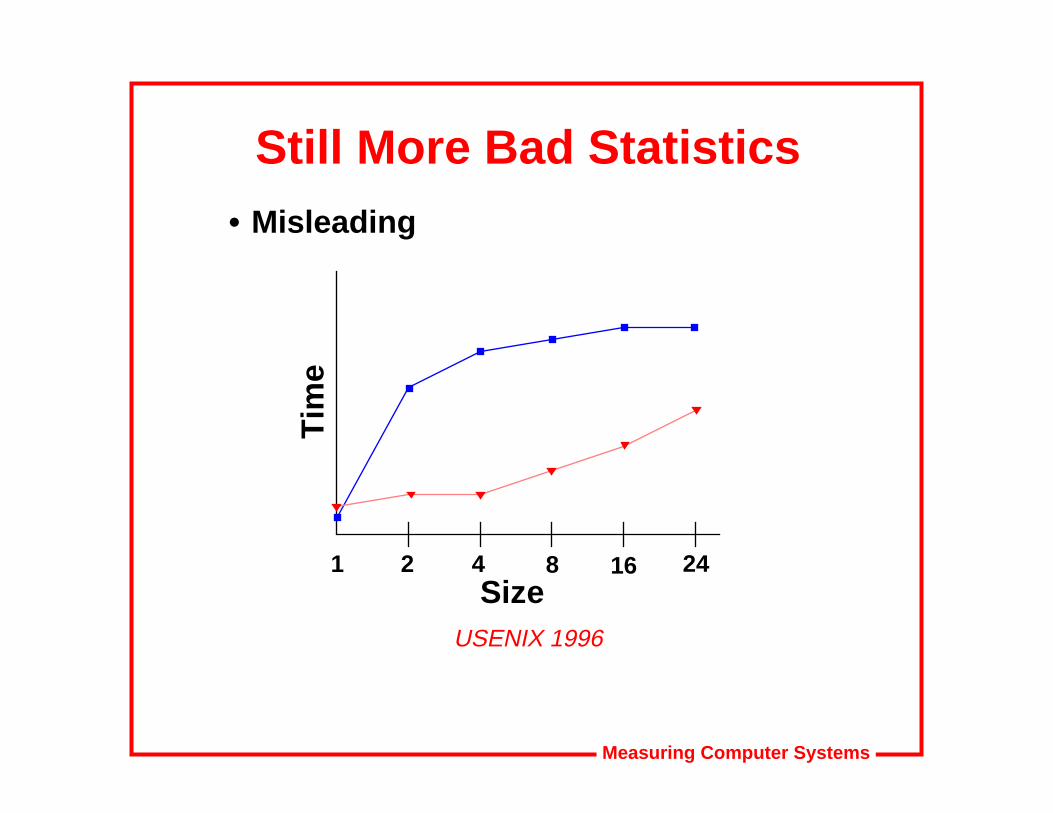
Still More Bad Statistics• Misleading
USENIX 1996
Tim
e
Size1 2 4 8 16 24
Measuring Computer Systems
Ignoring System Interaction• CPUmark.
• Claimed to test the “processor subsystem.”
• The same Intel 133 MHz Pentium CPU produces a 7%larger result in an AMD system than in an HP system.
• Disk WinMark.• Intended to measure disk subsystem performance.
• Identical system with different CPUs (Intel in one, AMDin the other) produce Disk WinMark scores that differby 2%.
• Conclusions.• CPUmark includes non-CPU-dependent components
• Disk WinMark includes non-disk components
PC Labs WinBench tests.
Measuring Computer Systems
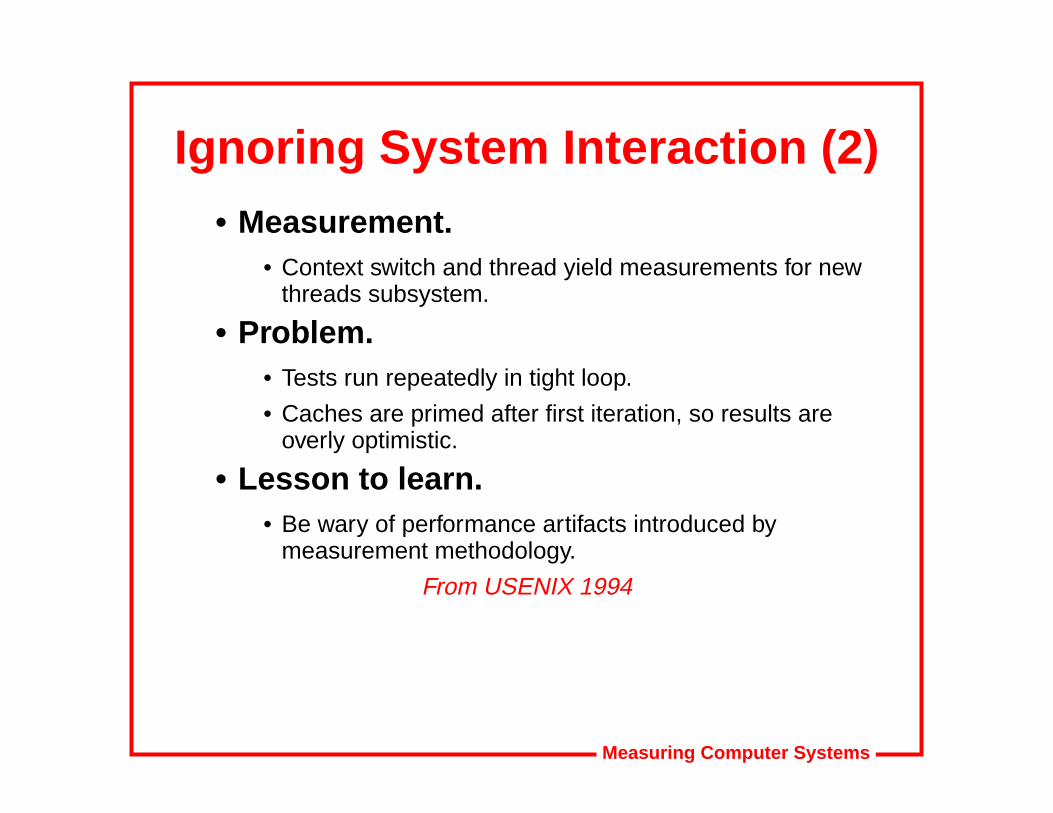
Ignoring System Interaction (2)• Measurement.
• Context switch and thread yield measurements for newthreads subsystem.
• Problem.• Tests run repeatedly in tight loop.
• Caches are primed after first iteration, so results areoverly optimistic.
• Lesson to learn.• Be wary of performance artifacts introduced by
measurement methodology.
From USENIX 1994

Measuring Computer Systems
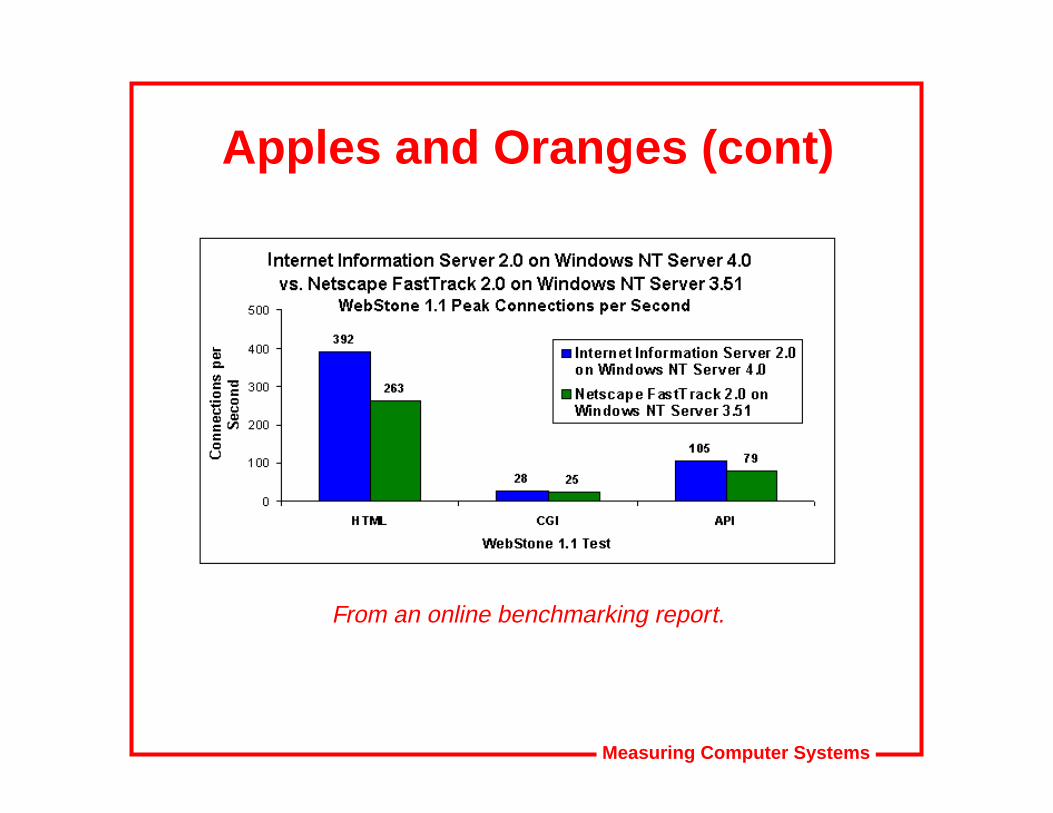
Comparing Apples to Oranges• Unfair comparisons
• “The Netscape Server software license does not allow usto publish the results of our tests with Netscape FastTrackor Enterprise servers (Microsoft has a similar licenserestriction), so the only comparisons we can use arethose previously published publicly. Using the resultsfrom http://www.mindcraft.com/services/web/ns01-fasttrack-nt.html published by Mindcraftand Netscape for FastTrack on Windows NT Server, andrunning IIS2.0 on a similarly configured HP NetServer LSserver, we see that Internet Information Server 2.0 issignificantly faster than the Netscape Fast Track server.”
100% HTML IIS 2.0 is 49% faster than FastTrack100% CGI IIS 2.0 is 12% faster than FastTrack100% API IIS 2.0 is 33% faster than FastTrack
Measuring Computer Systems
Apples and Oranges (cont)
From an online benchmarking report.
Measuring Computer Systems
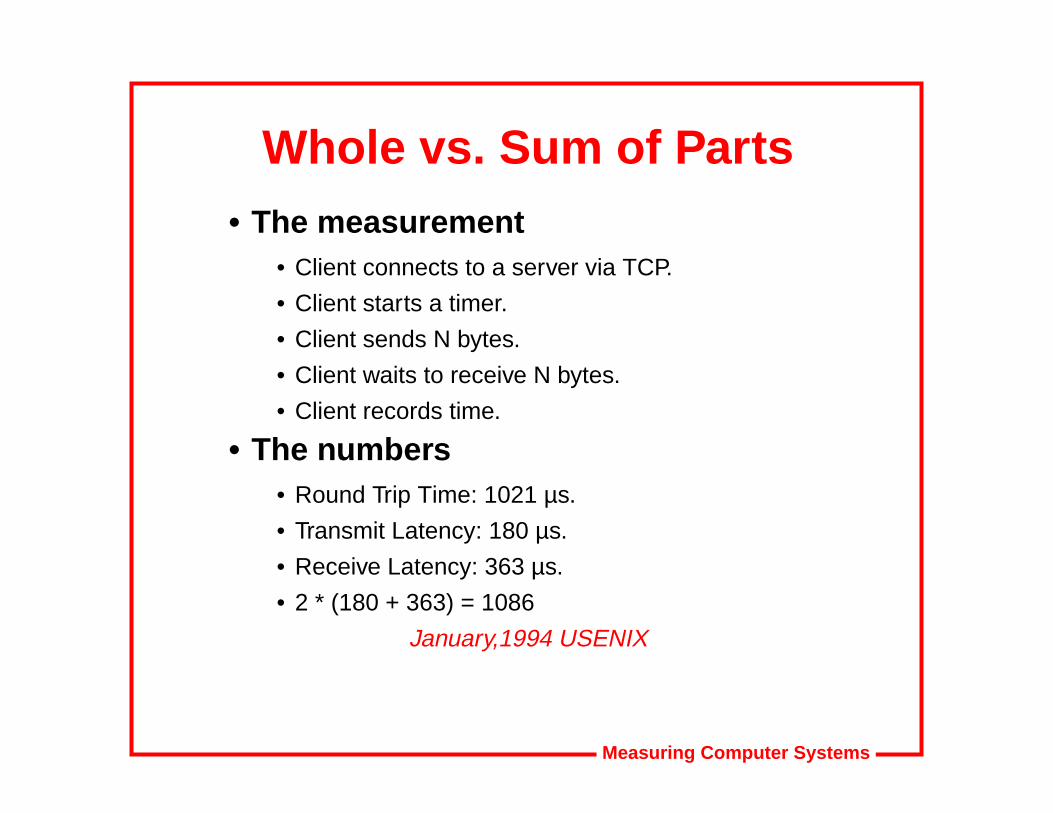
Whole vs. Sum of Parts• The measurement
• Client connects to a server via TCP.
• Client starts a timer.
• Client sends N bytes.
• Client waits to receive N bytes.
• Client records time.
• The numbers• Round Trip Time: 1021 µs.
• Transmit Latency: 180 µs.
• Receive Latency: 363 µs.
• 2 * (180 + 363) = 1086
January,1994 USENIX
Measuring Computer Systems
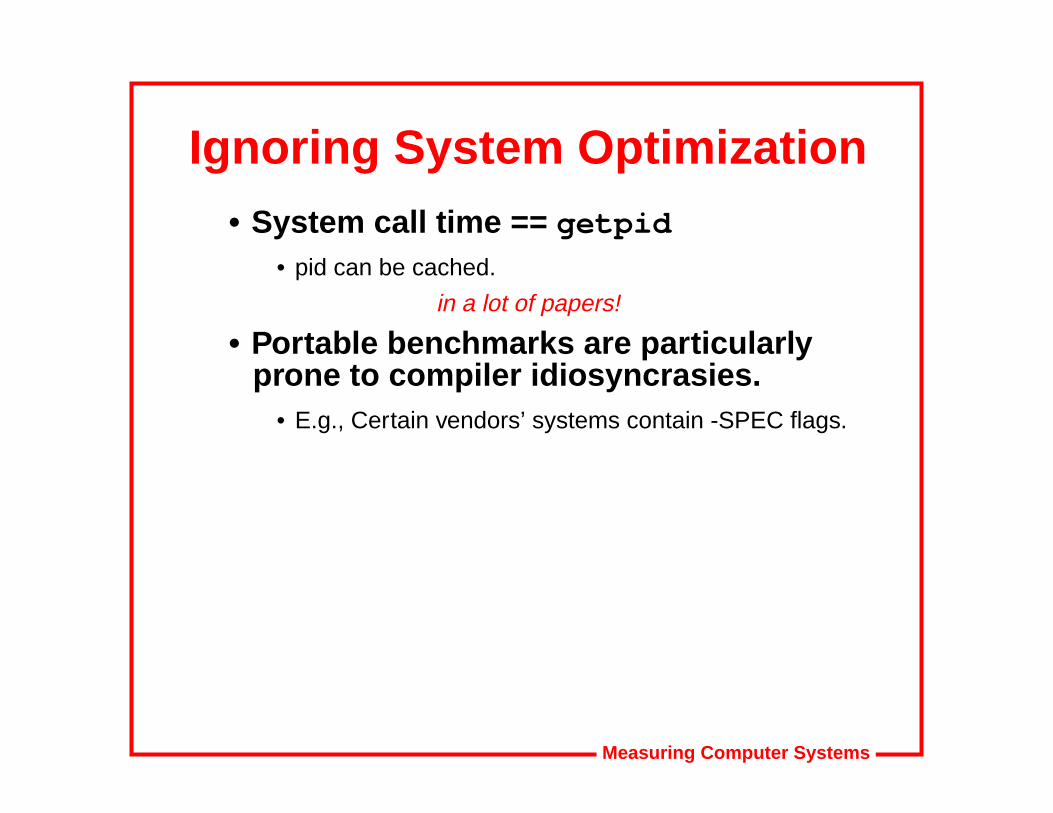
Ignoring System Optimization• System call time == getpid
• pid can be cached.
in a lot of papers!
• Portable benchmarks are particularlyprone to compiler idiosyncrasies.
• E.g., Certain vendors’ systems contain -SPEC flags.
Measuring Computer Systems
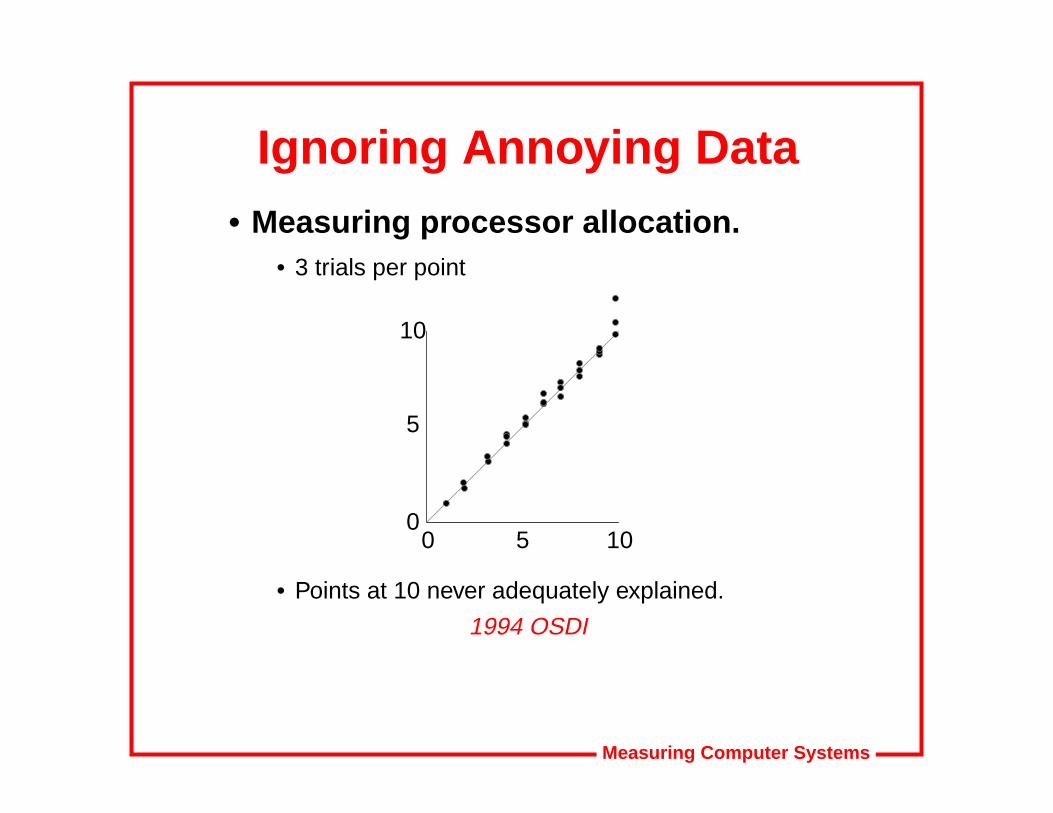
Ignoring Annoying Data• Measuring processor allocation.
• 3 trials per point
• Points at 10 never adequately explained.
1994 OSDI
00
5
5
10
10
Measuring Computer Systems
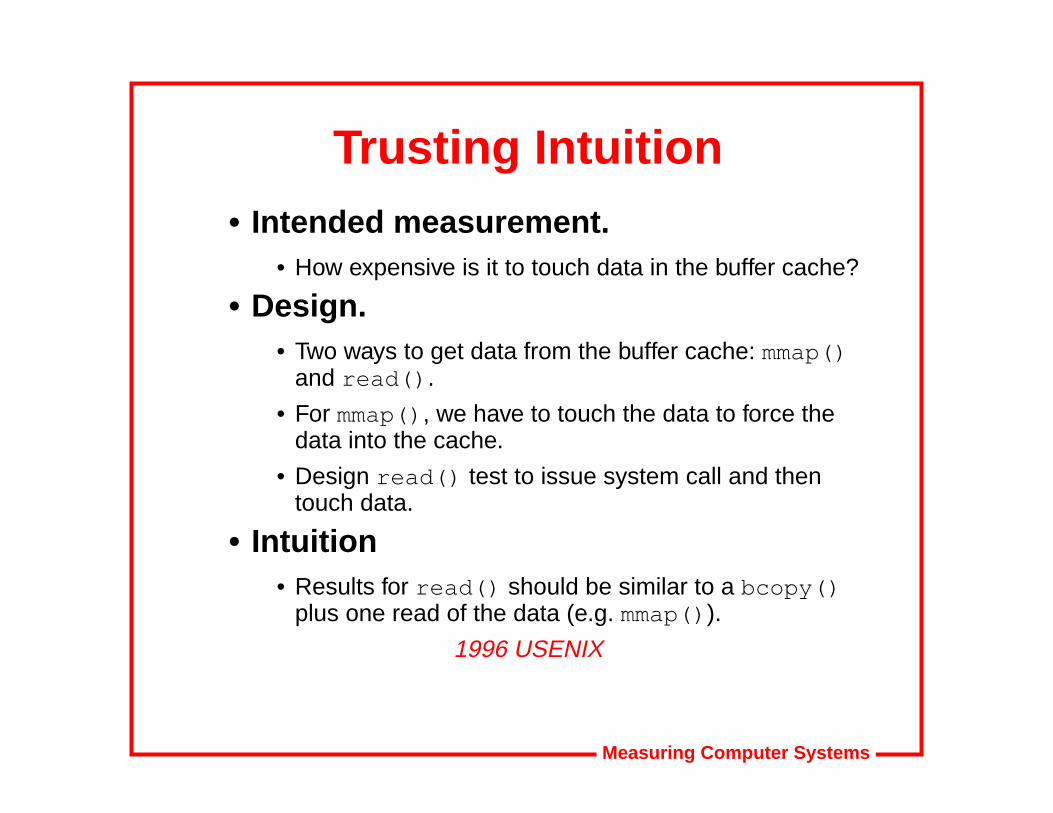
Trusting Intuition• Intended measurement.
• How expensive is it to touch data in the buffer cache?
• Design.• Two ways to get data from the buffer cache: mmap()
and read() .
• For mmap() , we have to touch the data to force thedata into the cache.
• Design read() test to issue system call and thentouch data.
• Intuition• Results for read() should be similar to a bcopy()
plus one read of the data (e.g. mmap() ).
1996 USENIX
Measuring Computer Systems
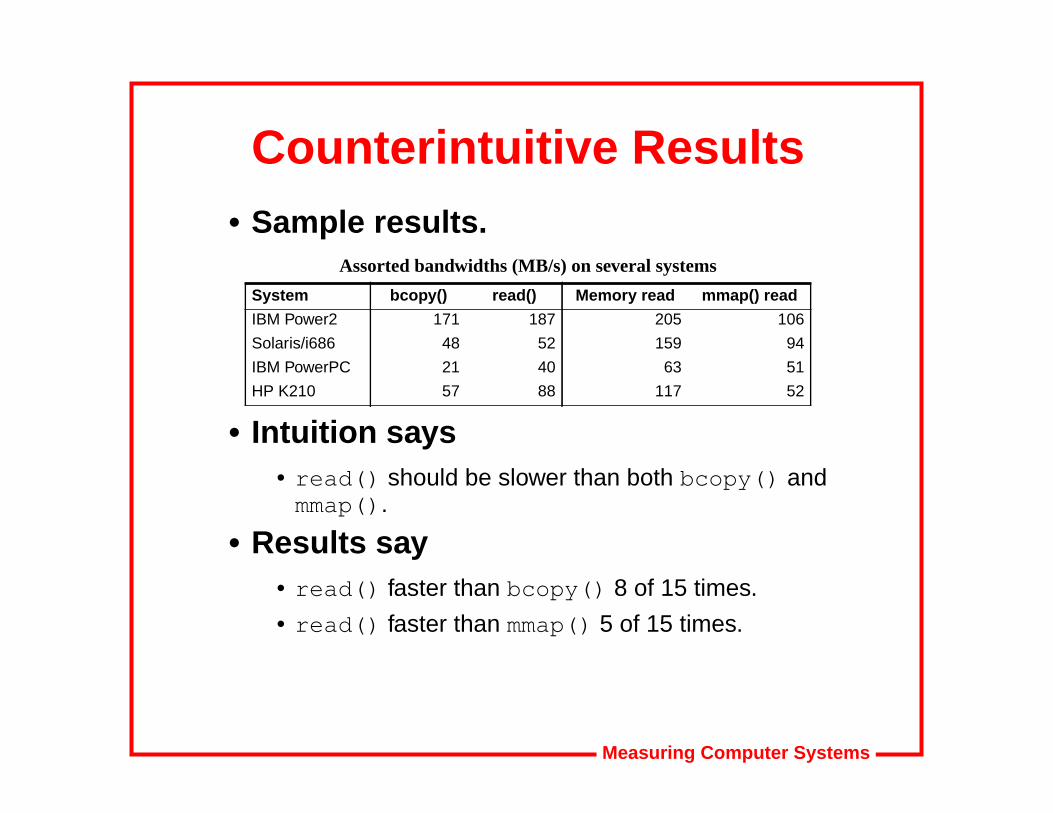
Counterintuitive Results• Sample results.
• Intuition says• read() should be slower than both bcopy() and
mmap() .
• Results say• read() faster than bcopy() 8 of 15 times.
• read() faster than mmap() 5 of 15 times.
Assorted bandwidths (MB/s) on several systems
System bcopy() read() Memory read mmap() read
IBM Power2 171 187 205 106
Solaris/i686 48 52 159 94
IBM PowerPC 21 40 63 51
HP K210 57 88 117 52
Measuring Computer Systems
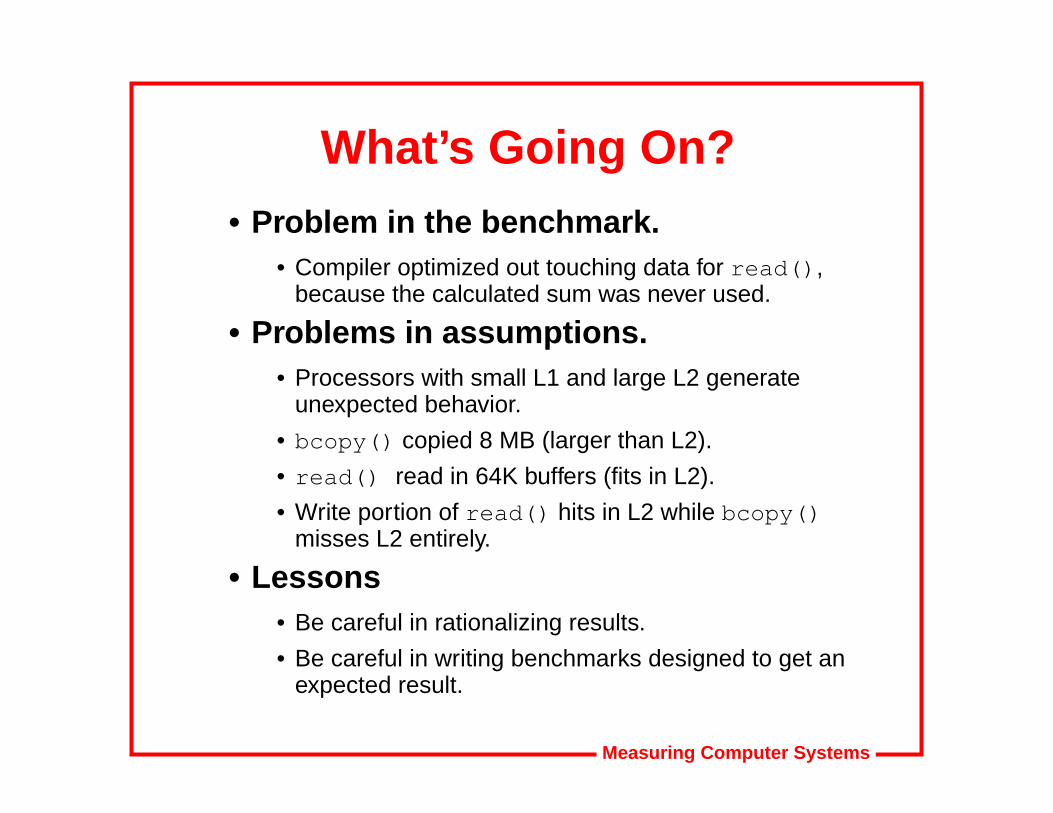
What’s Going On?• Problem in the benchmark.
• Compiler optimized out touching data for read() ,because the calculated sum was never used.
• Problems in assumptions.• Processors with small L1 and large L2 generate
unexpected behavior.
• bcopy() copied 8 MB (larger than L2).
• read() read in 64K buffers (fits in L2).
• Write portion of read() hits in L2 while bcopy()misses L2 entirely.
• Lessons• Be careful in rationalizing results.
• Be careful in writing benchmarks designed to get anexpected result.
Measuring Computer Systems
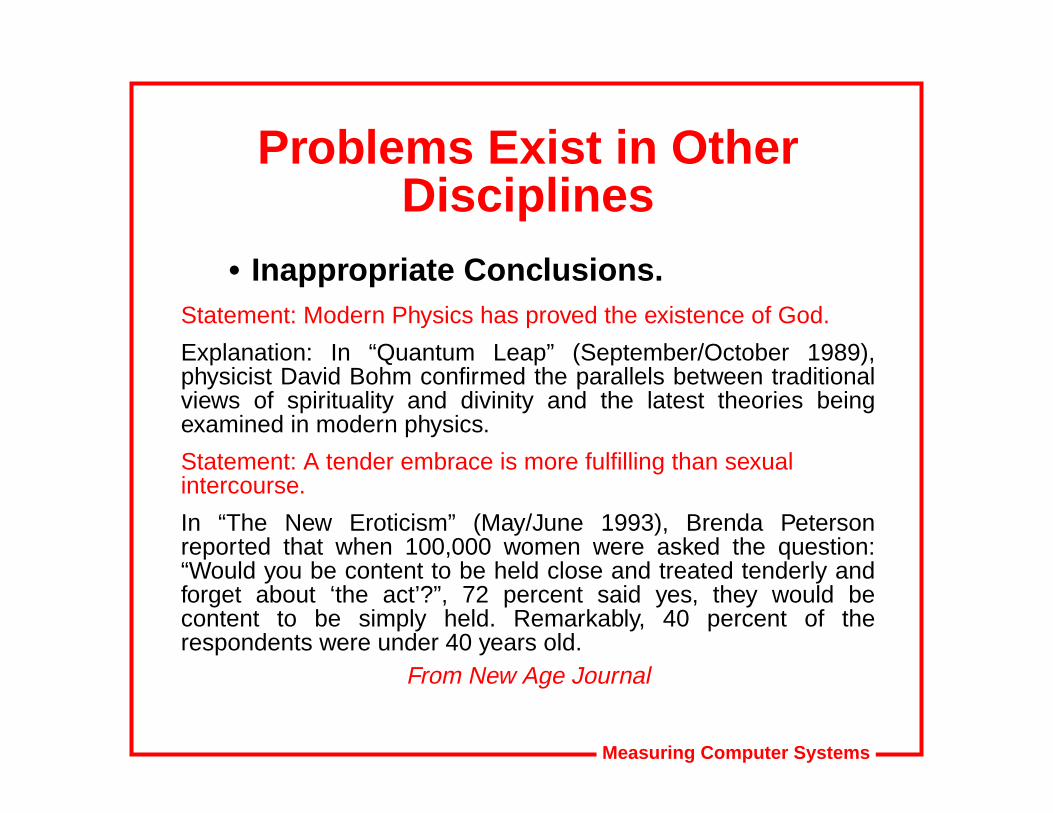
Problems Exist in OtherDisciplines
• Inappropriate Conclusions.Statement: Modern Physics has proved the existence of God.
Explanation: In “Quantum Leap” (September/October 1989),physicist David Bohm confirmed the parallels between traditionalviews of spirituality and divinity and the latest theories beingexamined in modern physics.
Statement: A tender embrace is more fulfilling than sexualintercourse.
In “The New Eroticism” (May/June 1993), Brenda Petersonreported that when 100,000 women were asked the question:“Would you be content to be held close and treated tenderly andforget about ‘the act’?”, 72 percent said yes, they would becontent to be simply held. Remarkably, 40 percent of therespondents were under 40 years old.
From New Age Journal
Measuring Computer Systems
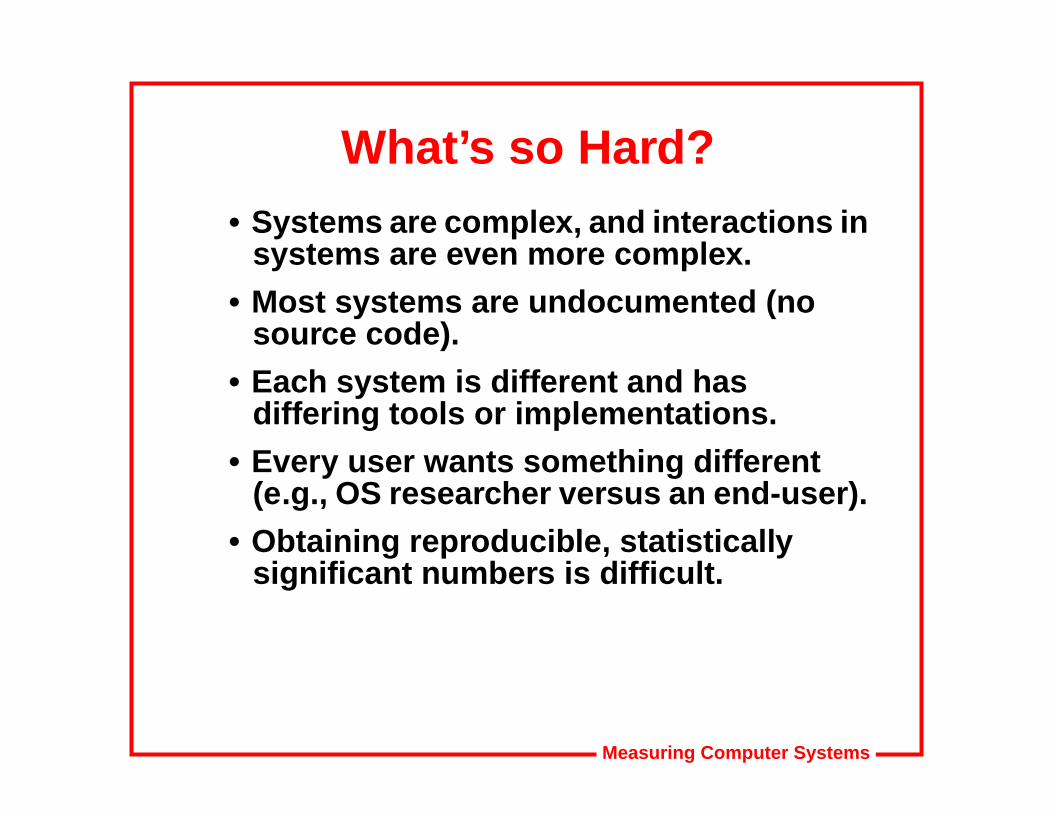
What’s so Hard?• Systems are complex, and interactions in
systems are even more complex.
• Most systems are undocumented (nosource code).
• Each system is different and hasdiffering tools or implementations.
• Every user wants something different(e.g., OS researcher versus an end-user).
• Obtaining reproducible, statisticallysignificant numbers is difficult.
Measuring Computer Systems
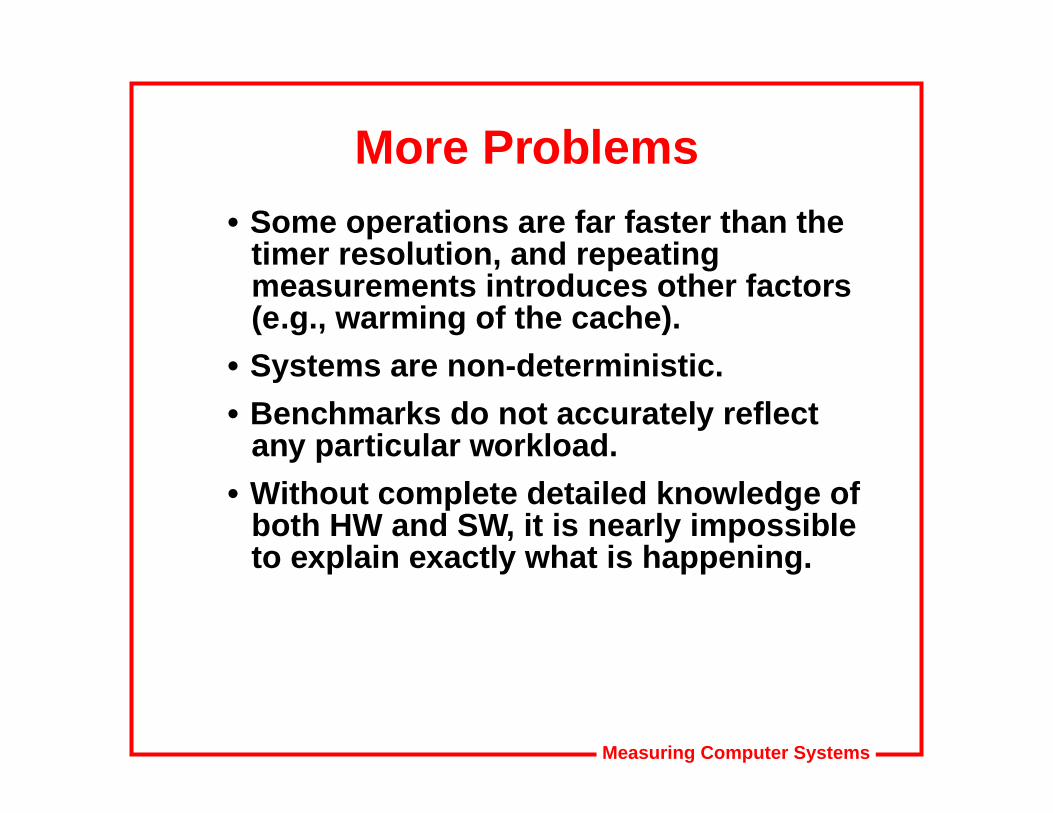
More Problems• Some operations are far faster than the
timer resolution, and repeatingmeasurements introduces other factors(e.g., warming of the cache).
• Systems are non-deterministic.
• Benchmarks do not accurately reflectany particular workload.
• Without complete detailed knowledge ofboth HW and SW, it is nearly impossibleto explain exactly what is happening.
Measuring Computer Systems
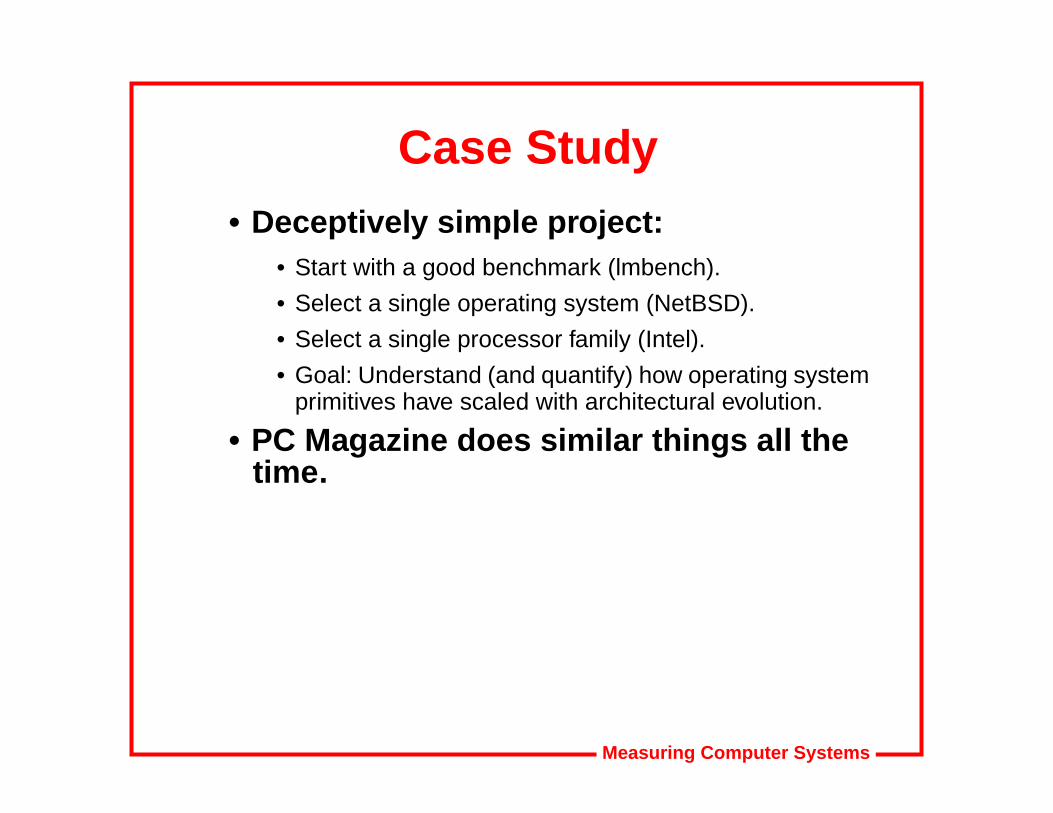
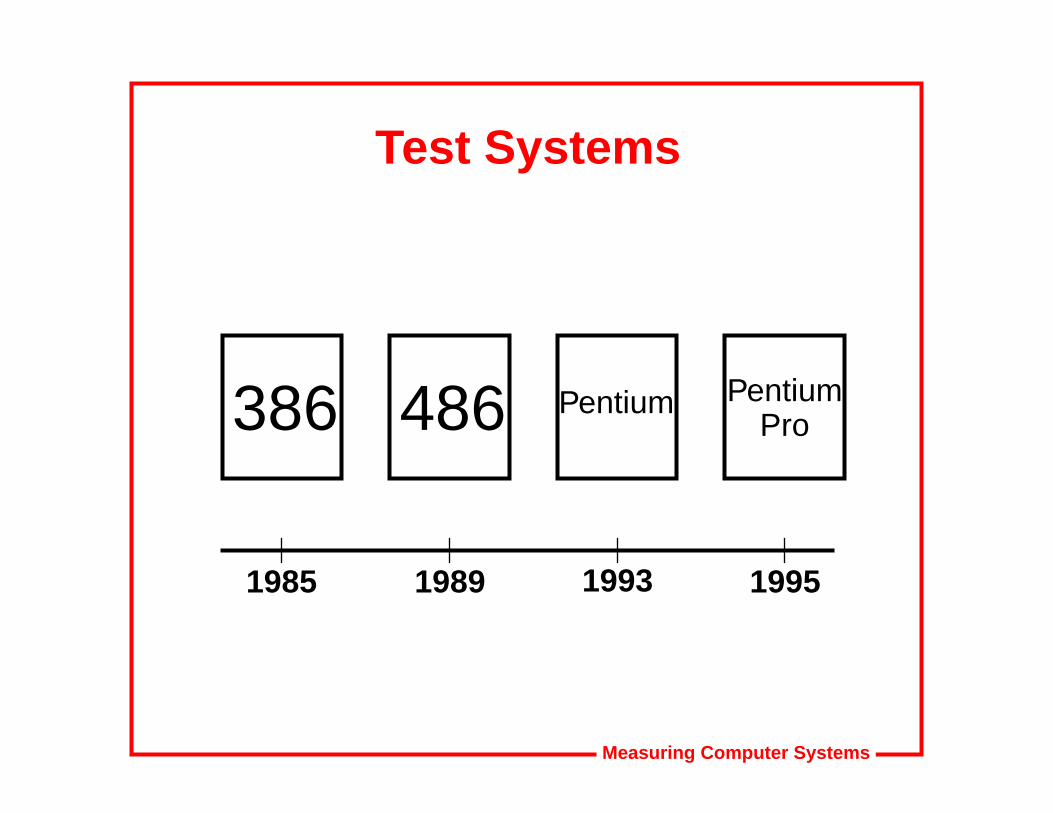
Case Study• Deceptively simple project:
• Start with a good benchmark (lmbench).
• Select a single operating system (NetBSD).
• Select a single processor family (Intel).
• Goal: Understand (and quantify) how operating systemprimitives have scaled with architectural evolution.
• PC Magazine does similar things all thetime.

Measuring Computer Systems
Good Benchmarking• Control variables.
• Same operating system.
• Identical benchmarks.
• Identical disk, executables, file system, etc.
• Vary the hardware.• Four processor generations (386–Pentium Pro).
• Five memory systems.
• Goal: explain each result in terms of itshardware dependencies.
Measuring Computer Systems
Test Systems
1985 1989 1993 1995
386 486 Pentium PentiumPro

Measuring Computer Systems
Evolution: 386–486
386Instructions
• 80386: 32-bit core
• max 33 MHz external bus
• non-pipelined, no on-chipcaches
486$L1
• 80486: 32-bit core
• max 33 MHz, 32-bitexternal bus
• pipelined, 8K L1 cacheon-chip

Measuring Computer Systems
Evolution: 486–Pentium
486$L1
• 80486: 32-bit core
• max 33 MHz, 32-bitexternal bus
• pipelined, 8K L1 cacheon-chip
Pentium
$L1
• Pentium: 32-bit core
• max 66 MHz, 64-bitexternal bus
• dual-issue superscalarpipelined

Measuring Computer Systems
Evolution: Pentium–Pro
Pentium
$L1
• Pentium: 32-bit core
• max 66 MHz, 64-bitexternal bus
• dual-issue superscalarpipelined
Pentium
$L1
Pro$L2 µOp
Generator
• Pentium Pro: 32-bit core
• max 66 MHz, 64-bit externalbus
• out-of-order RISC-like corewith 3 micro-op pipelines
• 16K L1 cache on-chip
• 256K or 512K L2 cache in the
Measuring Computer Systems
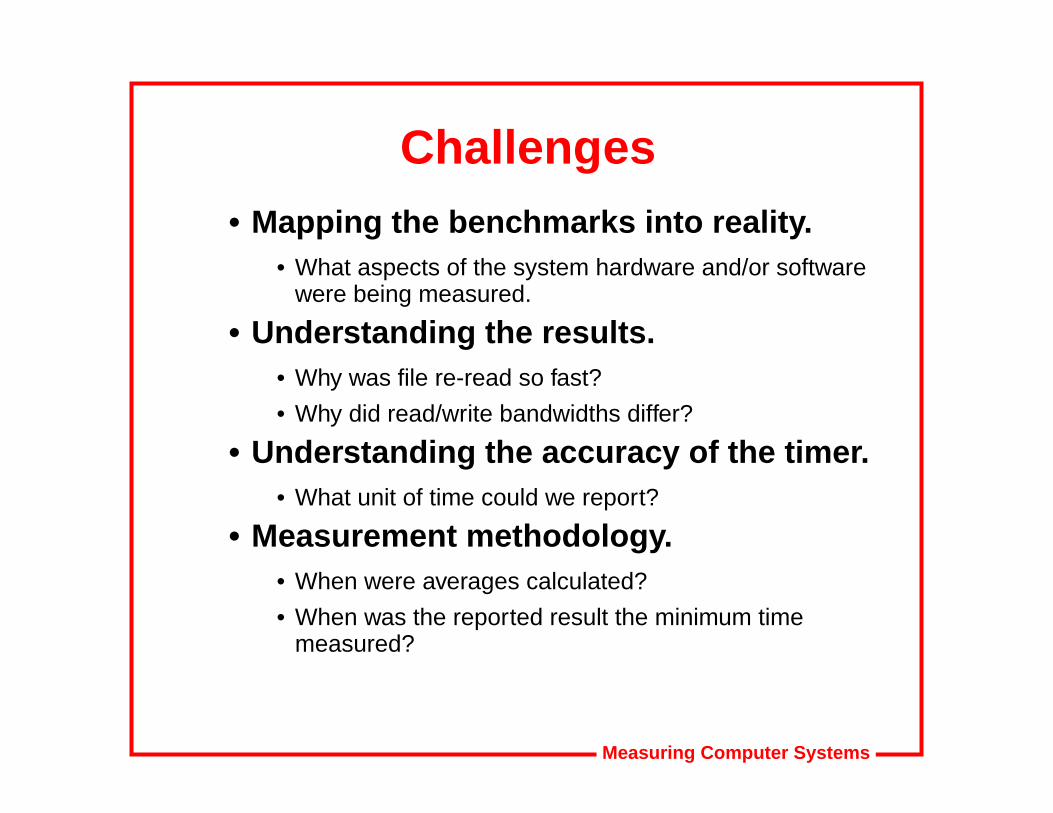
Challenges• Mapping the benchmarks into reality.
• What aspects of the system hardware and/or softwarewere being measured.
• Understanding the results.• Why was file re-read so fast?
• Why did read/write bandwidths differ?
• Understanding the accuracy of the timer.• What unit of time could we report?
• Measurement methodology.• When were averages calculated?
• When was the reported result the minimum timemeasured?

Measuring Computer Systems
More Challenges• Modifying things and keeping them
portable.
• Drawing high-level, useful observationsout of low-level benchmarks.
• Distinguishing between:• problems in the benchmark,
• odd hardware behavior, and,
• differing assumptions about what the benchmark wasmeasuring.
Measuring Computer Systems
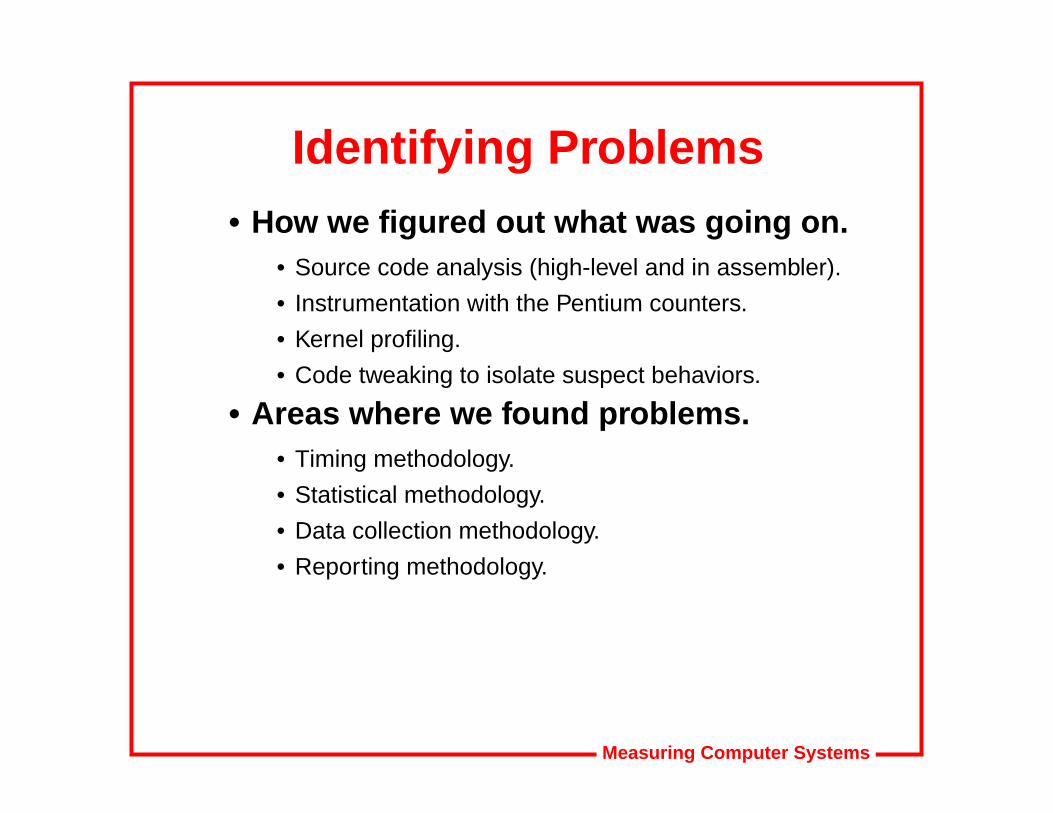
Identifying Problems• How we figured out what was going on.
• Source code analysis (high-level and in assembler).
• Instrumentation with the Pentium counters.
• Kernel profiling.
• Code tweaking to isolate suspect behaviors.
• Areas where we found problems.• Timing methodology.
• Statistical methodology.
• Data collection methodology.
• Reporting methodology.

Measuring Computer Systems
Fixing Problems• Timing.
• Internal, dynamically-sized loops.
• Support hardware counters/timers where available.
• Statistics.• Apply consistent policy (discard outliers, average rest).
• Data collection.• Standardize on array-index-style memory references.
• Revamp overhead calculations for consistency.
• Allow increased parameterization.
• Reporting.• Preserve all data; allow user to specify analysis policy.

Measuring Computer Systems
hBench:OShttp://www.eecs.harvard.edu/hbench
• Still warm cache results.
• Reproducible results (stability).
• Some things still unexplained.
• We understand the limits of what we canexplain with these benchmarks and whatwe cannot.
• Does not directly explain application performance.
• Micro-benchmark nature makes it difficult to drawuseful comparisons between different OS/hardwarecombinations.

Measuring Computer Systems
Explaining Results• Some phenomena are difficult to explain.
• Architecture-specific counters help, but introduceportability problems.
• Difficult to verify hypotheses.
• Architecture manuals are never as complete as onewould like.
• Example:• Pentium-Pro demonstrates 3x performance differential
between memory read and write performance.
Measuring Computer Systems
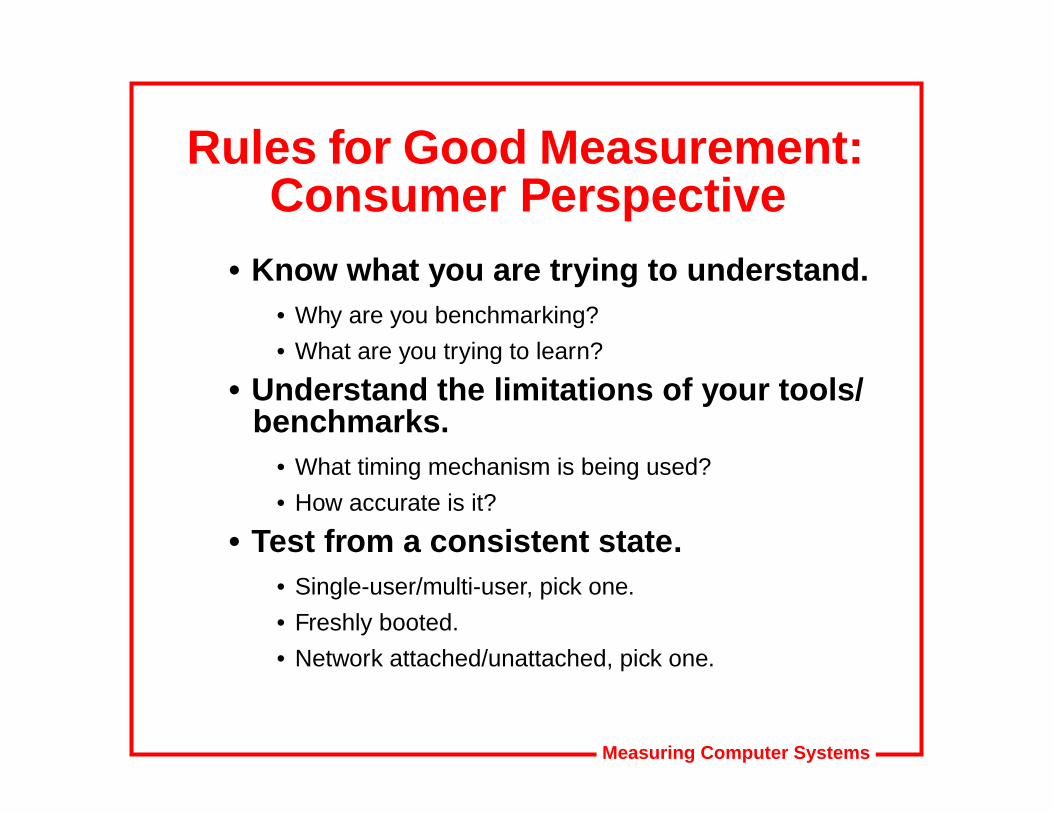
Rules for Good Measurement:Consumer Perspective
• Know what you are trying to understand.• Why are you benchmarking?
• What are you trying to learn?
• Understand the limitations of your tools/benchmarks.
• What timing mechanism is being used?
• How accurate is it?
• Test from a consistent state.• Single-user/multi-user, pick one.
• Freshly booted.
• Network attached/unattached, pick one.
Measuring Computer Systems
Consumer Perspective (2)• Find the causes of your results.
• Pay particular attention to the anomalies.
• Make sure they are real anomalies, not measurementglitches.
• Assume first that it’s something in your system.
• When all else fails, consider that the benchmark mightbe at fault.
• Real anomalies are often likely to giveyou real data.
• Cross reference results as much as possible.
• Compare two different benchmark results.
• Tweak variables to see if hypotheses are valid.
Measuring Computer Systems
Consumer Perspective (3)• Synthesize your results to ensure a
coherent and believable picture.• Which of your conclusions can be proven?
• Which are conjectures?

Measuring Computer Systems
Benchmark DesignerPerspective
• Preserve all data.• Summaries are useful.
• Raw data must be available for more detailed analysis.
• Portability• Be precise about what cross-platform conclusions you
can accurately draw.
• Know whether you are stating something about thehardware, the operating system, the compiler, or anapplication.
• Understand what you lose by portability (e.g., detailedcounter measurements).

Measuring Computer Systems
Designer Perspective (2)• Pick a consistent methodology.
• Measurement.
• Reporting.
• Data collection.
• Timing.
• Benchmark structure.
• Isolate variables to the extent possible.• Makes it easier to explain results.
• Encourages/enables testing of hypotheses.
• Know your audience• Identify the target audience (e.g., researchers, end-
users, vendors).
Measuring Computer Systems
Designer Perspective (3)• Articulate exactly what your results
mean.• What is a SPECmark?
• How can someone use your results?
• How should (shouldn’t) they use your results?
• Tell the user how to interpret the results.
• Think about data presentation.
• Know what you are measuring (andensure that it’s what you intended tomeasure).
Measuring Computer Systems
Designer Perspective (4)• Show meaningful examples and
comparisons.• Comparing Windows NT on the Pentium versus the
Pentium Pro will tell you something about hardware.
• Comparing Windows NT to Windows 3.1 on thePentium will tell you something about software.
• Comparing Windows NT on a Pentium to Solaris on aSPARCstation doesn’t tell you much about anything.
• Use the smallest effective difference.• Edward Tufte’s “The Visual Display of Quantitative
Information.”

Measuring Computer Systems
Lessons to Take Away• Measurement is important; do it
carefully.
• Don’t be dazzled by bad numbers (even ifthere are a lot of them).
• Understand what a number means beforeyou publish, quote, or reference it.
• Apply the principle of smallest effectivedifference.
• Measurement is more than a marketingploy; it’s serious science, not an art.