Embed Size (px)
Citation preview

ON MEASURING THE COMPLEXITY OF
URBAN LIVING
Lubna HasanPakistan Institute of Development Economics31 Oct 2007
Measuring Complexity
Cities are the prime agents of development
Cities face many challenges owing to urbanization and globalization
Need to measure and monitor cities
City rankings are a useful tool to monitor progress.
The ‘Stylized Facts’ of Urban Economics
Cities are centers of economic, social and cultural activities.
From being “isolated seats of power from where to govern rural holdings,” cities have become the ultimate abode of humanity”.
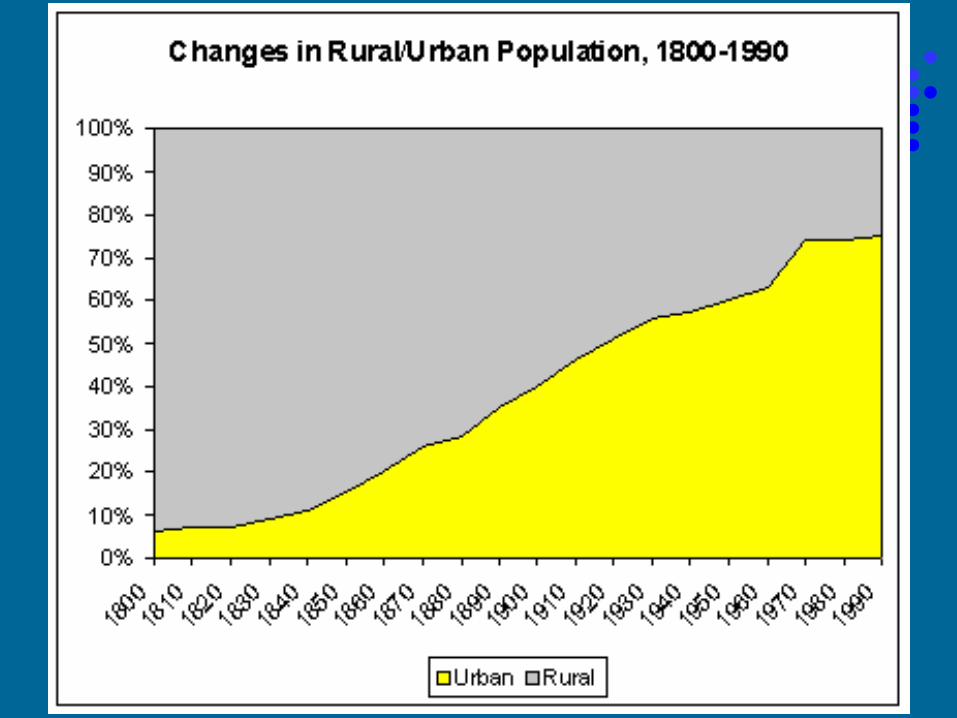
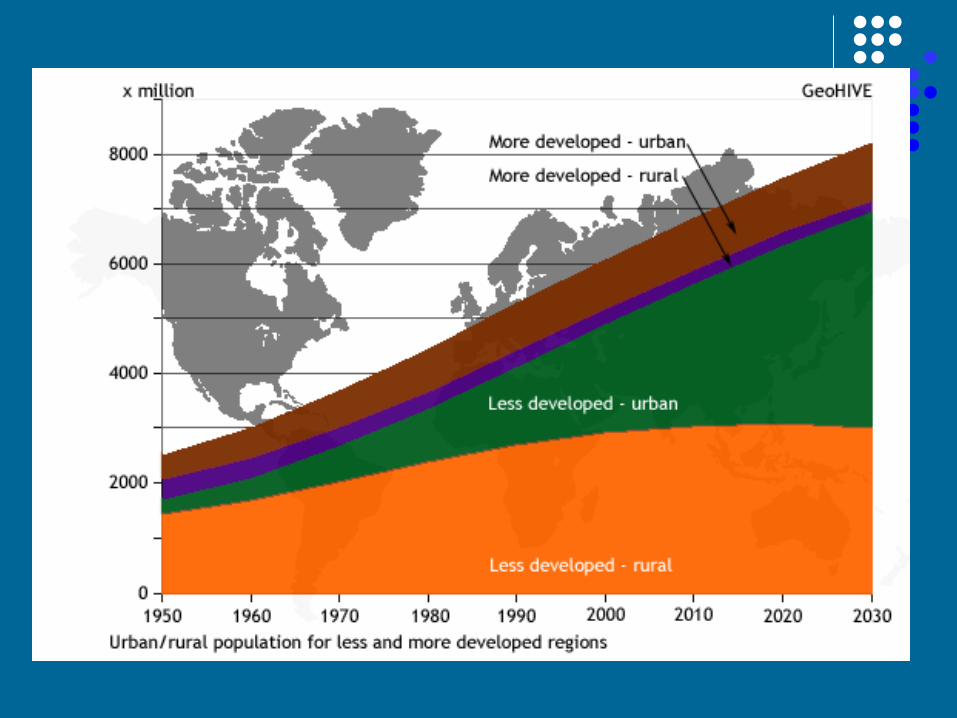


The ‘Stylized Facts’ of Urban Economics
“As countries develop, urban settlements account for a larger share of national income”.
The Economics of Cities
New York, Los Angeles, Chicago, Boston, and Philadelphia together constitute the fourth largest economy in the world.
Sao Paulo and Bangkok hold about 10% of the total population but account for about 40% of the GDP.
Per capita income in African cities is 65% higher than the national average.

The Economics of Cities
1. Frankfurt . . . . . . . . . . . 68,9472. Karlsruhe . . . . . . . . . . . 64,9033. Paris . . . . . . . . . . . . . 62,2204. Munich . . . . . . . . . . . . 56,8135. Dusseldorf . . . . . . . . . . 50,048
(In million dollars)

The Economics of Cities
Cities are the “super markets for employment, incubator of technology, suppliers of social services and shelter, portals to the rest of the world, processors of agriculture produce, adders of manufactured value, places to make money through trade, industry, finance, real state”
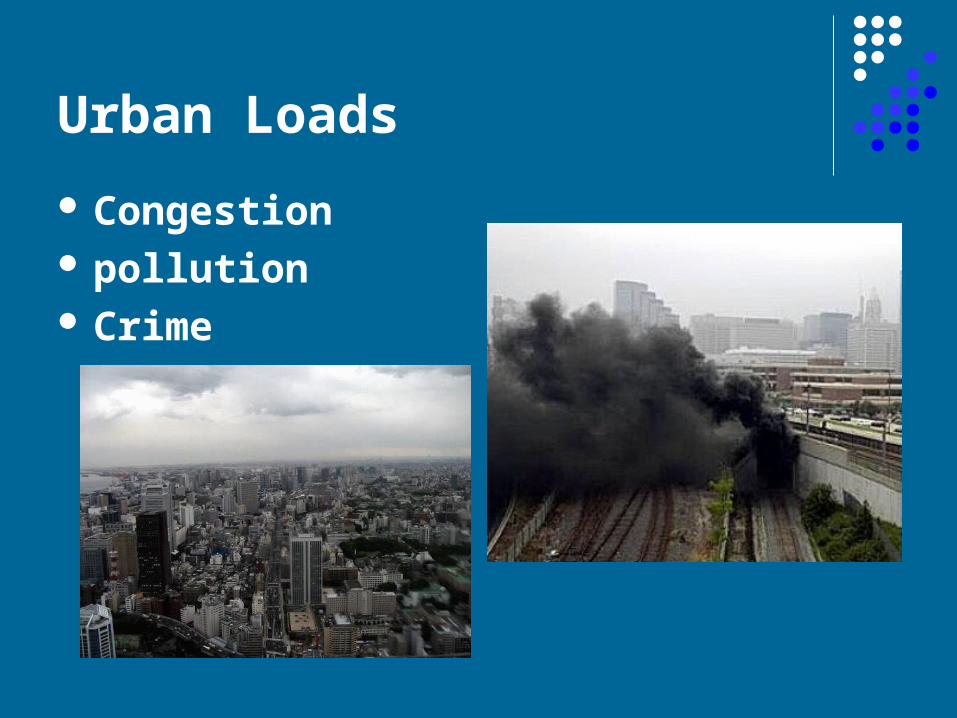
Urban Loads
Congestion pollution Crime

The ‘Stylized Facts’ of Urban Economics
Globalization of economic activity has put cites in a new set of relation vis-à-vis capital.

City Competition - the New Reality
City branding has become a ‘must do’ for cities. In today’s globalised, networked world, every place has to compete with every other place for its share of the world’s consumers, tourists, businesses, investment, capital, respect and attention. Cities are increasingly the focus of this international competition.
City Marketing
Zurich is the world’s best city to live in (Mercer Consulting 2006).
London, New York, Oslo, Tokyo and Zurich are the most expensive cities, while Swiss cities house the highest earners in the world (UBS 2006).
London and Paris are the best cities to locate businesses (European Cities Monitor 2005).
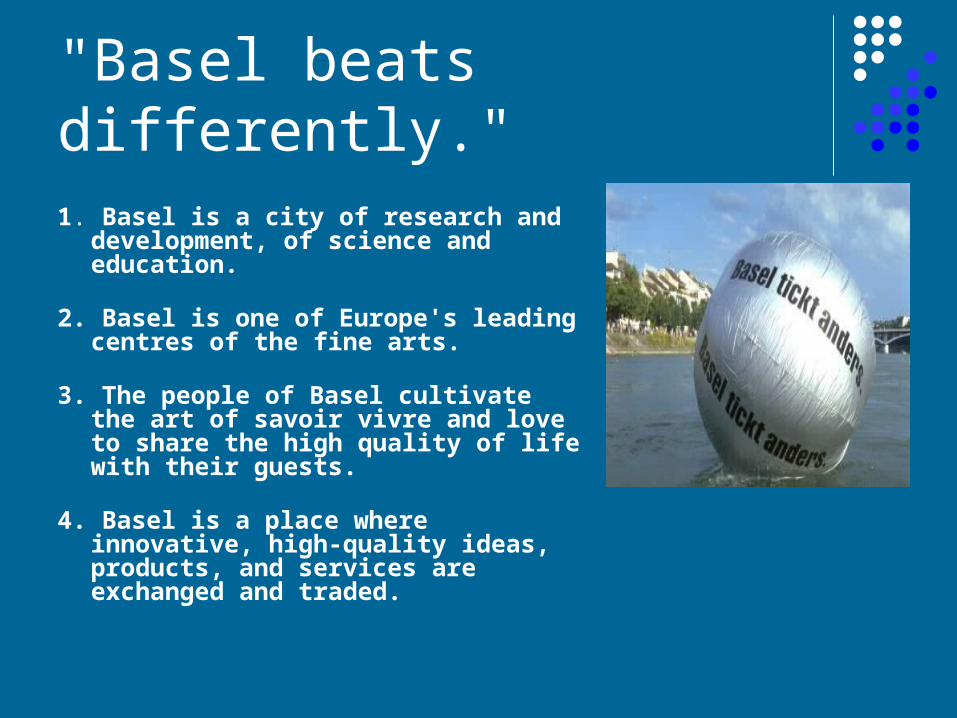
"Basel beats differently."
1. Basel is a city of research and development, of science and education.
2. Basel is one of Europe's leading centres of the fine arts.
3. The people of Basel cultivate the art of savoir vivre and love to share the high quality of life with their guests.
4. Basel is a place where innovative, high-quality ideas, products, and services are exchanged and traded.

Quality of life
With a thriving economy, a stable political system, Austria's beauty and cultural diversity all contribute to a high-quality of lifestyle for locals and tourists alike.
Austria's capital Vienna ranks as one of the most attractive cities world wide. The feeling of well-being enjoyed by locals and tourists has been repeatedly confirmed by leading international studies and city rankings.
Vienna - 4th place in a world wide quality of life survey

Visit VancouverRecognition & Awards
2004: Vancouver voted Top City in Americas by Conde Nast Traveler.
2003: Mercer Human Resource Consulting rates Vancouver as top city in North America for quality of life.
2002: Vancouver ties with Melbourne as the Top City to live within the Economist Intelligence Unit survey.

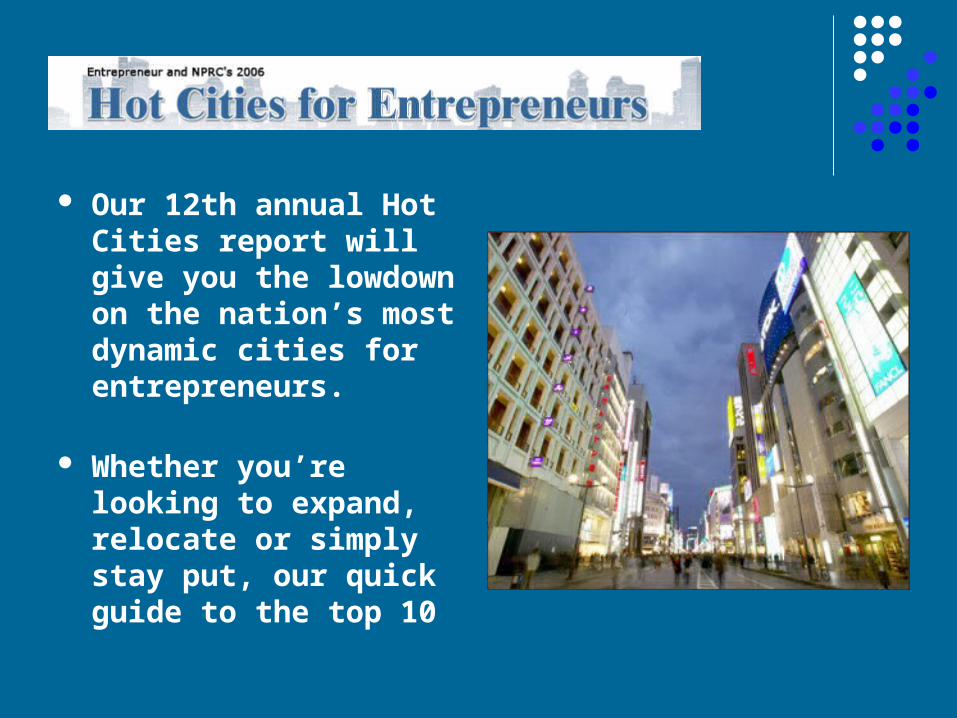
Our 12th annual Hot Cities report will give you the lowdown on the nation’s most dynamic cities for entrepreneurs.
Whether you’re looking to expand, relocate or simply stay put, our quick guide to the top 10
Developing World Cities in Global Competition
Shanghai most favorite destination for European investors.
Beijing, Mumbai and Mexico City follow Suite.

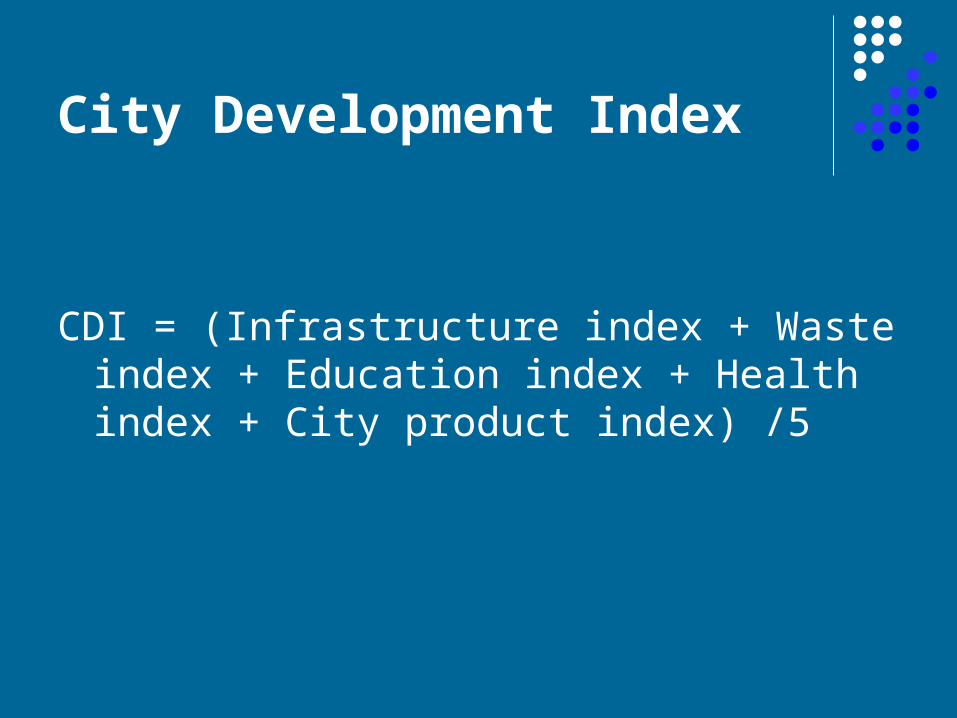
City Development Index
CDI = (Infrastructure index + Waste index + Education index + Health index + City product index) /5

Infrastructure = 25 x Water connections + 25 x Sewerage + 25 x Electricity + 25 x Telephone
Waste = Wastewater treated x 50 + Formal solid waste disposal x 50
Health = (Life expectancy – 25) x 50/60 + (32 – Child mortality) x 50/31.92
Education = Literacy x 25 + Combined enrolment x 25
Product = (log City product -4.61) x 100/5.99
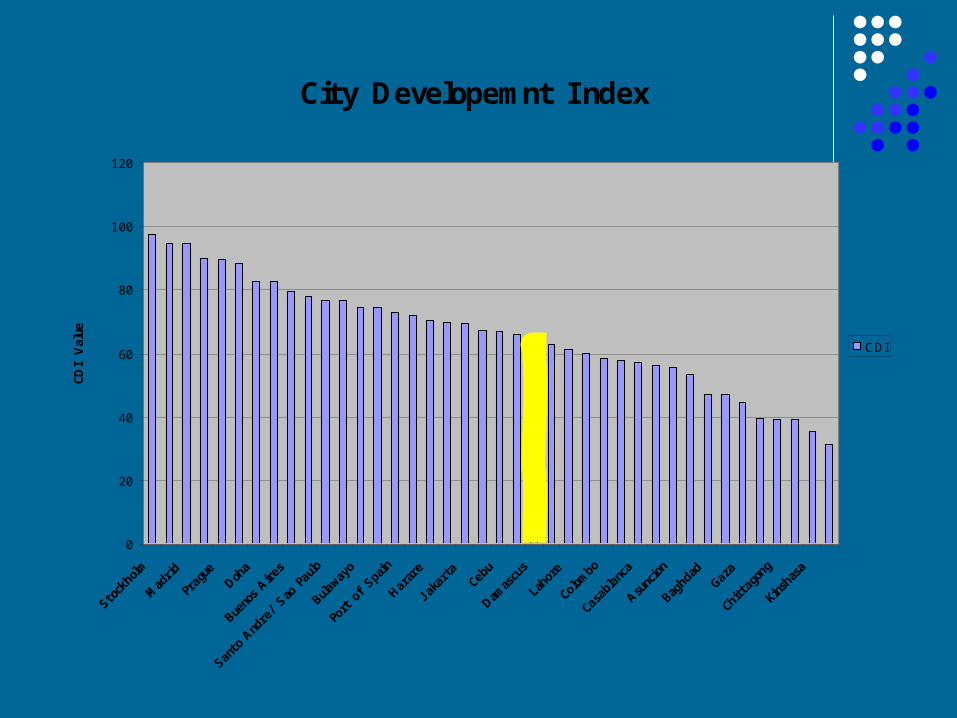
City Developemnt I ndex
0
20
40
60
80
100
120
Stoc
kholm
Mad
rid
Prag
ueDoh
a
Buen
os A
ires
Sant
o And
re/ Sao
Pau
lo
Bulawa
yo
Port o
f Sp
ain
Harar
e
J aka
rta
Cebu
Damas
cus
Laho
re
Colom
bo
Casa
blan
ca
Asunc
ion
Bagh
dad
Gaza
Chitt
agon
g
Kins
hasa
CDI
Val
ue
CDI
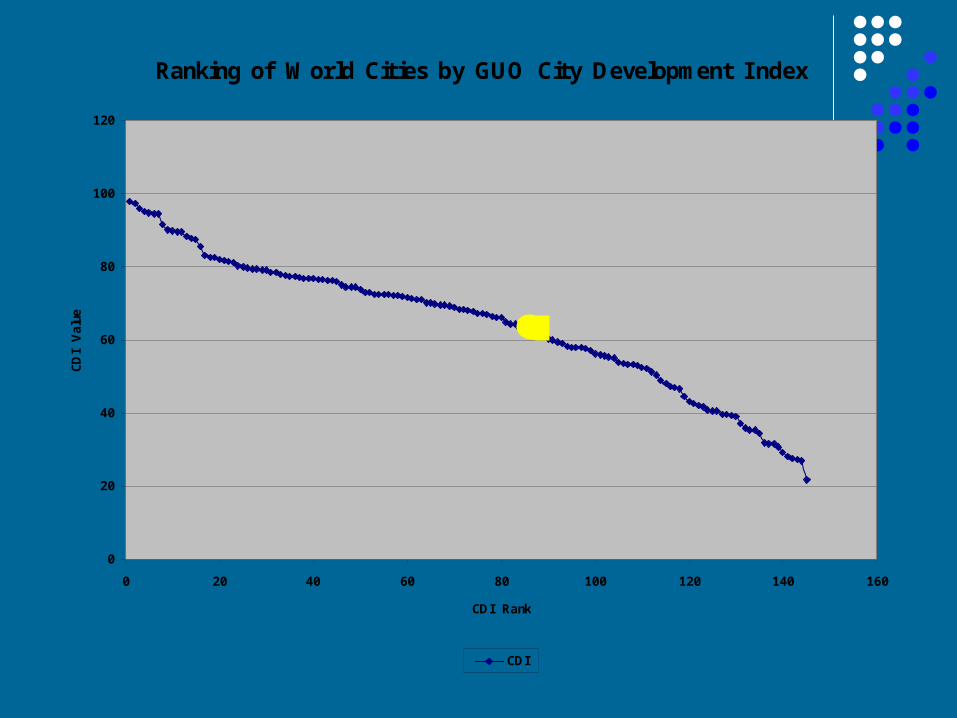
Ranking of World Cities by GUO City Development I ndex
0
20
40
60
80
100
120
0 20 40 60 80 100 120 140 160
CDI Rank
CDI
Val
ue
CDI

Connectivity I ndex
0
20
40
60
80
100
120
Connectivity
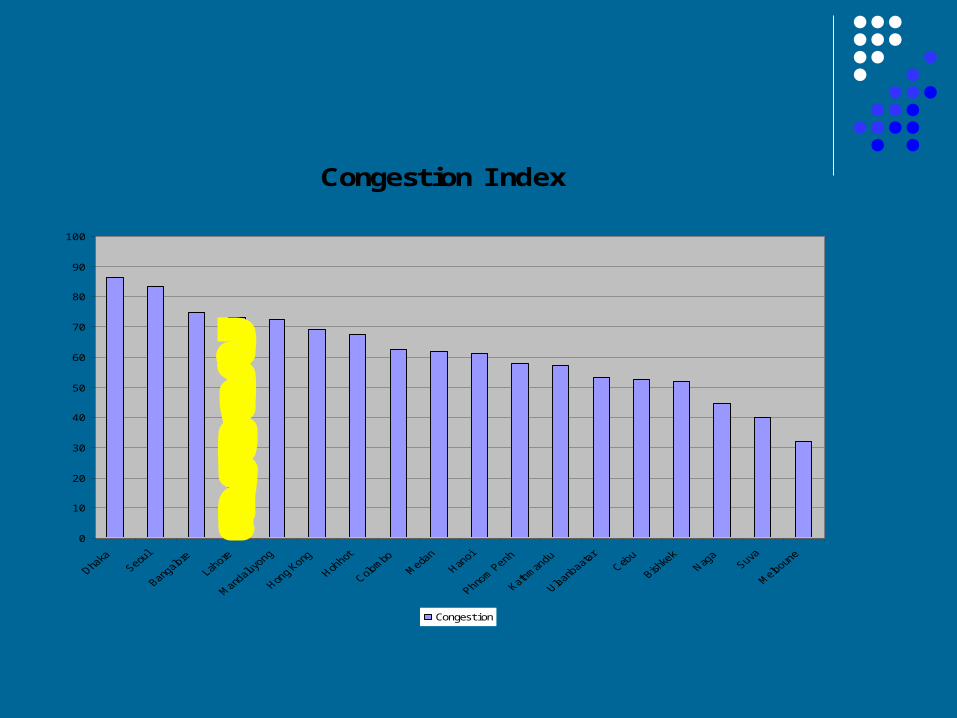
Congestion I ndex
0
10
20
30
40
50
60
70
80
90
100
Congestion
Jamal, Khan, Toor and Amir (2003) rank districts of Pakistan on the basis of deprivation indices. These indices are based on education, housing quality and congestion, residential housing services and employment sectors and are constructed from Population and Housing Census data of 1998.

Pasha et al (1998) develop a district ranking system for Pakistan based on economic and social development. The social development indicator includes education, health and water supply. Whereas, the economic development indicators includes income and wealth, agriculture, housing conditions, transport and labor.
Hussain (2003) has also calculated Human Development Index at the district level for Pakistan, following the same methodology as used in the construction of cross country HDI.
Measuring Pakistani Cities
At present, there is no country-wide system for measuring cities and city life in Pakistan.
The only efforts at measuring cities – UN-Habitat’s Global Urban Indicators Program and ADB Cities Data Book - have limited scope.
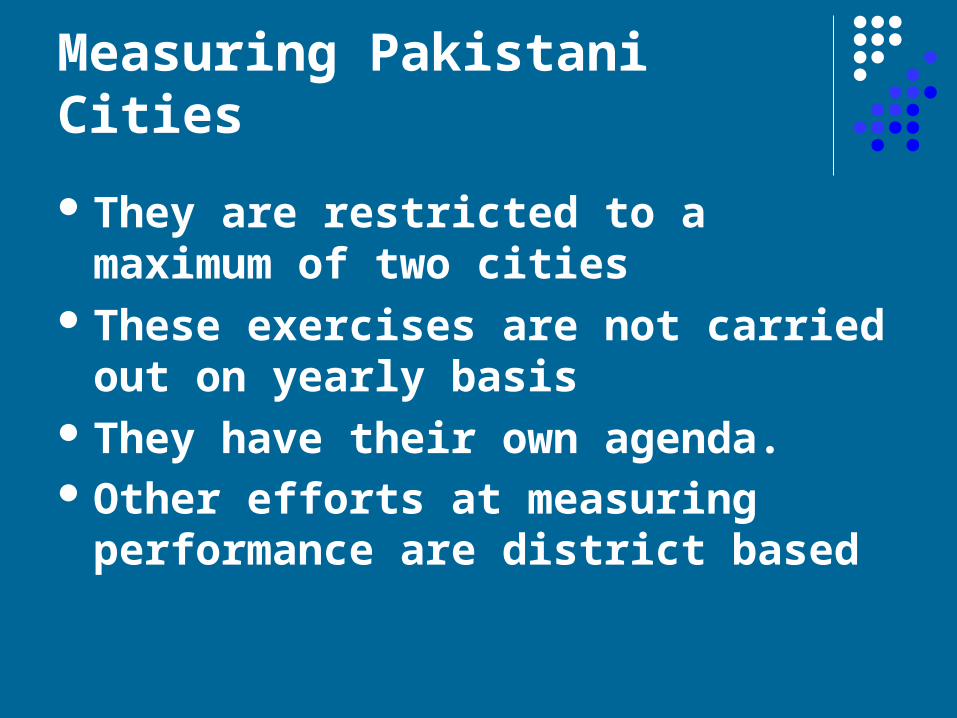
Measuring Pakistani Cities
They are restricted to a maximum of two cities
These exercises are not carried out on yearly basis
They have their own agenda.Other efforts at measuring
performance are district based

Measuring Pakistani Cities
Make city as the relevant unit of analysis
Develop a city ranking system for Pakistan
Extend GUIP to major cities of Pakistan
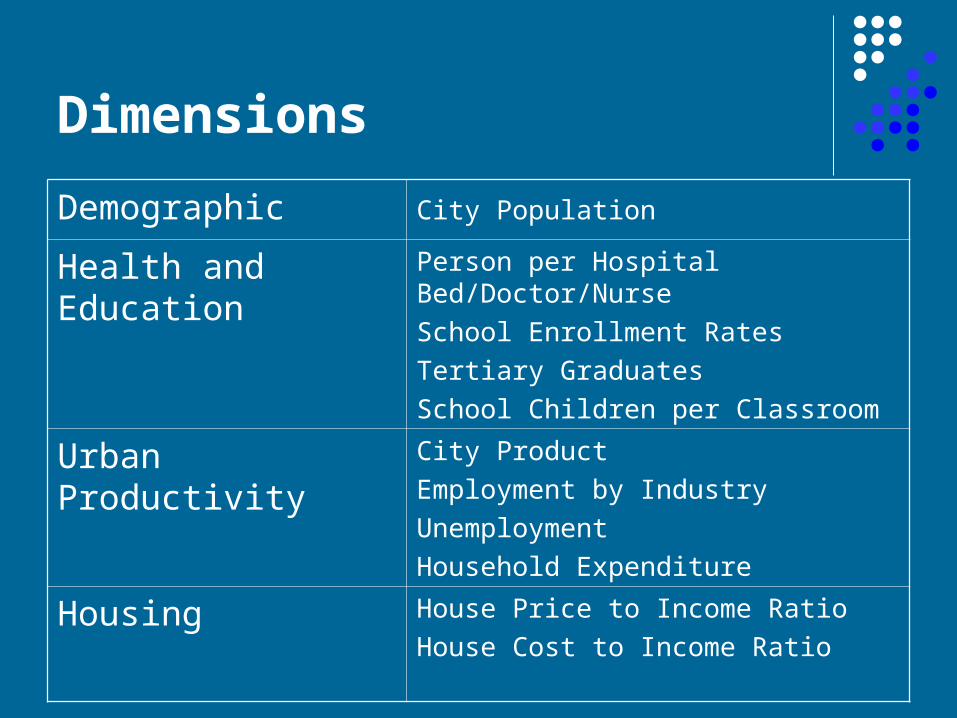
Dimensions
Demographic City Population
Health and Education
Person per Hospital Bed/Doctor/NurseSchool Enrollment RatesTertiary GraduatesSchool Children per Classroom
Urban Productivity City ProductEmployment by IndustryUnemploymentHousehold Expenditure
Housing House Price to Income RatioHouse Cost to Income Ratio
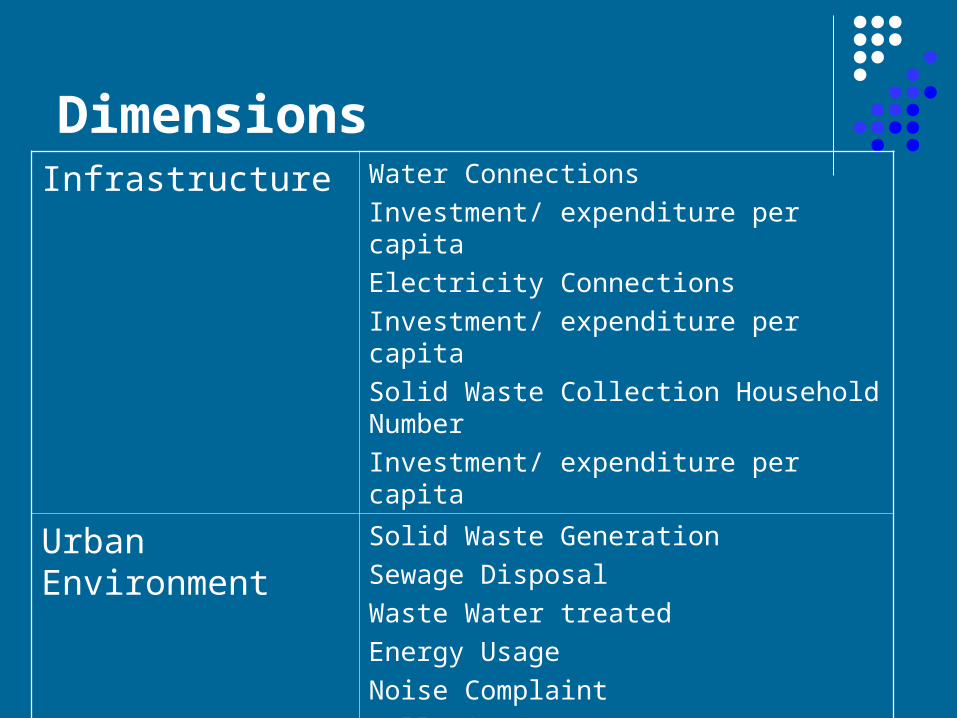
DimensionsInfrastructure Water Connections
Investment/ expenditure per capitaElectricity ConnectionsInvestment/ expenditure per capitaSolid Waste Collection Household NumberInvestment/ expenditure per capita
Urban Environment
Solid Waste GenerationSewage DisposalWaste Water treatedEnergy UsageNoise ComplaintPollution
Solid Waste Collection

Dimensions
Urban Transport Travel TimeExpenditure on RoadsRoad CongestionAutomobile Ownership
Culture News apers/MediaCultural Events/AttendanceMuseums/Attendance
Public Safety Crimes
New Technology
Telephone ConnectionsInternet Connections

Dimensions
Urban Land Vacant Government LandVacant Land with Planning PermissionPublic Open SpacePrime Commercial Land PricePrime Rental Cost
Urban Governance Functions of Local governmentAnnual Plans
Voters Participation
![Measuring the Project Management Complexity: The Case of ... · Complexity such as Geraldi et al. [], Bosch-Rekveld et al. [], and Chapman[],whicharebasedonasystematicreviewofthe](https://img.pdfslide.us/doc/110x75/60d808432185cc5ab54c6ac8/measuring-the-project-management-complexity-the-case-of-complexity-such-as.jpg)