Embed Size (px)
Citation preview
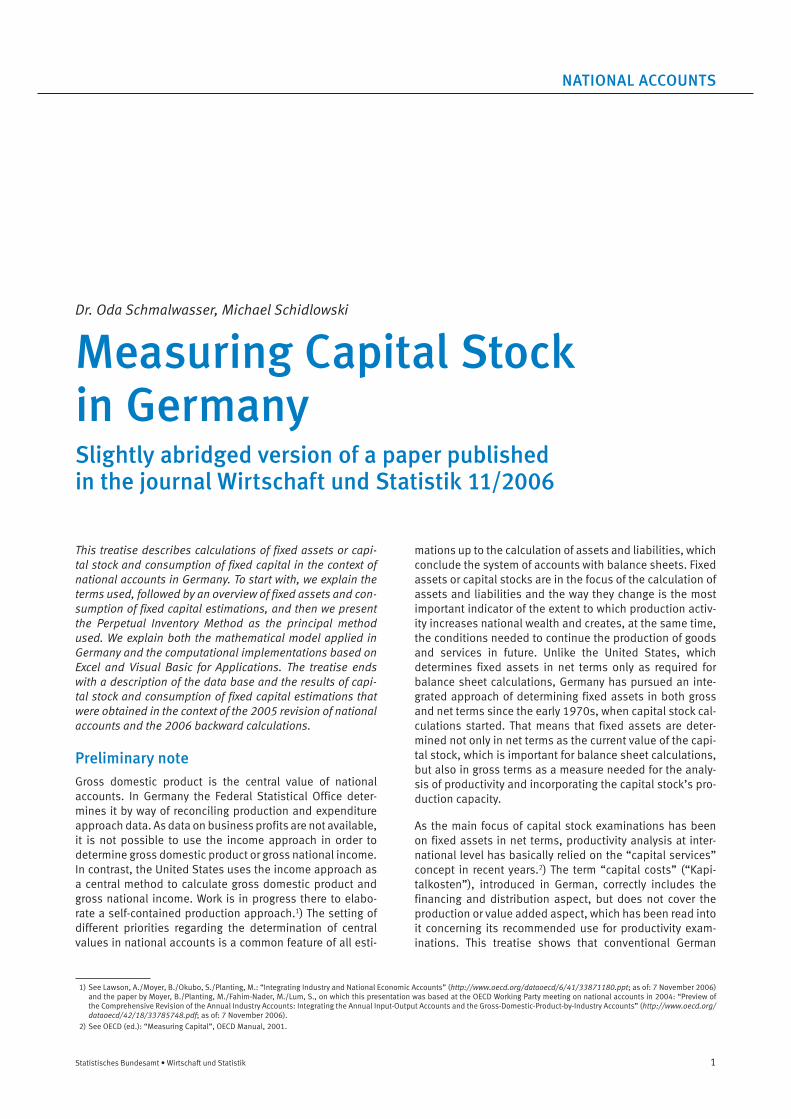
NATIONAL ACCOUNTS
Statistisches Bundesamt • Wirtschaft und Statistik 1
This treatise describes calculations of fixed assets or capi-tal stock and consumption of fixed capital in the context of national accounts in Germany. To start with, we explain the terms used, followed by an overview of fixed assets and con-sumption of fixed capital estimations, and then we present the Perpetual Inventory Method as the principal method used. We explain both the mathematical model applied in Germany and the computational implementations based on Excel and Visual Basic for Applications. The treatise ends with a description of the data base and the results of capi-tal stock and consumption of fixed capital estimations that were obtained in the context of the 2005 revision of national accounts and the 2006 backward calculations.
Preliminary note Gross domestic product is the central value of national accounts. In Germany the Federal Statistical Office deter-mines it by way of reconciling production and expenditure approach data. As data on business profits are not avail able, it is not possible to use the income approach in order to determine gross domestic product or gross national income. In contrast, the United States uses the income approach as a central method to calculate gross domestic product and gross national income. Work is in progress there to elabo-rate a self-contained production approach.1) The setting of different priorities regarding the determination of central values in national accounts is a common feature of all esti-
mations up to the calculation of assets and liabilities, which conclude the system of accounts with balance sheets. Fixed assets or capital stocks are in the focus of the calculation of assets and liabilities and the way they change is the most important indicator of the extent to which production activ-ity increases national wealth and creates, at the same time, the conditions needed to continue the production of goods and services in future. Unlike the United States, which determines fixed assets in net terms only as required for balance sheet calculations, Germany has pursued an inte-grated approach of determining fixed assets in both gross and net terms since the early 1970s, when capital stock cal-culations started. That means that fixed assets are deter-mined not only in net terms as the current value of the capi-tal stock, which is important for balance sheet calculations, but also in gross terms as a measure needed for the analy-sis of productivity and incorporating the capital stock’s pro-duction capacity.
As the main focus of capital stock examinations has been on fixed assets in net terms, productivity analysis at inter-national level has basically relied on the “capital services” concept in recent years.2) The term “capital costs” (“Kapi-talkosten”), introduced in German, correctly includes the financing and distribution aspect, but does not cover the production or value added aspect, which has been read into it concerning its recommended use for productivity exam-inations. This treatise shows that conventional German
Dr. Oda Schmalwasser, Michael Schidlowski
Measuring Capital Stock in GermanySlightly abridged version of a paper publishedin the journal Wirtschaft und Statistik 11/2006
1) See Lawson, A./Moyer, B./Okubo, S./Planting, M.: “Integrating Industry and National Economic Accounts” (http://www.oecd.org/dataoecd/6/41/33871180.ppt; as of: 7 November 2006) and the paper by Moyer, B./Planting, M./Fahim-Nader, M./Lum, S., on which this presentation was based at the OECD Working Party meeting on national accounts in 2004: “Preview of the Comprehensive Revision of the Annual Industry Accounts: Integrating the Annual Input-Output Accounts and the Gross-Domestic-Product-by-Industry Accounts” (http://www.oecd.org/dataoecd/42/18/33785748.pdf; as of: 7 November 2006).
2) See OECD (ed.): “Measuring Capital”, OECD Manual, 2001.

NATIONAL ACCOUNTS
2 Statistisches Bundesamt • Wirtschaft und Statistik
fixed assets calculations represent an integrated approach to the calculation of both the capital stock’s current value, on the one hand, and of the capacities available for pro-duction purposes, on the other hand, in a way that is con-sistent with the formats in which the gross domestic prod-uct is displayed. That is why this treatise places emphasis mainly on the coherent presentation and explanation of the Federal Statistical Office’s methods of calculation used to determine fixed assets or capital stocks. In conclusion, we shall explain the database used and the results obtained by the calculations made in the context of the 2005 revision of national accounts for Germany regarding the years 1991 to 2004 and of the 2006 backward calculation for the years 1970 to 1991 relating to the former federal territory.
1 Definition of fixed assetsand capital stock
The terms “Kapitalstock” and “fixed assets” are often used synonymously in German and they are also used synony-mously with the English term “capital stock”. A definition of the terms used is imperative, as we are faced with con-cepts, such as (stocks of) fixed assets in gross and net terms apart from different price concepts, “gross” and “net capital stock” as well as “wealth” and “productive capital stock”. It is the only way to avoid ambiguities caused by dif-ferent meanings assigned to one and the same concept. Microeconomic issues are not considered here. The defini-tions are based on the internationally agreed concepts of national accounts. They provide the definitions and explan-atory methodological notes that statistical offices use as a basis for their measurement concepts. Accordingly, (stocks of) fixed assets comprise all produced fixed assets that are used repeatedly, or continuously, in processes of pro-duction for more than one year. They include tangible and intangible assets. Tangible fixed assets consist of the stock of machinery and equipment, residential and non-residen-tial buildings, and cultivated assets. Intangible fixed assets comprise mineral exploration, computer software and large databases as well as entertainment, literary or artistic orig-inals.
In order to characterise capital stocks and fixed assets it is very important to distinguish between flows and stocks, a distinction made both by the 1993 System of National Accounts (SNA) of the United Nations and by the 1995 Euro-pean System of Accounts (ESA). “Flows reflect the creation, transformation, exchange, transfer or extinction of eco-nomic value. They involve changes in the value of … assets or liabilities.”3) The gross domestic product and most of the other national accounts variables are flows that relate to a period of time. “Stocks are holdings of assets and liabilities at a point in time. Stocks are recorded at start and end of
each accounting period. The accounts that show stocks are called balance sheets. Stocks are also recorded for popula-tion and employment. However, these stocks are recorded as mean values over the accounting period.”4) Stock of fixed assets means a holding of assets, it therefore is a value mea-sured at a point in time. “Flows refer to actions and effects of events that take place within a given period of time, while stocks refer to positions at a point of time.”5)
A combination of data on stocks and flows is methodolog-ically problematic, because stocks of fixed assets relate to a moment of time, whereas flow data refer to a period of time. If we wish to calculate capital productivity similar to labour productivity, we must make sure that the other pro-duction factor is subject to the same procedure as is laid down for employment (and the population) in the ESA-95 (see above): We must generate an annual average. Average annual gross fixed assets at constant prices are traditionally referred to as Kapitalstock in Germany’s national accounts. Kapitalstock calculations provide us with the methodologi-cally correct tools needed to determine capital productivity as gross domestic product per unit of capital stock, capital output ratios as their reciprocal value and capital intensity as capital stock per employed person (as an annual aver-age). Although international concepts do not provide for such calculations, they are, nevertheless, methodologically exact. However, the German word “Kapitalstock”, which is used to denote this annual average, often gives rise to mis-understandings caused by confusion with the English term “capital stock”, which means a stock figure related to a point of time.
However, neither the SNA nor the ESA use a term such as “capital stock”. Depreciation is exactly referred to as “con-sumption of fixed capital” and investments as “gross fixed capital formation”, but stocks do not provide for a term such as “capital stock”, but only for “stocks of fixed assets”. The reason is that according to the SNA and the ESA not all gross fixed capital formation actually increases fixed assets.6) Both major improvements to non-produced non-financial assets and the costs of ownership transfer on non-pro-duced non-financial assets as part of gross fixed capital for-mation are referred to as additions to the value of non-pro-duced non-financial assets. The name says it already: This part of gross fixed capital formation does not increase the value of fixed assets, but adds to the value of non-produced non-financial assets (in particular, land). This approach may be reasonable from the perspective of fixed assets, but it has the undesirable side effect that gross fixed capital for-mation, fixed assets and consumption of fixed capital are defined differently: Fixed assets do not include additions to the value of non-produced non-financial assets, i. e. addi-tions, which are included in gross fixed capital formation and need to be written off as consumption of fixed capital. Now the “capital stock” concept used by the OECD manual
3) Annex A to Council Regulation (EC) No. 2223/96 of 25 June 1996 on the European System of National and Regional Accounts in the European Community (Official Journal of the EC No.L 310, p. 1), section 1.32.
4) Ibid., section 1.47. 5) Ibid., section 1.31. 6) A detailed comparison of the classification of fixed assets and gross fixed capital formation can be found in Schmalwasser, O.: „Revision der Anlagevermögensrechnung 1991 bis 2001“ in
WiSta 5/2001, p. 344.

NATIONAL ACCOUNTS
Statistisches Bundesamt • Wirtschaft und Statistik 3
on “Measuring Capital”7) establishes a connection between gross fixed capital formation and consumption of fixed cap-ital by applying exactly the same definition to the different types of assets, which are subject to capital consumption (see chart 1). Coverage and classification of capital stock by type of asset, considered in this manual, show that they are composed of fixed assets, on the one hand, and major improvements to non-produced non-financial assets and costs associated with the transfer of ownership on non-pro-duced non-financial assets as part of non-produced (tangi-ble) assets, on the other hand.8)
“Capital stock”, in German “Kapitalstock”, is used in this treatise in the same way as in the OECD definition of “capi-tal stock”. The traditional German “Kapitalstock” described above is additionally specified as “annual average”, which has also been done for some time in the Federal Statistical Office’s English translations of publication tables in order to avoid misunderstandings.
Judging on the present course of discussions, the revi-sion of the SNA 1993, which is to be completed by 2008, is expected to put an end to the practice that different defi-nitions are applied to gross fixed capital formation and con-sumption of fixed capital, on the one hand, and fixed assets, on the other hand. Then all parts of gross fixed capital for-mation will be included in fixed assets as well and all assets actually produced will be covered as produced assets. With Germany’s transition to the ESA-95, the costs of ownership transfer on unimproved land were not considered to be con-stituent parts of fixed assets, whereas land improvements, as in the past, were recorded under buildings. Two different approaches to the calculation of fixed assets and consump-tion of fixed capital were used to calculate total consumption
of fixed capital: consumption of fixed capital in the context of calculating domestic product, including charges equiva-lent to the consumption of accumulated costs of ownership transfer on unimproved land, on the one hand, and in the context of the calculation of assets and liabilities exclud-ing the latter ones, on the other hand. With the 2005 revi-sion of national accounts and anticipating a revision of the SNA, this duplicate approach was abandoned and accumu-lated costs of ownership transfer on unimproved land were included in fixed assets as well. Strictly speaking, Germa-ny’s fixed assets are now equivalent to capital stock in terms of the OECD manual. We have deliberately accepted a slight deviation from the ESA concepts presently in force, because the cost of ownership transfer on land is a relatively insignif-icant component of total fixed assets.
2 Overview of the calculation of fixed assets and consumptionof fixed capital
2.1 Gross and net approach andconsumption of fixed capital
The way in which capital stock estimations are presently organised in Germany arises from the traditional approach of the Federal Statistical Office9) to such calculations and from the requirements of the data transmission programme under the ESA 1995.10) Besides the obligatory transmission of fixed assets data, a point of great importance is the sup-ply of data on consumption of fixed capital. Consumption of fixed capital in national accounts measures the amount
7) See footnote 2. 8) Ibid., p. 23 and p. 25 f. 9) See Lützel, H.: „Das reproduzierbare Anlagevermögen in Preisen von 1962“ in WiSta 10/1971, p. 593 ff., and Lützel, H.: „Das reproduzierbare Sachvermögen zu Anschaffungs- und zu Wie-
derbeschaffungspreisen“ in WiSta 11/1972, p. 611 ff.10) See Annex B of the ESA regulation, footnote 3.
Chart 1: Definition of gross fixed capital formation, fixed assets, consumption of fixed capital and capital stock based on the SNA and ESA classification
Gross fixed capital formation P.51
Fixed assets AN.11
Consumption of fixed capital K.1
Capital stock (OECD Manual)
P.511 Acquisitions less disposals of tangible fixed assets
AN.111Tangible fixed assets
To be calculated with respect to tangible fixed assets
Tangible fixed assets
P.512 Acquisitions less disposals of intangible fixed assets
AN.112Intangible fixed assets
To be calculated with respect to intangible fixed assets
Intangible fixed assets
P.513 Additions to the value of non-produced non-financial assets, of which
P.5131 Major improvements to non-financial non-produced assets
P.5132 Costs of ownership transfer on non-financial non-produced assets
________ To be calculated with respect to major improvements to and costs of ownership transfer on non-financial non-produced assets
Major improvements to and costs of ownership transfer on non-financial non-produced assets as parts of non-produced assets
Component of AN.2 non-produced assets

NATIONAL ACCOUNTS
4 Statistisches Bundesamt • Wirtschaft und Statistik
of fixed assets used up during the period under consider-ation as a result of normal wear and tear and foreseeable obsolescence including a provision for losses as a result of accidental damage which can be insured against. This cal-culation is done for all fixed assets, including both tangi-ble fixed assets and intangible fixed assets such as min-eral exploration costs and software. Animals are excluded by definition. Land improvement costs are not separately determined in Germany. They are included in buildings and structures. Costs of ownership transfer on unimproved land are written down as consumption of fixed capital together with the respective types of buildings. That is why calcula-tions of fixed assets and consumption of fixed capital form a unity.
According to the ESA transmission programme, the stock of fixed assets is to be recorded both in gross terms and net terms, in either case at current replacement costs and con-stant replacement costs. Registration at historic cost value is voluntary and done in line with the valuation principles of microeconomic and fiscal balance sheets. Gross approach means that fixed assets are recorded as part of fixed assets at full value (current market prices of new fixed assets of a corresponding quality) without consideration of the decline in an asset’s value by the time when these fixed assets retire from the production process. This is done in consid-eration of the fact that the production process makes use of all fixed assets irrespective of their age and that the out-put achieved is more or less the same every year, provided that fixed assets are maintained and repaired regularly. For instance, a 500 MW power generating unit produces these 500 MW as long as it is connected to the power grid even after 20 years, when most of its value will have been written off as consumption of fixed capital. That is why the stock of gross fixed assets is a suitable value for the analysis of pro-duction processes.
In balance sheets, however, fixed assets are to be valued at market prices (current market value) at the time to which the balance sheet relates. Since, in most cases, there are no market prices for existing fixed assets of different age other than motor vehicles, the net approach provides for a deduc-tion of the amount that has been written off as consump-tion of fixed capital since the date of investment.11) This is a good compromise that reconciles what is desirable in the-ory with what is feasible in practice. Accordingly, the net capital stock corresponds to the current value of the fixed assets measured in terms of the fixed assets’ current mar-ket value.
2.2 Price concepts
Three price concepts are used in fixed assets calculations:
– current replacement costs,
– constant replacement costs, and
– historic cost value.
The above distinction is required, since the capital stock is composed of individual pieces of fixed assets, which were acquired in different years and which can be summed up in different ways. Using a perpetual inventory method which is based on the (original) acquisition prices that were actually paid in a given year of investment, one speaks of historic acquisition prices or historic cost value, which best agree with an enterprise’s bookkeeping data. This method has the disadvantage that fully identical fixed assets are likely to be included in the accounts with completely different acquisi-tion prices, just because these goods were acquired in dif-ferent years and purchaser’s prices changed between these years. The result of this calculation at historic cost for differ-ent years of acquisition has nothing to do with the current prices commonly used for flows, which relate to one report-ing year, even if the calculation as such is based on cur-rent prices of gross fixed capital formation. In order to con-vert the stock at historic acquisition prices into one year’s prices, we would need to make sure that the yearly propor-tions of fixed capital formation related to the total stock of assets are available in a detailed breakdown by type of assets and that the respective price indices are obtainable as well. This would allow us to construct a weighted average based on the price indices for all fixed assets acquired in all years, which would be much too expensive a procedure to be used. The Federal Statistical Office has abandoned this price concept for capacity reasons. Although this concept complies with the valuation techniques applied by busi-nesses’ bookkeeping systems, one should note that the val-ues recorded for fixed assets at historic acquisition prices in net terms are not comparable, because the methods used to calculate consumption of fixed capital are very different.
Before the Perpetual Inventory Method is used in capital stock calculations, gross fixed capital formation data relat-ing to different years are brought into a comparable form, which is done by using series of investment data at constant prices. As a result we obtain fixed assets data at constant prices of one reporting year, i. e. at constant replacement prices (costs). The data on the stock of fixed assets defined in that way and on the related decline in value by way of con-sumption of fixed capital comply with the concept of con-stant prices applied in national accounts, which means that the entire stock of all fixed assets is valued at prices of one reference year or at base-year prices. To obtain the current replacement prices (costs) of a given year under consider-ation, we revaluate the stock, which was consistently val-ued at base-year prices, into prices of the respective year under consideration with respect to all years. All that now is still needed is data on the price indices of the year under consideration (related to the base year), broken down into detailed items of fixed assets. Hence, current replacement prices (costs) for fixed assets correspond to current prices for flows in national accounts, since all fixed assets are val-ued at prices of that one year under consideration as are all other flow data, so that we have a real match. This relates, in particular, to the data on consumption of fixed capital at cur-rent prices, which are determined by using this method. The-
11) See ESA 1995, sections 7.29 and 7.33.
NATIONAL ACCOUNTS
Statistisches Bundesamt • Wirtschaft und Statistik 5
oretically, it would even be possible to revaluate all series of gross fixed capital formation data for every year under con-sideration into the prices of one specific year under consid-eration and to use the Perpetual Inventory Method later on, but that is an extra effort we spare by calculating the prices for one base year only and revaluating the results for all years under consideration.
The transition from constant prices to previous year’s prices with chaining in national accounts brought about a methodological problem in the calculation of fixed assets, since price changes are correctly recorded only in relation to the previous year, but not in relation to the reference year. Constant prices, in their turn, correctly reflect the changes in prices between the reporting year and the base-year of price registration, but they are of restricted use for the measure-ment of year-to-year changes in prices, because weighting varies. Since the constant price approach corresponds to the approach used to cumulate gross fixed capital forma-tion, constant prices continue to be used for the calculation of stocks of fixed assets and consumption of fixed capital. On this basis it is even possible to generate data at previous year’s prices by applying the price indices that were used to revaluate data into current or replacement prices. For that purpose we must additionally convert the values at constant (replacement) prices into values at previous year’s prices, which is done by using the price indices of the previous year. This method is actually used to calculate consumption of fixed capital as a flow item. However, if the stock of fixed assets is related to a concrete date, we are faced with addi-tional methodological problems caused by the prices that must also relate to that date. For that reason we do not pres-ently show the stock of fixed assets by chaining year-to-year data.
That is why, in order to show capital productivity, we use data on gross domestic product or gross value added at cur-rent prices and average capital stock for a year at current replacement prices. Relating chained data on gross domes-tic product or gross value added to a year’s average capital stock at constant replacement prices is not a methodologi-cally perfect solution. However, taking into account that the structure of fixed assets does not change considerably from year to year, the difference between constant prices and chained prices is practically negligible. That means that we can even tolerate such an approach, although it is not per-fect from a methodological point of view.
2.3 Multidimensionality of calculations
The ESA transmission programme provides for a cross clas-sification of fixed assets by 31 industries and three types of fixed assets. Much more information is required – directly or indirectly – with respect to consumption of fixed capital. This is mainly due to the fact that consumption of fixed cap-ital by other non-market producers of general government (sector S.13) and non-profit institutions serving households (S.15) has an influence on the size of gross domestic prod-
uct and gross national income. The output of other non-mar-ket producers is determined as total production costs and consumption of fixed capital is one component of these costs.12) That is why we need to determine consumption of fixed capital in the required detail by industry and govern-ment subsector, i. e. federal (central) government (S.1311), state government (S.1312), local government (S.1313) and social security funds (S.1314), in order to arrive at gross value added of other non-market producers. In addition, we need consumption of fixed capital of market producers for the sector accounts of the government sector by subsector, of non-profit institutions serving households, financial cor-porations (S.12) by subsector, non-financial corporations (S.11) and households (S.14) as well as total consumption of fixed capital for the sectors in total.
That means that calculations of fixed assets and consump-tion of fixed capital must have a multidimensional structure. Major dimensions such as industries, type of fixed assets and sectors/subsectors are shown in fig. 1. As a first step this presentation starts with a cross-classification by indus-try and type of fixed assets. In Germany we need not make an extra distinction between market and non-market pro-ducers, because this differentiation is completely available – with one exception – in terms of industries and subsec-tors (see section 4.1, chart 2). It should be noted that by far not all fields of the multidimensional matrix are filled with data. But for every field that is filled with data we need to have long series of data on gross fixed capital formation and a good’s service life (distribution), which varies over time (see chapters 3 and 4). That means that two more dimen-sions are added to the calculations.
2.4 Perpetual Inventory Method andelements of the direct method
As no comprehensive direct data is available on the stock of fixed assets in Germany, the main method of calculating fixed assets and consumption of fixed capital is the Perpet-ual Inventory Method (PIM), which is recommended by the ESA. The details of this method are explained in chapter 3. In addition, we also use elements of the direct method in Germany:
– The calculation of cultivated assets is based on annual data of agricultural statistics on livestock and cultivated areas. This data on stocks and areas is valued, using the average weights and prices of a given calendar year (cur-rent replacement costs) and those of the year 2000 (con-stant replacement costs), which are provided by agricul-tural accounting. According to the ESA-1995 livestock is not written off, so that in this case net assets are equal to gross assets.
– Information on the stocks inherited from the ex-GDR is based on annual fixed assets reports and reports on the material, technological and age structure of the GDR’s fixed assets, i. e. on direct statistical records about the
12) See also ESA 1995, section 3.53.

NATIONAL ACCOUNTS
6 Statistisches Bundesamt • Wirtschaft und Statistik
stock of fixed assets. These stocks were separately de-termined on this basis, but comprehensive adaptations were required, since what we needed for the calculation was only the part that was still in use for production pur-poses after transition from planned to market economy, rather than the entire stock of the ex-GDR’s fixed assets. For example, assets that proved to be useless under mar-ket conditions by the end of 1992 were excluded from the initial stock of inherited fixed assets, determined as of 1 July 1990. The stocks of fixed assets inherited by the new federal states as of the beginning of 1991 were ad-ded to the initial stocks obtained by using the Perpetual Inventory Method. Write-offs and retirements were calcu-lated well in advance and must annually be taken into account for inherited stocks.13)
– The ESA-1995 stipulates that changes caused by excep-tional incidents, which do not comply with the original assumptions made by the perpetual inventory method,
are recorded as other changes in the volume of fixed as-sets. Various cases of special retirements (withdrawals from the stock before the end of assumed service life) are recorded for fixed assets under this item, including the repercussions they have on consumption of fixed capital and retirements resulting from PIM, described in section 4.3.
Accordingly, the stock of fixed assets in gross and net terms recorded at start of 1991 for Germany as a whole consists of the following items:
Stock of fixed assets at start of 1991, obtained by using the perpetual inventory method
+ Stock of cultivated assets at start of 1991
+ Stocks of inherited fixed assets of the ex-GDR at start of 1991
Sector S. 11
Sector S. 12
Sector s
Sector S
Fig. 1
Multidimensionality of fixed assets and consumption of fixed capital calculations
Assets AN 1.1…1 2 . . . an . . . AN
1 AN 1,1,1 . . . AN 1,an,1 . . . AN 1,AN,1
2
. . . .
. . . .
. . . .
a AN a,1,1 . . . AN a,an,1 . . . AN a,AN,1
. . . .
. . . .
. . . . AN a,an,s
60 AN 60,1,1 . . . AN 60,an,1 . . . AN 60,AN,1
AN a,an,S
Indu
stri
es (A
60)
Fixed assetsAN 1.1
13) On the inclusion of inherited stocks from the former GDR see section 1.2.3 in Schmalwasser, O., footnote 6, here: p. 347.

NATIONAL ACCOUNTS
Statistisches Bundesamt • Wirtschaft und Statistik 7
– Accumulated special retirements and their counterpart entries for the former federal territory until and including 1990
= Stock of fixed assets at start of 1991 for Germany as a whole
Consumption of fixed capital and retirements are deter-mined analogously, which is shown here using consump-tion of fixed capital as an example:
Consumption of fixed capital obtained by using the per-petual inventory method
+ Consumption of old fixed capital which is further used by the new federal states
– Counterpart entries to consumption of fixed capital cor-responding to other changes in the volume of fixed as-sets
= Total consumption of fixed capital
Then the flows connected with fixed assets, which were determined in this way, and the stocks of fixed assets for Germany relating to the start of 1991 are used as the basis on which the stocks of fixed assets are determined for the years to come as follows:
Gross stock at start of year
+ Additions to fixed assets
– Retirements of fixed assets
= Gross stock at end of year (= gross stock at start of the following year)
In the calculation of gross assets, entries for special retire-ments in conjunction with other changes in the volume of assets are recorded in the other changes in the volume of assets account according to the basic pattern described above and are included in retirements. Net assets, however, require other changes in the volume of assets to be consid-ered separately, because these changes cannot be recorded as special consumption of fixed capital:
Net stock of assets at start of year
+ Additions to fixed assets
– Consumption of fixed capital
– Other changes in the volume of assets (net)
= Net stock of assets at end of year (= net stock at start of the following year)
Backward calculations of fixed assets and consumption of fixed capital for 1970 – 1991 regarding the former fed-eral territory are also based on the stock at start of 1991. For that purpose we determine the stock at start of 1991 for the former federal territory according to the basic pat-tern described above. In so doing, we must leave out of account not only the inherited, old stocks of the former GDR.
We must also exclude the respective East-German data from the stock of cultivated assets at start of 1991, and we must take into account that the data on the stock at start of year, which were obtained by using the perpetual inventory method, already include the new federal states’ fixed capi-tal formation for the second half of 1990 (after the introduc-tion of DM on 1 July 1990). That means that we must exclude the respective parts of fixed capital formation, when calcu-lating the stocks for the former federal territory at start of 1991. Accordingly, we must take into account the resulting consumption of fixed capital for 1990 in order to determine the 1990 consumption of fixed capital for the former fed-eral territory. The influence on retirements in 1990 can be neglected. On that basis we effect a “real” backward calcu-lation of the former federal territory’s fixed assets as shown below, using the gross stock as an example:
Gross stock of fixed assets for the former federal territory at start of year
– Additions to the previous year’s fixed assets
+ Retirements from the previous year’s fixed assets
= Gross stock for the former federal territory at start of pre-vious year
3 Use of the Perpetual Inventory Method in Germany
3.1 Brief outline of thePerpetual Inventory Method
As outlined in section 2.4, the Perpetual Inventory Method (PIM) is the main method used to determine fixed assets and consumption of fixed capital in Germany. This approach is based on the idea that today’s stock of fixed assets is composed of assets that were added to the stock at some time in the past. Taking into account the service life of fixed assets, we can calculate the percentage of assets added in past years, which are still operational in the stock at start of the year under consideration, and determine the time when these assets will be withdrawn (retire from the stock). If the depreciation method is applied, we can use this informa-tion to derive data on consumption of fixed capital for every reference period. The use of the Perpetual Inventory Method requires the following conditions to be fulfilled: (1) data series on gross fixed capital formation are available, which reach far back into the past, (see section 4.1) and (2) it is possible to estimate the average service life for the various types of fixed assets (see section 4.2).
The average (economic) service life is estimated for all goods which are subject to consumption of fixed capital. This is done, assuming normal wear and tear and foreseeable obsolescence as a result of technological progress. The esti-mation also covers the risk of losses due to insurable acci-dental damage. As it is unrealistic to assume that all goods with the same average service life and added in the same year will also retire at the same time, we use a mortality

NATIONAL ACCOUNTS
8 Statistisches Bundesamt • Wirtschaft und Statistik
(retirement) function to distribute retirements so that they scatter around the average service life in a roughly bell-shaped manner (see section 3.2).
Fig. 2 schematically outlines the use of the perpetual inven-tory method for the calculation of fixed assets and consump-tion of fixed capital. This description clarifies the essential points of the method used:
– To begin with, we need some basic information, includ-ing long-term series of data on gross fixed capital forma-tion (at constant prices for calculations at constant and current prices), approaches to service life determination and corresponding price indices for the various fixed as-sets needed for calculations at current price, provided that the depreciation method and the distribution of reti-rements are taken for granted.
– Consumption of fixed capital is calculated in a self-con-tained way, which does not require fixed assets to be cal-culated in an intermediate step (“inner circle”).
– Any deviations from the normal economic trend that this model imputes can be recorded as other changes in the
volume of assets (see section 4.3). This item enables us to ensure that exceptional, unanticipated events, which have an impact on the value of fixed assets and, as a later consequence, on the size of consumption of fixed capital, are included in the calculation.
3.2 Mathematical model
The mathematical model used to implement the perpetual inventory method in Germany is designed so that the flow data, i.e. retirements and consumption of fixed capital, can directly be derived from the two pieces of basic information needed for the calculation of fixed assets, i.e. gross capi-tal formation and service life of the various fixed assets. To describe the model14), we use the following standardised symbols:
i : investment year
t : (current) reporting year
n : service life in years
ñ : average service life
14) See footnote 9.
Calculation of fixed assets and consumption of fixed capitalusing the Perpetual Inventory Method
Basic materialResults
Other changes in the volume ofassets at constant prices
Value as new (gross) Current market value (net)
1) The respective data on historic cost value can be derived from the time series on gross fixed capital formation at current prices.
(–)
Retirementsat current
prices(current
replacementcosts)
Gross fixedassets (value
as new) atconstant
replacementcosts1)
Distributionof retirements
Results
(+)
Time series on gross fixed capital formationat constant prices (long-run data of the past
and broken down by group of assets)
Annual average prices indices(price indices of gross fixed capital formation)
Price indices at the beginning of year (estimated)
(+)Consumptionof fixed capital
at constantprices1)
Net fixedassets (currentmarket value)
at constantreplacement
costs1)
Consumptionof fixed
capital atcurrent prices(replacement
costs)
Net fixedassets (currentmarket value)
at currentreplacement
costs
Fig. 2
Distribution of consump-tion of fixed capital
(+)
(+)
(–)
Retirementsat constant
prices1)
Densityfunction
(e.g. gammadistribution,
lognormaldistribution)
Averageeconomicservice life
(estimated bygroup ofassets)
Depreciationmethod (inmost cases
straight line,geometrically
digressive)
Gross fixedassets (value
as new) atcurrent
replacementcosts
Statistisches Bundesamt 2006 - 01 - 1344

NATIONAL ACCOUNTS
Statistisches Bundesamt • Wirtschaft und Statistik 9
Ii : additions of year i
Ii,n : additions of year i with service life n
fñ(n) : mortality function of gross fixed capital formation
a, p : dilation parameter of the gamma distribution
A t : retirements in the reporting year t
d t(n) : depreciation function
D t : consumption of fixed capital in the reporting
year t
In Germany we use the density function of the gamma distribution to calculate the distribution of retirements. The choice of this function was based on empirical data of motor vehicle registration. In Germany we do not have a statistical basis as regards the actual service life of other groups of fixed assets. The gamma function provides the best approximation to the real retirements of vehicles, dis-tributed around the average service life:
0,0,0;)(),/( 11 >>≥Γ= −−− panenpapan anppφ
Parameters a and p determine, inter alia, the steepness of the mortality function. The curve is the steeper, the higher these dilation parameters are. Dilation parameter 9 was assumed to be suitable for most goods. It ensures results most closely approximating past evaluations regarding retirements of vehicles. Adopting parameter 9 as the normal case, we obtain a mortality function as follows:
ñ
n
n ennnf9
8919~
~)!8(9)(−−−=
Fig. 3 displays the curve progression of a mortality function related to an average service life of 10 or 20 years.
The retirements of the reporting year t are obtained as the sum of assets added during the past years i and having a service life of n = t – i years:
)(~ itnfIA ntiit −=
<•
Now it is possible to derive the depreciation function directly from the mortality function. The method used is straight line depreciation in accordance with a recommen-dation made by the ESA-1995. The depreciation rate in the investment year and in the year of retirement is just half as high as in the intermediate years. This is based on the assumption that in the first and last years the assets are included in the stock for half a year on average.
nndt
21
)( = for t = i and t = i + n,
nndt
1)( = for i < t < i + n
As this function only considers goods which are still included in the stock and which have already been calculated by way of the mortality function, we can directly calculate consump-tion of fixed capital without having to determine the size of stocks. Due to the proportions of retirements already con-sidered we obtain a non-linear function for the depreci-ation curve, as fig. 4 shows, displaying the distribution of consumption of fixed capital with respect to goods having an average service life of 10 or 20 years. Although straight line depreciation is used, the data obtained as a result of distributing consumption of fixed capital approximate those obtained by way of geometric depreciation, which is used, inter alia, by the United States. This results from the fact that straight line depreciation follows the real service life of the assets, for which consumption of fixed capital is mea-sured, whereas according to the mortality function some of
2
4
6
8
10
12
14
0
Retirements as a percentageof an investment year
2
4
6
8
10
12
14
0
Retirements as a percentageof an investment year
0 10 20 30Service life in years
Fig. 3
Mortality functionfor assets with an average service life of
10 or 20 years
Statistisches Bundesamt 2006 - 01 - 1345
10 Years
20 Years
2
4
6
8
10
12
0
Consumption of fixed capital as apercentage of an investment year
2
4
6
8
10
12
0
Consumption of fixed capital as apercentage of an investment year
0 10 20 30 40Service life in years
Fig. 4
Distribution of consumptionof fixed capital for assets with an average service
life of 10 or 20 years
Statistisches Bundesamt 2006 - 01 - 1346
10 Years
20 Years

NATIONAL ACCOUNTS
10 Statistisches Bundesamt • Wirtschaft und Statistik
the goods that were acquired in an investment year were already withdrawn from the stock after a short span of time (long before reaching the average service life of the respec-tive group of assets).
We obtain a reporting year’s consumption of fixed capital for assets added in a given investment year by multiplying the respective share of depreciation with the value of gross fixed capital formation. The following applies to consump-tion of fixed capital in the reporting year t related to the additions of the year i:
)()( ~, nfndID nitntiti •=
−≥
Consumption of fixed capital in the reporting year t is ob-tained as the sum of consumption of fixed capital for the various years of fixed capital formation:
=≤ ti
tit DD ,
3.3 IT solution
The software system for the perpetual inventory method was originally programmed on a mainframe platform in the late 1970s. At the end of the 1990s, when the shutdown of the system was imminent, we had to think about alterna-tive IT tools that could be used to handle the complex com-putations required. A problem of the mainframe variant was the scarcity of available storage space, which had the effect that it was necessary to redetermine the distributions of retirements and consumption of fixed capital in every com-putational cycle and delete them again afterwards. Storage space ceased to be a problem, when modernised and larger hard disk systems were introduced at PC level. Considering that the spreadsheet programme Excel was generally avail-able for difficult mathematical computations, a solution was chosen, which was based on “Visual Basic for Applications (VBA)”.
Another problem that had to be considered was the extent to which it would be possible to map the model in the file system taking into account the model’s complexity. As the computation of the gamma distribution and its final pro-gression (linearization of the asymptotic function, see below) needs very much computing power, this process was separated from the rest of the file system. Besides, a strict separation was made in the file system between service life approaches and the calculation of flows and stocks, inter-nally referred to (briefly) as B-matrices. This appeared advis-able, first of all, in order to prevent large files from placing an extremely high burden on the network. This trichotomy – service life approaches, computation of the gamma distri-bution, and B-matrices – is schematically displayed in fig. 5 and will be explained in more detail below.
In compiling the service life approaches and their goods proportions a presentation was chosen, which it would be easy to understand. This did not raise any problems as regards machinery and equipment, as dilation parameter 9
was always used in subsequent calculations of the gamma distribution. Fig. 6 shows the structure of one such service life approach.
The table header includes the investment years and the pro-portions of the respective assets grouped by service life are listed thereunder for each investment year. As additional information the average service life for the year in question was indicated at the end of the column. These service life files still consist of several Excel worksheets, which include both the mortality distribution and the ensuing distribution regarding consumption of fixed capital. But the computing process as such has been relocated to another file. If a ser-vice life distribution changes, computing is done using VBA so that the new distribution is transferred to the computing file and, on completion of the computing process, the distri-butions of retirements and consumption of fixed capital are returned to the service life distribution. A separate mortal-ity distribution is calculated for each individual service life
Basic structure of the file system
Distribution of service lives, retirement distribution and distribution of consumption of fixed capital
Calculation of the retirement distribution and distribution
of consumption of fixed capital B-matrix 1 B-matrix 2
Fig. 5
Example of a service life approach to machinery and equipment
Fig. 6

NATIONAL ACCOUNTS
Statistisches Bundesamt • Wirtschaft und Statistik 11
group. Subsequently, the various mortality distributions so defined are weighted with the proportions of the compos-ite asset groups related to fixed capital formation of the year in question.
A factor that has to be considered as regards the computing process as such is the fact that the gamma distribution is an infinite function. That is the reason why we discontinue the gamma distribution in Germany as soon as 99 % of assets have been withdrawn. In the years that follow the data is updated using the previous year’s proportion as long as all assets are actually withdrawn from the stock. The related computing process is much more challenging in terms of mathematics and programming than the gamma distribu-tion as such. VBA and if-queries were used to implement this step of computation.
Whilst the computing model of machinery and equipment was largely suitable for intangible assets as well, it was nec-essary to choose a different approach to buildings, because here it was not always possible to use just one standard dila-tion parameter in the gamma distribution. For example, the parameters chosen for residential buildings were different; the dilation parameter 7 was laid down for new buildings and 13 for modernisation activities. Fig. 7 shows the typi-cal structure of a table displaying the service life approach to buildings.
Unlike the described model for machinery and equip-ment, this approach provides for all assets to be arranged in triads. The first cell of this group represents the dilation parameter, the second one the average service life and the third one the proportion of that asset for the year in ques-tion. Here again, a VBA procedure is started, which transfers service life data to the buildings worksheet used for com-puting purposes, and afterwards the ensuing distributions of retirements and consumption of fixed capital are trans-ferred back to the service life file. German fixed assets cal-culations include 150 service life distributions for the vari-ous computing areas, but only two files for computing the gamma distribution and the cut-off process of this function.
For each section, which is subject to computation, a sepa-rate file is used to determine flows and stocks. Fig. 8 shows the structure of the B-matrices files.
All flows (consumption of fixed capital, retirements) and stocks (in net and gross terms at start of year) of fixed assets estimations are calculated in these B-matrices. Exceptional factors of influence (special retirements) are not considered by these files. Linking is used to apply the distribution of the mortality and depreciation functions to the service life dis-tribution of the section, subject to computation. This model provides very many possibilities of ad hoc analysis. On the one hand, gross capital formation can be subject to changes and their influence on other flows becomes visible at once. On the other hand, one can directly see how the calculation will change by simply modifying the service life distribution, which results in corresponding changes regarding the distri-bution of the mortality and depreciation functions.
4 Data bases for calculations in the context of the 2005 revision and the 2006 backward calculation
4.1 Long-term series of gross fixed capital formation
Gross fixed capital formation means additions to fixed assets or the capital stock. If it is not possible or not desir-able to use benchmark estimates for the capital stock in a start year, the series of gross fixed capital formation, on which the perpetual inventory method is based, must include a very long period of the past.15) Since, according
Example of a service life approach to buildings and structures
Fig. 7
Structure of a B-matrix
Fig. 8
15) See also OECD Manual, footnote 2, p. 44.

NATIONAL ACCOUNTS
12 Statistisches Bundesamt • Wirtschaft und Statistik
to the gamma function, retirements may oscillate by more than double around the average service life, data on gross fixed capital formation should be available at least for a cor-respondingly long period of the past. The internal series of gross fixed capital formation in Germany start for build-ings in 1799, for machinery and equipment in 1899 and for intangible assets in 1945 or even later.
Gross fixed capital formation is broken down by
– more than 200 types of machinery and equipment, 8 kinds of buildings and four types of other fixed assets,
– 60 industries and
– institutional sectors of national accounts (five sectors and seven sub-sectors)
(please, also refer to fig. 1). That means that gross fixed capital formation is available in three classification profiles. Regarding the consumption of fixed capital calculation, it is also necessary to distinguish between market producers and other non-market producers in gross fixed capital for-mation of the government sector (S.13) and non-profit insti-tutions serving households (S.15) (see chart 2), because consumption of fixed capital of other non-market pro-ducers of the government sector and of non-profit insti-tutions serving households has a direct influence on the size of gross domestic product and gross national income (see section 2.3). Although gross fixed capital formation is already available in a highly detailed manner, it may some-times be necessary to specify it with even more detail for the purpose of fixed assets and consumption of fixed capi-tal calculations (see fig. 6 and fig. 7).
4.2 Service life approaches
A category which is to be determined for all series of data on gross fixed capital formation is average (economic) ser-vice life – the second major input needed for the perpetual inventory method. Service life is the period, during which an asset’s consumption is recorded. This value is insecure, because it is geared to the future. In order to determine it in line with the ESA-1995, it is necessary to take into account normal wear and tear as well as economic obsolescence and losses of fixed assets as a result of accidental damage which can be insured against. It is assumed that the assets are correctly maintained and minor repairs are continuously made. Service life approaches are determined by breaking down gross fixed capital formation by type of asset in as much detail as possible. The 2005 revision brought about minor modifications in the assumptions on the assets’ aver-age service lives, as they were adapted to the new asset structures.
The most important basis for the determination of an asset’s average service life regarding machinery and equipment and some buildings is provided by the AfA tables, which are issued by the Federal Ministry of Finance. These tables contain deeply specified assets together with the service life data to be used in order to determine consumption of fixed capital for tax purposes. As the determination of an asset’s fiscal life is based on the assumption that individual businesses act according to the principle of precaution, an asset’s real life is, as a rule, longer than its fiscal life. That is why the figures of the AfA tables are augmented by an average 20 to 100 %, when determining the average (eco-nomic) service life for the purpose of national accounts. The information used for that purpose was provided by enter-prises and associations (expert assessments). Service life data of equal asset groups is sometimes differentiated by industry. For example, lorries operated in construction are supposed to have shorter service lives than those operated in other industries. An internal cross-classification of inves-tors (assets/industry) is used to determine service life by industry.
The service lives of buildings and structures, in particu-lar residential buildings, commercial buildings and public buildings, were extracted from the long-term accounts with-out major modifications. Many resources were opened by the latest revision when these assets had to be written off and/or recorded as fixed assets for the first time in order to determine the service life of roads and other structures of general government and fixed assets used by the mili-tary. These resources included, for instance, investigations made by the German Institute for Economic Research (DIW Berlin) and the ifo Institute for Economic Research e. V. as well as texts on how to determine the value of real estate and the cost directive elaborated by the Federal Ministry of Defence.16)
The latest revision also tapped various resources to deter-mine the service life of intangible assets. Mineral explo-
Chart 2: Industries in which general government (S.13) and/or non-profit institutions serving households (S.15) are involved
Sectors
A601) Industries S.11/S.12/S.142)
S.13 S.15
01 Agriculture, hunting . . . . . . . . . . MP MP 02 Forestry . . . . . . . . . . . . . . . . . . . . . . MP MP 41 Collection, purification and
distribution of water . . . . . . . . MP MP 63 Supporting and auxiliary
transport activities . . . . . . . . . MP MP/NMP70 Real estate activities . . . . . . . . . MP MP MP 73 Research and development . . . MP NMP NMP 75 Public administration, defence;
compulsory social security . NMP80 Education . . . . . . . . . . . . . . . . . . . . MP NMP NMP 85 Health, veterinary and social
work . . . . . . . . . . . . . . . . . . . . . . . MP NMP NMP 90 Sewage and refuse disposal . . MP MP 91 Activities of membership
organisations n.e.c. . . . . . . . . MP NMP 92 Recreational, cultural and
sporting activities . . . . . . . . . . MP NMP NMP
MP: Market output; NMP: Other non-market output
1) The A60 of national accounts corresponds to the two-digit items of the industrial classification, issue 2003 (WZ 2003). – 2) Non-financial and financial corporations and households.
16) See Schmalwasser, O., footnote 6, here: p. 349.

NATIONAL ACCOUNTS
Statistisches Bundesamt • Wirtschaft und Statistik 13
ration data could be obtained from AfA tables. The service life of software is differentiated by two groups. Software for mainframes is supposed to have a longer service life than PC software. In the course of the 1980s the proportion of PC software grew continuously. The proportions of the two types of software were also differentiated by industry. The average life of literary and artistic originals was estimated on the basis of differentiated information on motion pic-tures, TV productions, sound storage media, music compo-sitions, artistic performances and texts.17)
Average lives of assets are obtained by type of asset, indus-try and sector for every investment year. The service life estimates by type of asset are revised every ten to 15 years, i. e. in relatively large intervals. This was based on several considerations. In the last decades of the past century Afa service lives were repeatedly shortened and partly pro-
longed in 2001. But not every change in the fiscal service life necessarily has an impact on the economic service life (according to an estimation of national accounts). Fiscal service lives are just one source among many others, which serve as an indication of possible changes occurring in eco-nomic service lives. According to the estimation of national accounts, the economic service life is also changed, for instance, on the basis of expert assessments and plausi-bility checks. But structural effects may occur even if the service life approaches in the most detailed breakdown by asset do not change at all. That means that every investment year has a service life distribution of its own. Chart 3 shows the average service lives by type of asset and the respec-tive span of time on which a (sub) group’s average service life is based.
A distinction must be made between the average service lives for the various investment years, on which the calcu-lations are based, and the average service life of assets in the stock. The latter one corresponds to the reciprocal value of the depreciation rate (rate of consumption of fixed capital) for the total economy. It is obtained as a result of the division of gross annual average stock of fixed assets by consumption of fixed capital, if possible, in a breakdown by type of asset. The average for the total economy depends on the composition of fixed assets by goods that have very dif-ferent service lives (in particular buildings and structures, machinery and equipment, and intangible assets).
4.3 Consideration of special influences
According to the ESA-1995, changes in the volume of assets and liabilities caused by extraordinary events deviating from the perpetual inventory method’s original assumptions are recorded as other changes in the volume of assets. This item includes those special retirements of fixed assets that were covered by German fixed assets calculations already in the past. It relates, in particular, to the reduction of refin-ery capacities, iron and steel capacities and ship-building (shipyard crisis) and to corrections of the gross stock, when used ships are sold abroad.18) Furthermore, from 1993 on this item has been used to record special retirements of old assets from the ex-GDR which are no longer usable from an economic point of view, provided that these assets were not already excluded when determining the initial stocks as of 1 July 1990. Correction is also required in the case of repeated sales of real estate within short intervals of time: It is assumed that real estate is sold at market prices and that it is not possible, as a rule, to realise the full costs associ-ated with the transfers of ownership (tax on purchase of real estate, fees of brokers, notaries and courts). The respective amount should be considered for buildings under special retirements caused by costs associated with the transfers of ownership. And, finally, the high losses of fixed assets, which were caused by the flood in August 2002, were also recorded in this category as catastrophic losses. The sources used for that purpose consisted of lists of damages compiled by the Federal Government and by Sachsen (Sax-
17) See also Frankford, L.: „Urheberrechte in den Volkswirtschaftlichen Gesamtrechnungen“ in WiSta 5/2000, p. 320 ff.18) See Schmidt, L.: „Reproduzierbares Anlagevermögen in erweiterter Bereichsgliederung“ in WiSta 5/1986, p. 499 ff., here: p. 503 f.
Chart 3: Average service lives and range of average service lives within the group by type of assets for the 2000 investment year
in years
Type of asset Average service
life
Range of average service lives by
group
Buildings and structures . . . . . . . . . . . . . 66 15 – 150 Dwellings . . . . . . . . . . . . . . . . . . . . . . . . . . 74 40 – 95 Roads . . . . . . . . . . . . . . . . . . . . . . . . . . . . . 57 35 – 116 Other structures of general
government . . . . . . . . . . . . . . . . . . . . . 47 25 – 150 Non-residential buildings of general
government . . . . . . . . . . . . . . . . . . . . . 66 25 – 68 Other non-residential buildings . . . . 53 15 – 100
Machinery and equipment (according to CPA)1) . . . . . . . . . . . . . . . . . . . . . . . . . . 12 5 – 30Transport equipment . . . . . . . . . . . . . . 11 8 – 25
Motor vehicles, trailers and semi-trailers (34) . . . . . . . . . . . . . . . . . . . . 9 8 – 15
Other transport equipment (35) . . 21 12 – 25
Other machinery and equipment . . . 12 5 – 30Fabricated metal products (28) . . 18 14 – 22 Machinery and equipment n.e.c.
(29) . . . . . . . . . . . . . . . . . . . . . . . . . . . 13 8 – 30Office machinery and computers
(30) . . . . . . . . . . . . . . . . . . . . . . . . . . . 5 5 – 9Electrical machinery and apparatus
n.e.c. (31) . . . . . . . . . . . . . . . . . . . . . 18 8 – 22Radio, television and
communication equipment and apparatus (32) . . . . . . . . . . . . . . . . . 10 5 – 17
Medical, precision and optical instruments, watches and clocks (33) . . . . . . . . . . . . . . . . . . . . . . . . . . . 15 10 – 22
Furniture, other manufactured goods n.e.c. (36) . . . . . . . . . . . . . . 16 8 – 30
Other machinery and equipment (part of 17 – 27) . . . . . . . . . . . . . . . 13 7 – 20
Cultivated assets Vineyards . . . . . . . . . . . . . . . . . . . . . . . . . 20 Hop fields . . . . . . . . . . . . . . . . . . . . . . . . . 15 Asparagus fields . . . . . . . . . . . . . . . . . . . 8 Fruit trees plantations . . . . . . . . . . . . . 10
Intangible assets . . . . . . . . . . . . . . . . . . . . 5 5 – 30
1) Statistical goods classification in conjunction with the industries (kinds of activity) used in the European Economic Community, 2002.

NATIONAL ACCOUNTS
14 Statistisches Bundesamt • Wirtschaft und Statistik
ony) and Sachsen-Anhalt, the federal states most severly affected, as well as information provided by the Deutsche Bahn AG (German Railways).
The perpetual inventory method predetermines all effects that gross fixed capital formation of a given year exerts on all elements of fixed assets calculations, until the last asset resulting from that investment year will be withdrawn from the stock. That means that whenever special retirements of fixed assets are recorded it is necessary to make the cor-responding counterentries for consumption of fixed capi-tal and retirements in the following years. Otherwise, for example, consumption of fixed capital would be recorded for assets, which are no longer in the stock.
5 Results obtained in the contextof the 2005 revision and the 2006 backward calculation
The results of the calculations related to fixed assets in Ger-many are commented on the basis of two figures (see fig. 9 and 10). Fixed assets are shown in line with two price con-cepts in gross and net terms by 60 kinds of industry bro-ken down into buildings and other assets and, for the total economy, also into six types of fixed assets.19) This informa-tion is supplemented by corresponding data on consump-tion of fixed capital in prices of the year 2000 and in cur-rent prices.20)
19) See Thematic Series 18, Row 1.4 „Inlandsproduktsberechnung – Detaillierte Jahresergebnisse 2005“, tables 3.1.3 and 3.2.16 to 3.2.19.20) Ibid., tables 3.1.4, 3.2.20 and 3.2.21.
Fig. 9
Evolution of capital stock and gross domestic productChange on the previous year
-2
-1
1
2
3
4
5
6
0
%
-2
-1
1
2
3
4
5
6
0
%
197172 73 74 75 76 77 78 79 80 81 82 83 84 85 86 87 88 89 90 91 92 93 94 95 96 97 98 99200001 02 03 04 05
Capital stock at 2000 prices Gross domestic product price-adjusted
Statistisches Bundesamt 2006 - 01 - 1347
Former federal territory Germany

NATIONAL ACCOUNTS
Statistisches Bundesamt • Wirtschaft und Statistik 15
Fig. 10
Structure of gross fixed assets and consumption of fixed capital compared over time
Statistisches Bundesamt 2006 - 01 - 1348
Machinery andequipment
Residentialbuildings
Non-residentialbuildings
Intangiblefixed assets
at the beginning of year 2006
1970 2005
Gross fixed assets at current replacement costs1)
at the beginning of year 1970
Consumption of fixed capital at current prices
23,7%
38,1%
37,1%
0,6%15,9%
47,1%
35,9%
1,1%
56,3%
17,3%
24,3%
2,0%
45,3%
23,7%
24,4%
6,6%
1) Including cultivated assets.
1 280Mrd. EUR
11 358Mrd. EUR
334,30Mrd. EUR
40,52Mrd. EUR