Embed Size (px)
Citation preview
Measuring Binding of Protein to Gel-Bound Ligands Using MagneticLevitationNathan D Shapirodagger Katherine A Miricadagger Siowling Sohdagger Scott T Phillipsdagger Olga Tarandagger
Charles R Macedagger Sergey S Shevkoplyassect and George M WhitesidesdaggerDagger
daggerDepartment of Chemistry amp Chemical Biology and DaggerWyss Institute for Biologically Inspired Engineering Harvard UniversityCambridge Massachusetts 02138 United StatessectDepartment of Biomedical Engineering Tulane University New Orleans Louisiana 70118 United States
S Supporting Information
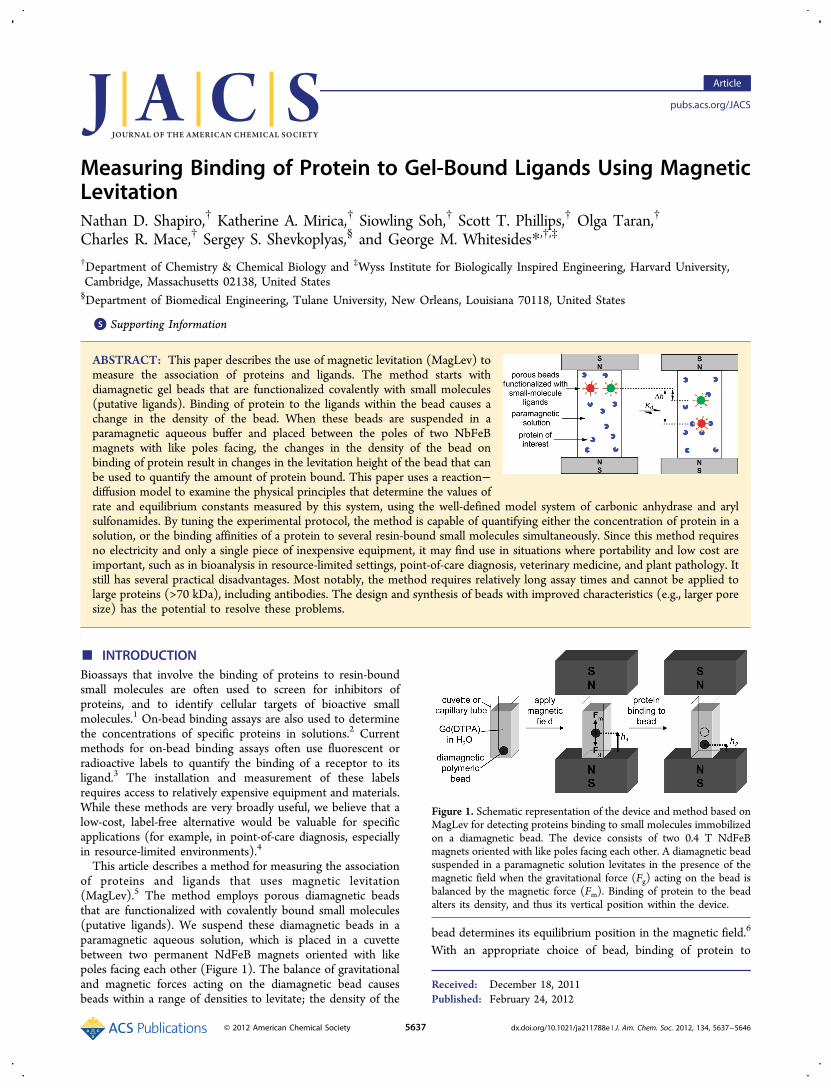
ABSTRACT This paper describes the use of magnetic levitation (MagLev) tomeasure the association of proteins and ligands The method starts withdiamagnetic gel beads that are functionalized covalently with small molecules(putative ligands) Binding of protein to the ligands within the bead causes achange in the density of the bead When these beads are suspended in aparamagnetic aqueous buffer and placed between the poles of two NbFeBmagnets with like poles facing the changes in the density of the bead onbinding of protein result in changes in the levitation height of the bead that canbe used to quantify the amount of protein bound This paper uses a reactionminusdiffusion model to examine the physical principles that determine the values ofrate and equilibrium constants measured by this system using the well-defined model system of carbonic anhydrase and arylsulfonamides By tuning the experimental protocol the method is capable of quantifying either the concentration of protein in asolution or the binding affinities of a protein to several resin-bound small molecules simultaneously Since this method requiresno electricity and only a single piece of inexpensive equipment it may find use in situations where portability and low cost areimportant such as in bioanalysis in resource-limited settings point-of-care diagnosis veterinary medicine and plant pathology Itstill has several practical disadvantages Most notably the method requires relatively long assay times and cannot be applied tolarge proteins (gt70 kDa) including antibodies The design and synthesis of beads with improved characteristics (eg larger poresize) has the potential to resolve these problems
INTRODUCTIONBioassays that involve the binding of proteins to resin-boundsmall molecules are often used to screen for inhibitors ofproteins and to identify cellular targets of bioactive smallmolecules1 On-bead binding assays are also used to determinethe concentrations of specific proteins in solutions2 Currentmethods for on-bead binding assays often use fluorescent orradioactive labels to quantify the binding of a receptor to itsligand3 The installation and measurement of these labelsrequires access to relatively expensive equipment and materialsWhile these methods are very broadly useful we believe that alow-cost label-free alternative would be valuable for specificapplications (for example in point-of-care diagnosis especiallyin resource-limited environments)4
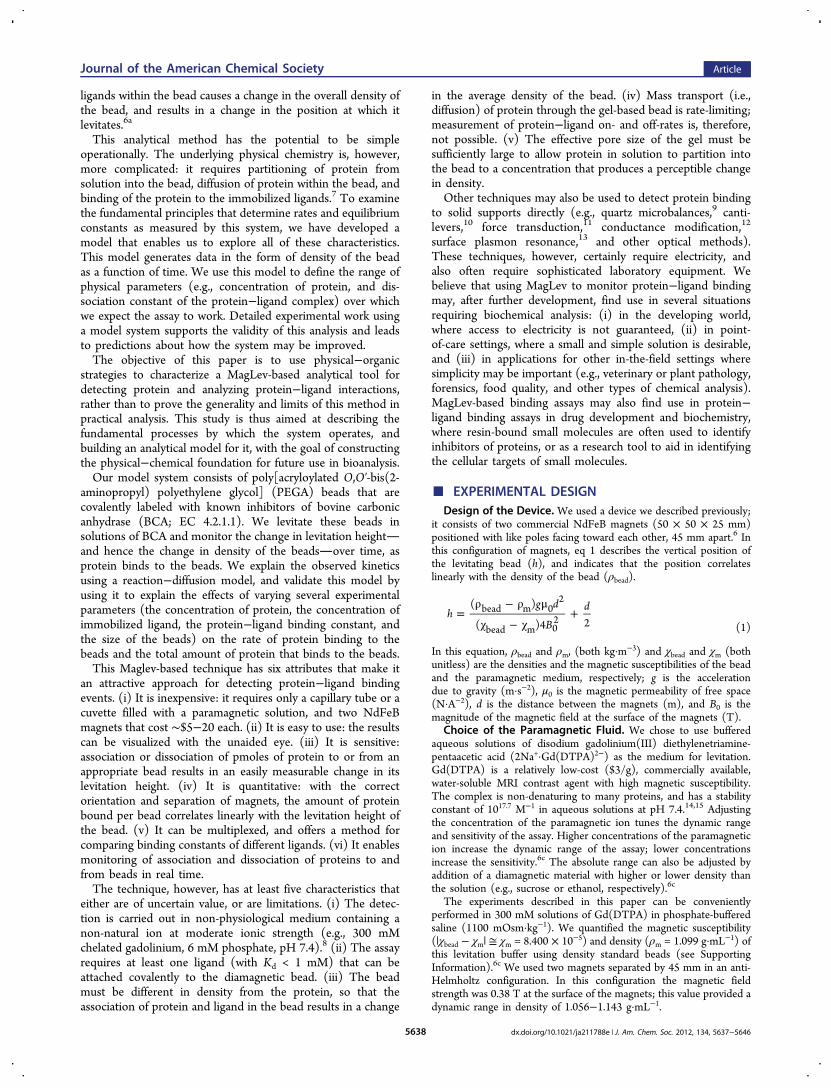
This article describes a method for measuring the associationof proteins and ligands that uses magnetic levitation(MagLev)5 The method employs porous diamagnetic beadsthat are functionalized with covalently bound small molecules(putative ligands) We suspend these diamagnetic beads in aparamagnetic aqueous solution which is placed in a cuvettebetween two permanent NdFeB magnets oriented with likepoles facing each other (Figure 1) The balance of gravitationaland magnetic forces acting on the diamagnetic bead causesbeads within a range of densities to levitate the density of the
bead determines its equilibrium position in the magnetic field6
With an appropriate choice of bead binding of protein to
Received December 18 2011Published February 24 2012
Figure 1 Schematic representation of the device and method based onMagLev for detecting proteins binding to small molecules immobilizedon a diamagnetic bead The device consists of two 04 T NdFeBmagnets oriented with like poles facing each other A diamagnetic beadsuspended in a paramagnetic solution levitates in the presence of themagnetic field when the gravitational force (Fg) acting on the bead isbalanced by the magnetic force (Fm) Binding of protein to the beadalters its density and thus its vertical position within the device
Article
pubsacsorgJACS
copy 2012 American Chemical Society 5637 dxdoiorg101021ja211788e | J Am Chem Soc 2012 134 5637minus5646
ligands within the bead causes a change in the overall density ofthe bead and results in a change in the position at which itlevitates6a
This analytical method has the potential to be simpleoperationally The underlying physical chemistry is howevermore complicated it requires partitioning of protein fromsolution into the bead diffusion of protein within the bead andbinding of the protein to the immobilized ligands7 To examinethe fundamental principles that determine rates and equilibriumconstants as measured by this system we have developed amodel that enables us to explore all of these characteristicsThis model generates data in the form of density of the beadas a function of time We use this model to define the range ofphysical parameters (eg concentration of protein and dis-sociation constant of the proteinminusligand complex) over whichwe expect the assay to work Detailed experimental work usinga model system supports the validity of this analysis and leadsto predictions about how the system may be improvedThe objective of this paper is to use physicalminusorganic
strategies to characterize a MagLev-based analytical tool fordetecting protein and analyzing proteinminusligand interactionsrather than to prove the generality and limits of this method inpractical analysis This study is thus aimed at describing thefundamental processes by which the system operates andbuilding an analytical model for it with the goal of constructingthe physicalminuschemical foundation for future use in bioanalysisOur model system consists of poly[acryloylated OOprime-bis(2-
aminopropyl) polyethylene glycol] (PEGA) beads that arecovalently labeled with known inhibitors of bovine carbonicanhydrase (BCA EC 4211) We levitate these beads insolutions of BCA and monitor the change in levitation heightand hence the change in density of the beadsover time asprotein binds to the beads We explain the observed kineticsusing a reactionminusdiffusion model and validate this model byusing it to explain the effects of varying several experimentalparameters (the concentration of protein the concentration ofimmobilized ligand the proteinminusligand binding constant andthe size of the beads) on the rate of protein binding to thebeads and the total amount of protein that binds to the beadsThis Maglev-based technique has six attributes that make it
an attractive approach for detecting proteinminusligand bindingevents (i) It is inexpensive it requires only a capillary tube or acuvette filled with a paramagnetic solution and two NdFeBmagnets that cost sim$5minus20 each (ii) It is easy to use the resultscan be visualized with the unaided eye (iii) It is sensitiveassociation or dissociation of pmoles of protein to or from anappropriate bead results in an easily measurable change in itslevitation height (iv) It is quantitative with the correctorientation and separation of magnets the amount of proteinbound per bead correlates linearly with the levitation height ofthe bead (v) It can be multiplexed and offers a method forcomparing binding constants of different ligands (vi) It enablesmonitoring of association and dissociation of proteins to andfrom beads in real timeThe technique however has at least five characteristics that
either are of uncertain value or are limitations (i) The detec-tion is carried out in non-physiological medium containing anon-natural ion at moderate ionic strength (eg 300 mMchelated gadolinium 6 mM phosphate pH 74)8 (ii) The assayrequires at least one ligand (with Kd lt 1 mM) that can beattached covalently to the diamagnetic bead (iii) The beadmust be different in density from the protein so that theassociation of protein and ligand in the bead results in a change
in the average density of the bead (iv) Mass transport (iediffusion) of protein through the gel-based bead is rate-limitingmeasurement of proteinminusligand on- and off-rates is thereforenot possible (v) The effective pore size of the gel must besufficiently large to allow protein in solution to partition intothe bead to a concentration that produces a perceptible changein densityOther techniques may also be used to detect protein binding
to solid supports directly (eg quartz microbalances9 canti-levers10 force transduction11 conductance modification12
surface plasmon resonance13 and other optical methods)These techniques however certainly require electricity andalso often require sophisticated laboratory equipment Webelieve that using MagLev to monitor proteinminusligand bindingmay after further development find use in several situationsrequiring biochemical analysis (i) in the developing worldwhere access to electricity is not guaranteed (ii) in point-of-care settings where a small and simple solution is desirableand (iii) in applications for other in-the-field settings wheresimplicity may be important (eg veterinary or plant pathologyforensics food quality and other types of chemical analysis)MagLev-based binding assays may also find use in proteinminusligand binding assays in drug development and biochemistrywhere resin-bound small molecules are often used to identifyinhibitors of proteins or as a research tool to aid in identifyingthe cellular targets of small molecules
EXPERIMENTAL DESIGNDesign of the Device We used a device we described previously
it consists of two commercial NdFeB magnets (50 times 50 times 25 mm)positioned with like poles facing toward each other 45 mm apart6 Inthis configuration of magnets eq 1 describes the vertical position ofthe levitating bead (h) and indicates that the position correlateslinearly with the density of the bead (ρbead)
=ρ minus ρ μ
χ minus χ+h
g d
Bd( )
( )4 2bead m 0
2
bead m 02
(1)
In this equation ρbead and ρm (both kgmiddotmminus3) and χbead and χm (bothunitless) are the densities and the magnetic susceptibilities of the beadand the paramagnetic medium respectively g is the accelerationdue to gravity (mmiddotsminus2) μ0 is the magnetic permeability of free space(NmiddotAminus2) d is the distance between the magnets (m) and B0 is themagnitude of the magnetic field at the surface of the magnets (T)
Choice of the Paramagnetic Fluid We chose to use bufferedaqueous solutions of disodium gadolinium(III) diethylenetriamine-pentaacetic acid (2Na+middotGd(DTPA)2minus) as the medium for levitationGd(DTPA) is a relatively low-cost ($3g) commercially availablewater-soluble MRI contrast agent with high magnetic susceptibilityThe complex is non-denaturing to many proteins and has a stabilityconstant of 10177 Mminus1 in aqueous solutions at pH 741415 Adjustingthe concentration of the paramagnetic ion tunes the dynamic rangeand sensitivity of the assay Higher concentrations of the paramagneticion increase the dynamic range of the assay lower concentrationsincrease the sensitivity6c The absolute range can also be adjusted byaddition of a diamagnetic material with higher or lower density thanthe solution (eg sucrose or ethanol respectively)6c
The experiments described in this paper can be convenientlyperformed in 300 mM solutions of Gd(DTPA) in phosphate-bufferedsaline (1100 mOsmmiddotkgminus1) We quantified the magnetic susceptibility(|χbead minus χm| cong χm = 8400 times 10minus5) and density (ρm = 1099 gmiddotmLminus1) ofthis levitation buffer using density standard beads (see SupportingInformation)6c We used two magnets separated by 45 mm in an anti-Helmholtz configuration In this configuration the magnetic fieldstrength was 038 T at the surface of the magnets this value provided adynamic range in density of 1056minus1143 gmiddotmLminus1
Journal of the American Chemical Society Article
dxdoiorg101021ja211788e | J Am Chem Soc 2012 134 5637minus56465638
We used a ruler with a millimeter scale to measure the distance fromthe bottom magnet to a levitating bead (ie the levitation height of thebead) Using a digital camera outfitted with a macro lens we couldmeasure this distance with an uncertainty of plusmn01 mm measuringthe levitation height with the unaided eye increased this uncertaintyto plusmn03 mm In this study the greatest source of uncertainty incalculating the density of a bead from the levitation height of that beadis the measurement of its levitation height Using a camera we couldtherefore measure the change in density of a bead with an uncertaintyof plusmn00002 g cmminus3 without the camera the uncertainty increasedto plusmn00006 g cmminus3Choice of Model ProteinminusLigand SystemWe defined the basic
biophysical chemistry of protein binding using BCA as a modelsystem16 for the following reasons (i) BCA is inexpensive andcommercially available (ii) Numerous inhibitors of BCA are knownmany are commercially available and have well-characterized bindingconstants Many inhibitors of CA contain aryl sulfonamides whichbind to the active site Zn(II) ion as anionic ligands and several of thereported inhibitors can be covalently attached to the polymericsupport using standard coupling chemistry (iii) BCA is a small protein(sim30 kDa) and will diffuse in and out of the PEGA beads (vide supra)used in this study (iv) BCA has an exceptionally stable tertiarystructure16 and is not adversely affected by the levitation media (v)There is extensive background on the use of carbonic anhydrase inphysical organic studies of protein binding16 In particular values of Kdkon and koff are known for a number of ligandsChoice of Solid Support (Resin)We used commercially available
poly[acryloylated OOprime-bis(2-aminopropyl) polyethylene glycol](PEGA) beads for this study (300minus500 μm diameter in water)17
This resin is synthesized from 1900 MW PEG These beads presentamine functionality (02 mmolmiddotgminus1) this functional group makeschemical modification straightforward In addition previous studieshave demonstrated that PEGA beads resist non-specific adsorption ofproteins18minus21 This combination of properties has resulted in theirwidespread use for applications including the identification of targetproteins of resin-bound small molecules18 the screening of librariesof inhibitors19 the synthesis of peptides20 and the covalent immo-bilization of proteins21
The density of PEGA beads (ρPEGA asymp 107 gmiddotcmminus3) is significantlydifferent from the density of the protein (ρprotein asymp 13minus15 gmiddotcmminus3)22
This difference in density is required if binding of protein to the beadis to cause a usefully quantifiable change in the overall density of thebead23
The main disadvantage of these commercial PEGA beads is thattheir small pores (as a cross-linked acrylamide gel) slow the masstransport of proteins into and through the interior of the bead andexcludes proteins with molecular weight greater than sim40minus70 kDa24
We used fluorescein-labeled BCA (FITC-BCA) to estimate both thediffusion coefficient of BCA in PEGA beads (Dbead asymp 5 times 10minus13 m2middotsminus1)and the partition coefficient of BCA between the beads and solution(Kbeadsol asymp 04 see the Supporting Information) This value for thediffusion coefficient of BCA within the bead agrees well with data fromthe literature25 and is approximately 2 orders of magnitude slowerthan the diffusion coefficient in water (sim9 times 10minus11 m2middotsminus1)26
Unmodified PEGA beads are also difficult to visualize duringlevitation because their refractive index is close to that of the solutionTo improve the visibility of these beads we functionalized a smallportion of the amines on them with dyes (eg by reaction with theisothiocyanates of rhodamine malachite green and 7-dimethylamino-4-methylcoumarin) These modifications make the beads easily visibleunder ambient or UV lightModel for Quantifying the Amount of Protein Bound Per
Bead with MagLev Using eq 1 we derived eq 2 to correlate changesin the amount of protein bound to the beads and changes in thelevitation height of the bead (Δh m)
Δ =ρ minus ρ μ
χ minus χh
g d
B
( )
( )4
beadp bead 02
bead m 02
(2)
The change in density ρbeadp minus ρbead is proportional to the differencein the amount of protein present in the bead after displacing anequivalent volume of the buffer solution out of the bead (eq 3) Here[P] is the concentration of protein within the bead (M) MWprotein(gmiddotmolminus1) and Vprotein (m3) are the molecular weight and volumeof a protein molecule NA (molminus1) is the Avogadro constant and ρsol(kgmiddotmminus3) is the density of the solution Using this relationship Δh canbe expressed linearly in terms of [P] (eq 4)
ρ minus ρ = minus ρV N[P](MW )beadp bead protein protein A sol (3)
Δ =minus ρ μ
χ minus χh
V N g d
B[P]
(MW )
( )4
protein protein A sol 02
bead m 02
(4)
BCA has a molecular weight of 291 kgmiddotmolminus1 and a volume of 3 times10minus26 m3 (the protein is assumed to be a sphere with radius sim20 Aring)27Equation 4 therefore predicts that under our standard levitationconditions a 1-mM increase in the concentration of protein within abead will result in a 5-mm decrease in levitation height Exper-imentally we obtained a similar value (Δh[P] = minus86 mmmM seeSupporting Information) the difference between these experimentaland theoretical values is likely due to a discrepancy between theassumed and actual volume of the protein Vprotein andor toinaccuracies in measurements of the volume of the beads
Model for Kinetic Analysis of Binding MagLev enables thedetection of a change in density that occurs when a soluble proteinassociates with or dissociates from a ligand that is covalentlyimmobilized on a gel or solid support (provided that there is adifference in density between the protein and the gelsolid support)We model the binding of protein to ligands immobilized in a gelmatrix by a three-step process (Figure 2A) (i) partitioning of theprotein from solution to the gel (thereby displacing an equivalentvolume of buffer solution from the bead into the bulk solution) (ii)diffusion of protein within the gel and (iii) binding and unbinding ofprotein to the ligands immobilized in the gel
Before each experiment the gel beads are first equilibrated with abuffered solution of Gd(DTPA) Using a magnetic susceptibilitybalance we found that the magnetic susceptibility of these equilibratedbeads is similar to the magnetic susceptibility of the buffer thisobservation indicates that the concentration of Gd(DTPA) in solutionis approximately the same both inside and outside the bead (seeSupporting Information) At the beginning of each experiment (t = 0)the beads are transferred to a solution of protein dissolved in the sameGd(DTPA) buffer The process that follows involving proteindiffusing into the beads and binding to the ligands immobilizedthere can be described mathematically as follows
Sulfonamide 1 when bound to resin is expected to bind tightly toBCA (the Kd of an analogous ligand in solution is 07 μM seeSupporting Information) Sulfonamide 2 should not associatemeasurably with BCA16 this functionalized bead serves as a controlThe PEGA beads we used have a density of amine groups of 02 mmol gminus1
(when dry) this value gives a final concentration of ligand within the beadof 1minus10 mM (when swollen in water)
The partitioning of the protein between the bead and the solution isdescribed by the partition coefficient Kbeadsol (eq 5) where [P]bead
ext
denotes the concentration of proteins at the external boundary of thebead and [P]sol denotes the concentration of protein in the bulksolution Once inside the bead the protein Pbead diffuses toward thecenter of the bead reacting with the immobilized ligands L to formproteinminusligand complexes PL according to eq 6 (Throughout thistext is used to indicate a species immobilized on the gel)
=K [P] [P]beadsol beadext sol (5)
+ ⎯ ⎯⎯ ⎯⎯⎯ P L PLk
kbead
off
on
(6)
Together the dynamics of all these three steps can be expressedmathematically in terms of a system of reactionminusdiffusion equations(eqs 7 and 8)28 In these equations r is the radial coordinate of the
Journal of the American Chemical Society Article
dxdoiorg101021ja211788e | J Am Chem Soc 2012 134 5637minus56465639
bead t is time and Dbead is the diffusion coefficient of the protein inthe bead
partpart
= nabla minus
times +
r tt
D r t k r t
r t k r t
[P] ( )[P] ( ) [P] ( )[ L]
( ) [ PL]( )
beadbead
2bead on bead
off (7)
part part
= minus + r tt
k r t r t k r t[ L]( )
[P] ( )[ L]( ) [ PL]( )on bead off
(8)
The initial parameters (at t = 0) are defined as follows (i) Theconcentration of ligand within the bead [L] is defined as [L]0 (ii)The concentration of protein in solution ([P]sol) is equal to [P]0sol(iii) There is no protein within the bead ([P]bead = 0) (iv) At theexternal boundary of the bead the concentration of protein isdescribed by the partition coefficient and the concentration of proteinin solution (eq 9)
= K[P] [P]beadext beadsol 0sol (9)
The volume of the bead is assumed to be constant therefore [PL]= [L]0 minus [L]29 Equation 10 describes the process of penetration ofprotein into the bead at its external boundary In this equation A is the
surface area of the bead r is the radial coordinate Vsol is the volume ofsolution and NB is the number of beads used
minuspart
part=
partpart=
D Ar t
VN
[P] [P]
r Rbead
bead sol sol
B (10)
To correspond with our experiments we used the followingparameters for our calculations (i) The radius of each bead R is170 μm (ii) There are 15 beads in each experiment (NB) (iii) Thevolume of the solution Vsol is 06 mL (iv) The initial concentration ofligand within the bead [L]0 is 32 mM (v) The partition coefficientKbeadsol is 04 (vi) The diffusion coefficient Dbead is sim10minus12 m2middotsminus1 asobserved in a previous study and confirmed experimentally by us (seeSupporting Information)25 Solving this system of equations using afinite-difference method30 in spherical coordinates (implemented inMatlab) gives the concentration profiles of protein ligand and boundproteinminusligand complex with respect to both space and timeIntegrating the concentration profile of bound proteinminusligandthroughout the bead gives the total amount of proteinminusligand com-plex in the bead nPL (eq 11)31
int= π n r r4 [ PL] dR
PL 02
(11)
Experimentally we determined that the change in levitation heightΔh (mm) is proportional to nPL (mmol) and inversely proportionalto the volume of the bead Vbead (L) according to the relationshipΔh = minus86nPLVbead (see Supporting Information eq 4 provides atheoretical approximation of this relationship)
Characteristic Time τ of the ReactionminusDiffusion ProcessWe describe here our derivation of a characteristic time parameter τwhich describes the time required for the reactionminusdiffusion processto reach equilibrium we begin by proving that this process is diffusion-limited Equation 12 describes the characteristic time for the binding ofprotein to ligands within a bead τrxn In this expression kon (M
minus1middotsminus1)is the reaction rate constant and [P]bead is a characteristic concentra-tion of protein in the bead this concentration can be represented bythe product of the partition coefficient Kbeadsol and the initial con-centration of protein in the solution [P]0sol Based on the knownvalues of kon (sim105 Mminus1middotsminus1)16 Kbeadsol (04) and [P]0sol (sim100 μM) thecharacteristic time (τrxn) for the forward reaction is therefore sim025 sEquation 13 describes the characteristic time for diffusion of the proteinwithin the bead (τdiff)
τ sim simk k K
1[P]
1[P]rxn
on bead on beadsol 0sol (12)
τ sim R Ddiff2
bead (13)
Given the diffusion coefficient of the protein in the bead Dbead asymp10minus12 m2middotsminus1 and a bead of radius R (sim170 μm) we estimate τdiff to beon the order of 8 h Since τdiff ≫ τrxn (8 h ≫ 025 s) the reactionminusdiffusion process is diffusion-limited We therefore make thefollowing two assumptions in order to derive a simple analyticalexpression for the characteristic time of the reactionminusdiffusionprocess (i) the reaction to form the proteinminusligand complex isinstantaneous in comparison to the rate of diffusion and (ii) onceformed the proteinminusligand complex PL does not dissociate (therate of dissociation is typically much slower than the rate ofassociation) Given these assumptions there exists a propagationfront of the protein (Figure 2B) that is a boundary where theconcentration of diffusive protein penetrating into the bead is zeroAt the propagation front the incoming flux of protein is immediatelyconsumed to form the proteinminusligand complex (eq 6) according toeq 14
partpart
= D Ar
t A l[P]
d [ L] dl
bead Fbead
0 F FF (14a)
Figure 2 Reactionminusdiffusion model describing the binding of proteinfrom solution to ligands immobilized in a gel bead (A) The modelconsists of three distinct steps (i) partitioning of the protein into thebead (ii) diffusion within the bead and (iii) binding of protein to theligand immobilized on the bead (B) In a diffusion-limited process(fastinstantaneous reaction) reaction only occurs at the propagatingfront lF when the flux of protein (before the front) encounters theunconsumed ligands at the front This approximation of the diffusion-limited process allows us to derive a simplified characteristic time τfor the reactionminusdiffusion process
Journal of the American Chemical Society Article
dxdoiorg101021ja211788e | J Am Chem Soc 2012 134 5637minus56465640
=
partpart
lt
Dr
dd [ L]
[P]
l
F bead
0
bead
F (14b)
In this equation r is the radial coordinate AF is the cross-sectionalarea of the front lF is the radial position of the front and dlFdt is thevelocity of the propagating front We derive an estimate of the termpart[P]beadpartr by considering the region before the propagating frontwhere the incoming protein is subject only to diffusion In this regionwe can apply a pseudo-steady approximation to the concentrationprofile of diffusing protein (eq 15)
partpart
partpart
=⎛⎝⎜
⎞⎠⎟r r
rr
1 [P]02
2 bead(15)
This approximation assumes that the concentration profile ofdiffusing protein is established much more rapidly than thepropagating front moves (this approximation is reasonable when[P]0solKbeadsol[L]0 ≪ 1 as is the case in our system)32 We derivethe average value ⟨1part[P]beadpartr|lF⟩r across the bead by solving eq 15using the following boundary conditions at r = R [P]bead =[P]0solKbeadsol and at r = lF [P]bead = 0 (eq 16)
partpart
=
minus⎛
⎝⎜⎜
⎞
⎠⎟⎟r
RK
[P]6[P]l
r
bead1
0sol beadsolF (16)
For the system we describe here the characteristic time τ of thereactionminusdiffusion process is proportional to the radius of the bead Rover the average velocity of the propagating front dlFdt (eq 17)32
Finally combining eqs 14 16 and 17 yields an expression thatdescribes the characteristic time τ as a function of a number ofexperimental variables (eq 18)
τ sim ⟨ ⟩R l t d d rF (17)
τ sim part
part
=
minus⎛
⎝⎜⎜
⎞
⎠⎟⎟
RD r
RD K
[ L] [P]
[ L]6 [P]
lr
0
bead
bead1
20
bead 0sol beadsol
F
(18)
This expression indicates that the time required for the system toreach steady-state is proportional to the square of the radius of thebeads R2 the initial concentration of the ligands in the bead [L]0and is inversely proportional to the diffusion coefficient Dbead theinitial concentration of protein in solution [P]0sol and the partitioncoefficient Kbeadsol These mathematical relationships agree wellwith experiment (vide supra) In practice the characteristic time τcan be derived from a plot of levitation height (h) versus time (t)by fitting the data to a first-order exponential equation (eq 19)where hf and h0 are the final and initial levitation heights res-pectively
= minus +minus τh h h h( ) e t0 f
f (19)
RESULTS AND DISCUSSIONThis section outlines a detailed physicalminusorganic study of aMagLev-based analytical tool that can be used for (i)quantifying the amount of protein bound to beads and (ii)monitoring the kinetics and thermodynamics of association ofproteins with resin-bound small molecules We use thisphysicalminusorganic study to identify the parameters thatultimately influence the function and practicality of this toolUnless specified otherwise all MagLev measurements were
performed in a solution of 300 mM Gd(DTPA) and 005polysorbate 20 dissolved in 6 mM phosphate buffer and adjusted
to pH 74 using sodium hydroxide (referred to throughout thistext as the ldquostandard levitation bufferrdquo) This composition provideda buffer with an approximate match in density to that of the PEGAbeads The chosen concentration of gadolinium(III) provided auseful compromise between sensitivity and dynamic range ofdetection by MagLev Addition of the non-denaturing surfactantpolysorbate 20 reduced non-specific binding of proteins to thePEGA beads and prevented the beads from adhering to thecuvette
MagLev Provides a Spectroscopy-Free Method of Mea-suring the Binding of Protein to Ligand-FunctionalizedPEGA Beads Initially we verified that protein would adsorb toPEGA beads only when these beads were functionalized with asmall-molecule ligand that bound specifically to that proteinWe reasoned that the binding of most proteins (average density asymp13minus15 gmiddotcmminus3) to PEGA beads (density asymp 107 gmiddotcmminus3)should increase the density of the beads and result in quan-tifiable changes in levitation height between bound andunbound statesThroughout these studies we used a well-characterized
system of proteins and ligands BCA and derivatives ofbenzenesulfonamide16 We immobilized 4-carboxybenzene-sulfonamides 1 and 2 on Rhodamine-dyed PEGA beads usingstandard coupling chemistry (eq 20 EDC = N-(3-dimethyl-
aminopropyl)-Nprime-ethylcarbodiimide NHS = N-hydroxysuccin-imide see Supporting Information for more information)At least 1 h before each experiment the PEGA beads were
placed in a solution of the standard levitation buffer in order toensure that they equilibrated completely with this buffer Wethen transferred 7minus10 beads functionalized with eithersulfonamide 1 or 2 into a microcuvette containing 06 mL ofa solution of BCA in the standard levitation buffer We observedonly a very small decrease (lt01 mm) in the levitation height ofbeads functionalized with 4-dimethylsulfamoylbenzoic acid 2after incubation with 033 mM BCA for 7 days In contrast weobserved a time- and concentration-dependent change in thelevitation height of beads functionalized with sulfonamide 1We plotted the change in levitation height of beads
functionalized with sulfonamide 1 (Δh in millimeters) versustime (t in hours) for each concentration of BCA and fit thesedata to our model of the reactionminusdiffusion process (eqs 7 and 8)The comparison demonstrates good agreement (Figure 3A)33
We estimate the dissociation constant from the model to be Kd asymp15 μM We note that since the process of protein binding toligands within the beads is diffusion-limited (see the section oncharacteristic time for further discussion) we can only determineKd and not the on and off rates (koff and kon)Equation 21 presents an alternative method of calculating the
dissociation constant using the equilibrium conditions of the
Journal of the American Chemical Society Article
dxdoiorg101021ja211788e | J Am Chem Soc 2012 134 5637minus56465641
reaction summarized in eq 6 and assuming that protein is inexcess
= minus
K K [P]
[ L] [ PL]
[ PL]d beadsol 0sol0 eq
eq (21)
Experimentally we found that with [P]0sol = 100 μM [L]0 =32 mM and Kbeadsol = 04 the final change in height of thebeads is 265 mm this value indicates that the [PL]eq is308 mM (eq 4) Substituting these values into eq 21 gives adissociation constant Kd of 15 μMThese results demonstrate that this MagLev-based method
provides reasonable estimates of binding constants for BCAwith benzenesulfonamides without the need for spectroscopyThe small difference between the measurements using MagLevand more conventional spectroscopic methods may be due to anincrease in the proteinminusligand dissociation constant as a result ofimmobilization of the ligand We previously found that theobserved dissociation constants of BCA with ligands in solutionare sim10 times lower than the dissociation constants of thecorresponding ligands presented on the surface of a monolayer34
The System Reaches a State of Equilibrium MoreRapidly When Higher Concentrations of Protein inSolution andor Lower Concentrations of Ligand withinthe Beads Are Used Based on our derivation of the
characteristic time τ we inferred that both increasing theconcentration of protein in solution and decreasing the con-centration of ligand within the bead should increase the rate atwhich the bead would reach an equilibrium concentration ofprotein and proteinminusligand complex (τ sim [L]0[P]0sol eq 18)In addition to decreasing the assay time experimenting withthese parameters would also allow us to test the validity of ourmodel To vary the concentration of ligand within the beads wecombined benzene sulfonamides 1 and 2 in molar ratios of 1012 18 126 and 180 We used these mixtures to synthesizebatches of PEGA beads containing different concentrations(32minus0040 mM) of benzene sulfonamide (eq 22)
We placed 7minus10 beads from each batch in a microcuvettecontaining a solution of 100 μM BCA dissolved in the standardlevitation buffer and plotted the change in levitation height(Δh in millimeters) versus time (t in hours) for eachconcentration of ligand (Figure 3B) Fitting these data to ourreactionminusdiffusion numerical integration model (eqs 3 and 10)revealed the expected correlations lower concentrations ofligand within the bead resulted in smaller changes in levitationheight (Δh = h0 minus hf) the equilibration time was howeverinversely proportional to the concentration of ligand in thebeadIn order to verify these results further we repeated the same
experiment with several different concentrations of BCA Eachplot was fit to a first-order exponential curve (eq 19) fromwhich we derived the calculated characteristic times τ Figure 4illustrates the expected mathematical relationships In Figure 4Awe plot characteristic time against the concentration ofligand 1 within the bead (τ versus [1]bead) the datademonstrate the expected linear relationship with theexception of the datum at 100 concentration of sulfonamide1 and 10 μM protein35 Similarly Figure 4B reveals the linearrelationship between the characteristic time and the inverse ofthe concentration of protein in solution (1[BCA]0sol againwith exclusion of the datum at 100 concentration of 1 and10 μM protein) Thus equilibration is much faster with lowerconcentrations of ligand within the bead ([L]0) and withhigher concentrations of protein in solution ([P]0sol) aspredicted by both the reactionminusdiffusion model and ourderivation of the characteristic time τ (eqs 10 and 18)
The Rate of Equilibration Is Faster for Smaller BeadsPEGA beads as supplied commercially span a range of sizesFor our studies beads purchased from Polymer Laboratorieswere reported to range in diameter from 300 to 500 μm (whenswollen in water) To quantify the effect of bead size on the rateof binding of protein to ligands within the bead we isolated the
Figure 3 Monitoring the association of bovine carbonic anhydrase(BCA) with 4-carboxybenzenesulfonamide (1) immobilized on PEGAbeads We levitated functionalized PEGA beads in cuvettes in thestandard levitation buffer (A) Adding BCA to the levitation mediaresulted in a change in levitation height (h) that depended on timeand on the concentration of protein The figure shows the fit of theexperimental plots to the estimates from the reactionminusdiffusion modelThe reactionminusdiffusion model predicts that the time to reachequilibrium should be proportional to the protein concentration(equilibration is predicted to be faster with higher proteinconcentrations) (B) We illustrate the effect of the ligandconcentration within the bead on the rate of change in levitationheight The data confirm that the time to reach equilibrium is inverselyproportional to the ligand concentration as predicted by the reactionminusdiffusion model
Journal of the American Chemical Society Article
dxdoiorg101021ja211788e | J Am Chem Soc 2012 134 5637minus56465642
largest and smallest beads by filtering through several sizes ofmesh (see Supporting Information)We levitated eight large beads (average radius of 166 plusmn
5 μm) and eight small beads (average radius of 136 plusmn 7 μm) ina solution of 130 μM BCA dissolved in the standard levitationbuffer Figure 5 shows the comparison of the change in
levitation height (Δh in millimeters) versus time (t in hours)for each batch of beads When these data were fit to first-orderexponential curves (eq 19) the calculated characteristic timesτ were 146 plusmn 27 h for the small beads and 269 plusmn 21 h forthe large beads This ratio is in accord with our prediction of
the relationship between the radius of the bead (R) and τ (τ simR2 eq 18)
MagLev Enables Multiple Binding Interactions To BeMonitored Simultaneously MagLev provides the basis foran on-bead assay that can measure the affinity of multipledifferent resin-bound small molecules for the same protein Tomake it possible to differentiate resin-bound inhibitors visuallywe functionalized a small portion of the available amines onPEGA beads with one of five different dyes (isothiocyanates ofrhodamine fluorescein malachite green eosin and 7-dimethylamino-4-methylcoumarin) Using standard couplingchemistry we attached five different ligands (4-carboxybenzenesulfonamide 4-(isothiocyanatomethyl) benzenesulfonamide 3-carboxybenzene sulfonamide 3-carboxy-4-methoxybenzenesulfonamide and 4-dimethylsulfamoylbenzoic acid) of carbonicanhydrase to the differently colored beadsWe then suspended these five color-coded beads each
functionalized with a different inhibitor of BCA (sim15 beads perinhibitor) in a microcuvette containing a solution of 100 μMBCA dissolved in the standard levitation buffer Initially thebeads all levitate at nearly the same height (Figure 6)36 In the
presence of BCA the beads begin to sink and begin tosegregate based on binding affinities The relative levitationheight of the beads represents the relative differences in bindingaffinities of the ligands attached to the beads the beadcontaining the ligand with the lowest dissociation constant forBCA levitates at the lowest value of h because it has moreprotein bound to it than the other two beads Using eq 21 wecalculated the dissociation constants of the immobilized ligandsfrom BCA We also measured the dissociation constants ofanalogous ligands in solution using fluorescence (seeSupporting Information) A comparison of the values measuredusing both methods demonstrates good agreement (Figure 6)
Figure 4 Effect of the concentration of protein in solution and theligand concentration within the beads on rates of equilibration Wecalculated each characteristic time τ by fitting a plot of levitationheight versus time to eq 18 The combined data substantiate ourderivation of the characteristic time (eq 17) by illustrating thepredicted linear relationships between (A) the characteristic time τ andthe concentration of ligand within the bead (expressed as thepercentage of the bead functionalized with sulfonamide 1) and (B)the characteristic time τ and the reciprocal of the concentration ofprotein in solution (1[BCA]0sol)
Figure 5 Effect of the radius of the bead on the rate of binding ofBCA to ligand-functionalized beads We levitated functionalized PEGAbeads in cuvettes in the presence of 130 μM BCA dissolved in thestandard levitation buffer We plot the average levitation height foreight large beads (⟨R⟩ = 166 plusmn 5 μm) and eight small beads (⟨R⟩ =136 plusmn 7 μm) versus time and show the predictions of the reactiondiffusion model (the dotted and dashed lines)
Figure 6 Using MagLev to measure the binding of BCA to severalimmobilized ligands This figure presents a series of photographsshowing changes in levitation height over time that result fromincubating PEGA beads functionalized with five different inhibitors ofBCA in the presence of 100 μM BCA dissolved in the standardlevitation buffer We used eq 21 to calculate the dissociation constantsof the immobilized ligands from BCA also shown in parentheses arethe dissociation constants of analogous ligands in solution from BCA(see Supporting Information)
Journal of the American Chemical Society Article
dxdoiorg101021ja211788e | J Am Chem Soc 2012 134 5637minus56465643
At the beginning of the experiment the beads form relativelytight clusters because they have equal densities As the beadsapproach 50 equilibration however they become increasinglydisperse We hypothesize that this dispersion results fromdifferences in the percentage of ligands that are bound toprotein as a result of differences in the size of the beads or thesize of the pores in the beads6b As the beads approach theirfinal levitation height their dispersion in levitation heightsdecreases because each bead contains the same concentrationof ligand and the final equilibrium levitation height ultimatelydepends only on the density of the bead not on its radiusMagLev Is a Useful Tool for Quantifying the
Concentration of a Specific Protein Methods for thedetection of small amounts (nmol to fmol) of protein haverevolutionized biotechnology and comprise some of the mostheavily used methods for the diagnosis of disease37 In order toadapt the MagLev-based methods described in this paper to thedetection of small amounts of protein we utilize a semi-kineticapproach We begin by incubating a single bead in a solution ofa target protein To provide optimal detection of small amountsof protein we fully functionalize this bead with a ligand thatbinds tightly to the target protein Specifically we use PEGAbeads functionalized with sulfonamide 1 to detect BCAWith the goal of detecting low concentrations of protein it is
beneficial to maximize the sensitivity of the system to changesin the density of the bead by performing measurements oflevitation height using the lowest practical concentration ofparamagnetic salt For these measurements we thereforeutilize a lower concentration of Gd(DTPA) than what ispresent in the standard levitation buffer 150 mM Gd(DTPA)provides a practical compromise between sensitivity andequilibration time With this concentration of Gd(DTPA)the beads reach their equilibrium levitation height in sim30 minand we are able to differentiate between differences in densityof plusmn00004 gcmminus3 With lower concentrations of Gd(DTPA)sensitivity is increased but the beads take significantly longer toreach their equilibrium levitation height6c Future studies willfocus on increasing the rate of adsorption of protein by usingsmaller beads lower concentrations of ligand within the beadsor beads with larger pore volumesReaching an equilibrium state at low concentrations of
protein requires an impractically long time (for example a beadfunctionalized with sulfonamide 1 requires more than onethousand hours to equilibrate fully with a 10 μM solution ofBCA) A calibration curve however can easily be generated torelate the change in levitation height after a given period oftime to the concentration of protein in the sample Figure 7demonstrates this relationship38
To generate the data in Figure 7A we incubated individualbeads functionalized with sulfonamide 1 in solutions (20 μL)of BCA (40 nMminus40 μM) dissolved in 10 mM PBS at roomtemperature (20 degC) for either 3 or 24 h We then transferredthese beads into a microcuvette containing a solution of150 mM Gd(DTPA) and 200 mM sucrose dissolved in 6 mMphosphate buffer and adjusted to pH 74 with NaOH (referredto hereafter as the ldquohigh sensitivity levitation bufferrdquo) andmeasured their levitation height (in comparison to thelevitation height of a bead that had been incubated in asolution free of BCA) After 3 h beads that have beenincubated in a 600 nM solution of BCA can be distinguishedfrom beads that have been incubated in a solution free of BCAafter 24 h the detection limit is lowered to 300 nM Notably
this method requires only 20 μL of sample (the volume ofblood in a typical finger prick)The initial rate of protein absorption correlates linearly with
the concentration of protein in solution (τ sim 1[P]0sol eq 18)as the ligands become saturated with protein however the rateof net protein diffusion into the beads decreases The result isthat at short incubation times there is an approximately linearrelationship between the concentration of protein in theincubation solution and the amount of protein adsorbed on thebead while at longer incubation times this simple correlationno longer holds true (at very long incubation times the systemapproaches equilibrium where binding is described by eq 21)
MagLev Can Be Used To Detect BCA in Blood Thisshort study was intended to determine if MagLev could operatesuccessfully starting with samples as complex as blood andserum We incubated individual beads functionalized withsulfonamide 1 in 20 μL aliquots of whole blood containing 2-fold dilutions of BCA (40 nMminus40 μM) After 3 h we separatedthese beads from the blood by filtration through a fine meshand rinsed them with levitation buffer We then transferred thebeads into a microcuvette containing the high sensitivitylevitation buffer (described above) and measured theirlevitation heights (in comparison to the levitation height of abead that had been incubated in whole blood containing noadded BCA Figure 7A) These results indicate that this methodis capable of detecting a specific protein in a complex biological
Figure 7 Detecting BCA using MagLev For these experiments beadswere levitated in the high sensitivity levitation buffer (A) Weincubated individual beads functionalized with sulfonamide 1 insolutions (20 μL) of BCA (40 nMminus40 μM) dissolved in 1 x PBS atroom temperature (20 degC) for either 3 or 24 h After incubation wetransferred the beads into microcuvettes containing the high-sensitivitylevitation buffer and measured their levitation heights (in comparisonto a bead that had been incubated in a solution free of BCA) We thenrepeated this experiment changing the incubation media to wholeblood (the beads were filtered and washed before levitation) Theerror bars show one standard deviation (n = 7) (B) We examined thetemperature dependence of the protein detection process Over a 24-hperiod beads that were incubated at 5 degC absorbed slightly less proteinthan beads that were incubated at 40 degC
Journal of the American Chemical Society Article
dxdoiorg101021ja211788e | J Am Chem Soc 2012 134 5637minus56465644
medium such as blood without the need for initial separation orpurification stepsThe Temperature of Incubation Has Only a Small
Influence on the ReactionminusDiffusion Process We alsoexamined the temperature dependence of this method ofdetecting protein (Figure 7B) We incubated PEGA beadsfunctionalized with sulfonamide 1 in solutions of BCA(40 nMminus40 μM) at two different temperatures (5 and 40 degC)for 24 h Only slightly more protein was absorbed into the beadsthat were incubated at the warmer temperature The differencebetween the levitation heights of the beads that were incubated atthese two temperatures is predicted by the inverse relationshipbetween the characteristic time τ of the reactionminusdiffusionprocess and the diffusion coefficient of the protein within the bead(τ sim 1Dbead eq 18) The dependence of the diffusion coefficientD on temperature T can be approximated by the StokesminusEinstein equation (eq 23)
=πη
Dk T
R6B
(23)
where kB is Boltzmannrsquos constant η is the dynamic viscosity of thelevitation media inside the bead and R is the hydrodynamic radiusof the protein inside the bead We assume that the levitation mediahas a dynamic viscosity similar to that of water (η5degC = 1519η40degC = 0653) and that R is independent of temperature theratio of Dbead40degC and Dbead5degC is therefore sim21 This valueagrees qualitatively with the increased rate of the reactionminusdiffusion process at higher temperatures
CONCLUSION
MagLev provides a new way to detect and measure specificproteinminusligand interactions Its simplicity and independence ofelectricity and infrastructure suggest that with development ithas the potential to be useful in resource-limited environmentsIn this method the binding of protein to ligands immobilizedwithin a gel bead results in a change in the density of the beadMagLev allows the density of the bead to be monitored in realtime with high accuracy and therefore provides a direct readoutof the amount of protein bound to the beadWe have developed a mathematical model of the reactionminus
diffusion processes that result in the binding of protein toligands immobilized within the bead This model provides goodquantitative agreement between theory and experiment Themagnitude of the change in levitation height as a function oftime depends on a number of controllable parameters including(i) the concentration of protein in solution (ii) the structureconcentration and binding constant of the ligand immobilizedin the bead and (iii) the size of the bead The rate of change inlevitation height also depends on a number of factors that aremore difficult to manipulate such as (i) the partition coefficientof the protein between the bead and the bulk solution and (ii)the diffusion coefficient of protein within the bead Wedeveloped eq 17 which describes the dependence of thecharacteristic time τ for protein binding to ligandsimmobilized within gel beads on all of the reaction parametersThis equation therefore allows the performance of the systemto be predicted under a variety of conditionsOverall the MagLev-based method for detecting proteinminus
ligand binding has a number of significant advantages (i) Thismethod requires no electricity and only a single piece ofequipment It may therefore find use in situations whereportability and low cost are a high priority for example in
point-of-care diagnosis especially in resource-limited militaryand home environments or in veterinary medicine plantpathology and food safety (ii) It is easy to use results can bevisualized with the naked eye (iii) It has the capability tomonitor binding accurately in real time This attribute providesa quantitative means of determining the concentration of aspecific protein in solution (iv) It can qualitatively distinguishthe binding affinities of a protein to several resin-bound smallmolecules simultaneously Using analogous proceduresMagLev should also be capable of measuring the binding ofmultiple proteins simultaneously to an array of resin-boundsmall molecules This property should allow for the readydesign of multiplexed binding assays (v) Proteinminusligandbinding directly results in a change in levitation height Thismethod therefore does not require intermediate reagents suchas enzyme-linked secondary antibodiesIn its present form this method also has several
disadvantages we summarize them briefly but note thatthere are clear development paths to reduce or eliminate them(i) The kinetics of proteinminusligand binding are relatively slow(on the order of several days) This problem may potentially beresolved through the design and synthesis of beads withimproved characteristics (eg larger pore size) (ii) Thismethod is only applicable to ligands that are amenable tochemical immobilization on a gel support this limitationhowever is inherent to most detection methods that occur onsolid support (iii) This method is currently not applicable tolarge proteins most notably antibodies due to the restrictedpore size of the PEGA beads we used (iv) For detection ofproteins in blood or other biological samples the gel beadsmust be separated from this sample (eg by filtration) beforeanalysis using Maglev this process adds time and complexity tothe method
ASSOCIATED CONTENTS Supporting InformationGeneral methods and additional experimental information Thismaterial is available free of charge via the Internet at httppubsacsorg
AUTHOR INFORMATIONCorresponding AuthorgwhitesidesgmwgroupharvardeduNotesThe authors declare no competing financial interest
ACKNOWLEDGMENTSThis work was partially supported by the Bill amp Melinda GatesFoundation (no 51308) the Wyss Institute of BiologicallyInspired Engineering the US Department of Energy (no DE-FG02-00ER45852 funding used for the development of themultiplexed assays) and postdoctoral fellowships from theDamon Runyon Cancer Research Foundation (STP) andNIH (STP and NDS)
REFERENCES(1) (a) Cuatrecasas P J Biol Chem 1970 245 3059 (b) Lam K SLebl M Krchnak V Chem Rev 1997 97 411 (c) Rademann JJung G Science 2000 287 1947 (d) Salisbury C M Maly D JEllman J A J Am Chem Soc 2002 124 14868 (e) Vegas A FullerJ Koehler A N Chem Soc Rev 2008 37 1385 (f) Gault V AMcClenaghan N H Understanding Bioanalytical Chemistry Principlesand Applications John Wiley amp Sons Ltd West Sussex UK 2009
Journal of the American Chemical Society Article
dxdoiorg101021ja211788e | J Am Chem Soc 2012 134 5637minus56465645
(2) (a) Venn R F Principles and Practice of Bioanalysis Taylor ampFrancis London UK 2000 (b) Walker J M Rapley R EdsMolecular Biomethods Handbook Humana Press Totowa NJ 2008(3) Stockwell B R Nature 2004 432 846(4) (a) Ahn C H Choi J W Beaucage G Nevin J H Lee J BPuntambek A Lee J Y Proc IEEE 2004 92 154 (b) Whitesides GM Nature 2006 442 368 (c) Yager P Edwards T Fu E HeltonK Nelson K Tam M R Weigl B H Nature 2006 442 412(d) Chin C D Linder V Sia S K Lab Chip 2007 7 41 (e) YagerP Domingo G Gerdes J Annu Rev Biomed Eng 2008 10 107(f) Konry T Walt D R J Am Chem Soc 2009 131 13232(5) (a) Beaugnon E Tournier R Nature 1991 349 470(b) Catherall A T Eaves L King P J Booth S R Nature2003 422 579 (c) Ikezoe Y Hirota N Nakagawa J Kitazawa KNature 1998 393 749 (d) Kimura T Mamada S Yamato MChem Lett 2000 1294(6) (a) Winkleman A Perez-Castillejos R Gudiksen K LPhillips S T Prentiss M Whitesides G M Anal Chem 2007 796542 (b) Mirica K A Phillips S T Shevkoplyas S S WhitesidesG M J Am Chem Soc 2008 130 17678 (c) Mirica K AShevkoplyas S S Phillips S T Gupta M Whitesides G M J AmChem Soc 2009 131 10049 (d) Mirica K A Phillips S T MaceC R Whitesides G M J Agric Food Chem 2010 58 6565(e) Mirica K A Ilievski F Ellerbee A K Shevkoplyas S SWhitesides G M Adv Mater 2011 23 4134(7) (a) Halling P J Ulijn R V Flitsch S L Curr Opin Biotechnol2005 16 385 (b) Laurent N Haddoub R Flitsch S L TrendsBiotechnol 2008 26 328 (c) Schuck P Zhao H Methods Mol Biol2010 627 15(8) Mammalian cells typically have intracellular ionic strengths on theorder of 200minus300 mM and contain sim200 mgmL protein see StoreyK B Functional Metabolism Regulation and Adaptation John Wiley ampSons Hoboken NJ 2004 p403(9) (a) Ebersole R C Ward M D J Am Chem Soc 1988 1108623 (b) Rickert J Brecht A Gopel W Biosens Bioelectron 199712 567 (c) Nishino H Murakawa A Mori T Okahata Y J AmChem Soc 2004 126 2264 (d) Su X Zhang J Sens Actuators B2004 100 309 (e) Muratsugu M Ohta F Miya Y Hosokawa TKurosawa S Kamo N Ikeda H Anal Chem 1993 65 2933(10) (a) Fritz J Baller M K Lang H P Rothuizen H VettigerP Meyer E Guntherodt H-J Gerber Ch Gimzewski J K Science2000 288 316 (b) Savran C A Knudsen S M Ellington A DManalis S R Anal Chem 2004 76 3194 (c) Burg T P Godin MKnudsen S M Shen W Carlson G Foster J S Babcock KManalis S R Nature 2007 446 1066 (d) Goeders K M Colton J SBottomley L A Chem Rev 2008 108 522 (e) Datar R Kim SJeon S Hesketh P Manalis S Boisen A Thundat T MRS Bull2009 34 449(11) Ndieyira J W Watari M Barrera A D Zhou D Vogtli MBatchelor M Cooper M A Strunz T Horton M A Abell CRayment T Aeppli G Mckendry R A Nat Nanotechnol 2008 3691(12) Chua J H Chee R E Agarwal A Wong S M Zhang G JAnal Chem 2009 81 6266(13) (a) Schasfoort R B Tudos A J Eds Handbook of SurfacePlasmon Resonance Royal Society of Chemistry Cambridge UK2008 (b) Homola J Chem Rev 2008 108 462 (c) Stewart M EAnderton C R Thompson L B Maria J Gray S K Rogers J ANuzzo R G Chem Rev 2008 108 494 (d) Mayer K M Hafner JH Chem Rev 2011 111 3828(14) Weinmann H-J Brasch R C Press W-R Wesbey G E AmJ Roentgenol 1984 142 619(15) Caravan P Ellison J J McMurry T J Lauffer R B ChemRev 1999 99 2293(16) Krishnamurthy V M Kaufman G K Urbach A R Gitlin IGudiksen K L Weibel D B Whitesides G M Chem Rev 2008108 946
(17) (a) Auzanneau F-I Meldal M Bock K J Pept Sci 1995 131 (b) Renil M Ferreras M Delaisse J M Foged N T MeldalM J Pept Sci 1998 4 195(18) Kuramochi K Miyano Y Enomoto Y Takeuchi R Ishi KTakakusagi Y Saitoh T Fukudome K Manita D Takeda YKobayashi S Sakaguchi K Sugawara F Bioconjugate Chem 200819 2417(19) (a) Meldal M Svendsen I Breddam K Auzanneau F I ProcNatl Acad Sci USA 1994 91 3314 (b) Meldal M Svendsen I JChem Soc Perkin Trans 1 1995 1591(20) (a) Meldal M Auzanneau F I Hindsgaul O Palcic M MJ Chem Soc Chem Commun 1994 1849 (b) Renil M Meldal MTetrahedron Lett 1995 36 4647 (c) Haddoub R Dauner MStefanowicz F A Barattini V Laurent N Flitsch S L Org BiomolChem 2009 7 665(21) Wong L S Thirlway J Micklefield J J Am Chem Soc 2008130 12456(22) (a) Chick H Martin C J Biochem J 1913 7 92 (b) QuillinM L Matthews B W Acta Crystallogr 2000 56 791 (c) Fischer HPolikarpov I Craievich A F Protein Sci 2004 13 2825(23) It would also be possible to use beads with density greater thanthe density of protein This experimental design however wouldrequire that the levitation media contain a diamagnetic cosolute ofhigh density in order to match the density of the levitation media (ρm)with the density of the bead(24) (a) Kress J Zanaletti R Amour A Ladlow M Frey J GBradley M ChemEur J 2002 8 3769 (b) Auzanneau F-IMeldal M Bock K J Pept Sci 1995 1 31(25) (a) Thornton P D McConnell G Ulijn R V ChemCommun 2005 5913 (b) Bosma A Y Ulijn R V McConnell GGirkin J Halling P J Flitsch S L Chem Commun 2003 2790(26) Tyn M T Gusek T W Biotechnol Bioeng 1990 35 327(27) Gao J Whitesides G M Anal Chem 1997 69 575(28) Wei Y Wesson P J Kourkine I Grzybowski B A AnalChem 2010 82 8780(29) Previous studies have demonstrated that protein binding toPEGA beads does not significantly change the volume of the beadssee ref 25(30) Morton K W Mayers D F Numerical Solution of PartialDifferential Equations An Introduction Cambridge University PressCambridge UK 2005(31) Although both bound and unbound protein increase the densityof the bead the influence of the unbound protein is negligible becauseits concentration is significantly lower than the concentration of thebound protein(32) Deen W M Analysis of Transport Phenomena OxfordUniversity Press New York 1998(33) The plots shown in Figure 3 are also presented in theSupporting Information with error bars(34) Mrksich M Grunwell J R Whitesides G M J Am ChemSoc 1995 117 12009(35) We monitored the levitation height of beads functionalized with100 sulfonamide 1 in the presence of 10 μM BCA for more than 500 h(3 weeks) Even after this extended period of time proteinminusligandbinding had not yet reached its equilibrium state This fact hindered ourability to calculate accurately the characteristic time for this system as aresult we have excluded this datum point from further analysis(36) The small variations in the initial levitation heights of the color-coded beads are likely due to differences in the densities of the beadsresulting from differences in the densities of the covalentlyimmobilized ligands see ref 6b(37) (a) Wild D Ed The Immunoassay Handbook Macmillan PressBasingstoke UK 1994 (b) Lost G J Principles amp Practice of Point-of-Care Testing Lippincott Williams amp Wilkins Philadelphia PA 2002(38) The plot shown in Figure 7A is also presented in the SupportingInformation with a logarithmic concentration axis
Journal of the American Chemical Society Article
dxdoiorg101021ja211788e | J Am Chem Soc 2012 134 5637minus56465646
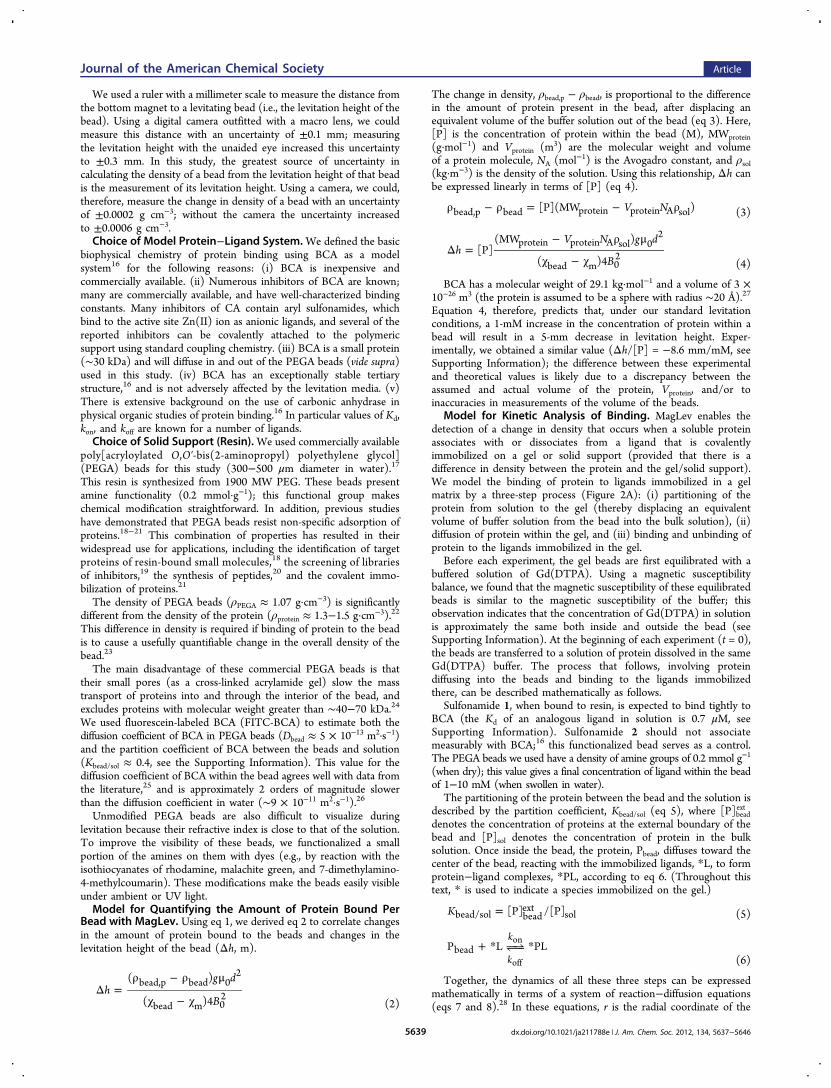
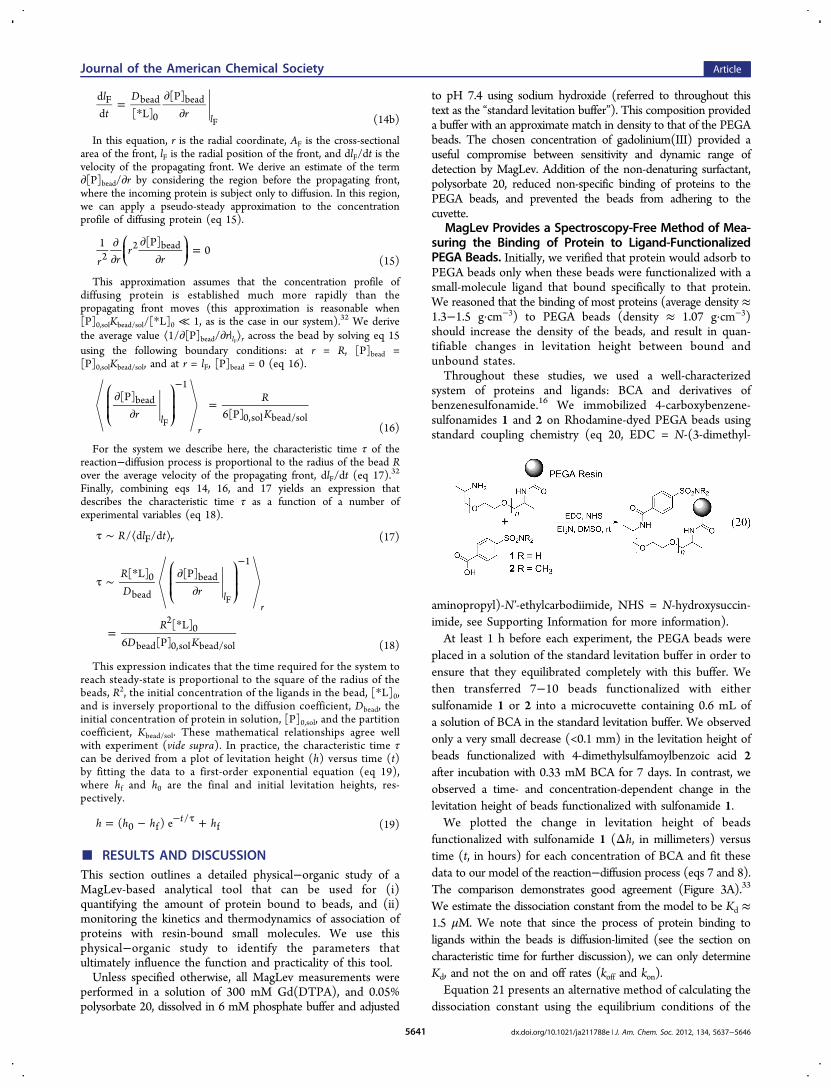
=
partpart
lt
Dr
dd [ L]
[P]
l
F bead
0
bead
F (14b)
In this equation r is the radial coordinate AF is the cross-sectionalarea of the front lF is the radial position of the front and dlFdt is thevelocity of the propagating front We derive an estimate of the termpart[P]beadpartr by considering the region before the propagating frontwhere the incoming protein is subject only to diffusion In this regionwe can apply a pseudo-steady approximation to the concentrationprofile of diffusing protein (eq 15)
partpart
partpart
=⎛⎝⎜
⎞⎠⎟r r
rr
1 [P]02
2 bead(15)
This approximation assumes that the concentration profile ofdiffusing protein is established much more rapidly than thepropagating front moves (this approximation is reasonable when[P]0solKbeadsol[L]0 ≪ 1 as is the case in our system)32 We derivethe average value ⟨1part[P]beadpartr|lF⟩r across the bead by solving eq 15using the following boundary conditions at r = R [P]bead =[P]0solKbeadsol and at r = lF [P]bead = 0 (eq 16)
partpart
=
minus⎛
⎝⎜⎜
⎞
⎠⎟⎟r
RK
[P]6[P]l
r
bead1
0sol beadsolF (16)
For the system we describe here the characteristic time τ of thereactionminusdiffusion process is proportional to the radius of the bead Rover the average velocity of the propagating front dlFdt (eq 17)32
Finally combining eqs 14 16 and 17 yields an expression thatdescribes the characteristic time τ as a function of a number ofexperimental variables (eq 18)
τ sim ⟨ ⟩R l t d d rF (17)
τ sim part
part
=
minus⎛
⎝⎜⎜
⎞
⎠⎟⎟
RD r
RD K
[ L] [P]
[ L]6 [P]
lr
0
bead
bead1
20
bead 0sol beadsol
F
(18)
This expression indicates that the time required for the system toreach steady-state is proportional to the square of the radius of thebeads R2 the initial concentration of the ligands in the bead [L]0and is inversely proportional to the diffusion coefficient Dbead theinitial concentration of protein in solution [P]0sol and the partitioncoefficient Kbeadsol These mathematical relationships agree wellwith experiment (vide supra) In practice the characteristic time τcan be derived from a plot of levitation height (h) versus time (t)by fitting the data to a first-order exponential equation (eq 19)where hf and h0 are the final and initial levitation heights res-pectively
= minus +minus τh h h h( ) e t0 f
f (19)
RESULTS AND DISCUSSIONThis section outlines a detailed physicalminusorganic study of aMagLev-based analytical tool that can be used for (i)quantifying the amount of protein bound to beads and (ii)monitoring the kinetics and thermodynamics of association ofproteins with resin-bound small molecules We use thisphysicalminusorganic study to identify the parameters thatultimately influence the function and practicality of this toolUnless specified otherwise all MagLev measurements were
performed in a solution of 300 mM Gd(DTPA) and 005polysorbate 20 dissolved in 6 mM phosphate buffer and adjusted
to pH 74 using sodium hydroxide (referred to throughout thistext as the ldquostandard levitation bufferrdquo) This composition provideda buffer with an approximate match in density to that of the PEGAbeads The chosen concentration of gadolinium(III) provided auseful compromise between sensitivity and dynamic range ofdetection by MagLev Addition of the non-denaturing surfactantpolysorbate 20 reduced non-specific binding of proteins to thePEGA beads and prevented the beads from adhering to thecuvette
MagLev Provides a Spectroscopy-Free Method of Mea-suring the Binding of Protein to Ligand-FunctionalizedPEGA Beads Initially we verified that protein would adsorb toPEGA beads only when these beads were functionalized with asmall-molecule ligand that bound specifically to that proteinWe reasoned that the binding of most proteins (average density asymp13minus15 gmiddotcmminus3) to PEGA beads (density asymp 107 gmiddotcmminus3)should increase the density of the beads and result in quan-tifiable changes in levitation height between bound andunbound statesThroughout these studies we used a well-characterized
system of proteins and ligands BCA and derivatives ofbenzenesulfonamide16 We immobilized 4-carboxybenzene-sulfonamides 1 and 2 on Rhodamine-dyed PEGA beads usingstandard coupling chemistry (eq 20 EDC = N-(3-dimethyl-
aminopropyl)-Nprime-ethylcarbodiimide NHS = N-hydroxysuccin-imide see Supporting Information for more information)At least 1 h before each experiment the PEGA beads were
placed in a solution of the standard levitation buffer in order toensure that they equilibrated completely with this buffer Wethen transferred 7minus10 beads functionalized with eithersulfonamide 1 or 2 into a microcuvette containing 06 mL ofa solution of BCA in the standard levitation buffer We observedonly a very small decrease (lt01 mm) in the levitation height ofbeads functionalized with 4-dimethylsulfamoylbenzoic acid 2after incubation with 033 mM BCA for 7 days In contrast weobserved a time- and concentration-dependent change in thelevitation height of beads functionalized with sulfonamide 1We plotted the change in levitation height of beads
functionalized with sulfonamide 1 (Δh in millimeters) versustime (t in hours) for each concentration of BCA and fit thesedata to our model of the reactionminusdiffusion process (eqs 7 and 8)The comparison demonstrates good agreement (Figure 3A)33
We estimate the dissociation constant from the model to be Kd asymp15 μM We note that since the process of protein binding toligands within the beads is diffusion-limited (see the section oncharacteristic time for further discussion) we can only determineKd and not the on and off rates (koff and kon)Equation 21 presents an alternative method of calculating the
dissociation constant using the equilibrium conditions of the
Journal of the American Chemical Society Article
dxdoiorg101021ja211788e | J Am Chem Soc 2012 134 5637minus56465641
reaction summarized in eq 6 and assuming that protein is inexcess
= minus
K K [P]
[ L] [ PL]
[ PL]d beadsol 0sol0 eq
eq (21)
Experimentally we found that with [P]0sol = 100 μM [L]0 =32 mM and Kbeadsol = 04 the final change in height of thebeads is 265 mm this value indicates that the [PL]eq is308 mM (eq 4) Substituting these values into eq 21 gives adissociation constant Kd of 15 μMThese results demonstrate that this MagLev-based method
provides reasonable estimates of binding constants for BCAwith benzenesulfonamides without the need for spectroscopyThe small difference between the measurements using MagLevand more conventional spectroscopic methods may be due to anincrease in the proteinminusligand dissociation constant as a result ofimmobilization of the ligand We previously found that theobserved dissociation constants of BCA with ligands in solutionare sim10 times lower than the dissociation constants of thecorresponding ligands presented on the surface of a monolayer34
The System Reaches a State of Equilibrium MoreRapidly When Higher Concentrations of Protein inSolution andor Lower Concentrations of Ligand withinthe Beads Are Used Based on our derivation of the
characteristic time τ we inferred that both increasing theconcentration of protein in solution and decreasing the con-centration of ligand within the bead should increase the rate atwhich the bead would reach an equilibrium concentration ofprotein and proteinminusligand complex (τ sim [L]0[P]0sol eq 18)In addition to decreasing the assay time experimenting withthese parameters would also allow us to test the validity of ourmodel To vary the concentration of ligand within the beads wecombined benzene sulfonamides 1 and 2 in molar ratios of 1012 18 126 and 180 We used these mixtures to synthesizebatches of PEGA beads containing different concentrations(32minus0040 mM) of benzene sulfonamide (eq 22)
We placed 7minus10 beads from each batch in a microcuvettecontaining a solution of 100 μM BCA dissolved in the standardlevitation buffer and plotted the change in levitation height(Δh in millimeters) versus time (t in hours) for eachconcentration of ligand (Figure 3B) Fitting these data to ourreactionminusdiffusion numerical integration model (eqs 3 and 10)revealed the expected correlations lower concentrations ofligand within the bead resulted in smaller changes in levitationheight (Δh = h0 minus hf) the equilibration time was howeverinversely proportional to the concentration of ligand in thebeadIn order to verify these results further we repeated the same
experiment with several different concentrations of BCA Eachplot was fit to a first-order exponential curve (eq 19) fromwhich we derived the calculated characteristic times τ Figure 4illustrates the expected mathematical relationships In Figure 4Awe plot characteristic time against the concentration ofligand 1 within the bead (τ versus [1]bead) the datademonstrate the expected linear relationship with theexception of the datum at 100 concentration of sulfonamide1 and 10 μM protein35 Similarly Figure 4B reveals the linearrelationship between the characteristic time and the inverse ofthe concentration of protein in solution (1[BCA]0sol againwith exclusion of the datum at 100 concentration of 1 and10 μM protein) Thus equilibration is much faster with lowerconcentrations of ligand within the bead ([L]0) and withhigher concentrations of protein in solution ([P]0sol) aspredicted by both the reactionminusdiffusion model and ourderivation of the characteristic time τ (eqs 10 and 18)
The Rate of Equilibration Is Faster for Smaller BeadsPEGA beads as supplied commercially span a range of sizesFor our studies beads purchased from Polymer Laboratorieswere reported to range in diameter from 300 to 500 μm (whenswollen in water) To quantify the effect of bead size on the rateof binding of protein to ligands within the bead we isolated the
Figure 3 Monitoring the association of bovine carbonic anhydrase(BCA) with 4-carboxybenzenesulfonamide (1) immobilized on PEGAbeads We levitated functionalized PEGA beads in cuvettes in thestandard levitation buffer (A) Adding BCA to the levitation mediaresulted in a change in levitation height (h) that depended on timeand on the concentration of protein The figure shows the fit of theexperimental plots to the estimates from the reactionminusdiffusion modelThe reactionminusdiffusion model predicts that the time to reachequilibrium should be proportional to the protein concentration(equilibration is predicted to be faster with higher proteinconcentrations) (B) We illustrate the effect of the ligandconcentration within the bead on the rate of change in levitationheight The data confirm that the time to reach equilibrium is inverselyproportional to the ligand concentration as predicted by the reactionminusdiffusion model
Journal of the American Chemical Society Article
dxdoiorg101021ja211788e | J Am Chem Soc 2012 134 5637minus56465642
largest and smallest beads by filtering through several sizes ofmesh (see Supporting Information)We levitated eight large beads (average radius of 166 plusmn
5 μm) and eight small beads (average radius of 136 plusmn 7 μm) ina solution of 130 μM BCA dissolved in the standard levitationbuffer Figure 5 shows the comparison of the change in
levitation height (Δh in millimeters) versus time (t in hours)for each batch of beads When these data were fit to first-orderexponential curves (eq 19) the calculated characteristic timesτ were 146 plusmn 27 h for the small beads and 269 plusmn 21 h forthe large beads This ratio is in accord with our prediction of
the relationship between the radius of the bead (R) and τ (τ simR2 eq 18)
MagLev Enables Multiple Binding Interactions To BeMonitored Simultaneously MagLev provides the basis foran on-bead assay that can measure the affinity of multipledifferent resin-bound small molecules for the same protein Tomake it possible to differentiate resin-bound inhibitors visuallywe functionalized a small portion of the available amines onPEGA beads with one of five different dyes (isothiocyanates ofrhodamine fluorescein malachite green eosin and 7-dimethylamino-4-methylcoumarin) Using standard couplingchemistry we attached five different ligands (4-carboxybenzenesulfonamide 4-(isothiocyanatomethyl) benzenesulfonamide 3-carboxybenzene sulfonamide 3-carboxy-4-methoxybenzenesulfonamide and 4-dimethylsulfamoylbenzoic acid) of carbonicanhydrase to the differently colored beadsWe then suspended these five color-coded beads each
functionalized with a different inhibitor of BCA (sim15 beads perinhibitor) in a microcuvette containing a solution of 100 μMBCA dissolved in the standard levitation buffer Initially thebeads all levitate at nearly the same height (Figure 6)36 In the
presence of BCA the beads begin to sink and begin tosegregate based on binding affinities The relative levitationheight of the beads represents the relative differences in bindingaffinities of the ligands attached to the beads the beadcontaining the ligand with the lowest dissociation constant forBCA levitates at the lowest value of h because it has moreprotein bound to it than the other two beads Using eq 21 wecalculated the dissociation constants of the immobilized ligandsfrom BCA We also measured the dissociation constants ofanalogous ligands in solution using fluorescence (seeSupporting Information) A comparison of the values measuredusing both methods demonstrates good agreement (Figure 6)
Figure 4 Effect of the concentration of protein in solution and theligand concentration within the beads on rates of equilibration Wecalculated each characteristic time τ by fitting a plot of levitationheight versus time to eq 18 The combined data substantiate ourderivation of the characteristic time (eq 17) by illustrating thepredicted linear relationships between (A) the characteristic time τ andthe concentration of ligand within the bead (expressed as thepercentage of the bead functionalized with sulfonamide 1) and (B)the characteristic time τ and the reciprocal of the concentration ofprotein in solution (1[BCA]0sol)
Figure 5 Effect of the radius of the bead on the rate of binding ofBCA to ligand-functionalized beads We levitated functionalized PEGAbeads in cuvettes in the presence of 130 μM BCA dissolved in thestandard levitation buffer We plot the average levitation height foreight large beads (⟨R⟩ = 166 plusmn 5 μm) and eight small beads (⟨R⟩ =136 plusmn 7 μm) versus time and show the predictions of the reactiondiffusion model (the dotted and dashed lines)
Figure 6 Using MagLev to measure the binding of BCA to severalimmobilized ligands This figure presents a series of photographsshowing changes in levitation height over time that result fromincubating PEGA beads functionalized with five different inhibitors ofBCA in the presence of 100 μM BCA dissolved in the standardlevitation buffer We used eq 21 to calculate the dissociation constantsof the immobilized ligands from BCA also shown in parentheses arethe dissociation constants of analogous ligands in solution from BCA(see Supporting Information)
Journal of the American Chemical Society Article
dxdoiorg101021ja211788e | J Am Chem Soc 2012 134 5637minus56465643
At the beginning of the experiment the beads form relativelytight clusters because they have equal densities As the beadsapproach 50 equilibration however they become increasinglydisperse We hypothesize that this dispersion results fromdifferences in the percentage of ligands that are bound toprotein as a result of differences in the size of the beads or thesize of the pores in the beads6b As the beads approach theirfinal levitation height their dispersion in levitation heightsdecreases because each bead contains the same concentrationof ligand and the final equilibrium levitation height ultimatelydepends only on the density of the bead not on its radiusMagLev Is a Useful Tool for Quantifying the
Concentration of a Specific Protein Methods for thedetection of small amounts (nmol to fmol) of protein haverevolutionized biotechnology and comprise some of the mostheavily used methods for the diagnosis of disease37 In order toadapt the MagLev-based methods described in this paper to thedetection of small amounts of protein we utilize a semi-kineticapproach We begin by incubating a single bead in a solution ofa target protein To provide optimal detection of small amountsof protein we fully functionalize this bead with a ligand thatbinds tightly to the target protein Specifically we use PEGAbeads functionalized with sulfonamide 1 to detect BCAWith the goal of detecting low concentrations of protein it is
beneficial to maximize the sensitivity of the system to changesin the density of the bead by performing measurements oflevitation height using the lowest practical concentration ofparamagnetic salt For these measurements we thereforeutilize a lower concentration of Gd(DTPA) than what ispresent in the standard levitation buffer 150 mM Gd(DTPA)provides a practical compromise between sensitivity andequilibration time With this concentration of Gd(DTPA)the beads reach their equilibrium levitation height in sim30 minand we are able to differentiate between differences in densityof plusmn00004 gcmminus3 With lower concentrations of Gd(DTPA)sensitivity is increased but the beads take significantly longer toreach their equilibrium levitation height6c Future studies willfocus on increasing the rate of adsorption of protein by usingsmaller beads lower concentrations of ligand within the beadsor beads with larger pore volumesReaching an equilibrium state at low concentrations of
protein requires an impractically long time (for example a beadfunctionalized with sulfonamide 1 requires more than onethousand hours to equilibrate fully with a 10 μM solution ofBCA) A calibration curve however can easily be generated torelate the change in levitation height after a given period oftime to the concentration of protein in the sample Figure 7demonstrates this relationship38
To generate the data in Figure 7A we incubated individualbeads functionalized with sulfonamide 1 in solutions (20 μL)of BCA (40 nMminus40 μM) dissolved in 10 mM PBS at roomtemperature (20 degC) for either 3 or 24 h We then transferredthese beads into a microcuvette containing a solution of150 mM Gd(DTPA) and 200 mM sucrose dissolved in 6 mMphosphate buffer and adjusted to pH 74 with NaOH (referredto hereafter as the ldquohigh sensitivity levitation bufferrdquo) andmeasured their levitation height (in comparison to thelevitation height of a bead that had been incubated in asolution free of BCA) After 3 h beads that have beenincubated in a 600 nM solution of BCA can be distinguishedfrom beads that have been incubated in a solution free of BCAafter 24 h the detection limit is lowered to 300 nM Notably
this method requires only 20 μL of sample (the volume ofblood in a typical finger prick)The initial rate of protein absorption correlates linearly with
the concentration of protein in solution (τ sim 1[P]0sol eq 18)as the ligands become saturated with protein however the rateof net protein diffusion into the beads decreases The result isthat at short incubation times there is an approximately linearrelationship between the concentration of protein in theincubation solution and the amount of protein adsorbed on thebead while at longer incubation times this simple correlationno longer holds true (at very long incubation times the systemapproaches equilibrium where binding is described by eq 21)
MagLev Can Be Used To Detect BCA in Blood Thisshort study was intended to determine if MagLev could operatesuccessfully starting with samples as complex as blood andserum We incubated individual beads functionalized withsulfonamide 1 in 20 μL aliquots of whole blood containing 2-fold dilutions of BCA (40 nMminus40 μM) After 3 h we separatedthese beads from the blood by filtration through a fine meshand rinsed them with levitation buffer We then transferred thebeads into a microcuvette containing the high sensitivitylevitation buffer (described above) and measured theirlevitation heights (in comparison to the levitation height of abead that had been incubated in whole blood containing noadded BCA Figure 7A) These results indicate that this methodis capable of detecting a specific protein in a complex biological
Figure 7 Detecting BCA using MagLev For these experiments beadswere levitated in the high sensitivity levitation buffer (A) Weincubated individual beads functionalized with sulfonamide 1 insolutions (20 μL) of BCA (40 nMminus40 μM) dissolved in 1 x PBS atroom temperature (20 degC) for either 3 or 24 h After incubation wetransferred the beads into microcuvettes containing the high-sensitivitylevitation buffer and measured their levitation heights (in comparisonto a bead that had been incubated in a solution free of BCA) We thenrepeated this experiment changing the incubation media to wholeblood (the beads were filtered and washed before levitation) Theerror bars show one standard deviation (n = 7) (B) We examined thetemperature dependence of the protein detection process Over a 24-hperiod beads that were incubated at 5 degC absorbed slightly less proteinthan beads that were incubated at 40 degC
Journal of the American Chemical Society Article
dxdoiorg101021ja211788e | J Am Chem Soc 2012 134 5637minus56465644
medium such as blood without the need for initial separation orpurification stepsThe Temperature of Incubation Has Only a Small
Influence on the ReactionminusDiffusion Process We alsoexamined the temperature dependence of this method ofdetecting protein (Figure 7B) We incubated PEGA beadsfunctionalized with sulfonamide 1 in solutions of BCA(40 nMminus40 μM) at two different temperatures (5 and 40 degC)for 24 h Only slightly more protein was absorbed into the beadsthat were incubated at the warmer temperature The differencebetween the levitation heights of the beads that were incubated atthese two temperatures is predicted by the inverse relationshipbetween the characteristic time τ of the reactionminusdiffusionprocess and the diffusion coefficient of the protein within the bead(τ sim 1Dbead eq 18) The dependence of the diffusion coefficientD on temperature T can be approximated by the StokesminusEinstein equation (eq 23)
=πη
Dk T
R6B
(23)
where kB is Boltzmannrsquos constant η is the dynamic viscosity of thelevitation media inside the bead and R is the hydrodynamic radiusof the protein inside the bead We assume that the levitation mediahas a dynamic viscosity similar to that of water (η5degC = 1519η40degC = 0653) and that R is independent of temperature theratio of Dbead40degC and Dbead5degC is therefore sim21 This valueagrees qualitatively with the increased rate of the reactionminusdiffusion process at higher temperatures
CONCLUSION
MagLev provides a new way to detect and measure specificproteinminusligand interactions Its simplicity and independence ofelectricity and infrastructure suggest that with development ithas the potential to be useful in resource-limited environmentsIn this method the binding of protein to ligands immobilizedwithin a gel bead results in a change in the density of the beadMagLev allows the density of the bead to be monitored in realtime with high accuracy and therefore provides a direct readoutof the amount of protein bound to the beadWe have developed a mathematical model of the reactionminus
diffusion processes that result in the binding of protein toligands immobilized within the bead This model provides goodquantitative agreement between theory and experiment Themagnitude of the change in levitation height as a function oftime depends on a number of controllable parameters including(i) the concentration of protein in solution (ii) the structureconcentration and binding constant of the ligand immobilizedin the bead and (iii) the size of the bead The rate of change inlevitation height also depends on a number of factors that aremore difficult to manipulate such as (i) the partition coefficientof the protein between the bead and the bulk solution and (ii)the diffusion coefficient of protein within the bead Wedeveloped eq 17 which describes the dependence of thecharacteristic time τ for protein binding to ligandsimmobilized within gel beads on all of the reaction parametersThis equation therefore allows the performance of the systemto be predicted under a variety of conditionsOverall the MagLev-based method for detecting proteinminus
ligand binding has a number of significant advantages (i) Thismethod requires no electricity and only a single piece ofequipment It may therefore find use in situations whereportability and low cost are a high priority for example in
point-of-care diagnosis especially in resource-limited militaryand home environments or in veterinary medicine plantpathology and food safety (ii) It is easy to use results can bevisualized with the naked eye (iii) It has the capability tomonitor binding accurately in real time This attribute providesa quantitative means of determining the concentration of aspecific protein in solution (iv) It can qualitatively distinguishthe binding affinities of a protein to several resin-bound smallmolecules simultaneously Using analogous proceduresMagLev should also be capable of measuring the binding ofmultiple proteins simultaneously to an array of resin-boundsmall molecules This property should allow for the readydesign of multiplexed binding assays (v) Proteinminusligandbinding directly results in a change in levitation height Thismethod therefore does not require intermediate reagents suchas enzyme-linked secondary antibodiesIn its present form this method also has several
disadvantages we summarize them briefly but note thatthere are clear development paths to reduce or eliminate them(i) The kinetics of proteinminusligand binding are relatively slow(on the order of several days) This problem may potentially beresolved through the design and synthesis of beads withimproved characteristics (eg larger pore size) (ii) Thismethod is only applicable to ligands that are amenable tochemical immobilization on a gel support this limitationhowever is inherent to most detection methods that occur onsolid support (iii) This method is currently not applicable tolarge proteins most notably antibodies due to the restrictedpore size of the PEGA beads we used (iv) For detection ofproteins in blood or other biological samples the gel beadsmust be separated from this sample (eg by filtration) beforeanalysis using Maglev this process adds time and complexity tothe method
ASSOCIATED CONTENTS Supporting InformationGeneral methods and additional experimental information Thismaterial is available free of charge via the Internet at httppubsacsorg
AUTHOR INFORMATIONCorresponding AuthorgwhitesidesgmwgroupharvardeduNotesThe authors declare no competing financial interest
ACKNOWLEDGMENTSThis work was partially supported by the Bill amp Melinda GatesFoundation (no 51308) the Wyss Institute of BiologicallyInspired Engineering the US Department of Energy (no DE-FG02-00ER45852 funding used for the development of themultiplexed assays) and postdoctoral fellowships from theDamon Runyon Cancer Research Foundation (STP) andNIH (STP and NDS)
REFERENCES(1) (a) Cuatrecasas P J Biol Chem 1970 245 3059 (b) Lam K SLebl M Krchnak V Chem Rev 1997 97 411 (c) Rademann JJung G Science 2000 287 1947 (d) Salisbury C M Maly D JEllman J A J Am Chem Soc 2002 124 14868 (e) Vegas A FullerJ Koehler A N Chem Soc Rev 2008 37 1385 (f) Gault V AMcClenaghan N H Understanding Bioanalytical Chemistry Principlesand Applications John Wiley amp Sons Ltd West Sussex UK 2009
Journal of the American Chemical Society Article
dxdoiorg101021ja211788e | J Am Chem Soc 2012 134 5637minus56465645
(2) (a) Venn R F Principles and Practice of Bioanalysis Taylor ampFrancis London UK 2000 (b) Walker J M Rapley R EdsMolecular Biomethods Handbook Humana Press Totowa NJ 2008(3) Stockwell B R Nature 2004 432 846(4) (a) Ahn C H Choi J W Beaucage G Nevin J H Lee J BPuntambek A Lee J Y Proc IEEE 2004 92 154 (b) Whitesides GM Nature 2006 442 368 (c) Yager P Edwards T Fu E HeltonK Nelson K Tam M R Weigl B H Nature 2006 442 412(d) Chin C D Linder V Sia S K Lab Chip 2007 7 41 (e) YagerP Domingo G Gerdes J Annu Rev Biomed Eng 2008 10 107(f) Konry T Walt D R J Am Chem Soc 2009 131 13232(5) (a) Beaugnon E Tournier R Nature 1991 349 470(b) Catherall A T Eaves L King P J Booth S R Nature2003 422 579 (c) Ikezoe Y Hirota N Nakagawa J Kitazawa KNature 1998 393 749 (d) Kimura T Mamada S Yamato MChem Lett 2000 1294(6) (a) Winkleman A Perez-Castillejos R Gudiksen K LPhillips S T Prentiss M Whitesides G M Anal Chem 2007 796542 (b) Mirica K A Phillips S T Shevkoplyas S S WhitesidesG M J Am Chem Soc 2008 130 17678 (c) Mirica K AShevkoplyas S S Phillips S T Gupta M Whitesides G M J AmChem Soc 2009 131 10049 (d) Mirica K A Phillips S T MaceC R Whitesides G M J Agric Food Chem 2010 58 6565(e) Mirica K A Ilievski F Ellerbee A K Shevkoplyas S SWhitesides G M Adv Mater 2011 23 4134(7) (a) Halling P J Ulijn R V Flitsch S L Curr Opin Biotechnol2005 16 385 (b) Laurent N Haddoub R Flitsch S L TrendsBiotechnol 2008 26 328 (c) Schuck P Zhao H Methods Mol Biol2010 627 15(8) Mammalian cells typically have intracellular ionic strengths on theorder of 200minus300 mM and contain sim200 mgmL protein see StoreyK B Functional Metabolism Regulation and Adaptation John Wiley ampSons Hoboken NJ 2004 p403(9) (a) Ebersole R C Ward M D J Am Chem Soc 1988 1108623 (b) Rickert J Brecht A Gopel W Biosens Bioelectron 199712 567 (c) Nishino H Murakawa A Mori T Okahata Y J AmChem Soc 2004 126 2264 (d) Su X Zhang J Sens Actuators B2004 100 309 (e) Muratsugu M Ohta F Miya Y Hosokawa TKurosawa S Kamo N Ikeda H Anal Chem 1993 65 2933(10) (a) Fritz J Baller M K Lang H P Rothuizen H VettigerP Meyer E Guntherodt H-J Gerber Ch Gimzewski J K Science2000 288 316 (b) Savran C A Knudsen S M Ellington A DManalis S R Anal Chem 2004 76 3194 (c) Burg T P Godin MKnudsen S M Shen W Carlson G Foster J S Babcock KManalis S R Nature 2007 446 1066 (d) Goeders K M Colton J SBottomley L A Chem Rev 2008 108 522 (e) Datar R Kim SJeon S Hesketh P Manalis S Boisen A Thundat T MRS Bull2009 34 449(11) Ndieyira J W Watari M Barrera A D Zhou D Vogtli MBatchelor M Cooper M A Strunz T Horton M A Abell CRayment T Aeppli G Mckendry R A Nat Nanotechnol 2008 3691(12) Chua J H Chee R E Agarwal A Wong S M Zhang G JAnal Chem 2009 81 6266(13) (a) Schasfoort R B Tudos A J Eds Handbook of SurfacePlasmon Resonance Royal Society of Chemistry Cambridge UK2008 (b) Homola J Chem Rev 2008 108 462 (c) Stewart M EAnderton C R Thompson L B Maria J Gray S K Rogers J ANuzzo R G Chem Rev 2008 108 494 (d) Mayer K M Hafner JH Chem Rev 2011 111 3828(14) Weinmann H-J Brasch R C Press W-R Wesbey G E AmJ Roentgenol 1984 142 619(15) Caravan P Ellison J J McMurry T J Lauffer R B ChemRev 1999 99 2293(16) Krishnamurthy V M Kaufman G K Urbach A R Gitlin IGudiksen K L Weibel D B Whitesides G M Chem Rev 2008108 946
(17) (a) Auzanneau F-I Meldal M Bock K J Pept Sci 1995 131 (b) Renil M Ferreras M Delaisse J M Foged N T MeldalM J Pept Sci 1998 4 195(18) Kuramochi K Miyano Y Enomoto Y Takeuchi R Ishi KTakakusagi Y Saitoh T Fukudome K Manita D Takeda YKobayashi S Sakaguchi K Sugawara F Bioconjugate Chem 200819 2417(19) (a) Meldal M Svendsen I Breddam K Auzanneau F I ProcNatl Acad Sci USA 1994 91 3314 (b) Meldal M Svendsen I JChem Soc Perkin Trans 1 1995 1591(20) (a) Meldal M Auzanneau F I Hindsgaul O Palcic M MJ Chem Soc Chem Commun 1994 1849 (b) Renil M Meldal MTetrahedron Lett 1995 36 4647 (c) Haddoub R Dauner MStefanowicz F A Barattini V Laurent N Flitsch S L Org BiomolChem 2009 7 665(21) Wong L S Thirlway J Micklefield J J Am Chem Soc 2008130 12456(22) (a) Chick H Martin C J Biochem J 1913 7 92 (b) QuillinM L Matthews B W Acta Crystallogr 2000 56 791 (c) Fischer HPolikarpov I Craievich A F Protein Sci 2004 13 2825(23) It would also be possible to use beads with density greater thanthe density of protein This experimental design however wouldrequire that the levitation media contain a diamagnetic cosolute ofhigh density in order to match the density of the levitation media (ρm)with the density of the bead(24) (a) Kress J Zanaletti R Amour A Ladlow M Frey J GBradley M ChemEur J 2002 8 3769 (b) Auzanneau F-IMeldal M Bock K J Pept Sci 1995 1 31(25) (a) Thornton P D McConnell G Ulijn R V ChemCommun 2005 5913 (b) Bosma A Y Ulijn R V McConnell GGirkin J Halling P J Flitsch S L Chem Commun 2003 2790(26) Tyn M T Gusek T W Biotechnol Bioeng 1990 35 327(27) Gao J Whitesides G M Anal Chem 1997 69 575(28) Wei Y Wesson P J Kourkine I Grzybowski B A AnalChem 2010 82 8780(29) Previous studies have demonstrated that protein binding toPEGA beads does not significantly change the volume of the beadssee ref 25(30) Morton K W Mayers D F Numerical Solution of PartialDifferential Equations An Introduction Cambridge University PressCambridge UK 2005(31) Although both bound and unbound protein increase the densityof the bead the influence of the unbound protein is negligible becauseits concentration is significantly lower than the concentration of thebound protein(32) Deen W M Analysis of Transport Phenomena OxfordUniversity Press New York 1998(33) The plots shown in Figure 3 are also presented in theSupporting Information with error bars(34) Mrksich M Grunwell J R Whitesides G M J Am ChemSoc 1995 117 12009(35) We monitored the levitation height of beads functionalized with100 sulfonamide 1 in the presence of 10 μM BCA for more than 500 h(3 weeks) Even after this extended period of time proteinminusligandbinding had not yet reached its equilibrium state This fact hindered ourability to calculate accurately the characteristic time for this system as aresult we have excluded this datum point from further analysis(36) The small variations in the initial levitation heights of the color-coded beads are likely due to differences in the densities of the beadsresulting from differences in the densities of the covalentlyimmobilized ligands see ref 6b(37) (a) Wild D Ed The Immunoassay Handbook Macmillan PressBasingstoke UK 1994 (b) Lost G J Principles amp Practice of Point-of-Care Testing Lippincott Williams amp Wilkins Philadelphia PA 2002(38) The plot shown in Figure 7A is also presented in the SupportingInformation with a logarithmic concentration axis
Journal of the American Chemical Society Article
dxdoiorg101021ja211788e | J Am Chem Soc 2012 134 5637minus56465646
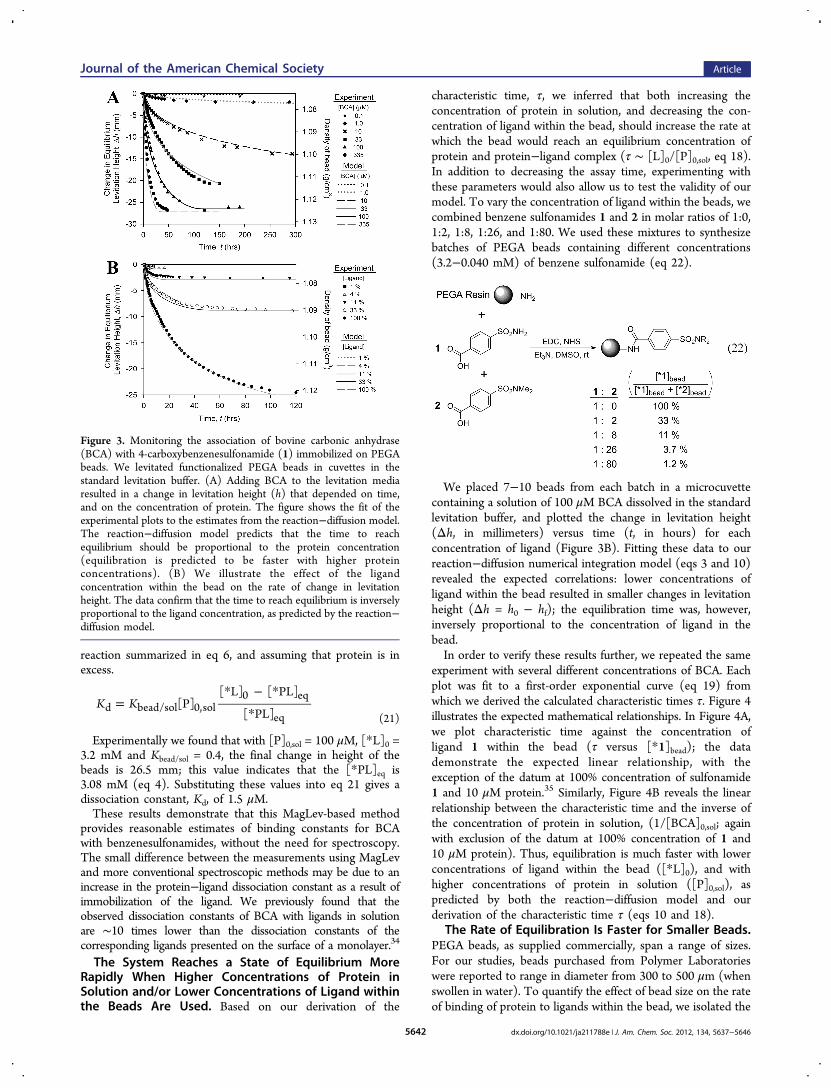
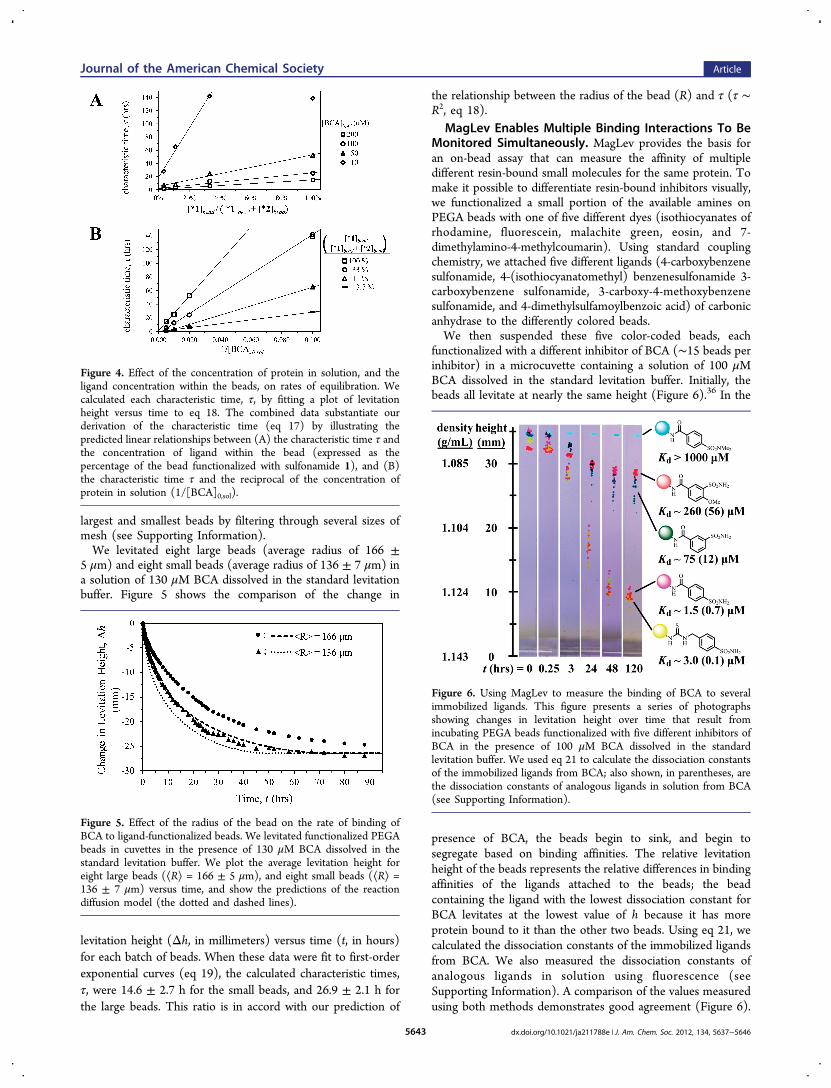
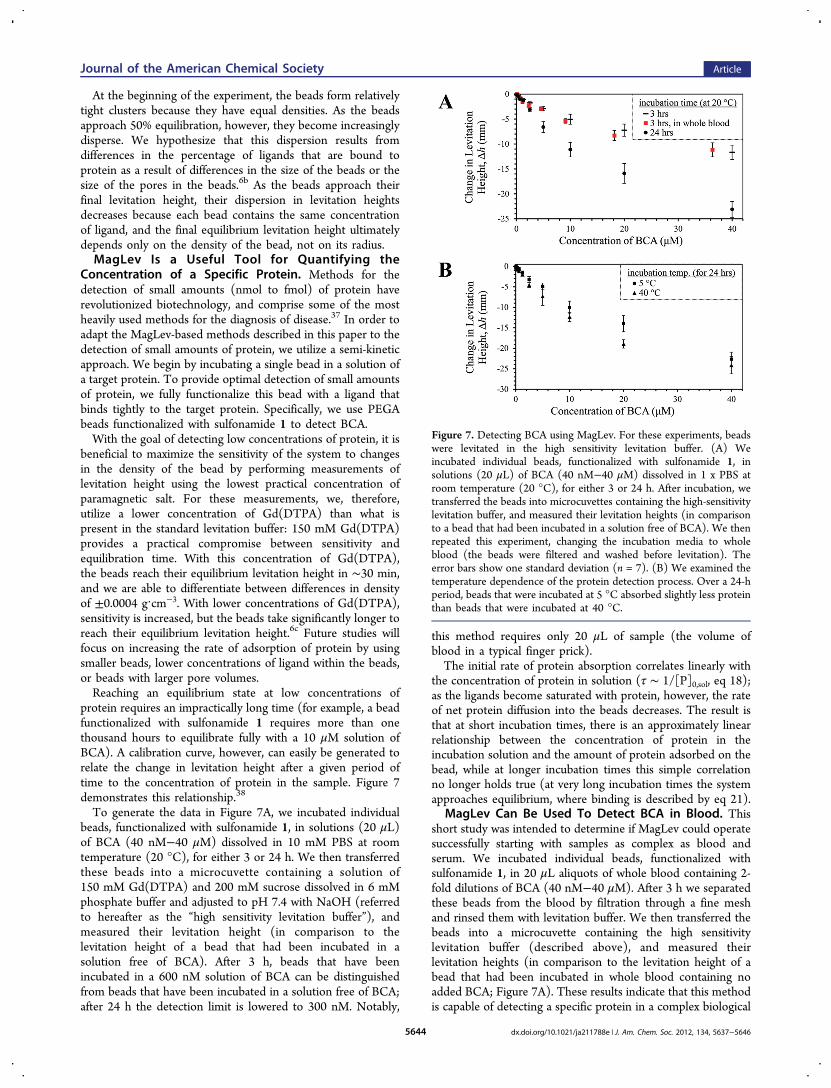
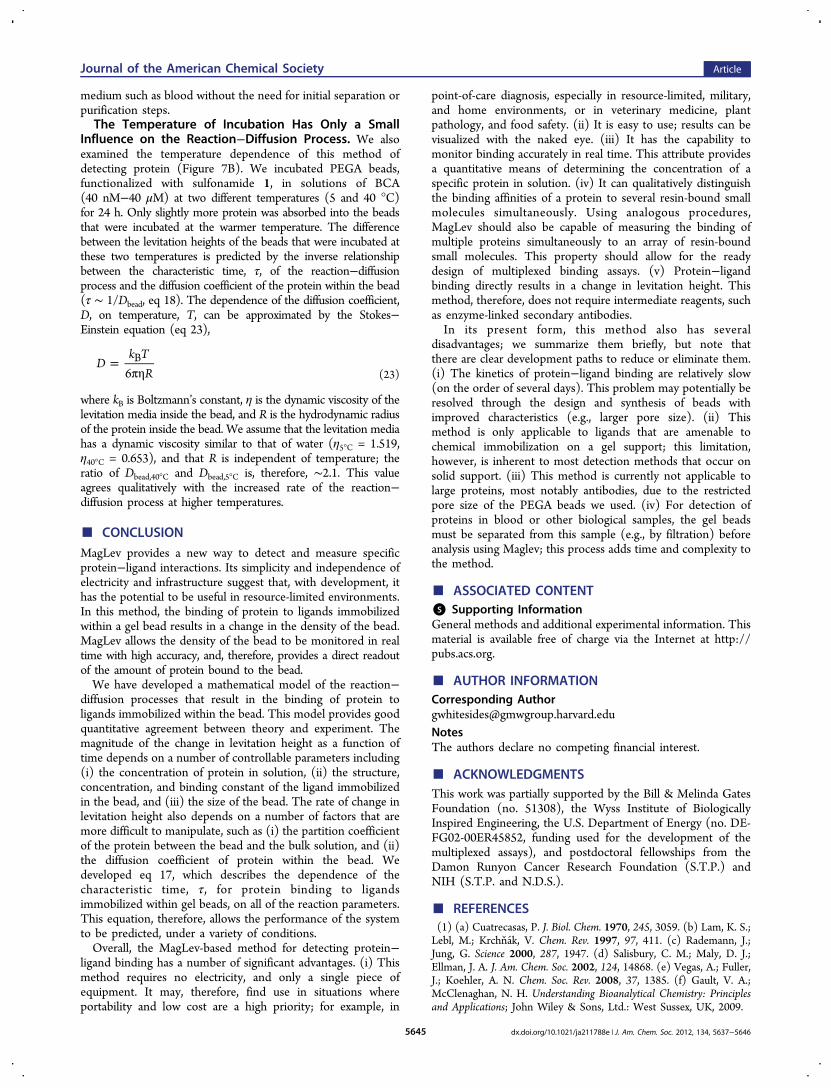


![1. Details of Module and its structure Module Detail Subject ......coordination isomer [Cr(NH3)6][Co(CN)6], the NH3 ligands are bound to Cr 3+ and the CN – ligands to Co3+. iii)](https://img.pdfslide.us/doc/110x75/6119cbf8c3bb332fc33167ea/1-details-of-module-and-its-structure-module-detail-subject-coordination.jpg)


![Nano-Silica Modified by Hematoporphyrin for … carbon [17] polyurethane foam ... chemically modified on the surface of silica gel using chelating ... are many chelating ligands immobilized](https://img.pdfslide.us/doc/110x75/5ac92fff7f8b9acb688d2e2d/nano-silica-modified-by-hematoporphyrin-for-carbon-17-polyurethane-foam-.jpg)