Embed Size (px)
Citation preview
1/6
Measuring Bathymetric Uncertainty of the EdgeTech 4600 Sonar Thomas HILLER, Thurne Hydrographic Ltd, Norwich, UK Lisa Nicole BRISSON, Project Engineer, EdgeTech, Boca Raton, Florida Steve WRIGHT, Director of Technology Development, EdgeTech, Boca Raton, Florida Topic A: innovations in acquisition techniques Introduction High frequency (100kHz to 600kHz) sonar ‘interferometers’ (phase measuring bathymetric sonars or bathymetric side scans) have recently become a popular tool for shallow water swath surveys, and now form an integral part of the surveyors toolkit. The interferometric sonar can be considered as a multi-stave side scan, collecting a wide swath of bathymetry and sonar amplitude data, with the angle of arrival of the seabed returns determined by phase comparisons between the receive staves. A-priori theoretical error models of interferometric systems are complex and have been difficult to reconcile with observed system performance. A reliable system error model is required in order to apply sophisticated postprocessing techniques, for example the CUBE algorithms developed at UNH, and to determine the uncertainty indications to use on data sets and charts. Direct empirical measurements of system uncertainty can be used to refine and verify the sonar models and ensure that the Total Propagated Uncertainty (TPU) applied in the data processing is consistent with real data as collected. Statistical techniques for analysing and optimising the performance of swath bathymetry systems have been used for several decades (for example de Moustier 2001), especially in the analysis of beamforming multibeam systems. A well-used technique is to compare a single line of test data against a reference surface to determine the sonar depth repeatability and consistency across the swath. While an independently surveyed reference surface with a higher accuracy than the system under test would be desirable, this is not often available and in practice is difficult to obtain when testing state-of-the-art survey systems (Whittaker et al., 2011). It has become accepted practice to test a system against itself, creating a reference surface using multiple passes in different directions, with tight data filtering, to create a very high data density which will average out errors. While this has limitations with regard to systematic offsets, the two effects of tight filtering to limit the reference surface data to the most accurate part of the swath, and the averaging of errors from multiple passes, will create a reference surface with a significantly higher accuracy and repeatability than obtainable from a single pass of the sonar. Once a reference surface has been generated a separate survey line is recorded over the test area and the two data sets can be compared. Statistical analysis of the difference will give a good indication of the accuracy and repeatability of the sonar system in a single pass as a function of position across the swath. In early 2012 these techniques were applied to analyse the performance of a boat-mounted EdgeTech 4600 sonar system when used for shallow water surveys, with data collected off West Palm Beach FL, USA. Methods The EdgeTech 4600 is a combined, fully integrated, swath bathymetry and side scan sonar system that produces real-time high resolution three dimensional (3D) maps of the sea floor while providing co-registered simultaneous side scan and bathymetric data. The 4600 uses eight receive element transducers and one discrete transmit element in a pair of transducer heads. The high number of channels enables enhanced rejection of multi-path effects, reverberation and acoustic noise, and EdgeTech’s Full Spectrum® processing techniques also provide a denser data set in the nadir region
2/6
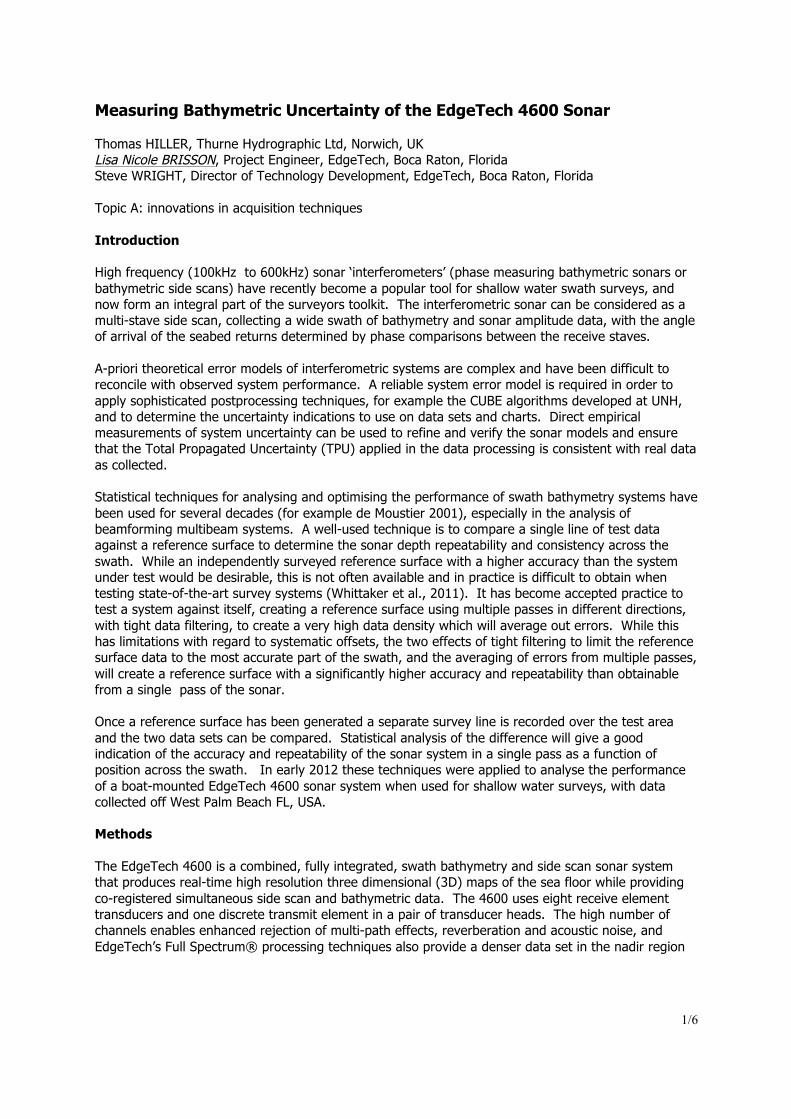
compared to other interferometric systems, meeting IHO SP-44, NOAA and USACE specifications for feature detection. On 17th-19th January 2012 a survey data set was collected using a 540 kHz EdgeTech 4600 deployed on a retractable bow pole mount on the US Army Corps of Engineers trailerable Survey Boat SB-32.
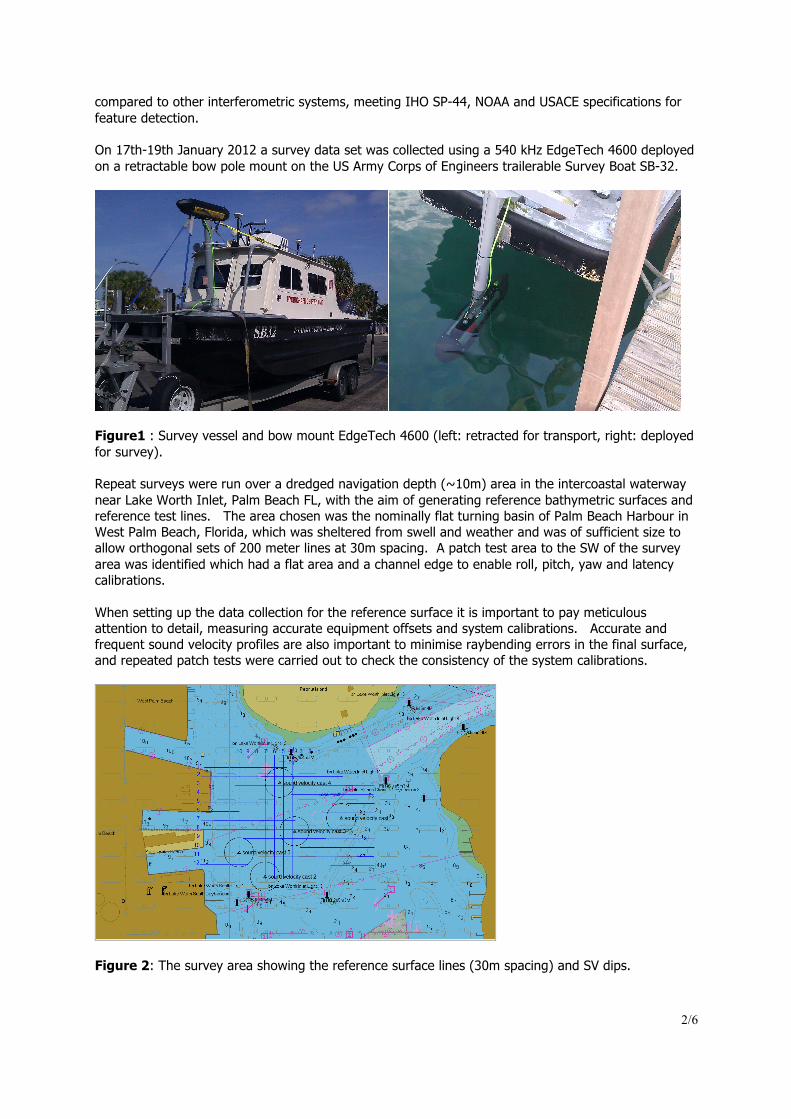
Figure1 : Survey vessel and bow mount EdgeTech 4600 (left: retracted for transport, right: deployed for survey). Repeat surveys were run over a dredged navigation depth (~10m) area in the intercoastal waterway near Lake Worth Inlet, Palm Beach FL, with the aim of generating reference bathymetric surfaces and reference test lines. The area chosen was the nominally flat turning basin of Palm Beach Harbour in West Palm Beach, Florida, which was sheltered from swell and weather and was of sufficient size to allow orthogonal sets of 200 meter lines at 30m spacing. A patch test area to the SW of the survey area was identified which had a flat area and a channel edge to enable roll, pitch, yaw and latency calibrations. When setting up the data collection for the reference surface it is important to pay meticulous attention to detail, measuring accurate equipment offsets and system calibrations. Accurate and frequent sound velocity profiles are also important to minimise raybending errors in the final surface, and repeated patch tests were carried out to check the consistency of the system calibrations.
Figure 2: The survey area showing the reference surface lines (30m spacing) and SV dips.
3/6
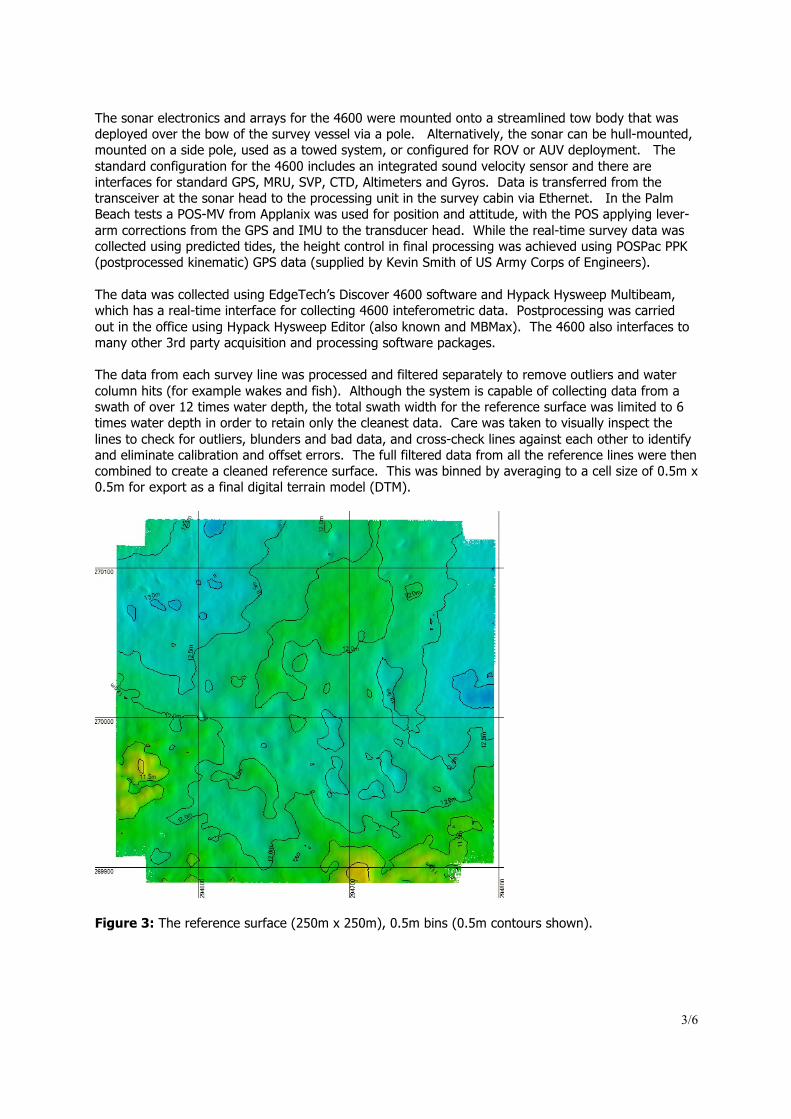
The sonar electronics and arrays for the 4600 were mounted onto a streamlined tow body that was deployed over the bow of the survey vessel via a pole. Alternatively, the sonar can be hull-mounted, mounted on a side pole, used as a towed system, or configured for ROV or AUV deployment. The standard configuration for the 4600 includes an integrated sound velocity sensor and there are interfaces for standard GPS, MRU, SVP, CTD, Altimeters and Gyros. Data is transferred from the transceiver at the sonar head to the processing unit in the survey cabin via Ethernet. In the Palm Beach tests a POS-MV from Applanix was used for position and attitude, with the POS applying lever- arm corrections from the GPS and IMU to the transducer head. While the real-time survey data was collected using predicted tides, the height control in final processing was achieved using POSPac PPK (postprocessed kinematic) GPS data (supplied by Kevin Smith of US Army Corps of Engineers). The data was collected using EdgeTech’s Discover 4600 software and Hypack Hysweep Multibeam, which has a real-time interface for collecting 4600 inteferometric data. Postprocessing was carried out in the office using Hypack Hysweep Editor (also known and MBMax). The 4600 also interfaces to many other 3rd party acquisition and processing software packages. The data from each survey line was processed and filtered separately to remove outliers and water column hits (for example wakes and fish). Although the system is capable of collecting data from a swath of over 12 times water depth, the total swath width for the reference surface was limited to 6 times water depth in order to retain only the cleanest data. Care was taken to visually inspect the lines to check for outliers, blunders and bad data, and cross-check lines against each other to identify and eliminate calibration and offset errors. The full filtered data from all the reference lines were then combined to create a cleaned reference surface. This was binned by averaging to a cell size of 0.5m x 0.5m for export as a final digital terrain model (DTM).
Figure 3: The reference surface (250m x 250m), 0.5m bins (0.5m contours shown).
4/6
The same data collection and processing was carried out for the individual test lines and again these were binned to 0.5m x 0.5m for comparison with the reference surface. A grid of the differences between the reference surface depths and the test line depths was created, and multiple cross profiles were taken orthogonal to the boat heading along this line. Cross profiles were spaced by 5m and over 40 profiles were taken in order to generate the statistics for analysis.
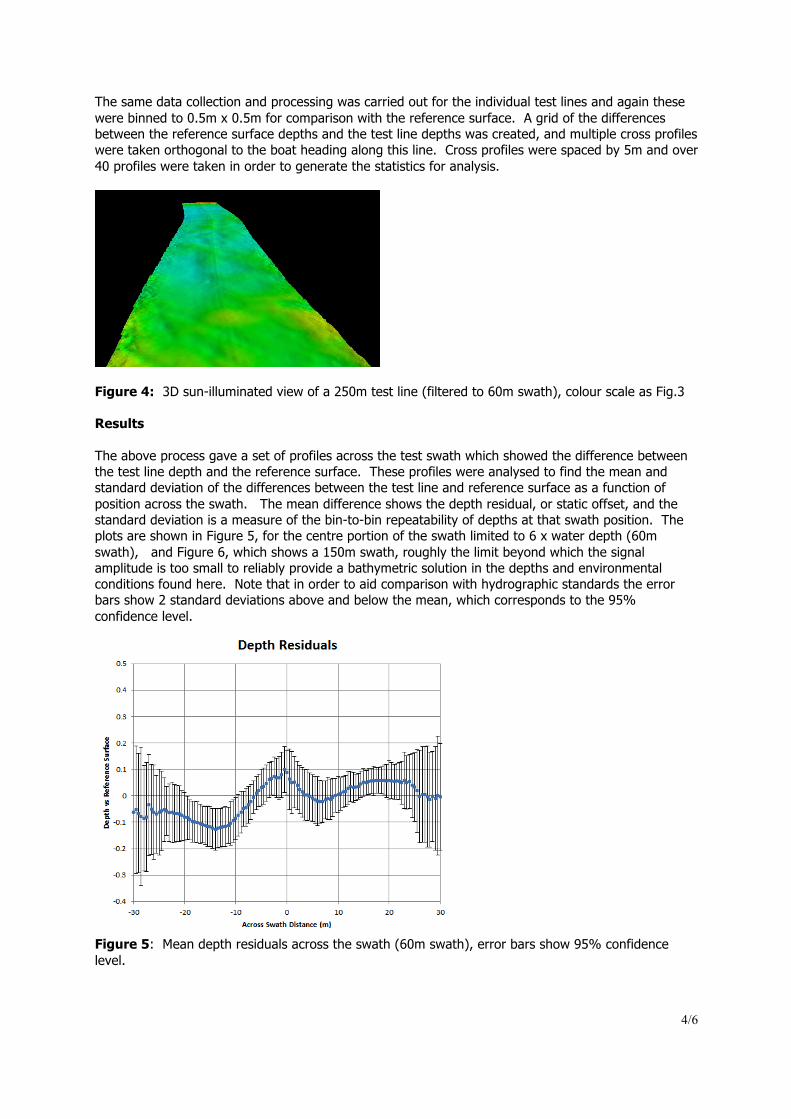
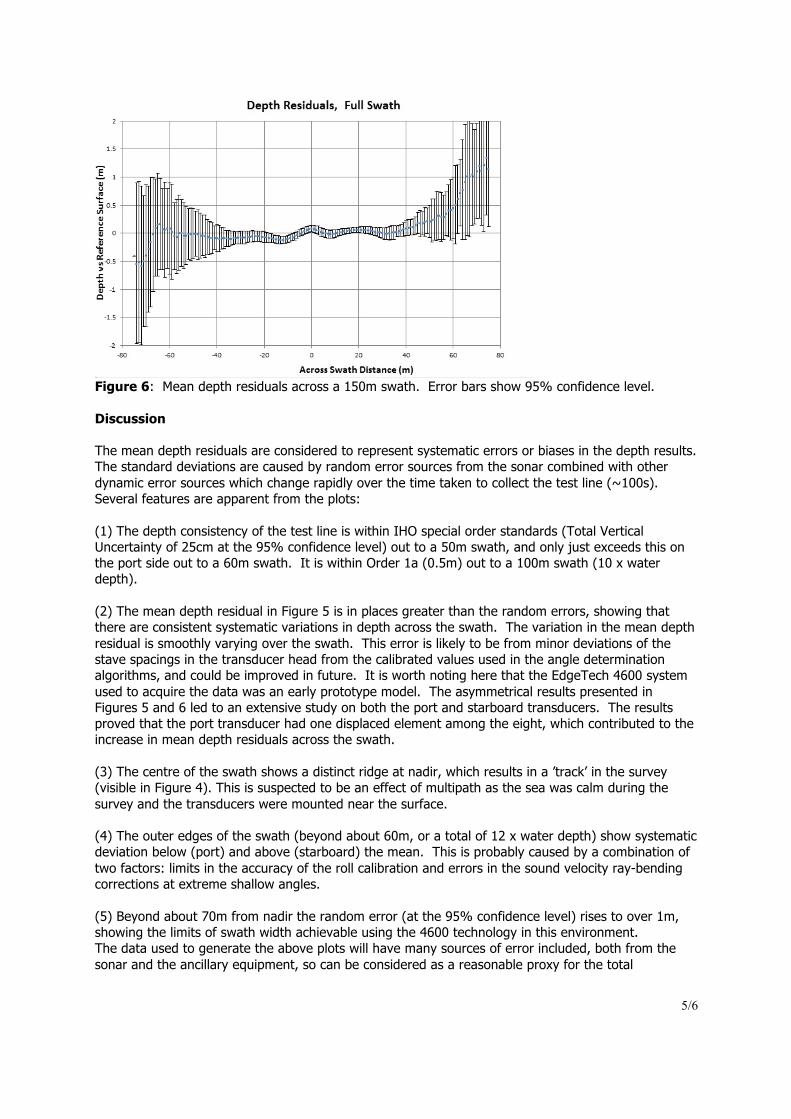
Figure 4: 3D sun-illuminated view of a 250m test line (filtered to 60m swath), colour scale as Fig.3 Results The above process gave a set of profiles across the test swath which showed the difference between the test line depth and the reference surface. These profiles were analysed to find the mean and standard deviation of the differences between the test line and reference surface as a function of position across the swath. The mean difference shows the depth residual, or static offset, and the standard deviation is a measure of the bin-to-bin repeatability of depths at that swath position. The plots are shown in Figure 5, for the centre portion of the swath limited to 6 x water depth (60m swath), and Figure 6, which shows a 150m swath, roughly the limit beyond which the signal amplitude is too small to reliably provide a bathymetric solution in the depths and environmental conditions found here. Note that in order to aid comparison with hydrographic standards the error bars show 2 standard deviations above and below the mean, which corresponds to the 95% confidence level.
Figure 5: Mean depth residuals across the swath (60m swath), error bars show 95% confidence level.
5/6
Figure 6: Mean depth residuals across a 150m swath. Error bars show 95% confidence level. Discussion The mean depth residuals are considered to represent systematic errors or biases in the depth results. The standard deviations are caused by random error sources from the sonar combined with other dynamic error sources which change rapidly over the time taken to collect the test line (~100s). Several features are apparent from the plots: (1) The depth consistency of the test line is within IHO special order standards (Total Vertical Uncertainty of 25cm at the 95% confidence level) out to a 50m swath, and only just exceeds this on the port side out to a 60m swath. It is within Order 1a (0.5m) out to a 100m swath (10 x water depth). (2) The mean depth residual in Figure 5 is in places greater than the random errors, showing that there are consistent systematic variations in depth across the swath. The variation in the mean depth residual is smoothly varying over the swath. This error is likely to be from minor deviations of the stave spacings in the transducer head from the calibrated values used in the angle determination algorithms, and could be improved in future. It is worth noting here that the EdgeTech 4600 system used to acquire the data was an early prototype model. The asymmetrical results presented in Figures 5 and 6 led to an extensive study on both the port and starboard transducers. The results proved that the port transducer had one displaced element among the eight, which contributed to the increase in mean depth residuals across the swath. (3) The centre of the swath shows a distinct ridge at nadir, which results in a ’track’ in the survey (visible in Figure 4). This is suspected to be an effect of multipath as the sea was calm during the survey and the transducers were mounted near the surface. (4) The outer edges of the swath (beyond about 60m, or a total of 12 x water depth) show systematic deviation below (port) and above (starboard) the mean. This is probably caused by a combination of two factors: limits in the accuracy of the roll calibration and errors in the sound velocity ray-bending corrections at extreme shallow angles. (5) Beyond about 70m from nadir the random error (at the 95% confidence level) rises to over 1m, showing the limits of swath width achievable using the 4600 technology in this environment. The data used to generate the above plots will have many sources of error included, both from the sonar and the ancillary equipment, so can be considered as a reasonable proxy for the total
6/6
propagated errors of the survey system. These plots will be expected to overestimate the TVU contribution from the sonar alone. However some static and slowly varying errors will be common to both the reference surface and the test line; these will be invisible to the above analysis. These will include errors in the static vertical offset from the GPS antenna to transducers and slowly varying GPS height and position errors. Comparison with reference surfaces collected using different equipment would be useful in estimating these errors. Conclusion The Edgetech 4600 sonar system was tested in 10m water depth and the data consistency between a reference surface and a test line was within IHO Special Order specifications to a swath width of 5 x water depth. The data was within IHO Order 1a specifications to 10 x water depth, and useful 0.5m binned survey data was available to 12 x water depth. The shape of the mean depth residuals compared with the magnitude of the random errors indicates that more could be done to reduce systematic error sources, including a displaced element that was later found in one of the transducers, showing that this technology could achieve greater accuracy in future. The statistical analysis techniques applied here provided valuable information about sonar performance and helped measure the data quality that can be obtained from the sonar system. The total vertical uncertainty values obtained will help inform sonar use and aid in the use of advanced postprocessing algorithms with this data. References de Moustier, C., (2001). ”Field Evaluation of Sounding Accuracy in Deep Water Multi-Beam Swath Bathymetry”, MTS Oceans Conference 2001. Wittaker, C., Sebastian, S., Fabre, D.H., (2011). ”Multibeam Sonar Performance Analysis Value and Use of Statistical Techniques”, International Hydrographic Review, No 5, pps 52-65, May 2011. Author Biographies Dr. Thomas Hiller obtained his PhD in experimental physics in the semiconductor sector, becoming involved with marine sonars in 1998 at Submetrix Ltd. He has managed interferometric sonar product lines at three different sonar manufacturers, including six years as Advanced Products Manager at GeoAcoustics Ltd. In 2011 Tom set up Thurne Hydrographic Limited to provide engineering consultancy, marketing representation, and survey support to the worldwide hydrographic industry. Ms. Lisa N. Brisson is a Project Engineer at EdgeTech with experience in Underwater Acoustics and Hydrographic Surveying. Lisa graduated with a B.S. in Ocean Engineering in 2009 from Florida Atlantic University. After graduation, she continued her studies there and developed a detection and classification algorithm for forward look sonars, and later graduated with a M.S. in Ocean Engineering in 2010. Following that she joined EdgeTech and was involved in the design and development of an interferometric side scan sonar. Currently, she has been installing, testing, and providing training for hydrographic systems. Wright, Steven – Director of Technology Development: Mr. Steven Wright holds a Bachelor of Science degree in Electronic Engineering with 30 years experience in sonar systems development. He has managed the development of Airborne SAR and Radarsat data processors while at MacDonald Detwiler and Associates in Canada. He has overseen new product R&D and sonar technology development at Kongsberg Mesotech in Canada, and he has been working at EdgeTech for the last 12 years. He also has over 28 years of technical management experience in both small and large companies. Most recently, he has been involved in the development of compact sonar systems electronics, transducer arrays and swath bathymetry sonars.