Embed Size (px)
Citation preview
Measuring audience
engagement
Africa Media Leadership ConferenceDar es Salaam 2010
[email protected]@joe_otin
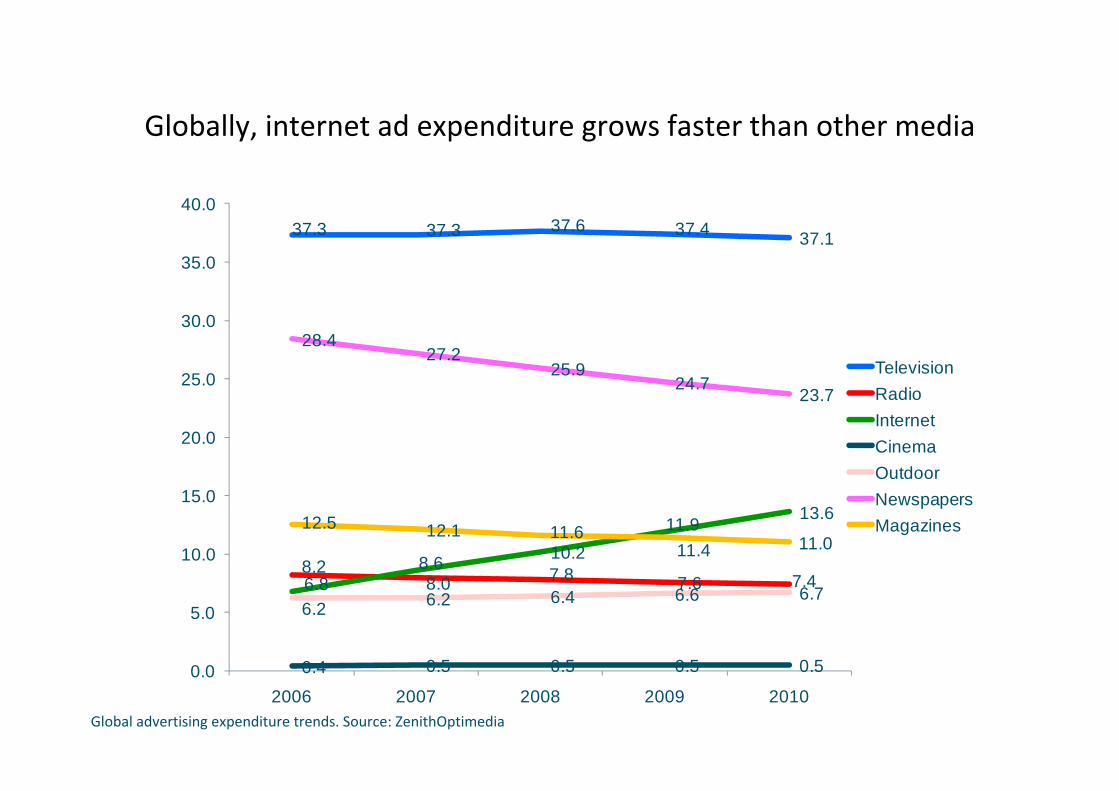
Globally, internet ad expenditure grows faster than other media
Global advertising expenditure trends. Source: ZenithOptimedia
37.3 37.3 37.6 37.4 37.1
8.28.0 7.8 7.6 7.46.8
8.6 10.211.9 13.6
0.4 0.5 0.5 0.5 0.5
6.2 6.2 6.4 6.6 6.7
28.427.2
25.924.7
23.7
12.5 12.1 11.611.4 11.0
0.0
5.0
10.0
15.0
20.0
25.0
30.0
35.0
40.0
2006 2007 2008 2009 2010
TelevisionRadioInternetCinemaOutdoorNewspapersMagazines
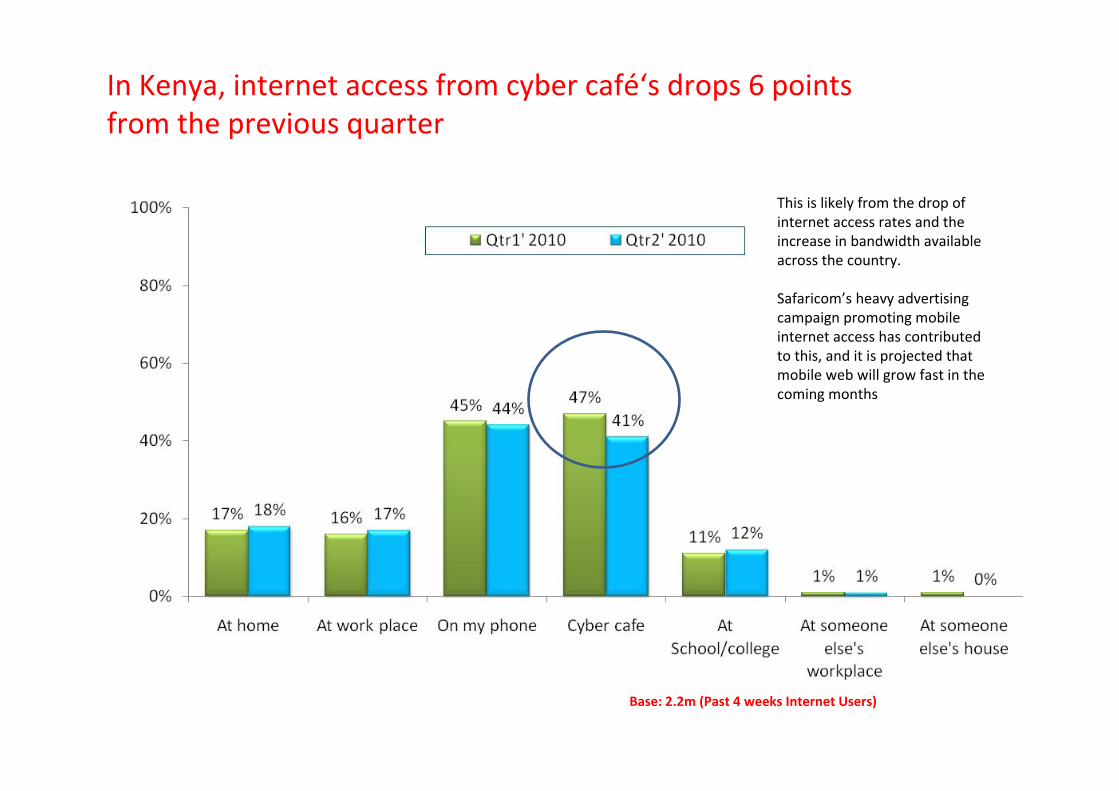
In Kenya, internet access from cyber café‘s drops 6 points from the previous quarter
Base: 2.2m (Past 4 weeks Internet Users)
This is likely from the drop of internet access rates and the increase in bandwidth available across the country.
Safaricom’s heavy advertising campaign promoting mobile internet access has contributed to this, and it is projected that mobile web will grow fast in the coming months
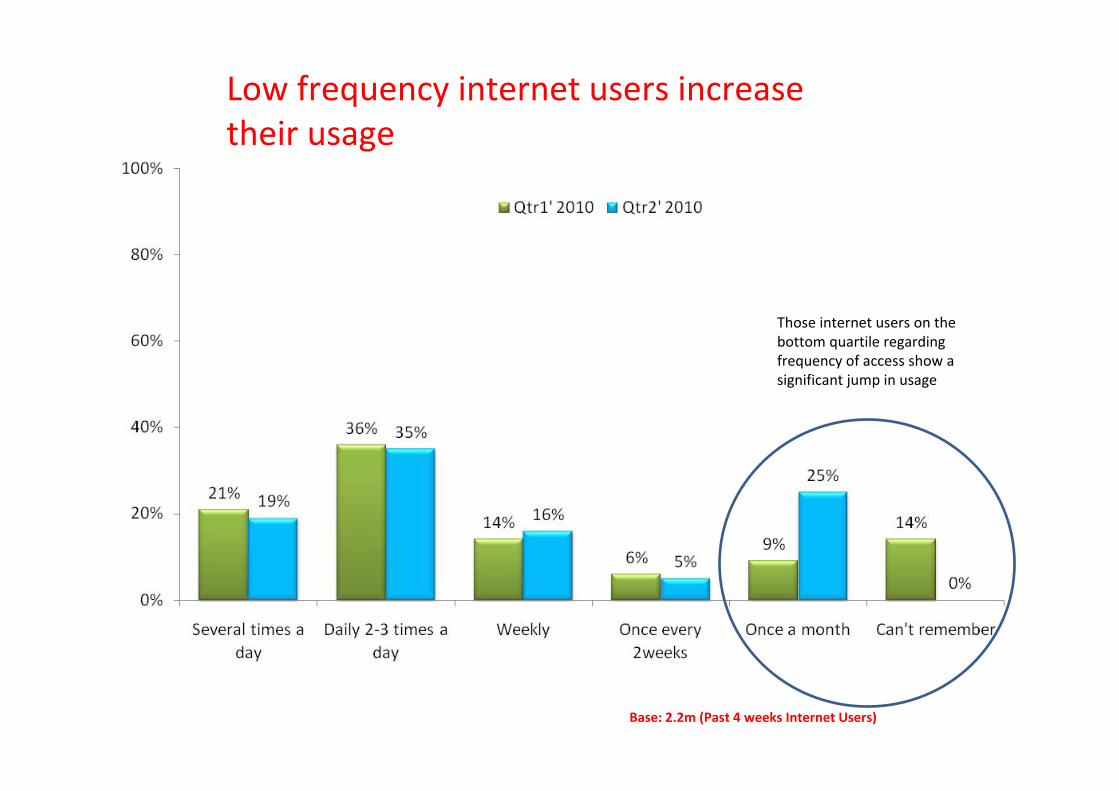
Low frequency internet users increase their usage
Base: 2.2m (Past 4 weeks Internet Users)
Those internet users on the bottom quartile regarding frequency of access show a significant jump in usage
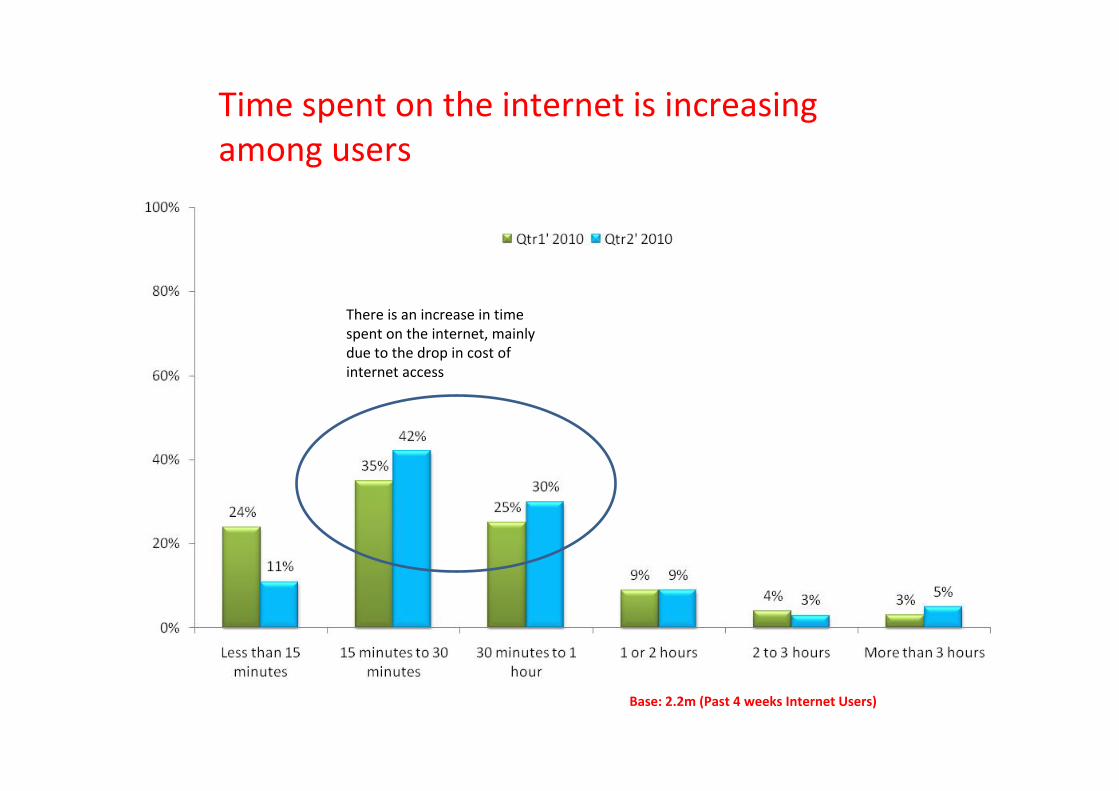
Time spent on the internet is increasing among users
Base: 2.2m (Past 4 weeks Internet Users)
There is an increase in time spent on the internet, mainly due to the drop in cost of internet access
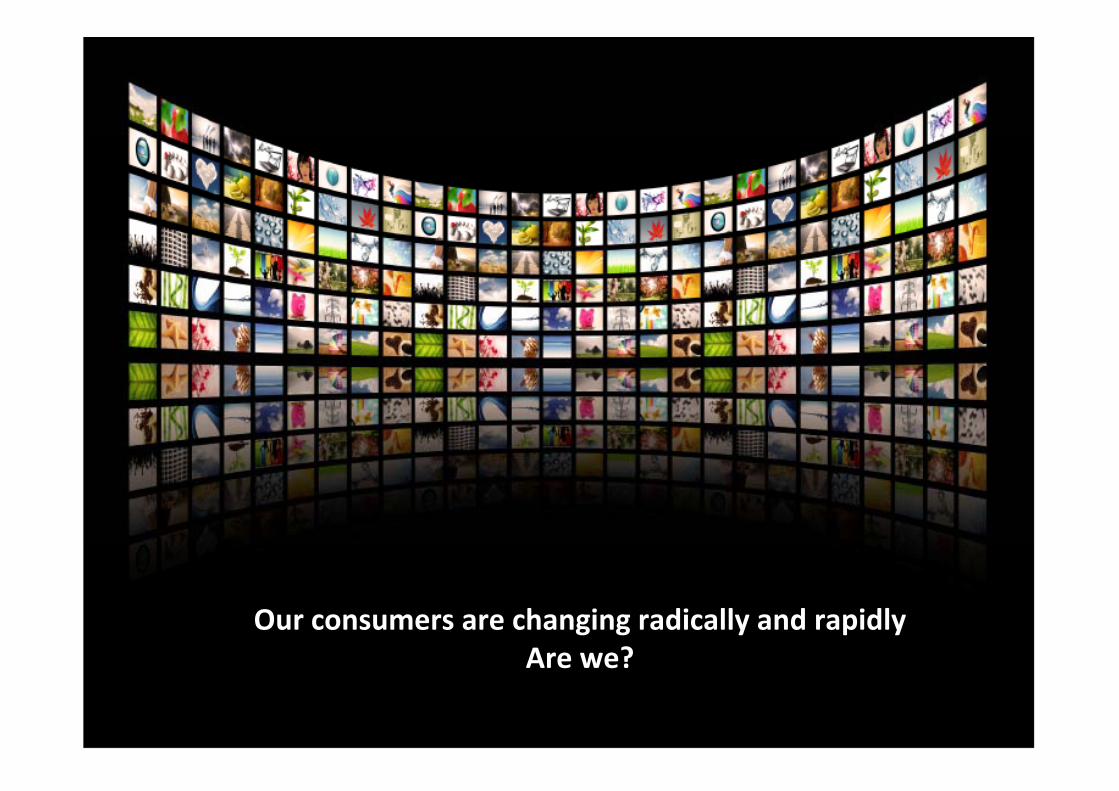
Our consumers are changing radically and rapidlyAre we?
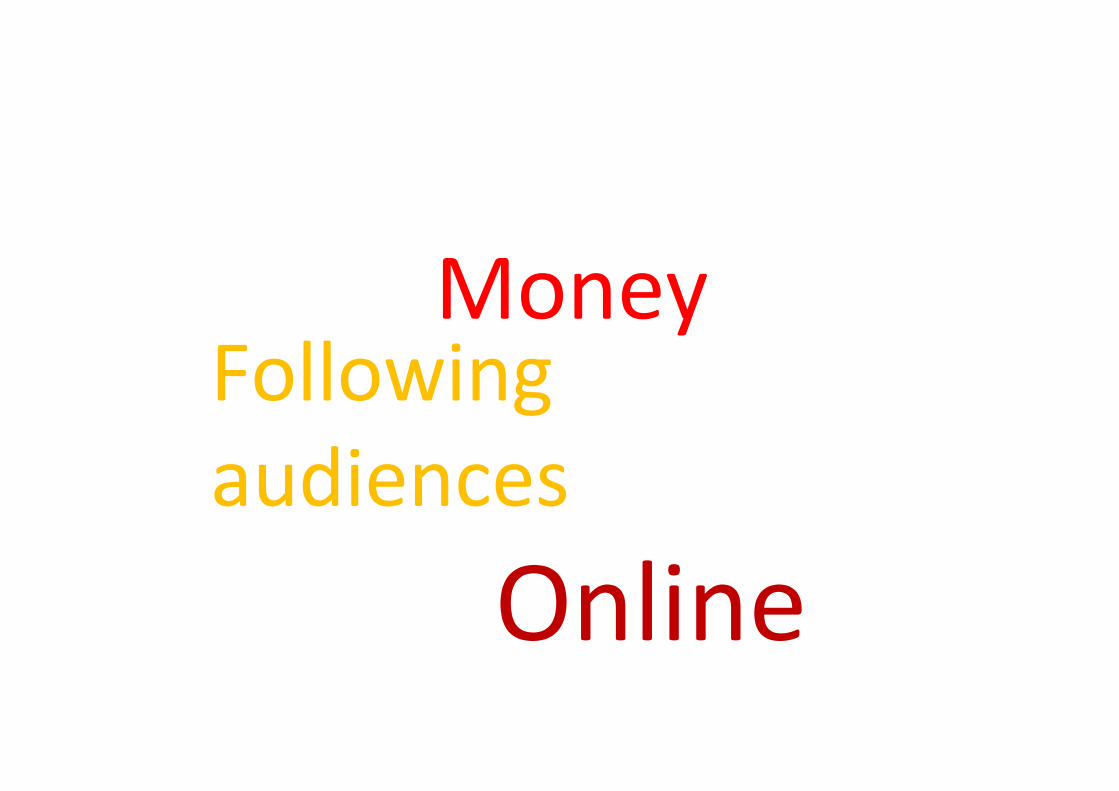
Following audiences
Money
Online
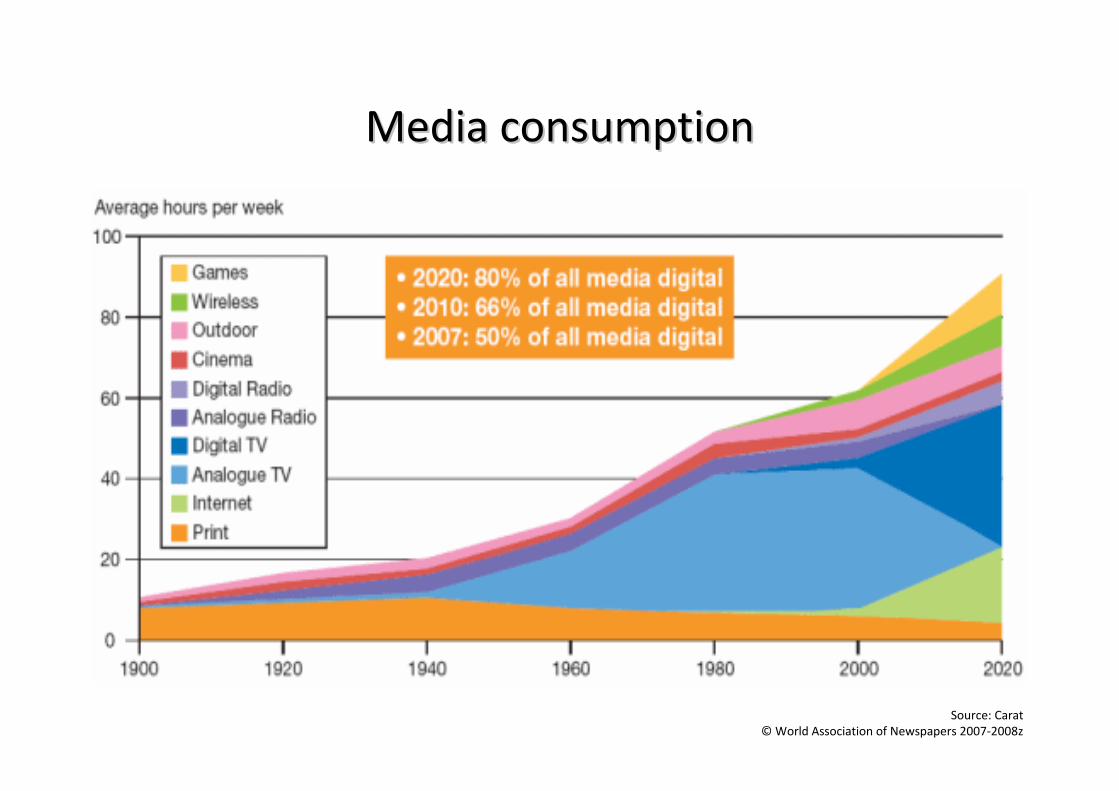
Media consumptionMedia consumption
Source: Carat©World Association of Newspapers 2007‐2008z
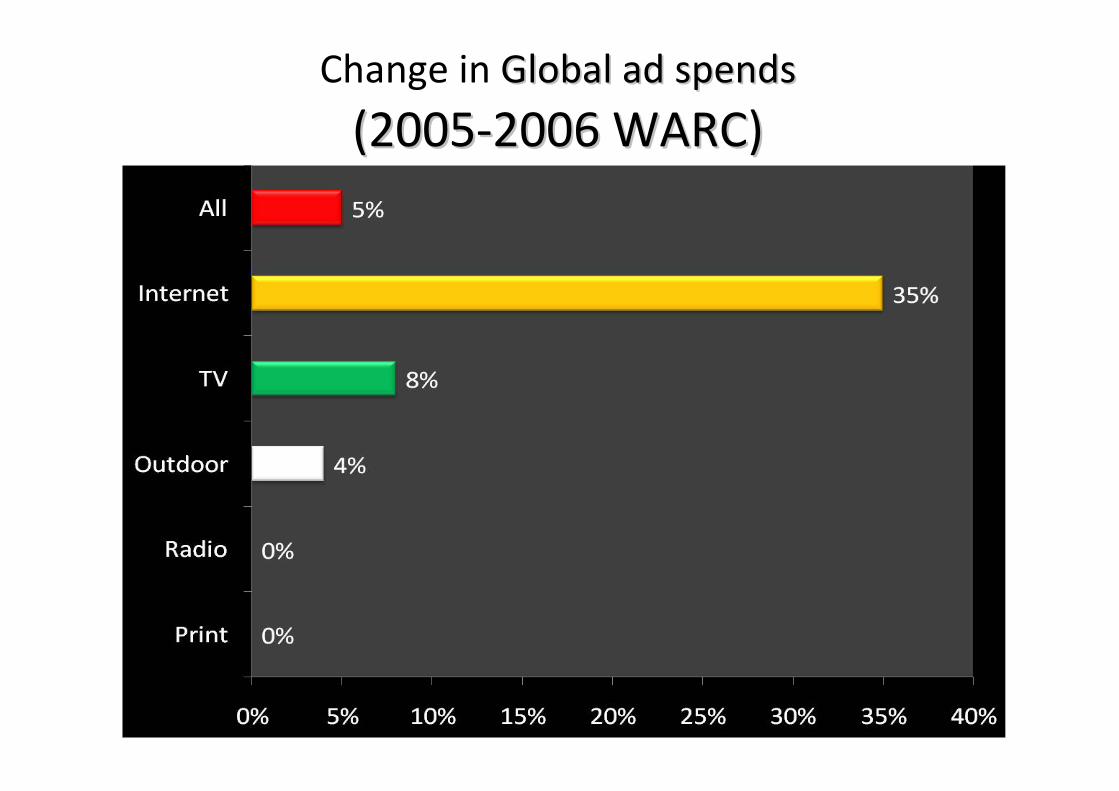
Change in Global ad spendsGlobal ad spends
(2005(2005‐‐2006 WARC)2006 WARC)
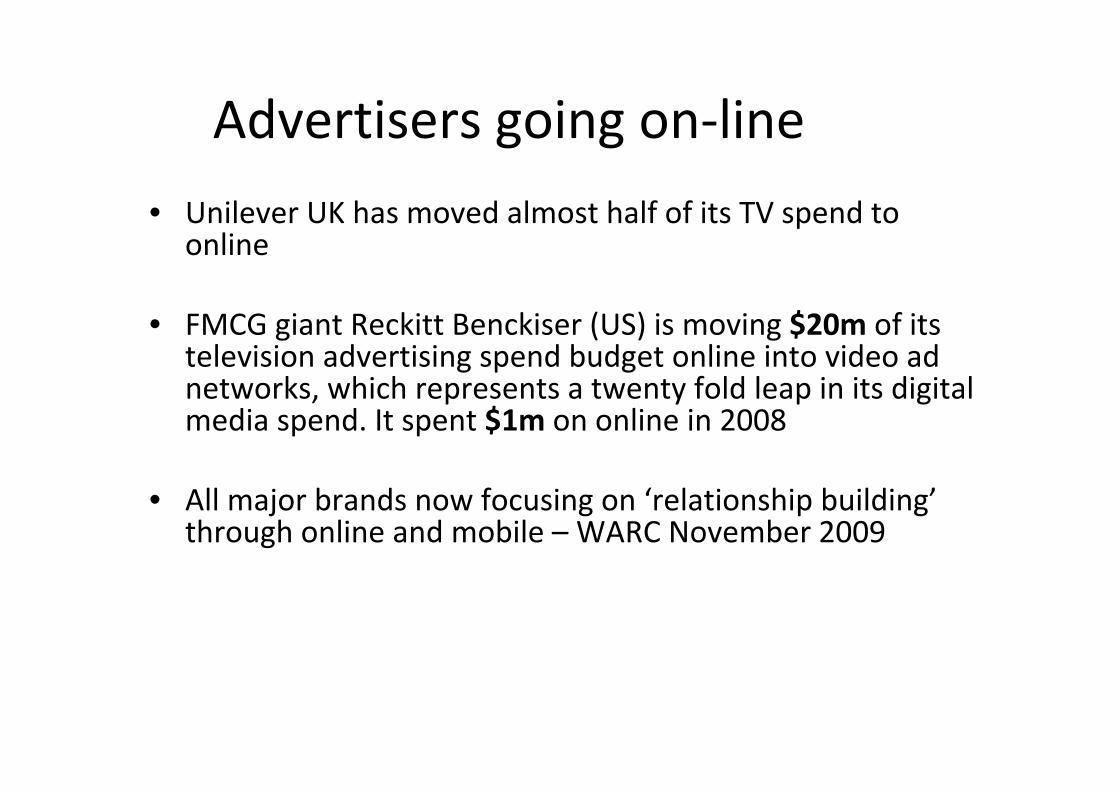
Advertisers going on‐line
• Unilever UK has moved almost half of its TV spend to online
• FMCG giant Reckitt Benckiser (US) is moving $20m of its television advertising spend budget online into video ad networks, which represents a twenty fold leap in its digital media spend. It spent $1m on online in 2008
• All major brands now focusing on ‘relationship building’through online and mobile – WARC November 2009
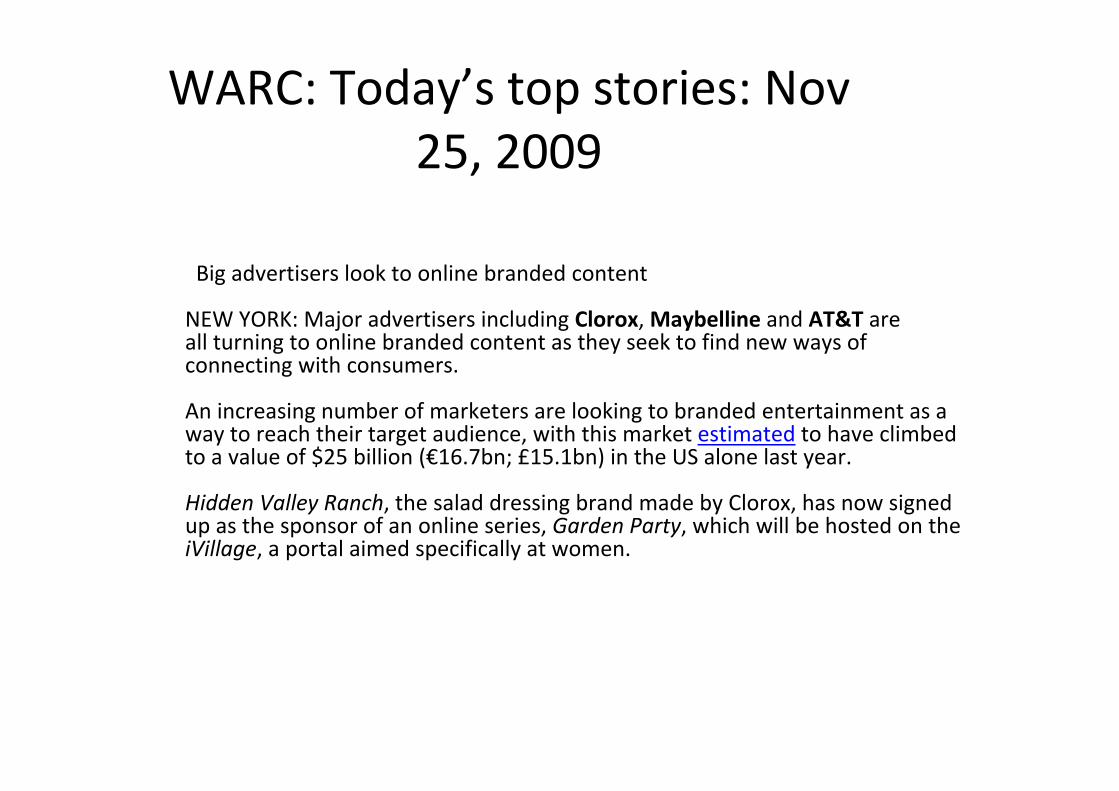
WARC: Today’s top stories: Nov 25, 2009
Big advertisers look to online branded content
NEW YORK: Major advertisers including Clorox, Maybelline and AT&T are all turning to online branded content as they seek to find new ways of connecting with consumers.
An increasing number of marketers are looking to branded entertainment as a way to reach their target audience, with this market estimated to have climbed to a value of $25 billion (€16.7bn; £15.1bn) in the US alone last year.
Hidden Valley Ranch, the salad dressing brand made by Clorox, has now signed up as the sponsor of an online series, Garden Party, which will be hosted on the iVillage, a portal aimed specifically at women.
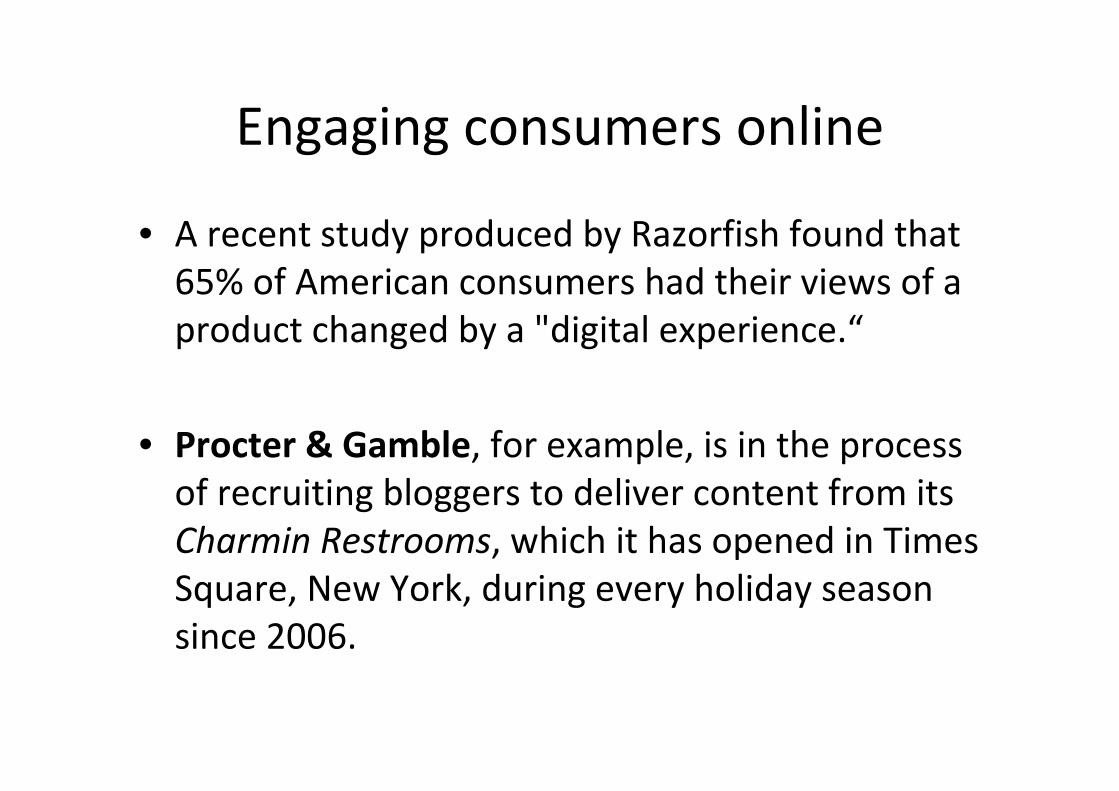
Engaging consumers online
• A recent study produced by Razorfish found that 65% of American consumers had their views of a product changed by a "digital experience.“
• Procter & Gamble, for example, is in the process of recruiting bloggers to deliver content from its Charmin Restrooms, which it has opened in Times Square, New York, during every holiday season since 2006.
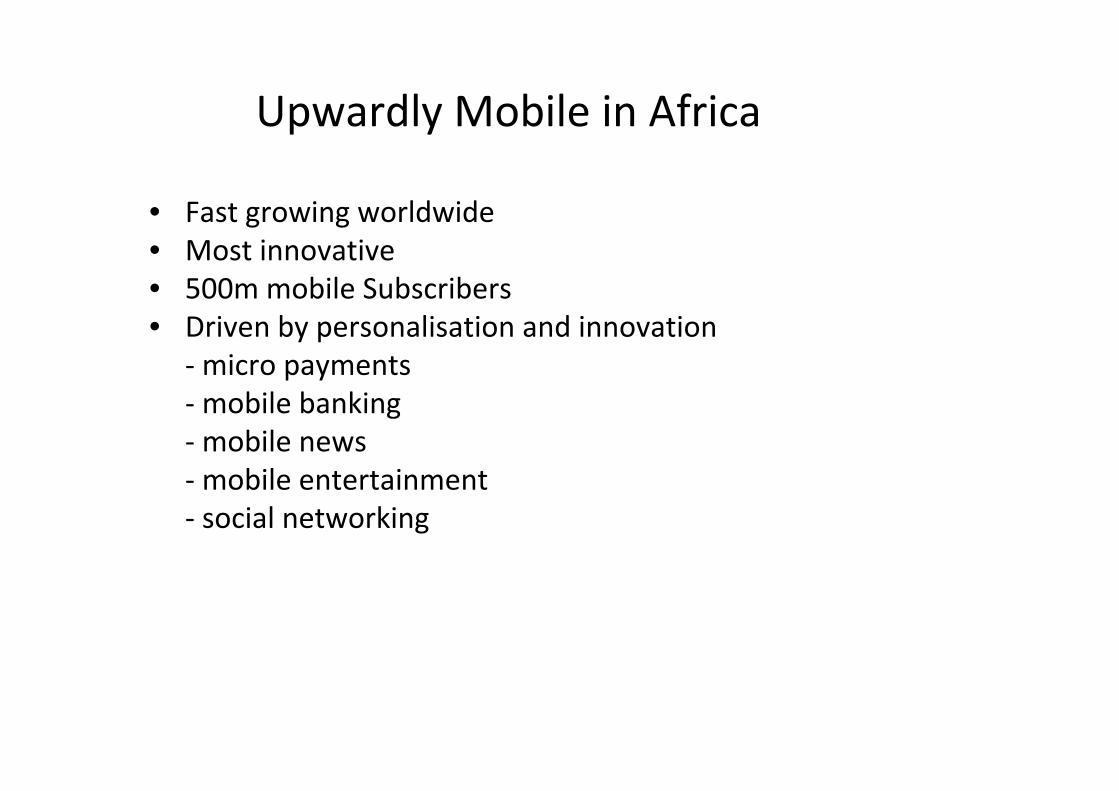
Upwardly Mobile in Africa
• Fast growing worldwide• Most innovative• 500m mobile Subscribers• Driven by personalisation and innovation
‐micro payments‐mobile banking‐mobile news‐mobile entertainment‐ social networking
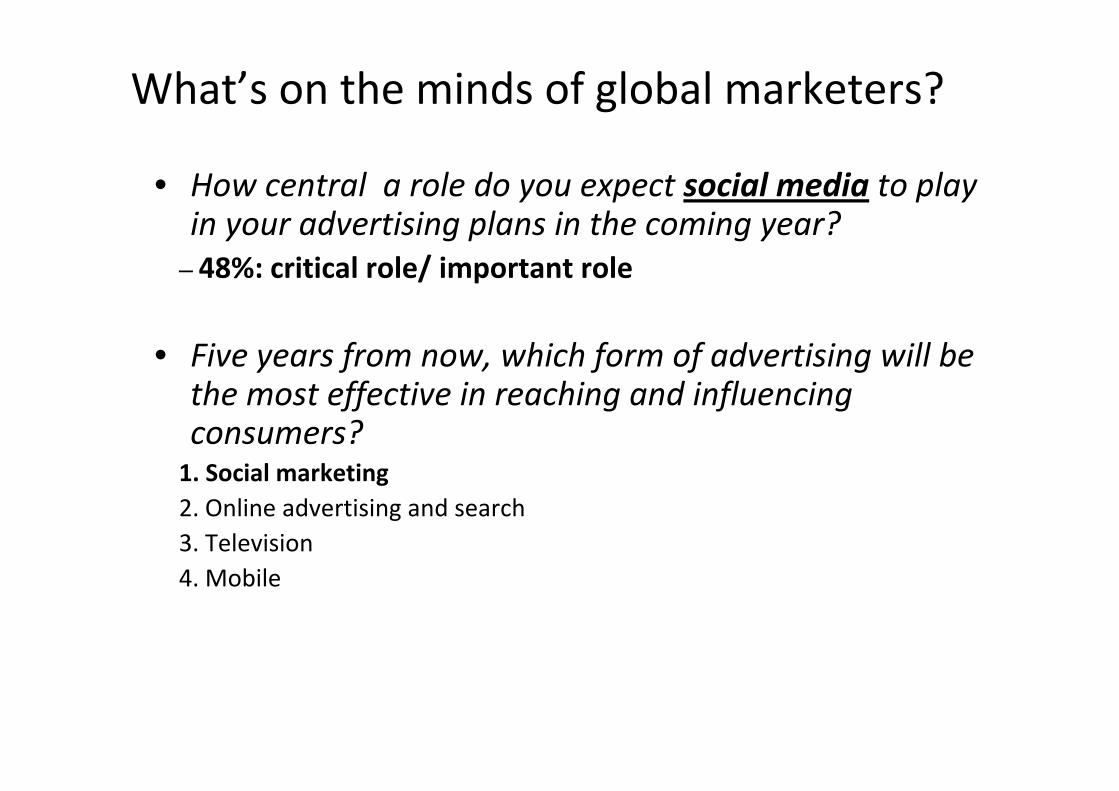
What’s on the minds of global marketers?
• How central a role do you expect social media to play in your advertising plans in the coming year?
– 48%: critical role/ important role
• Five years from now, which form of advertising will be the most effective in reaching and influencing consumers?1. Social marketing2. Online advertising and search3. Television4. Mobile

going?where
are we

Convergence
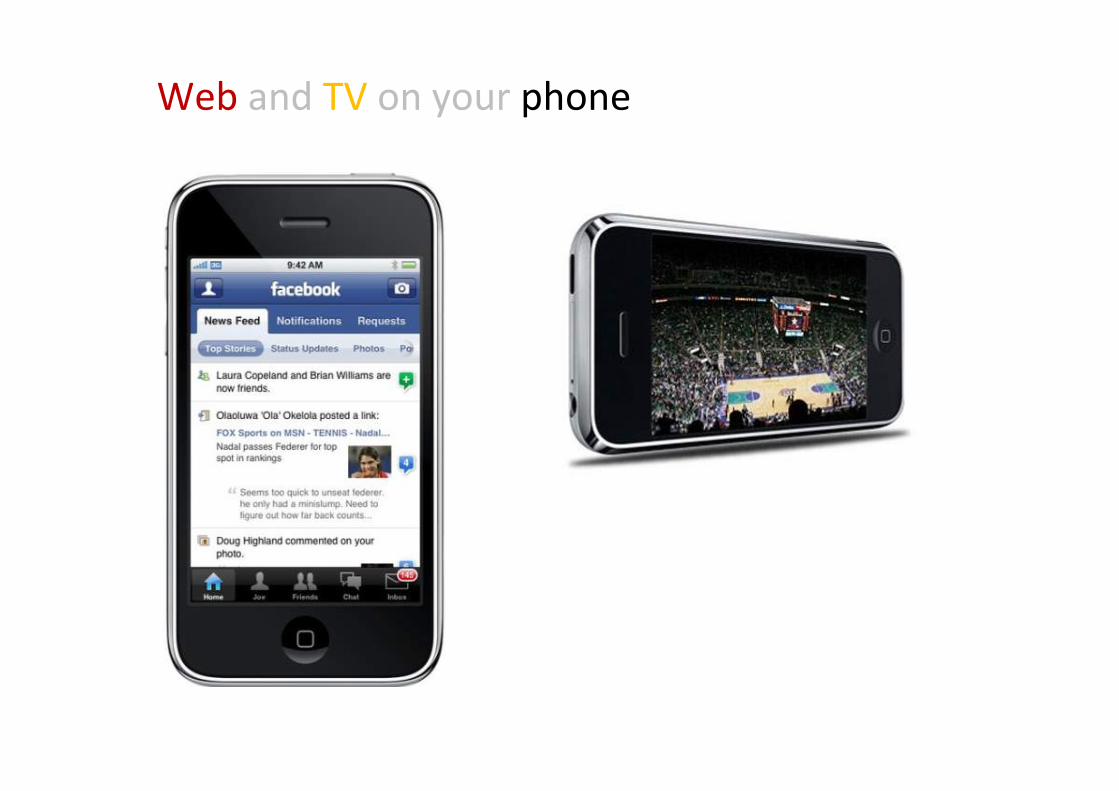
Web and TV on your phone
http://www.flickr.com/photos/tanaka/3212373419/
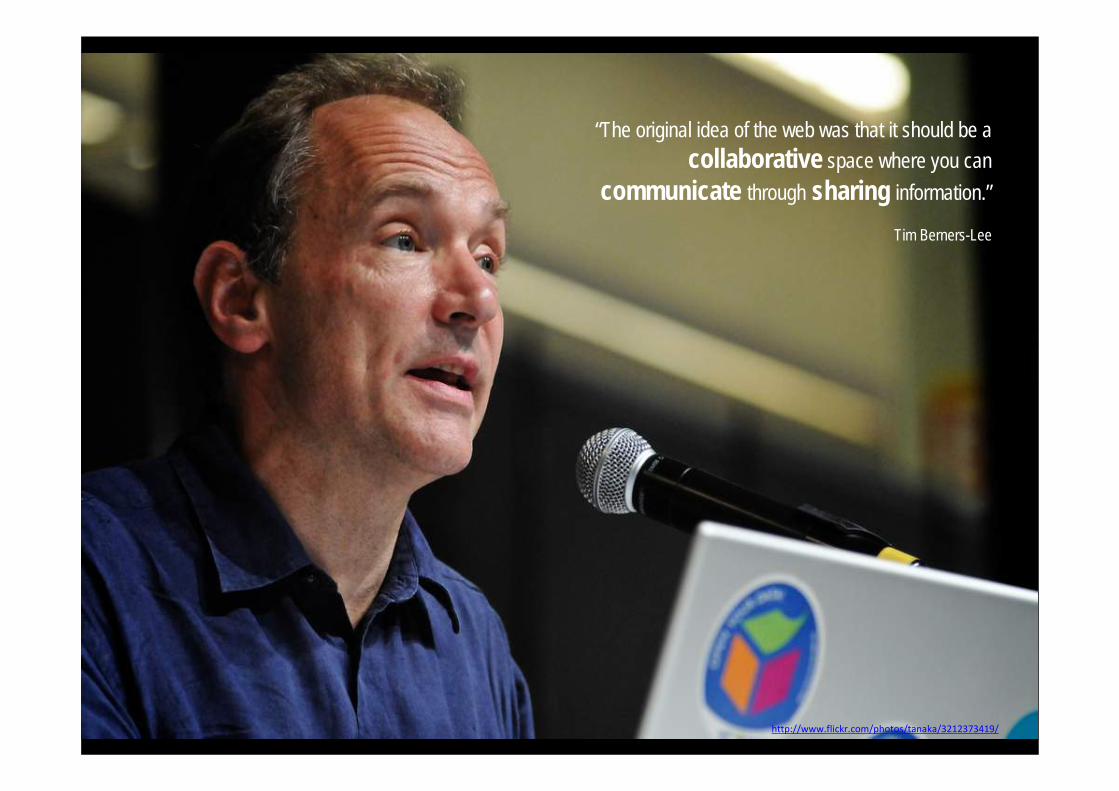
“The original idea of the web was that it should be a collaborative space where you can
communicate through sharing information.”
Tim Berners-Lee
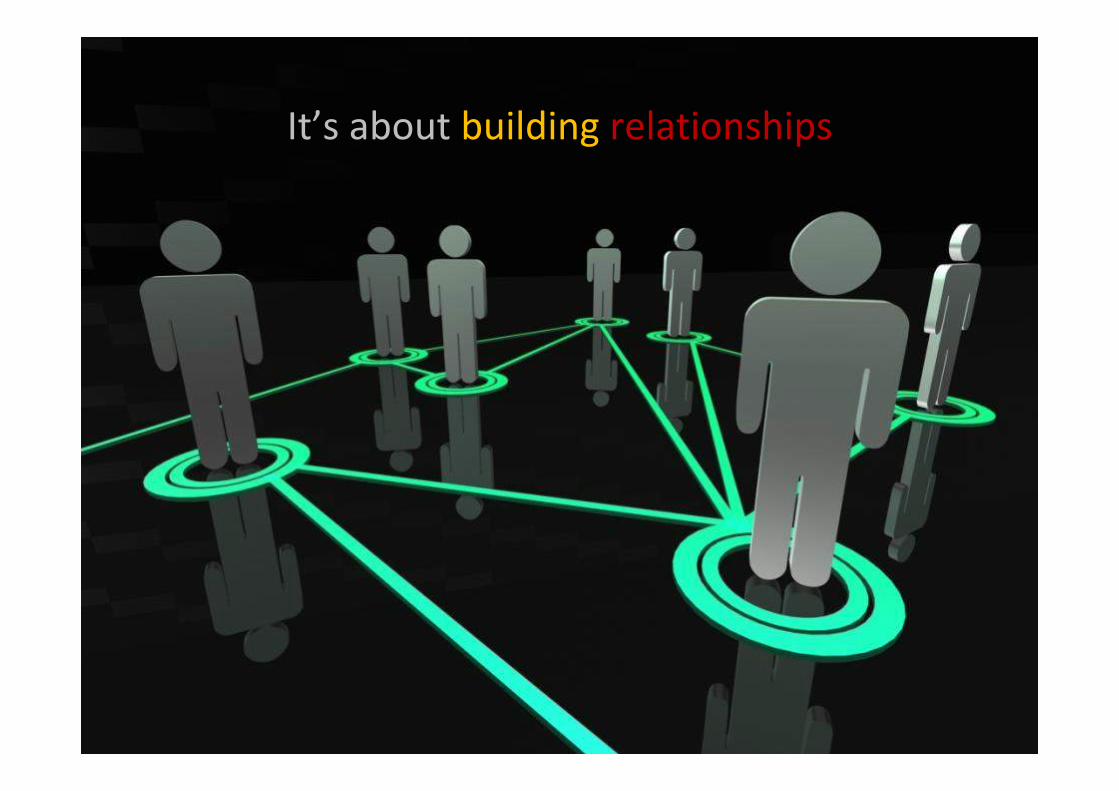
It’s about building relationships
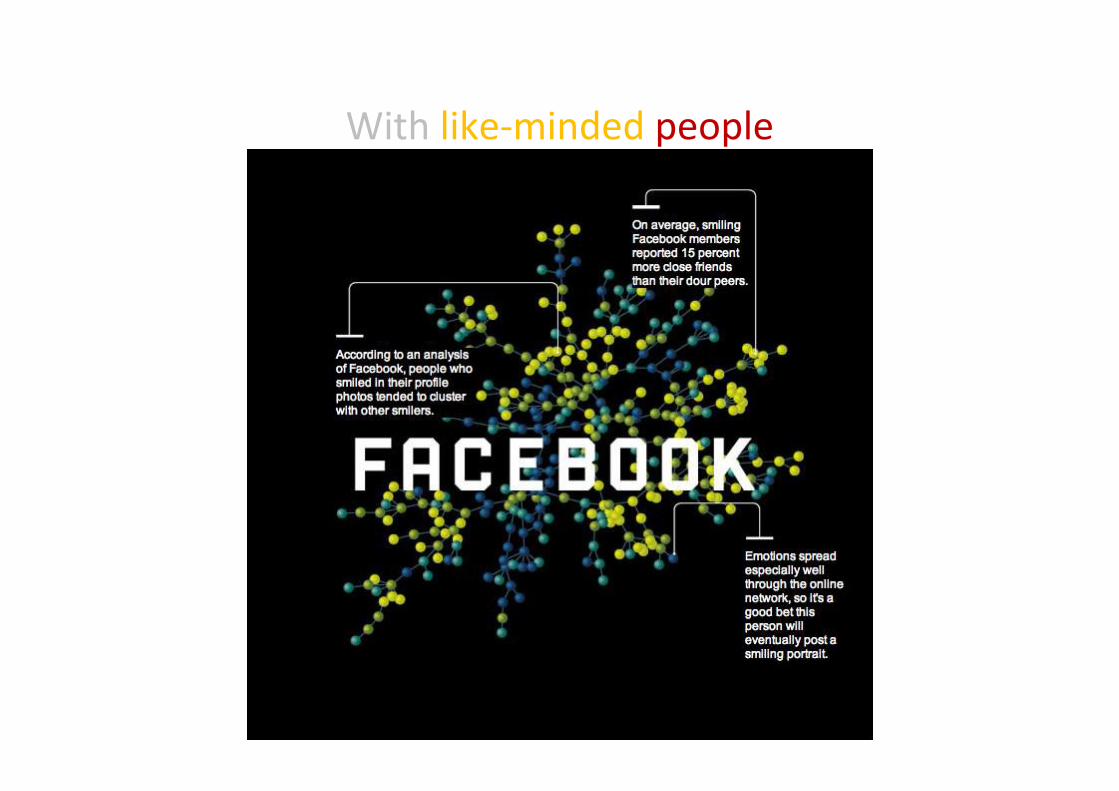
With like‐minded people
brands?mean
what does this for
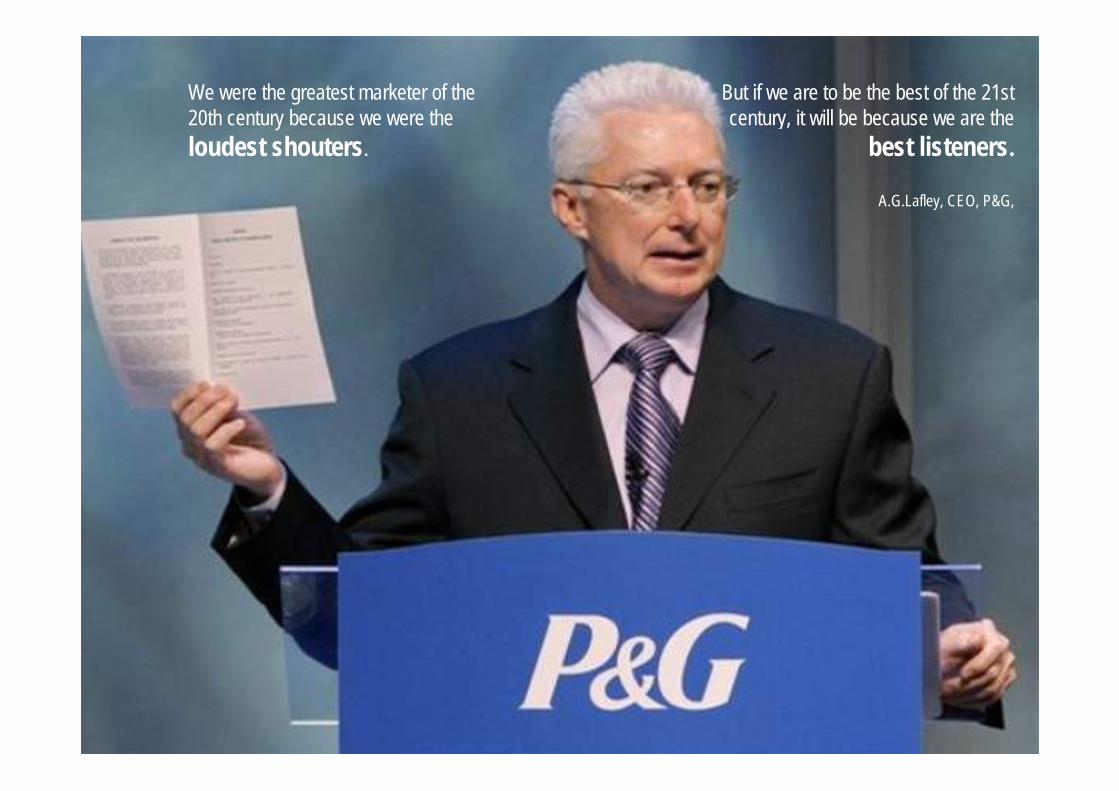
We were the greatest marketer of the 20th century because we were the loudest shouters.
But if we are to be the best of the 21st century, it will be because we are the
best listeners.
A.G.Lafley, CEO, P&G,
We are moving a lot more to consumer engagement as opposed to simply television advertising .
Whether you like it or not, consumers are in a way playing a big role in content management.
Joseph V. Tripodi, Coca-Cola Chief Marketing & Commercial Officer
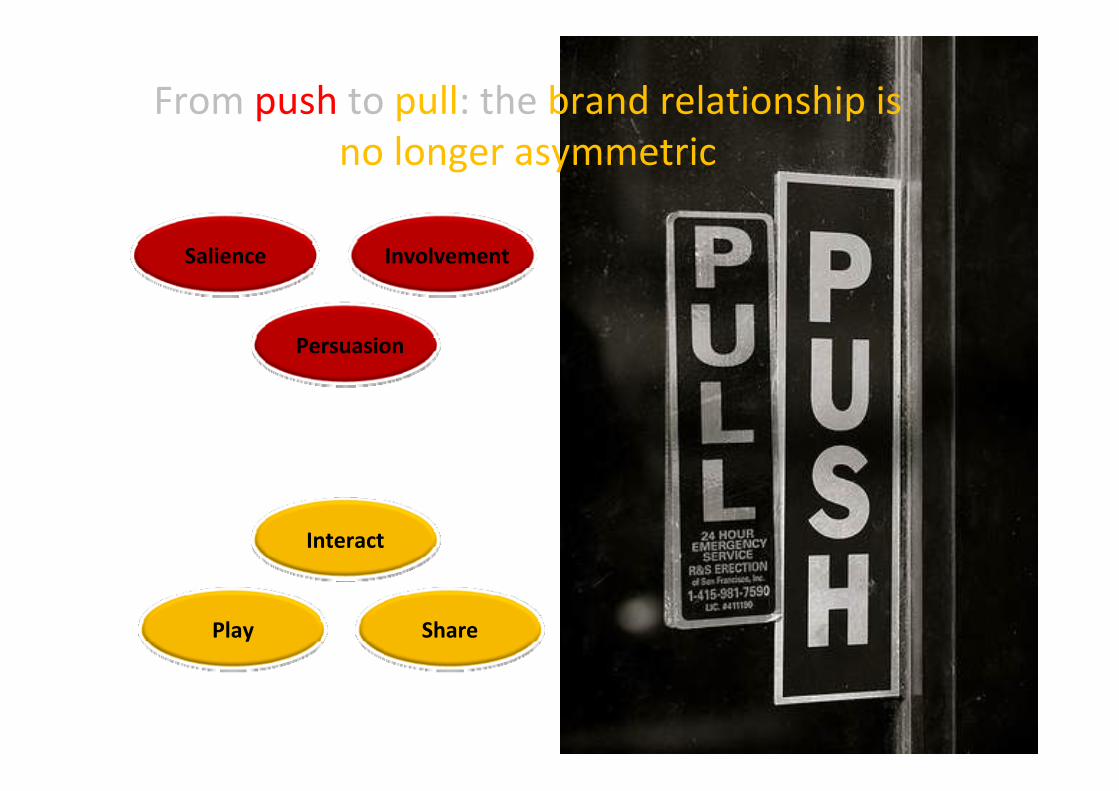
From push to pull: the brand relationship is no longer asymmetric
Salience
Persuasion
Involvement
Interact
Play Share
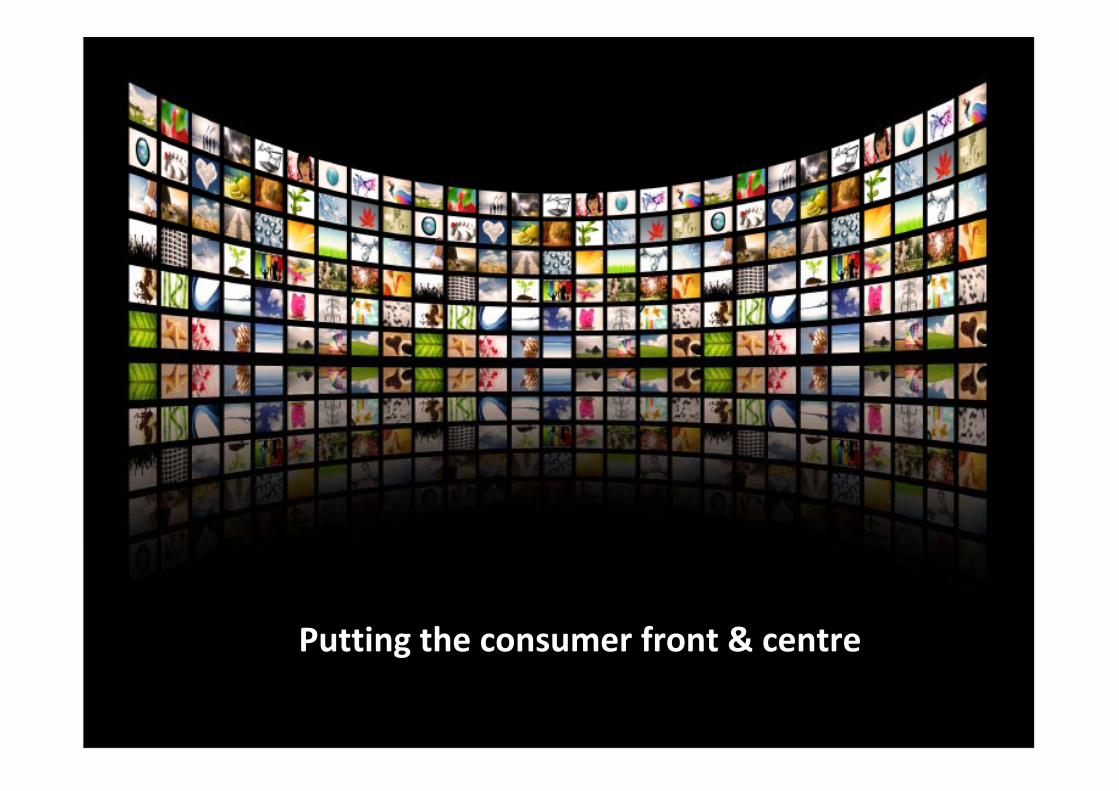
Putting the consumer front & centre
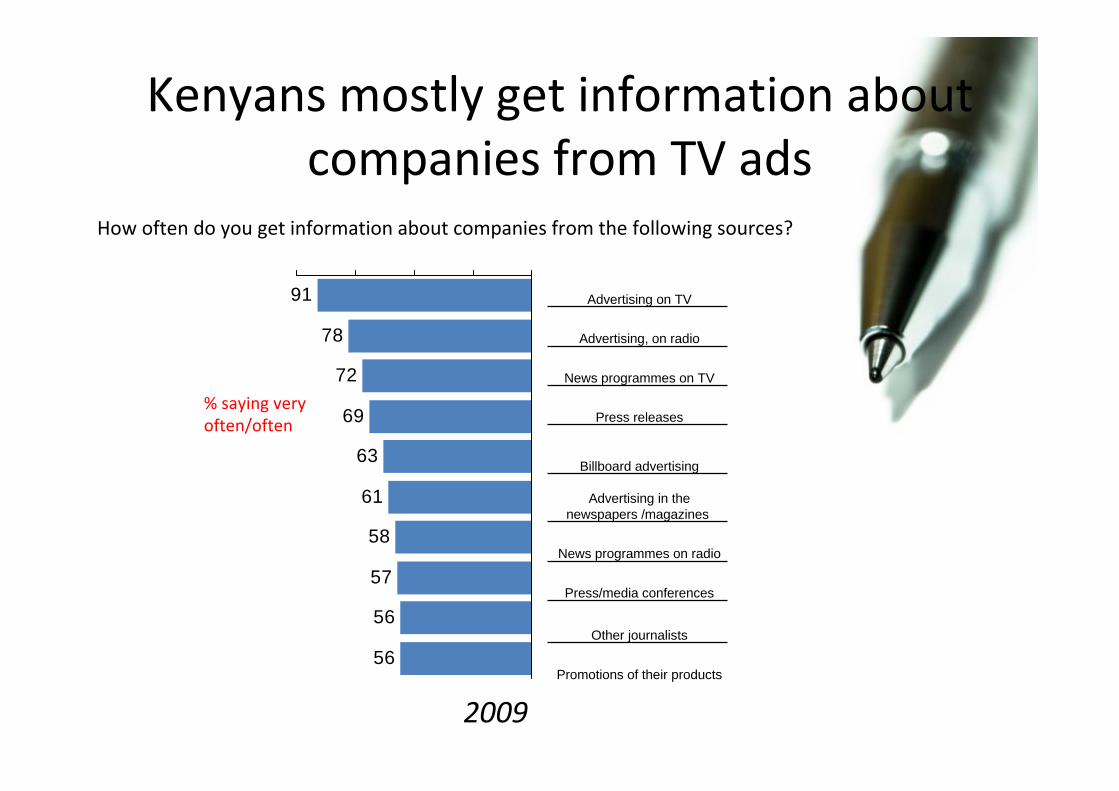
Kenyans mostly get information about companies from TV ads
2009
91
78
72
69
63
61
58
57
56
56
Advertising on TV
Advertising, on radio
News programmes on TV
Press releases
Billboard advertising
Advertising in the newspapers /magazines
News programmes on radio
Press/media conferences
Other journalists
Promotions of their products
How often do you get information about companies from the following sources?
% saying very often/often
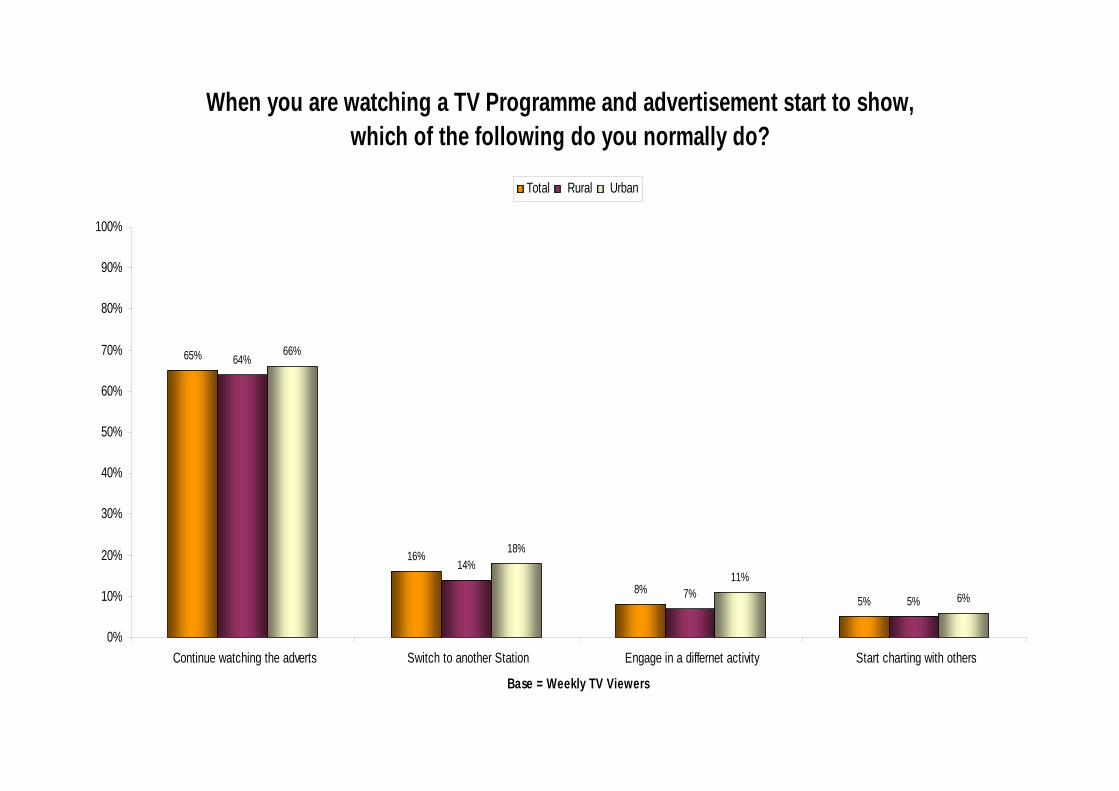
When you are watching a TV Programme and advertisement start to show, which of the following do you normally do?
65%
16%
8%5%
64%
14%
7% 5%
66%
18%
11%
6%
0%
10%
20%
30%
40%
50%
60%
70%
80%
90%
100%
Continue watching the adverts Switch to another Station Engage in a differnet activity Start charting with others
Base = Weekly TV Viewers
Total Rural Urban
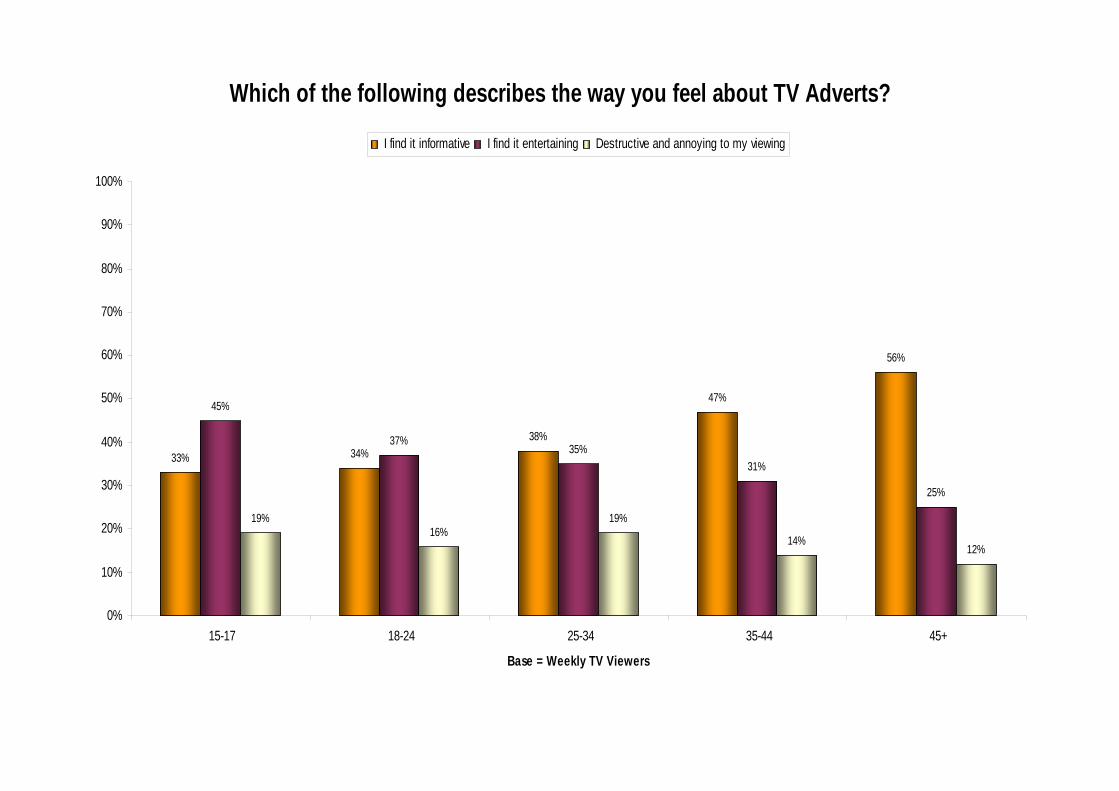
Which of the following describes the way you feel about TV Adverts?
33% 34%38%
47%
56%
45%
37%35%
31%
25%
19%16%
19%
14%12%
0%
10%
20%
30%
40%
50%
60%
70%
80%
90%
100%
15-17 18-24 25-34 35-44 45+
Base = Weekly TV Viewers
I find it informative I find it entertaining Destructive and annoying to my viewing
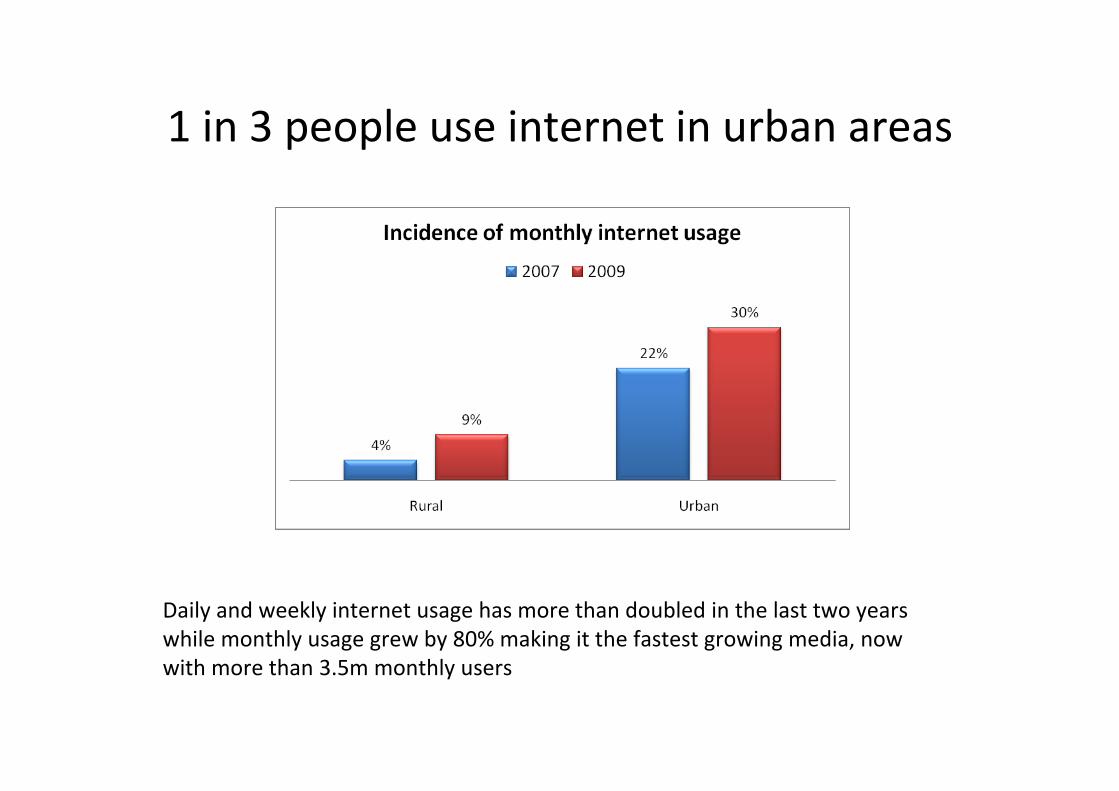
Daily and weekly internet usage has more than doubled in the last two years while monthly usage grew by 80% making it the fastest growing media, now with more than 3.5m monthly users
1 in 3 people use internet in urban areas
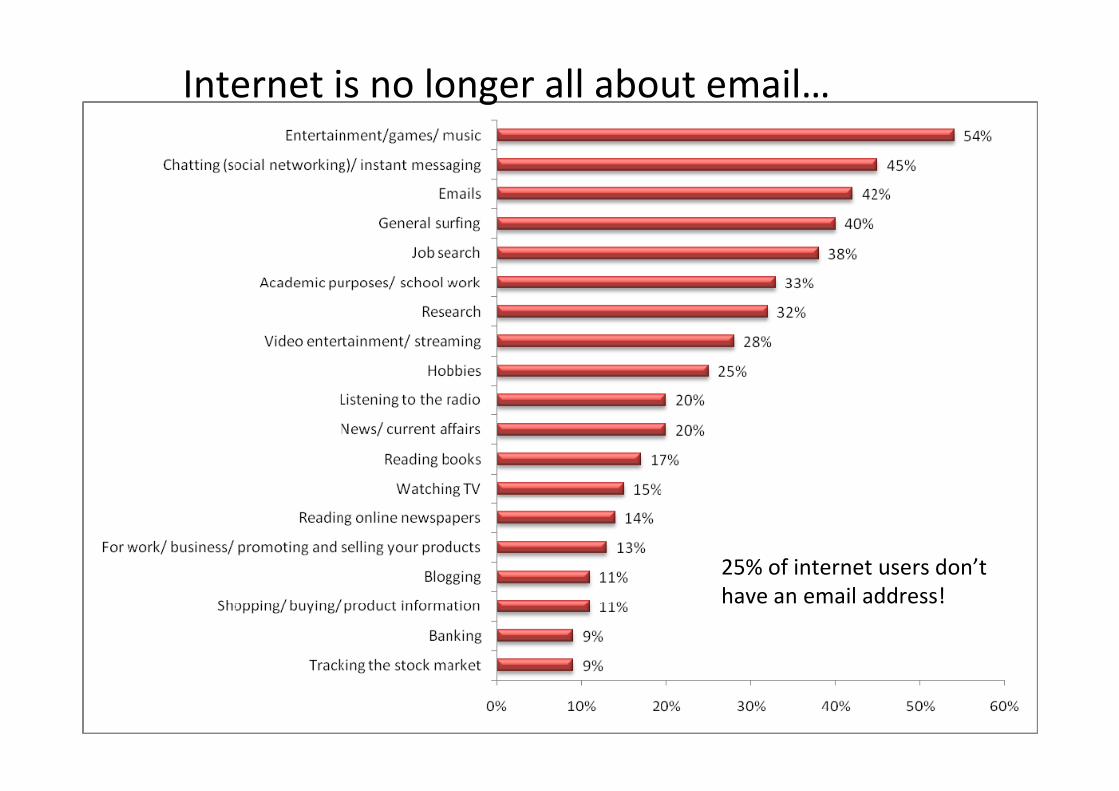
25% of internet users don’t have an email address!
Internet is no longer all about email…
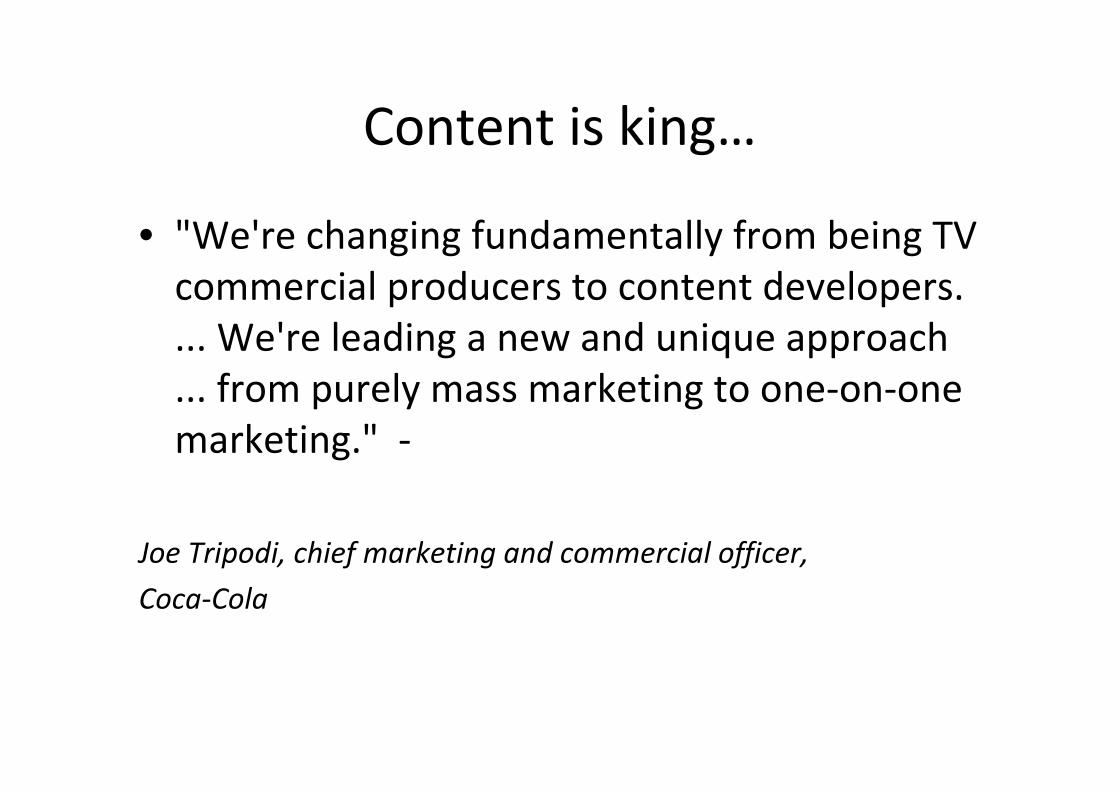
Content is king…
• "We're changing fundamentally from being TV commercial producers to content developers. ... We're leading a new and unique approach ... from purely mass marketing to one‐on‐one marketing." ‐
Joe Tripodi, chief marketing and commercial officer,
Coca‐Cola
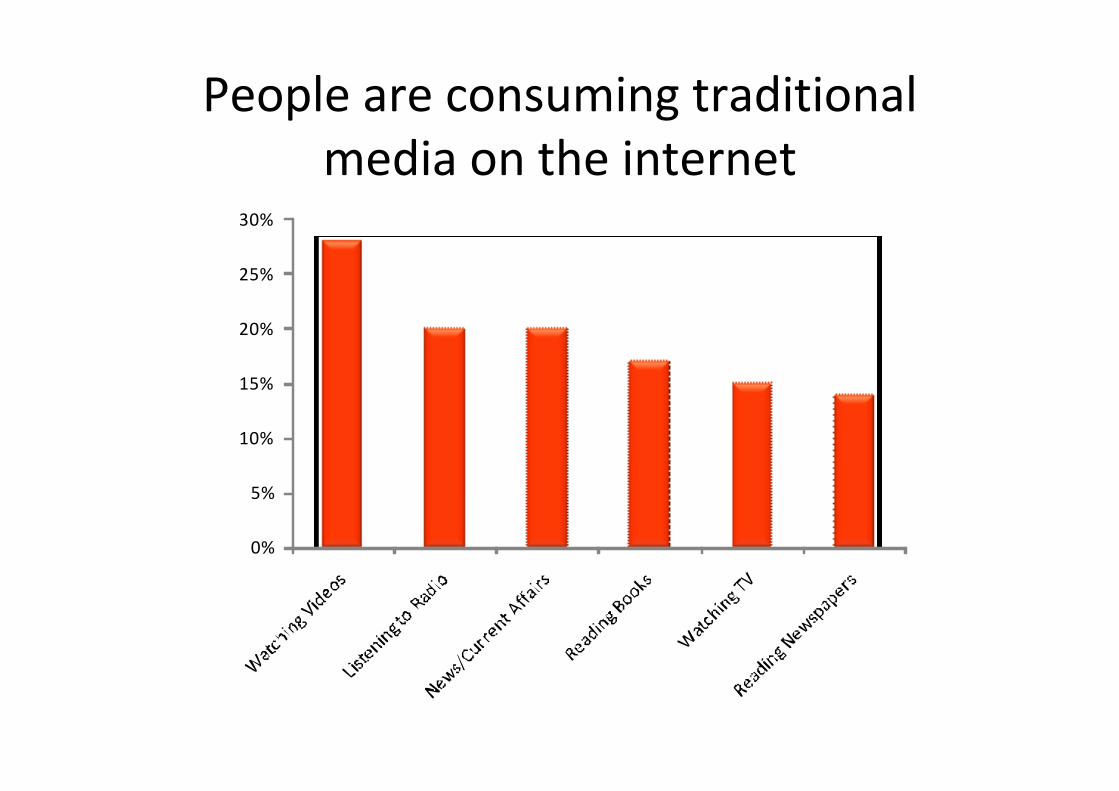
People are consuming traditional media on the internet
0%
5%
10%
15%
20%
25%
30%
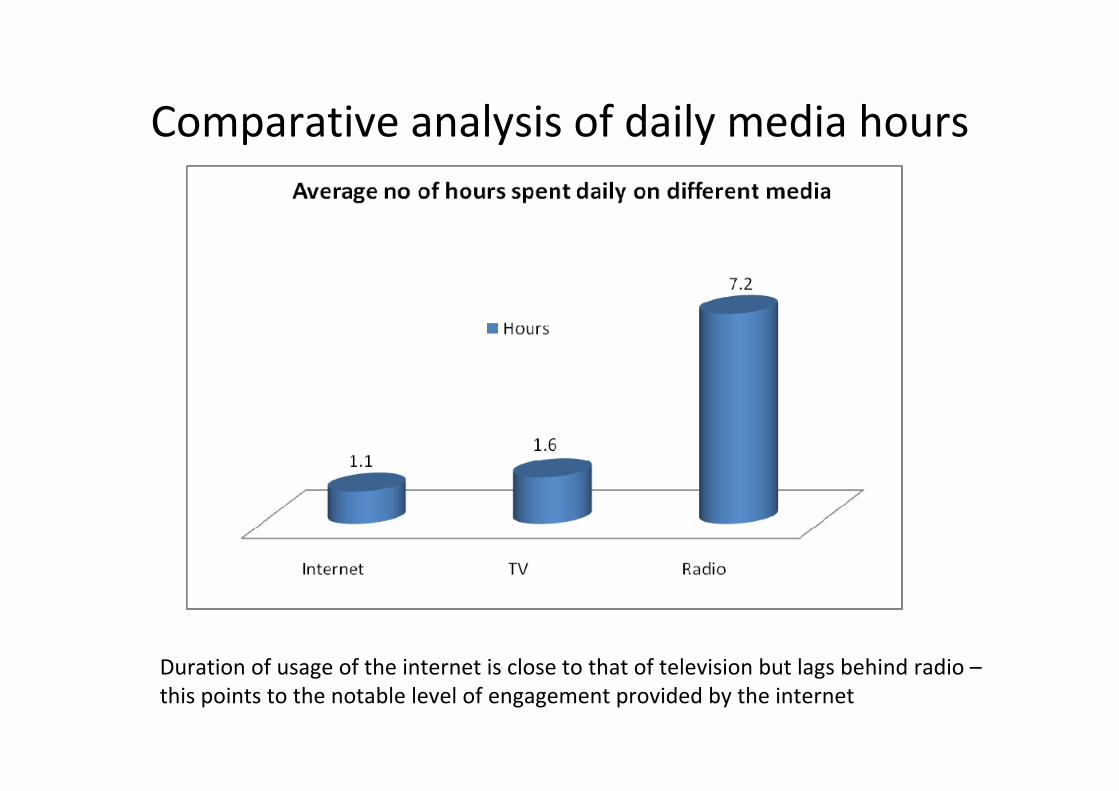
Duration of usage of the internet is close to that of television but lags behind radio –this points to the notable level of engagement provided by the internet
Comparative analysis of daily media hours
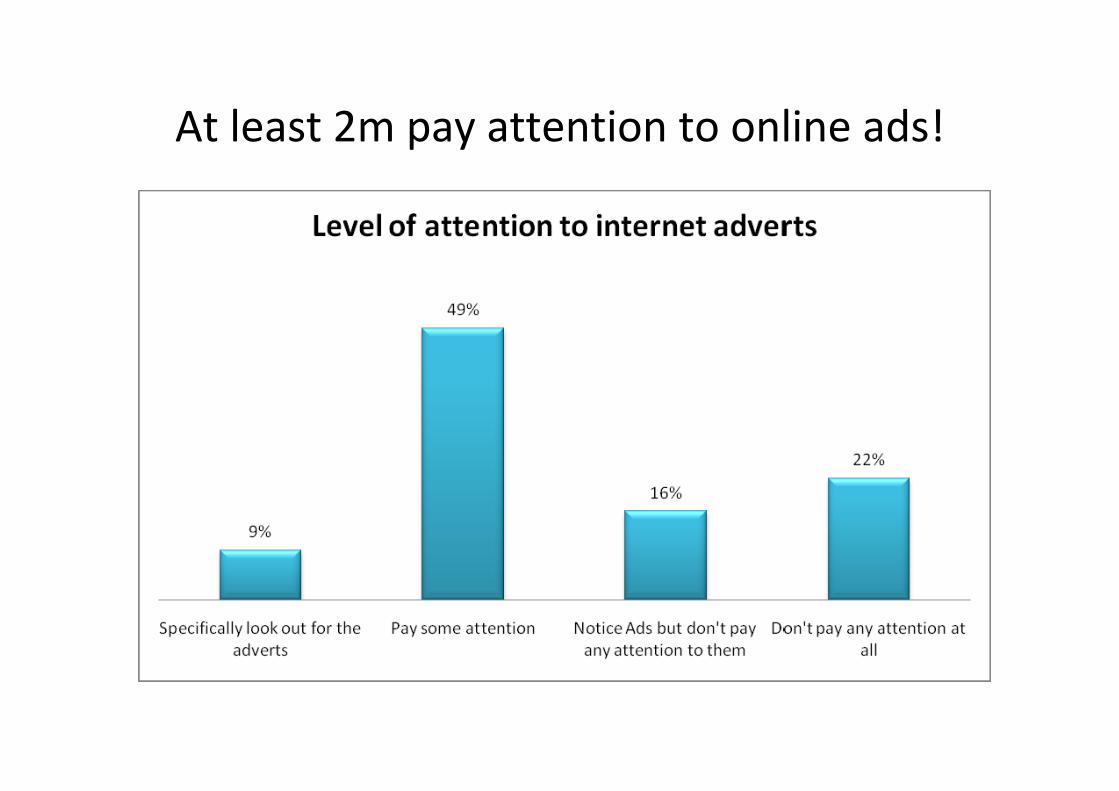
At least 2m pay attention to online ads!
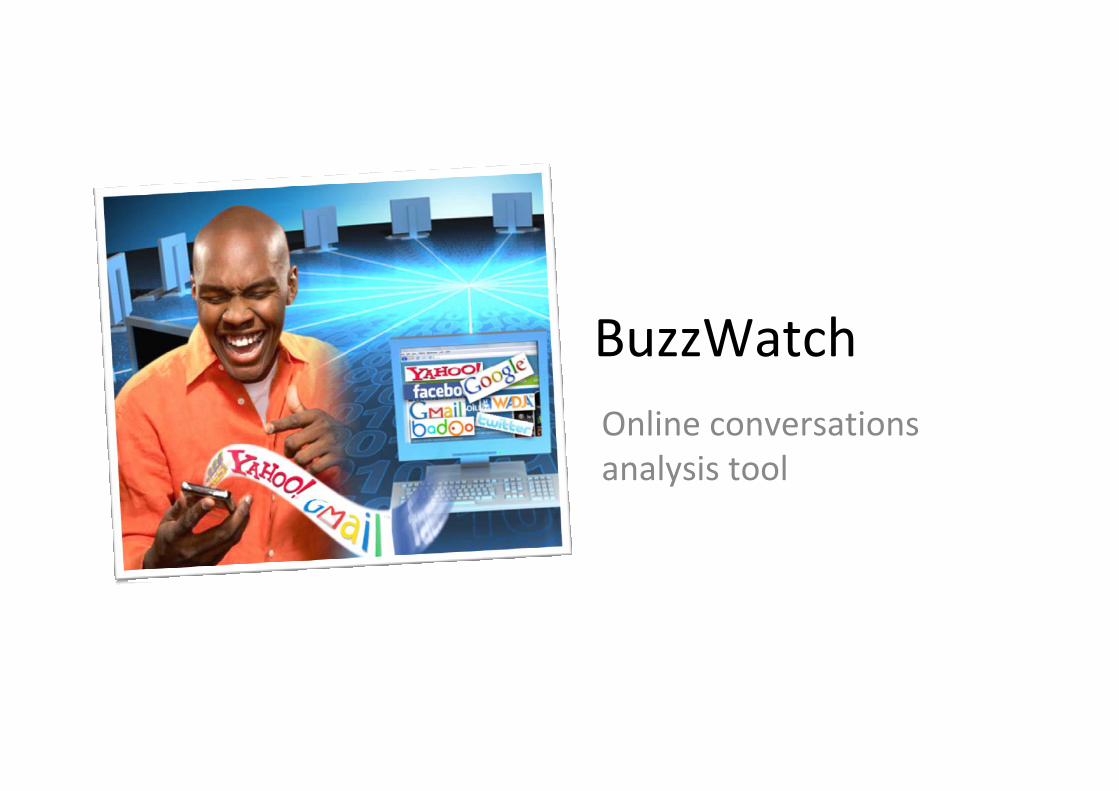
BuzzWatchOnline conversations analysis tool
An Overview of BuzzWatch
• BuzzWatch is continuously scanning & indexing online conversations & related comments.
• Results are stored in a Social Media Warehouse. Analysts access the database via BuzzWatch User Interface which has powerful tools for analysis, sentiment, reporting and real time alerts.
• The online ware house is currently collecting over ten million new results daily from virtually every available source.
• The Social Media Warehouse has stored over 1.3 billion conversations since October 2007.
OverviewSearch Structures
Search Structures can range from Simple to Complex
• Boolean operators; and, or, not; wildcards * and generational terms
• Categories allow the ability to create “buckets” of information
• Subdivide your results into categories that are as granular as needed
• Ability to create customized categories that can be trained to add to them automatically
• Ability to add custom sources
• Ability to ignore URL’s
• Supports unicode ‐ The application is in English, however the data is unicode so queries will return results in the language of the search terms.
OverviewSearch Results
Results are Easy to Use & Actionable
• Full Historical Data
• Automated Sentiment, Tone & Content Emotions ‐ results are scored using a natural language process and a lexicon dictionary. The dictionary is presently in four languages (English, German, Spanish, and Dutch) and is customizable.
• In‐depth information for each search result (36 types of data ranging from date published to physical location of the creator of the content)
• Powerful tools provide for infinite ways to cut the data
• Workflow provides a way to assign search results to other team members, give them a priority level and add notes.
• A Summary Report provides an overview on how many items were actioned on a daily, weekly and for the month.
OverviewAnalysis of the conversation
The information can be viewed & analyzed in a variety of ways:
• Volume – identifies patterns and trends
• Share of Voice – displays where the online conversations are occurring at by type of source: blogs, microblogs, wikis, message boards/forums, etc
• Displayed by both volume by source and volume over time
• Textual analysis – create word clouds displaying the most frequently used words in the content themes and author tags
• Domains and geomapping – displays where the conversations are originating from both online and by physical location
• Popularity – this is a rating ranging from 0‐10 that is assigned to each search result that indicates the influence of it (calculated on an algorithm that depends on the type of source)
OverviewReporting
• Daily reports delivered by email or RSS
• Summary Reports available (delivered anytime you choose)
• Real Time Alerts provide immediate notification by email as search results are found. (These search results aren't added to the profile until the routine search runs.)
• All search results & the fields of data are exportable to html, XML & XLS with the option to choose whichever fields desired.
• An (API) application programming interface is available that enables exporting data and related fields of information
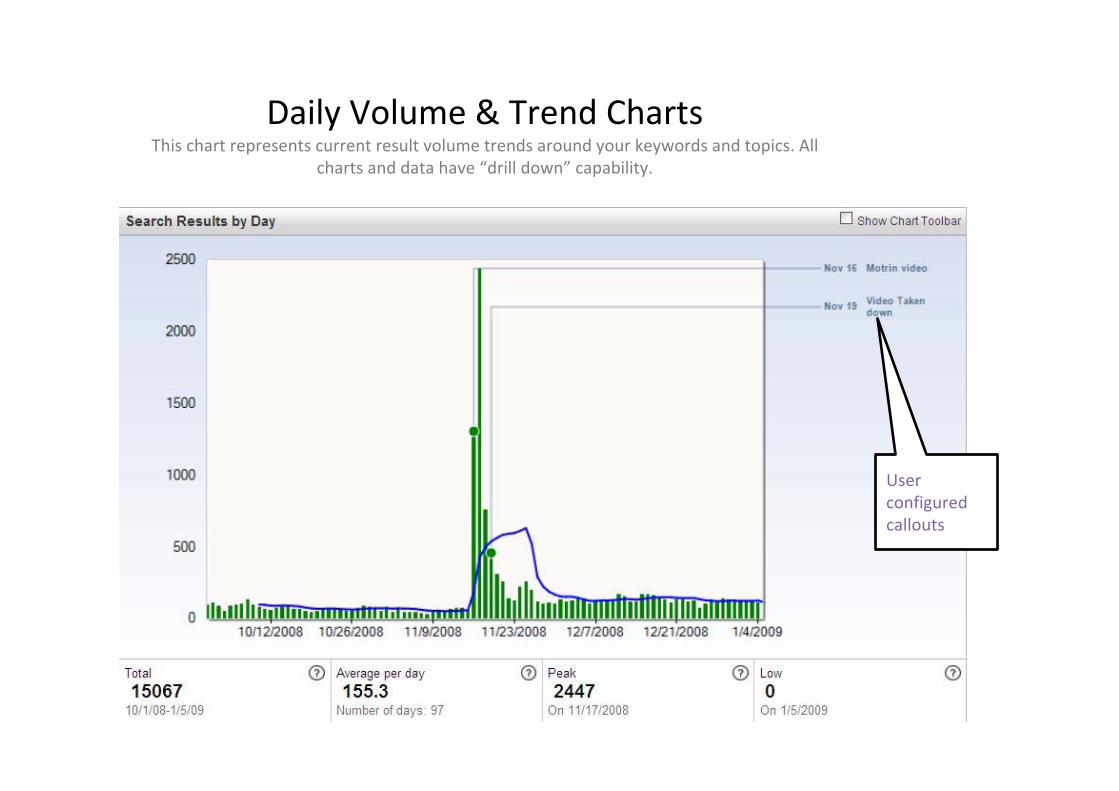
Daily Volume & Trend ChartsThis chart represents current result volume trends around your keywords and topics. All
charts and data have “drill down” capability.
User configured callouts
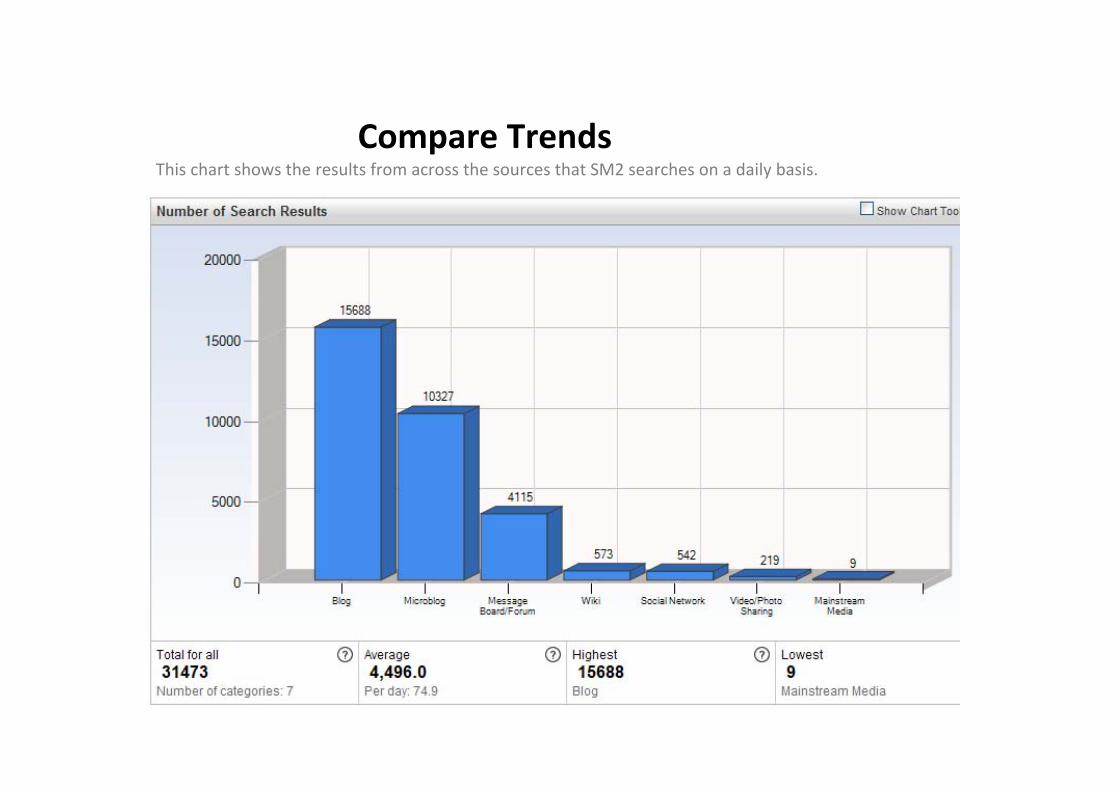
Compare TrendsThis chart shows the results from across the sources that SM2 searches on a daily basis.
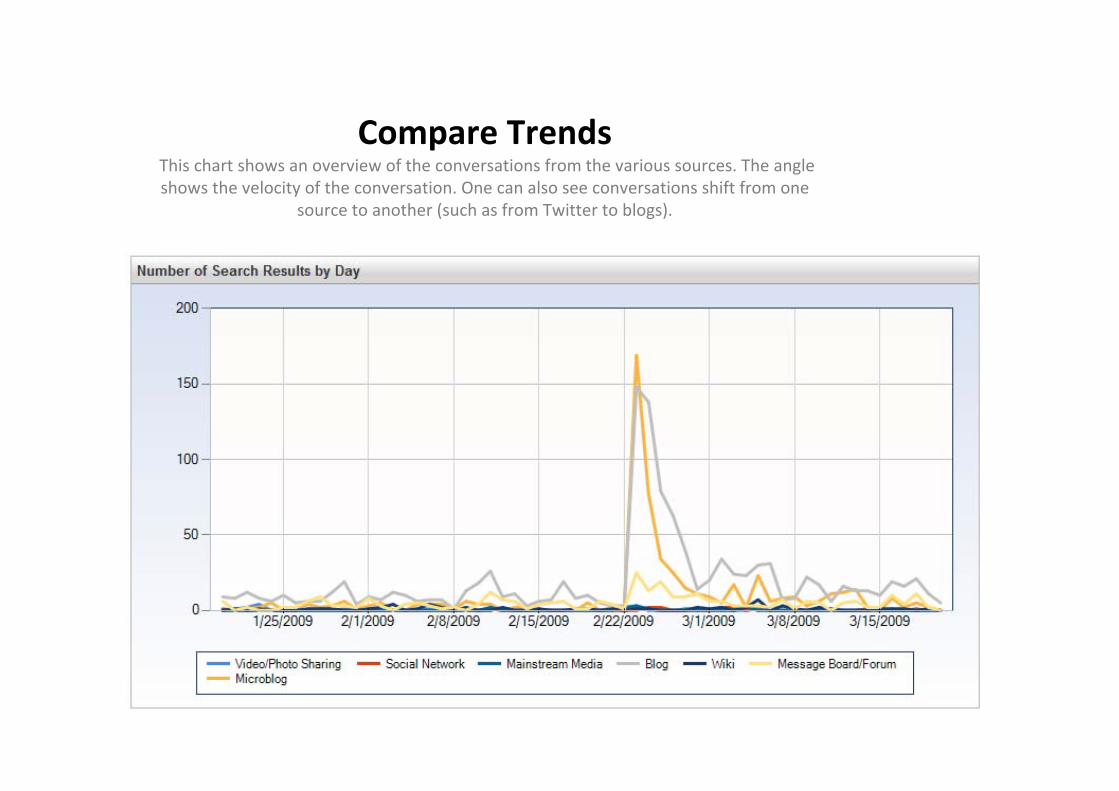
Compare TrendsThis chart shows an overview of the conversations from the various sources. The angle shows the velocity of the conversation. One can also see conversations shift from one
source to another (such as from Twitter to blogs).
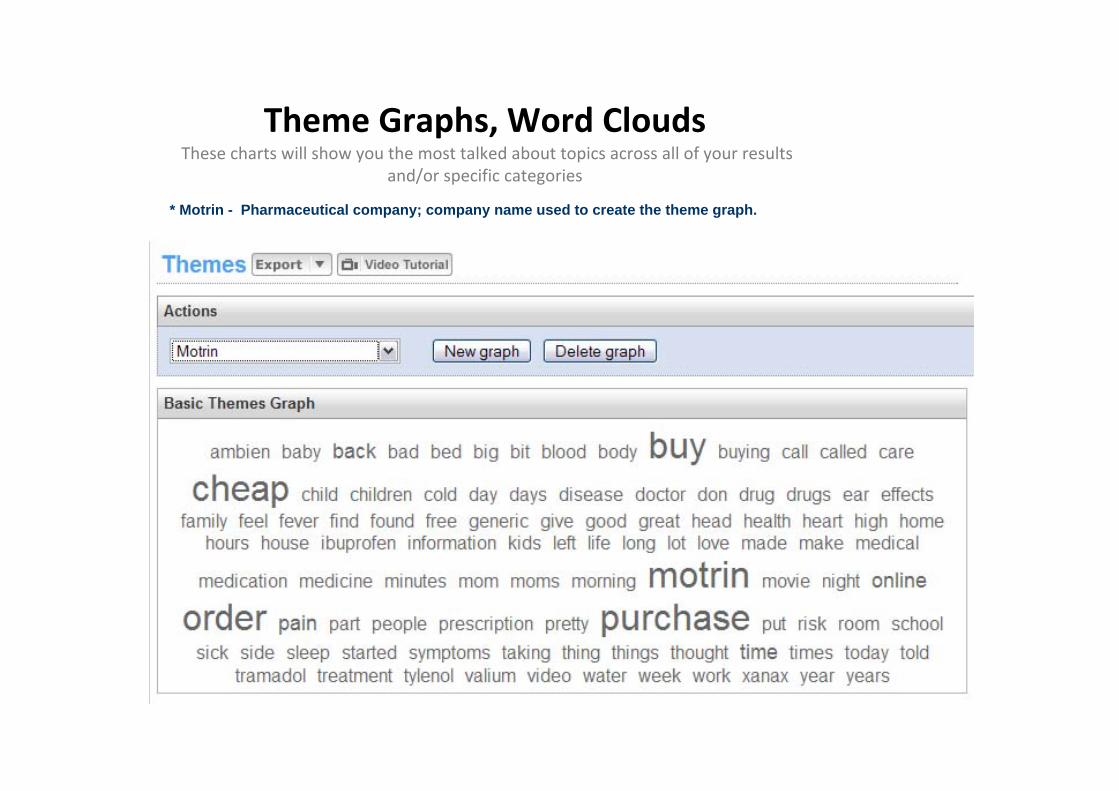
Theme Graphs, Word CloudsThese charts will show you the most talked about topics across all of your results
and/or specific categories
* Motrin - Pharmaceutical company; company name used to create the theme graph.
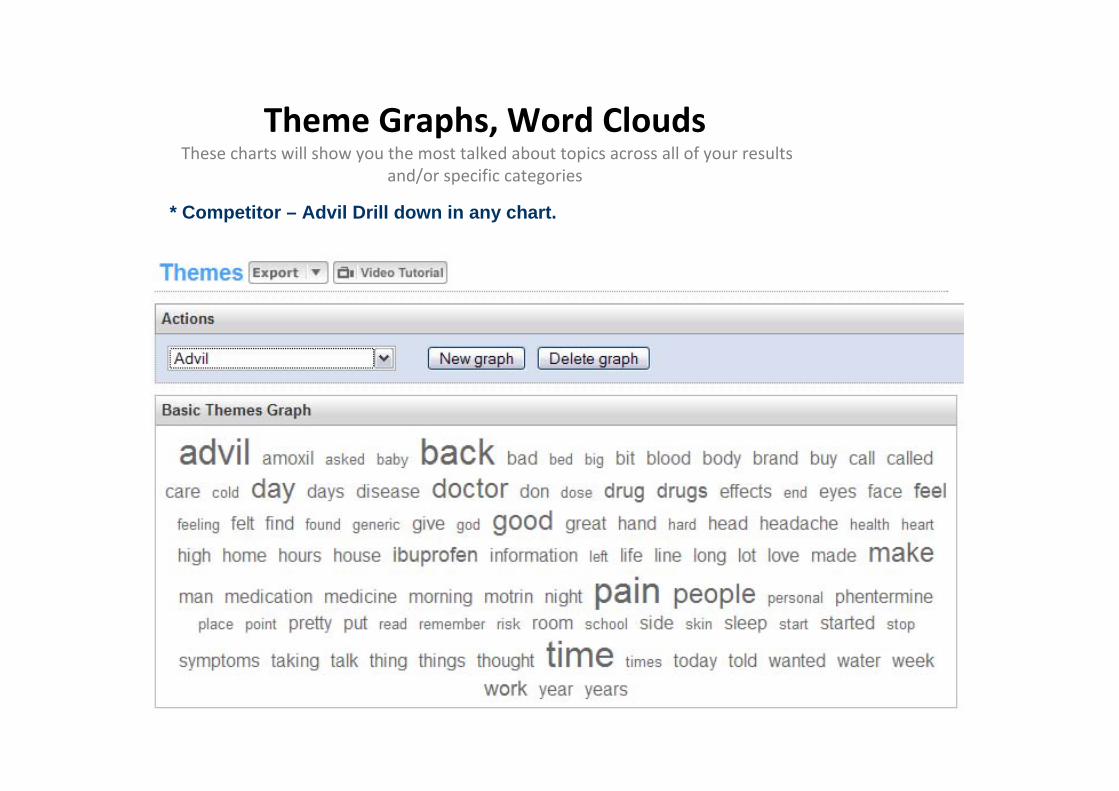
Theme Graphs, Word CloudsThese charts will show you the most talked about topics across all of your results
and/or specific categories
* Competitor – Advil Drill down in any chart.
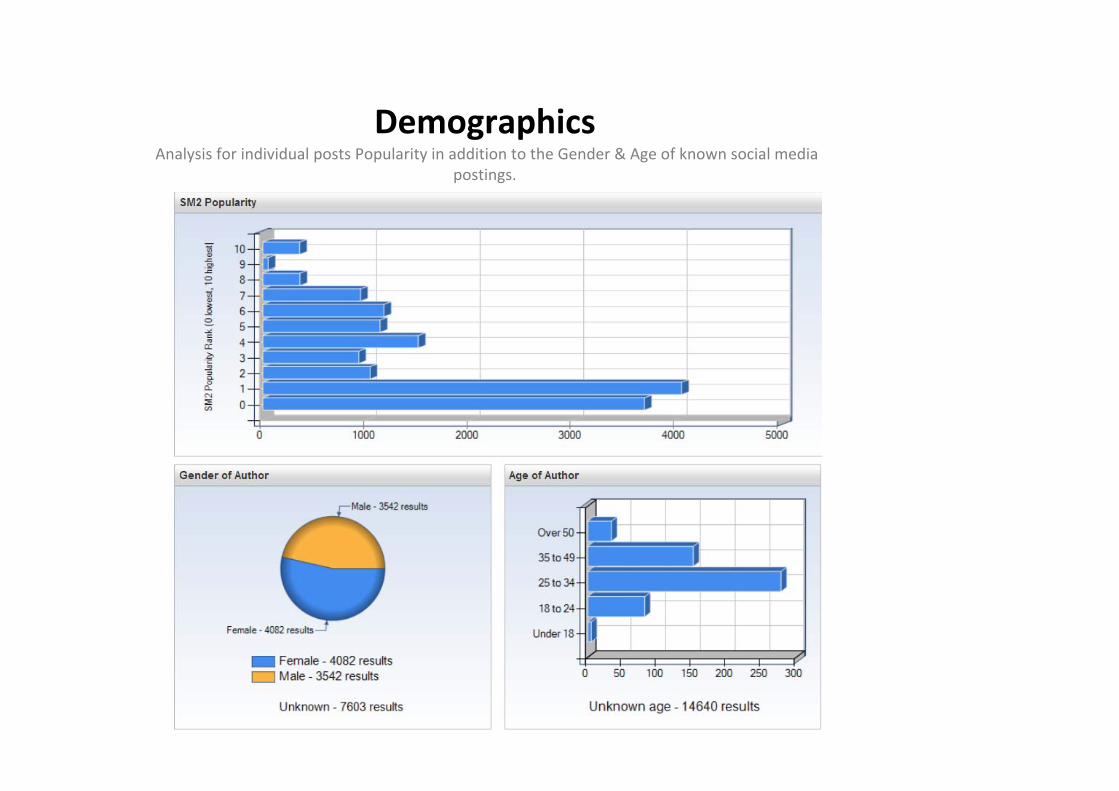
DemographicsAnalysis for individual posts Popularity in addition to the Gender & Age of known social media
postings.
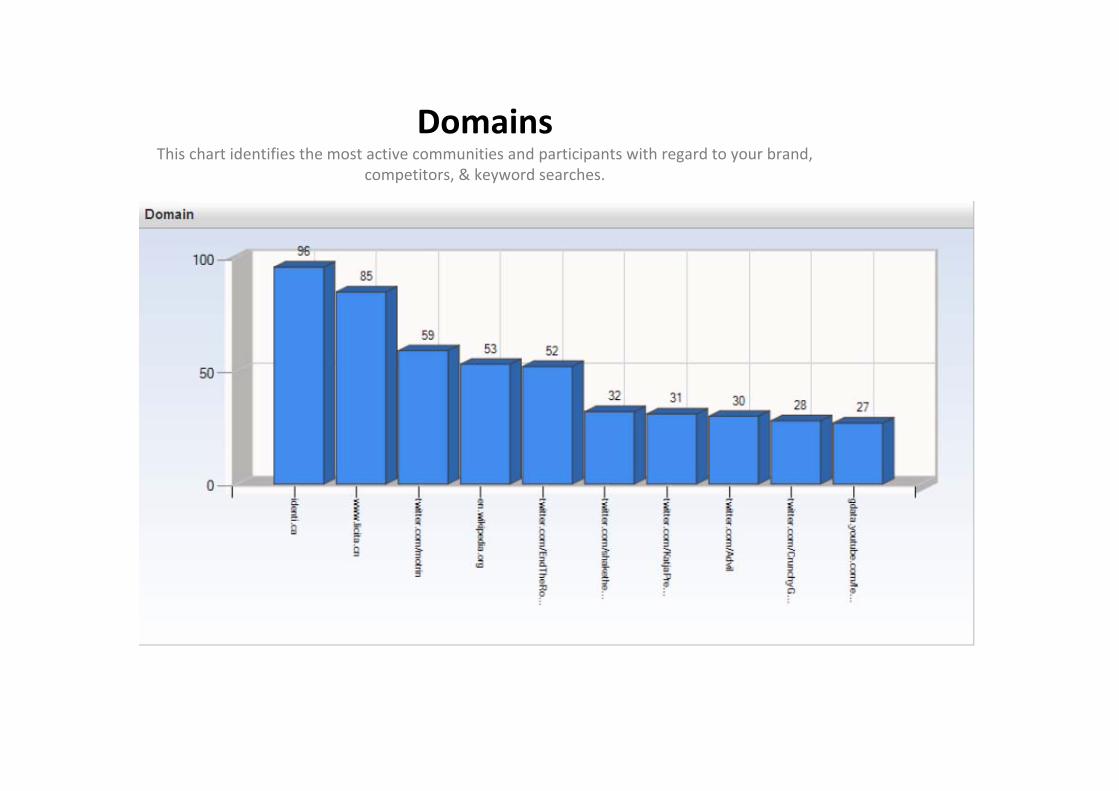
DomainsThis chart identifies the most active communities and participants with regard to your brand,
competitors, & keyword searches.
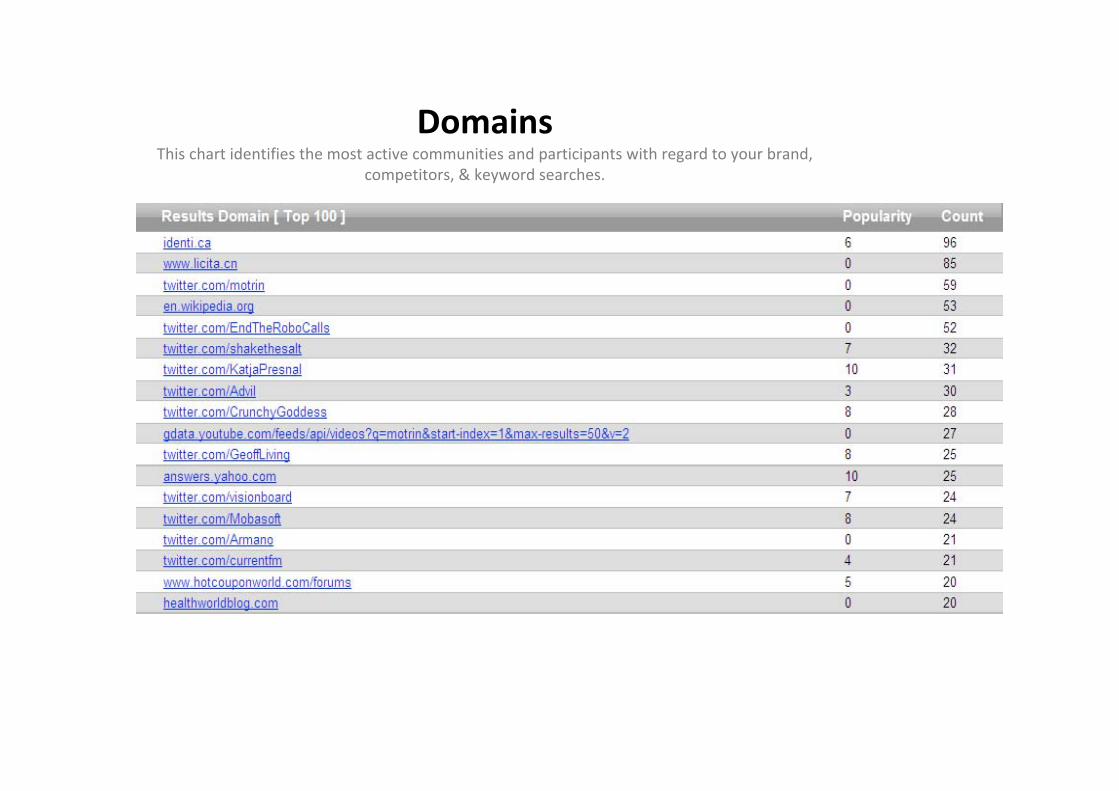
DomainsThis chart identifies the most active communities and participants with regard to your brand,
competitors, & keyword searches.
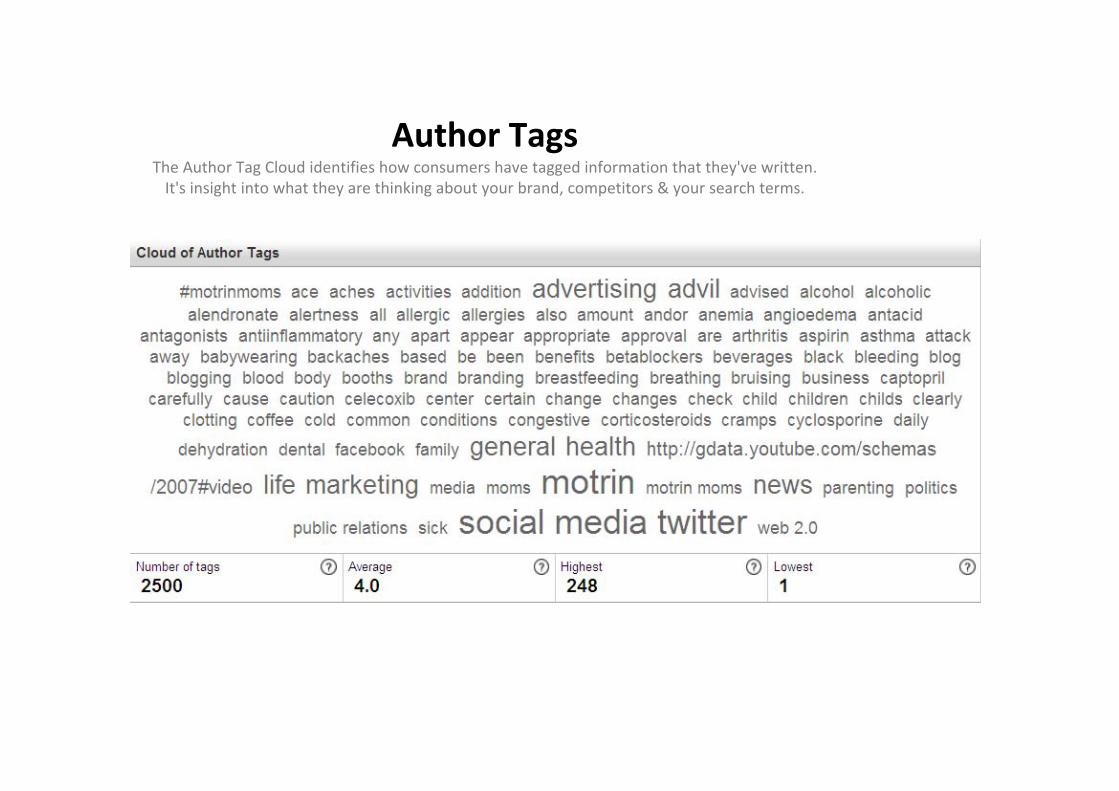
Author TagsThe Author Tag Cloud identifies how consumers have tagged information that they've written. It's insight into what they are thinking about your brand, competitors & your search terms.
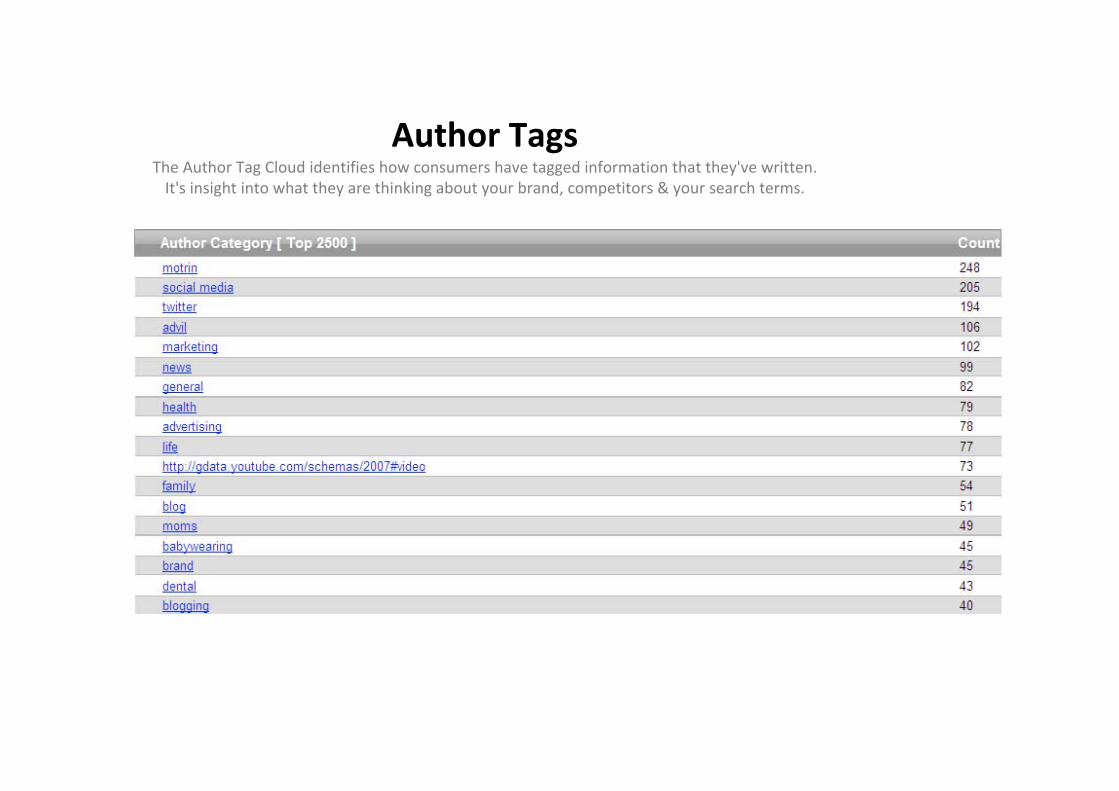
Author TagsThe Author Tag Cloud identifies how consumers have tagged information that they've written. It's insight into what they are thinking about your brand, competitors & your search terms.
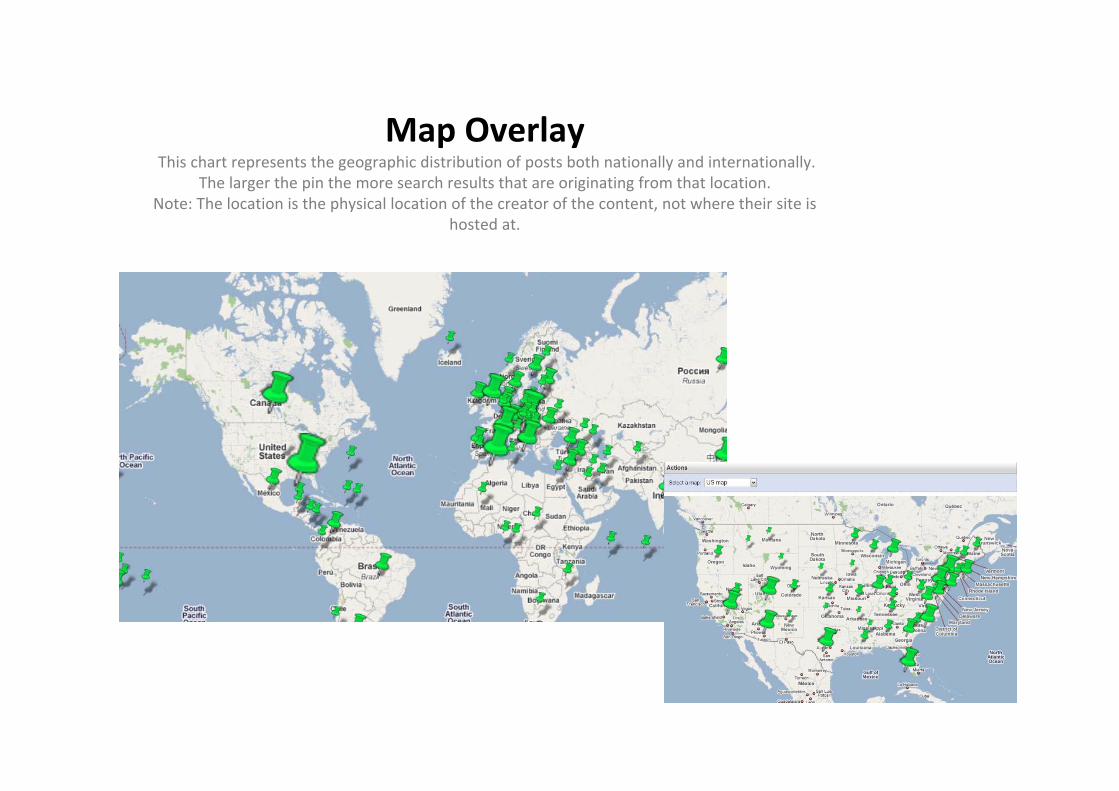
Map OverlayThis chart represents the geographic distribution of posts both nationally and internationally.
The larger the pin the more search results that are originating from that location. Note: The location is the physical location of the creator of the content, not where their site is
hosted at.
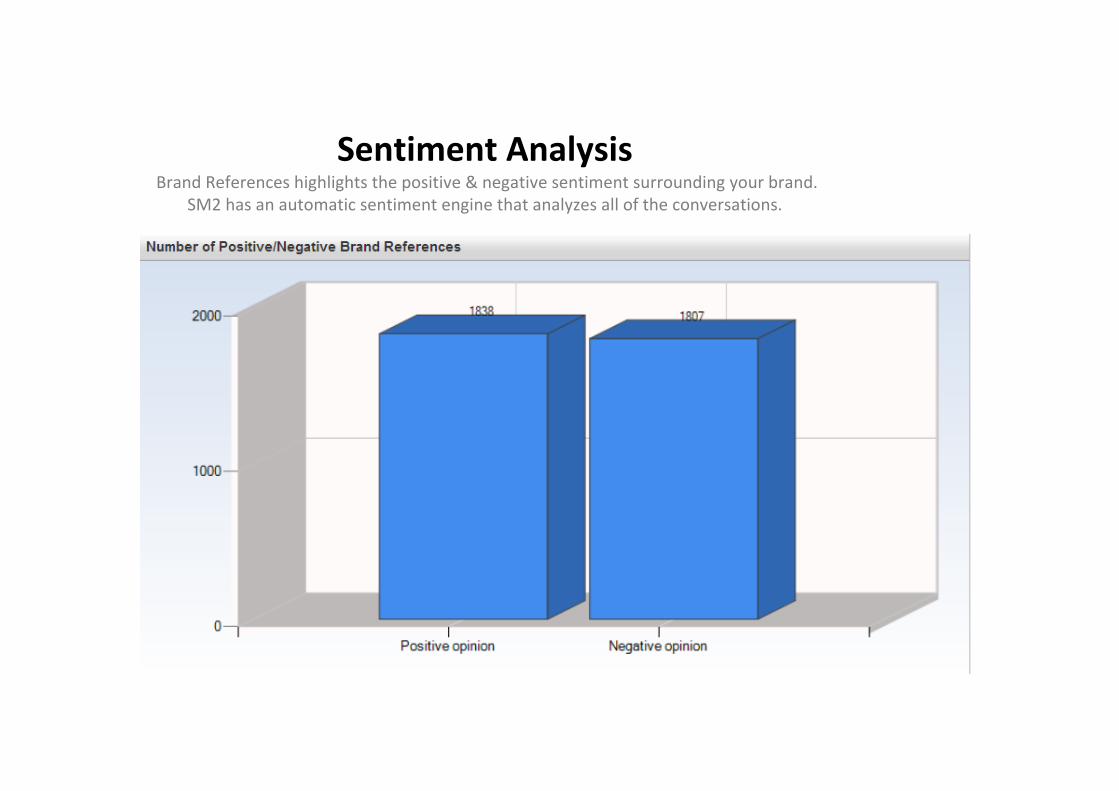
Sentiment AnalysisBrand References highlights the positive & negative sentiment surrounding your brand.
SM2 has an automatic sentiment engine that analyzes all of the conversations.
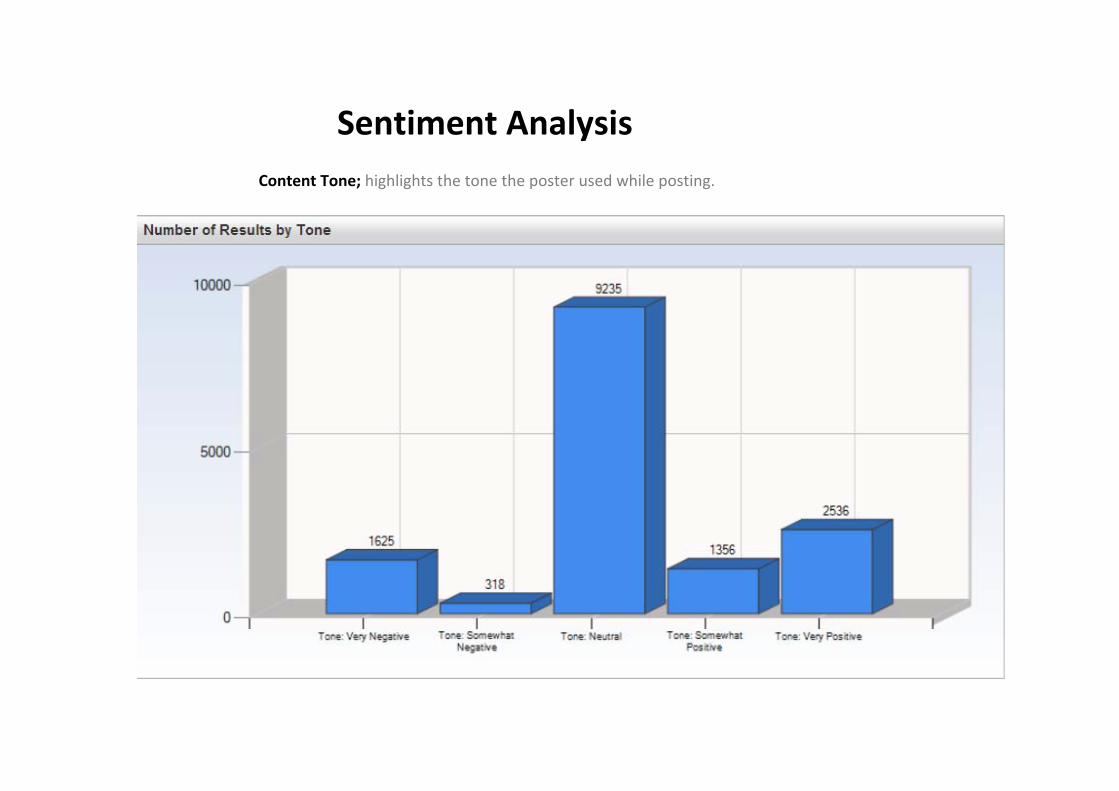
Sentiment AnalysisContent Tone; highlights the tone the poster used while posting.
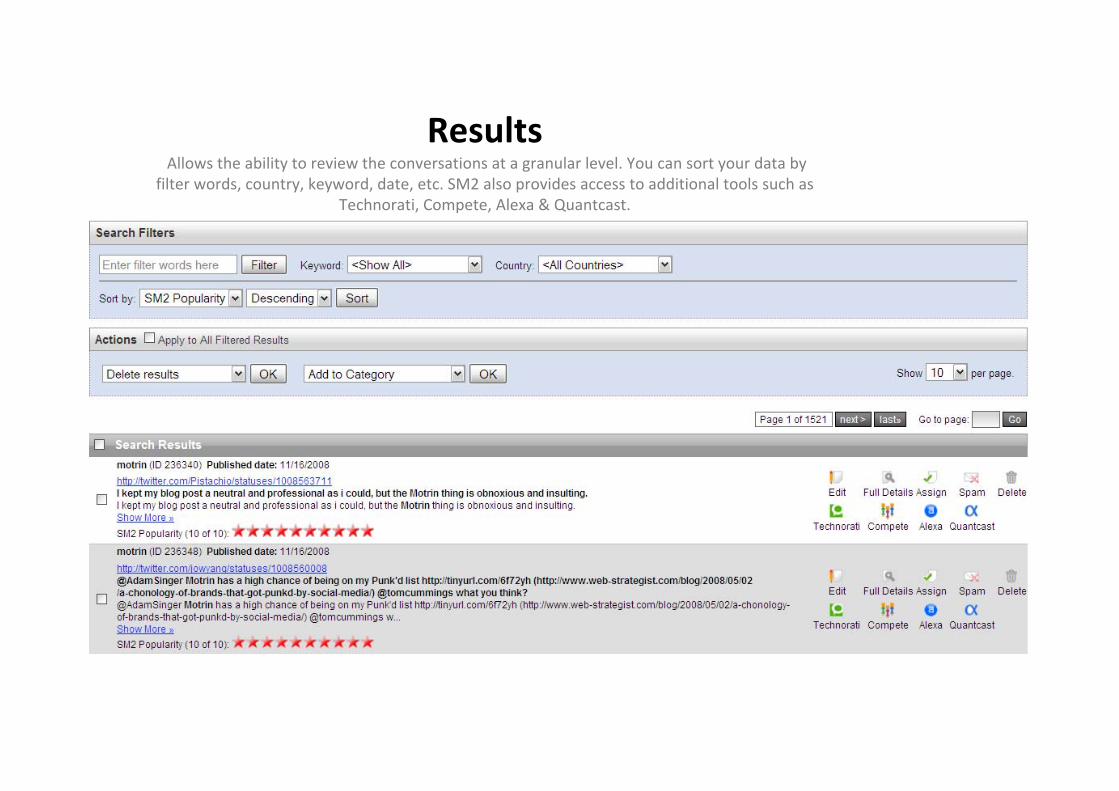
ResultsAllows the ability to review the conversations at a granular level. You can sort your data by
filter words, country, keyword, date, etc. SM2 also provides access to additional tools such as Technorati, Compete, Alexa & Quantcast.
Value addition…
• BuzzWatch provides information across thirty five fields for EACH search result. Note that all tables & data are exportable.
• Brands and communications agencies can leverage social media monitoring for the following business objectives:
1. Brand Audits & General Listening
2. Corporate Marketing & Brand Building
3. Social Media Campaigns
4. Customer Service & Support
5. Lead Generation
6. New Markets and Product Development
7. Public Relations & Crisis Management
8. Search Engine Optimization
9. Industry / Competitive Insight
10. Human Resources
Online engagement
• Time spent• Traffic • Activities• Interaction• Awareness, consideration, intent, loyalty• Driving business growth
• Seekers – passive, active• Creators – passive, active
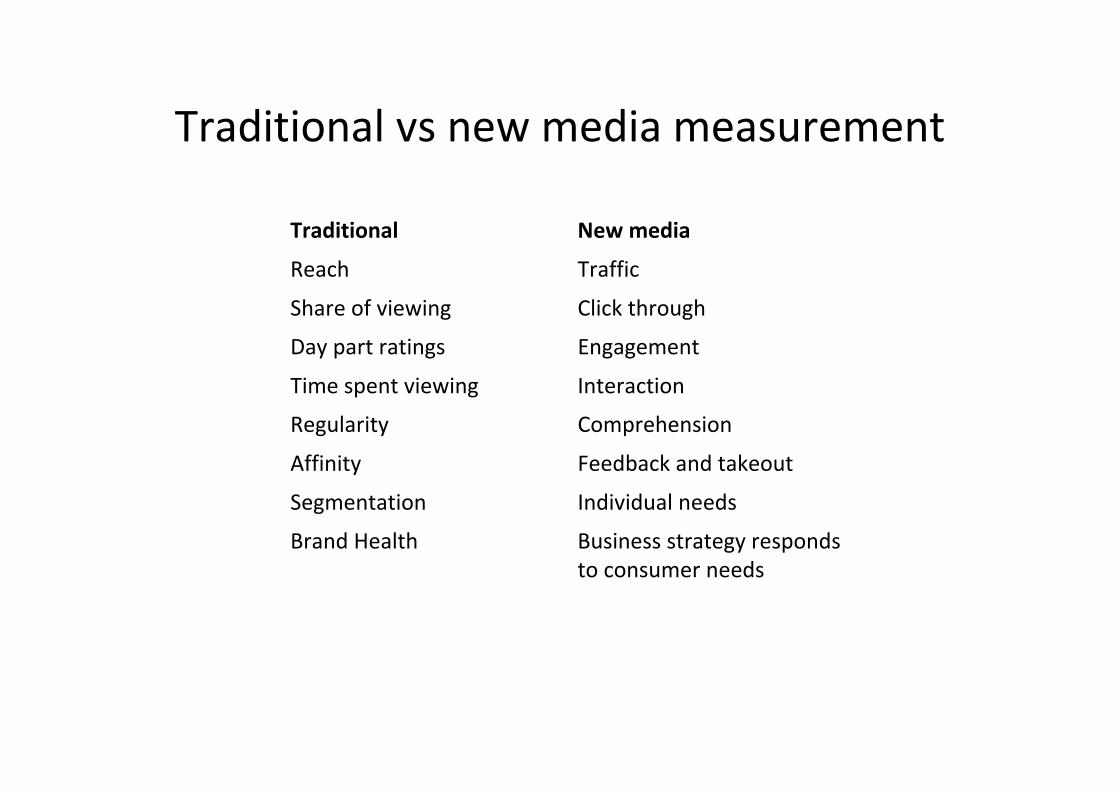
Traditional vs new media measurement
Traditional New media
Reach Traffic
Share of viewing Click through
Day part ratings Engagement
Time spent viewing Interaction
Regularity Comprehension
Affinity Feedback and takeout
Segmentation Individual needs
Brand Health Business strategy responds to consumer needs