Embed Size (px)
Citation preview
WORKING PAPERS
Working Paper No 2011-08 January 2011
Measuring and validating social cohesion:
a bottom-up approach
Sylvain ACKETMonique BORSENBERGER
Paul DICKESFrancesco SARRACINO
CEPS/INSTEAD Working Papers are intended to make research findings available and stimulate comments and discussion. They have been approved for circulation but are to be considered preliminary. They have not been edited and have not
been subject to any peer review.
The views expressed in this paper are those of the author(s) and do not necessarily reflect views of CEPS/INSTEAD. Errors and omissions are the sole responsibility of the author(s).
L’European Values Study (EVS) est une enquête réalisée au Luxembourg en 2008 auprès d’un échantillon représentatif de la population résidante composé de 1610 individus âgés de 18 ans ou plus.
Au niveau national, cette enquête fait partie du projet de recherche VALCOS (Valeurs et Cohésion sociale), cofinancé par le FNR dans le cadre du programme VIVRE. Au niveau international, elle est partie intégrante d’une enquête réalisée dans 45 pays européens qui a pour objectif d’identi-fier et d’expliquer en Europe les dynamiques de changements de valeurs, et d’explorer les valeurs morales et sociales qui sous-tendent les institu-tions sociales et politiques européennes (www.europeanvaluesstudy.eu).
Plus d’infos : http://valcos.ceps.lu.

1
Measuring and validating social cohesion:
a bottom-up approach1
Sylvain Acket
Monique Borsenberger
Paul Dickes
Francesco Sarracino2
Population et emploi, CEPS/Instead, Luxembourg
Paper presented at the International Conference on Social Cohesion and Development,
organized by the OECD, Development Center, Paris, 20-21st January 2011.
January 2011
Abstract
The aim of this paper is to provide a synthetic macro index of social cohesion
based on the observation of several individual level variables. Based on the de-
finition of social cohesion by Bernard (1999) and Chan et al. (2006) an index of
social cohesion (henceforth VALCOS Index) was created. It covers the political
and sociocultural domains of life in their formal and substantial relations. Re-
sults suggest that the VALCOS-Index of social cohesion is strongly and signifi-
cantly correlated with other macro indicators largely used by the scientific
community. The aggregation of EVS 2008 data on social cohesion together with
many macro indicators of several dimensions of social life (including economic,
socio-demographic, health and subjective well-being indicators) allowed us to
rank social cohesion across 39 European countries and to explore differences
across groups of countries. Subsequently, we validated our index by correlating
it with many national level variables.
Keywords: social cohesion, methodology, macro index, micro index, EVS.
JEL classification codes: A1, D6, I3, Z13.
1 This research is part of the VALCOS project supported by the Luxembourg “Fonds National de la Recherche” (con-
tract FNR/VIVRE/06/01/09) and by core funding for CEPS/INSTEAD from the Ministry of Higher Education and
Research of Luxembourg. 2 Francesco SARRACINO is supported by an AFR Grant (contract PDR-09-075) from the Luxembourg “Fonds Na-
tional de la Recherche” cofunded under the Marie Curie Actions of the European Commission (FP7-COFUND).
2
1. Introduction
During last twenty years the topic of social cohesion almost disappeared from the po-
litical, economic and academic debate. Nonetheless, the fabric of more modern and
richer societies, including European countries, are facing new challenges posed by
the recent economic and social development.
Media recall our attention on episodes of violence, segregation and isolation.
Such episodes spread in every domain of modern lives: from labour market to famili-
ar relationships, from religion to cultural identity. Many European citizens perceive
themselves less safe than in the past and more worried about their future. The violent
episodes affecting the banlieues in Paris are still in everybody’s mind; last European
elections in Italy confirm that a growing part of Italian people fears the migration
process and asks for more safety; the even more frequent events of racism and xeno-
phobia happening in many European countries as well as the growing separatist pres-
sures involving countries such as Italy, Spain and Belgium are all signals of an evi-
dent breaking of social ties.
The aim of present work is to provide a synthetic macro index of social cohe-
sion based on the observation of several individual level variables.
Based on the definition of social cohesion by Bernard (1999) and Chan et
al. (2006) an index of social cohesion (henceforth VALCOS3 index) was created. It
covers the political and socio-cultural domains of life in their formal and substantial
relations. The VALCOS Index was elaborated for 33 European countries belonging
to the 1999 EVS study from micro-socio-economic data using Multidimensional
Scaling (MDS) and Confirmatory Factor Analysis (CFA) (Dickes et al. 2009). As-
sessment of the VALCOS Index on the 39 European countries belonging to the 2008
EVS survey was done by (Dickes, 2010).
Starting from the micro based index of social cohesion as proposed by Dickes
et al. (2009, 2010) and using the European Values Study data-base, we first define a
national level index of social cohesion and compare it across European countries. Se-
condly, we correlate our index with several national level variables concerning
people’s well-being, economic growth, education, health, demographic characteristic,
3 VALCOS (VALeurs et COhésion Sociale) is a research project conducted in Luxembourg by CEPS/INSTEAD with
the financial support of the National Research Fund (FNR). Further information on: http://valcos.ceps.lu/.
3
job market and conditions. In so doing we show that it is possible to aggregate in a
meaningful and reliable way an individual based index of social cohesion. At the
same time, these correlations will serve construct validation’s purposes.
Such a research can be relevant both from a policy point of view as well as
from a theoretical one. In fact, the availability of a reliable micro-based synthetic in-
dex of social cohesion enables an in-depth analysis of its determinants and effects on
many domains of social life starting from the individual level to the national level.
This allows the design of a new set of policy interventions to promote and restore so-
cial cohesion at many different levels eventually extending the range of available
policies. At the same time, it provides a way to easily monitor social cohesion across
nations starting from individual surveys.
The paper is structured as follows. The first section provides a review of
the main theoretical approach to social cohesion and set the theoretical framework on
which the VALCOS Index of social cohesion is based. In the second section we
present the data used. The third part presents the six dimensions of the VALCOS In-
dex. The fourth is an application of our Index to European countries. In the fifth part
we present the main findings assessing the VALCOS Index with a macro level ap-
proach using a selected set of macro indicators including social cohesion indicators
(EUROSTAT and OECD). Finally, we discuss the results and the further develop-
ments of this approach.
2. Social Cohesion
During the last years two main approaches to the study of social cohesion can be
identified (Chan et al., 2006). The first one is a sociological and psychological ap-
proach based on the study of integration and social stability (Berger, 1998; Gough
and Olofsson, 1999). The second one is a policy oriented one as adopted by the Ca-
nadian government, by the European and other international institutions who consid-
er social cohesion as a precondition for economic prosperity.
Based on the analysis of numerous researches on social cohesion available
in the literature, Jenson (1998) elaborates a classification using five dimensions:
1. affiliation/isolation (share of common values, feeling of belonging to a same

4
community); 2. insertion/exclusion (a shared market capacity, particularly regarding
the labour market; in other words, who has/does not have opportunities to participate
in the economy); 3. participation/passivity (involvement in management of public af-
fairs, third sector); 4. acceptance/rejection (pluralism in facts and also as a virtue, i.e.
tolerance regarding differences); 5. legitimacy/illegitimacy (maintenance of public
and privates institutions which act as mediators, i.e. how adequately the various insti-
tutions represent the people and their interests).
Bernard (1999) further develops Jenson’s approach by broadening its di-
mensions and proposing a typology based on two facets. The first one describes the
spheres or domains of human activity (economic, political and socio-cultural). The
second one distinguishes social relations regarding their nature. Social relations per-
tain on one hand to social representations like values or attitudes, named as “formal
relations” by Bernard (1999); on the other hand, they refer to observed behaviours or
practices. Bernard (1999) refers to the last aspect as “substantial relations”.
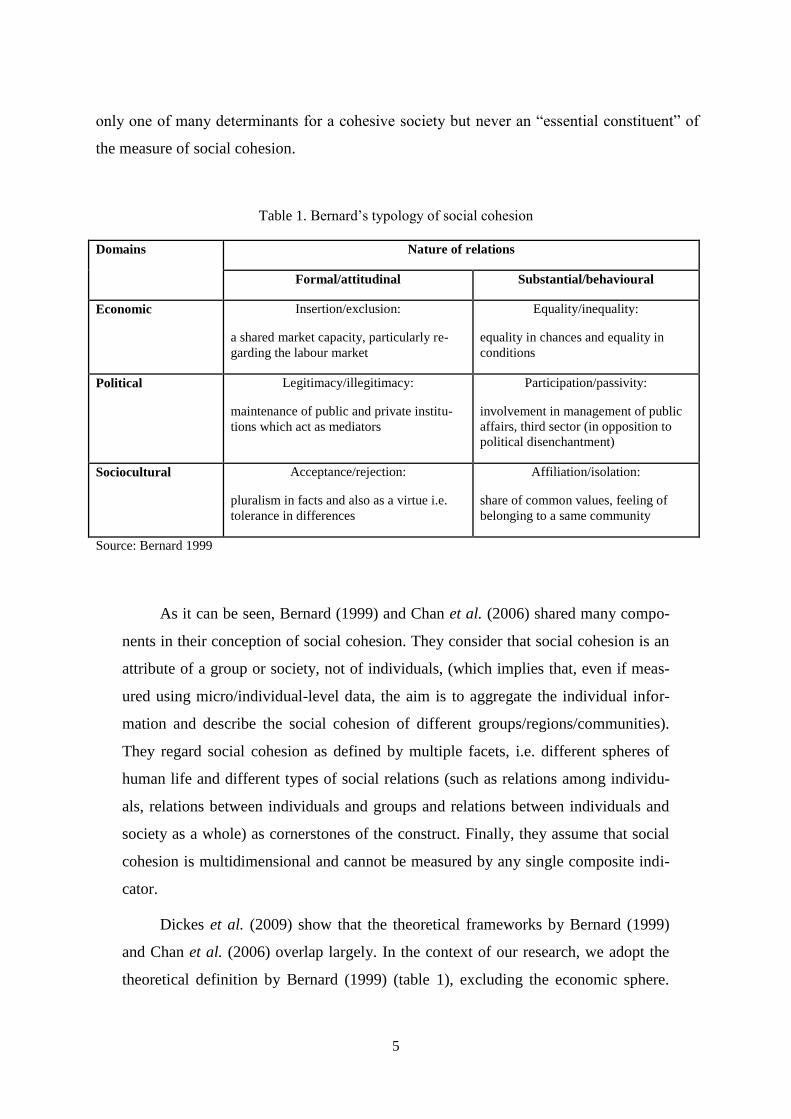
By considering the intersection between activity spheres and social relations,
we get an integrated scheme summarizing Bernard’s definition of social cohesion
(table 1). This scheme contains six components: 1) insertion/exclusion; 2) legiti-
macy/illegitimacy; 3) recognition/ rejection; 4) equality/inequality; 5) participa-
tion/passivity and 6) affiliation/isolation.
Bernard considers social cohesion as a quasi-concept, i.e., a hybrid mental con-
struction proposed by the political game and – at the same time – based on a data
analysis of the situation; such a construction must remain quite undetermined in or-
der to be adaptable to the necessities of political action.
Chan et al. (2006) worked out Bernard’ typology and defined social cohesion as
follow:
“social cohesion is a state of affairs concerning both the vertical and the horizontal inter-
actions among members of a society, as characterized by a set of attitudes and norms that
include trust, a sense of belonging, and the willingness to participate and help, as well as
their behavioural manifestations” (Chan et al. 2006: 290).
They keep the political and sociocultural spheres but exclude the economic one from
their definition of social cohesion. Their main purpose is to leave out all characteristics which
should be considered as explicative factors or determinants of social cohesion, such as equal
opportunities, equality, and social inclusion. In their view, Bernard’s economic dimension is
5
only one of many determinants for a cohesive society but never an “essential constituent” of
the measure of social cohesion.
Table 1. Bernard’s typology of social cohesion
Domains Nature of relations
Formal/attitudinal Substantial/behavioural
Economic Insertion/exclusion:
a shared market capacity, particularly re-
garding the labour market
Equality/inequality:
equality in chances and equality in
conditions
Political Legitimacy/illegitimacy:
maintenance of public and private institu-
tions which act as mediators
Participation/passivity:
involvement in management of public
affairs, third sector (in opposition to
political disenchantment)
Sociocultural Acceptance/rejection:
pluralism in facts and also as a virtue i.e.
tolerance in differences
Affiliation/isolation:
share of common values, feeling of
belonging to a same community
Source: Bernard 1999
As it can be seen, Bernard (1999) and Chan et al. (2006) shared many compo-
nents in their conception of social cohesion. They consider that social cohesion is an
attribute of a group or society, not of individuals, (which implies that, even if meas-
ured using micro/individual-level data, the aim is to aggregate the individual infor-
mation and describe the social cohesion of different groups/regions/communities).
They regard social cohesion as defined by multiple facets, i.e. different spheres of
human life and different types of social relations (such as relations among individu-
als, relations between individuals and groups and relations between individuals and
society as a whole) as cornerstones of the construct. Finally, they assume that social
cohesion is multidimensional and cannot be measured by any single composite indi-
cator.
Dickes et al. (2009) show that the theoretical frameworks by Bernard (1999)
and Chan et al. (2006) overlap largely. In the context of our research, we adopt the
theoretical definition by Bernard (1999) (table 1), excluding the economic sphere.
6
This exclusion is due to the lack of available attitudinal and behavior data in the EVS
survey to measure this sphere.
In a pilot project Dickes et al. (2008) tested the theoretical framework of Ber-
nard’s theory to Luxemburgish 1999 EVS data. Multidimensional scaling and con-
firmatory factor analysis reproduced very well Bernard’s political and socio-cultural
constructs.
The verification process involved two different data-set: the 1999 EVS data on
33 European countries (Dickes et al., 2009) and the 2008 EVS data on 39 available
countries (Dickes, 2010). In both cases, results are consistent: the two dimensional
multi-dimensional scaling solutions fits very well and the facets of Bernard’s theoret-
ical framework give sense to the multi-dimensional space. With confirmatory factor
analysis, a hierarchical structure could be assessed: trust in institutions and solidarity
were dependent from a formal (attitudinal) second order factor and political and so-
ciocultural participations formed a substantial (involvement) second order factor. The
general cohesion factor found by Dickes et al. (2008) was not replicated.
Measurement equivalence was assessed by INDSCAL (Individual Difference
Scaling) for the 1999 (Dickes et al,. 2009) so as the 2008 data sets (Dickes, 2010).
3. Data
Empirical analyses are based on the 2008 European Values Study (EVS) con-
ducted in 39 countries. EVS is a large-scale, cross-national, cross-sectional and re-
peated research program on basic human values. The first wave of the survey was
launched in 1981 in ten European countries. About twenty years later (1999/2000),
the third EVS wave was conducted in almost all European countries. The fourth
wave was launched in 2008. (http://www.europeanvalues.nl/). This data-base con-
tains a great number of subjective and objective items that measure attitudes towards
and behavior regarding social relations, participation, and trust, at many levels of so-
cial reality, as well as in many domains of everyday life, corresponding more or less
to the dimensions of social cohesion covered by the literature. Table A2 in the annex
give an overview of these items.

7
Furthermore, EVS provides also two variables which are commonly used
to proxy subjective well-being of the respondent. The two questions concern happi-
ness and life satisfaction. The first one is measured on a scale ranging from 1 to 4
and is based on answers to the following question: “all considered you would say that
you are: 1. very happy; 2. pretty happy; 3. not too happy; 4. not at all happy?” Life
satisfaction is a variable ranging from 1 = “dissatisfied” to 10 = “satisfied” depend-
ing on the answers to the following question: “all things considered, how satisfied are
you with your life as a whole these days?”
Recent academic as well as public and political debate paid increasing attention
to subjective well-being measures as a way to complement more traditional meas-
urements of well-being. Assuming that a cohesive society reports higher levels of
well-being, we included the two proxies of subjective well-being in our study. Fur-
thermore, we included a composite indicator of well-being based on the sum the two
previous variables. In this way we check the correlation between our macro index of
social cohesion and subjective well-being.
In the present study, we work on representative samples of the adult population
(aged 18 or more) of only 39 European countries4. The available pooled sample con-
sists of 39,919 individuals. The number of observations in each country has been
equated to 1,000 to ensure equal weighting across countries in the analyses. In fact,
weights for correcting social characteristics for each country are not available for the
data at hand. Therefore, the final number of observation in the study is 39,000 (see
table A1 in annex).
Following the method proposed by Dickes et al. (2009), we used available mi-
cro-data to build the VALCOS Index of social cohesion for each of the 39 countries.
Successively, we merged our micro-based data-set with a macro data-set in-
cluding the most common indicators used by international institutions (OECD, Euro-
stat) to measure social, economic and demographic characteristics for 2008. Hence,
our unit of analysis become single countries. The macro data-base contains 66 indica-
tors (Acket, 2010) suited for 1999 and 2008 EVS surveys. For a complete list of the
4 Data on seven countries are not available in the EVS version of August 2010. These countries are: Croatia, Great
Britain, Iceland, Italy, Macedonia, Norway, Sweden and Turkey.

8
observed variables and relative sources please refer to the first three columns of table
A4 in the Annex.
4. Results
4.1 Bottom-up approach for assessing VALCOS-Index
The first step in transforming micro-data to macro social cohesion variables be-
gins by summing up the standardized raw intermediate individual variables, divided
by the number of variables belonging to the construct (table 2). Justification of this
process was found in INDSCAL analysis (Dickes, 2010) and the congruence of in-
ternal consistencies has been assessed for each country (see table A3 in annex).
Table 2. Sum of standardized raw intermediate variables and internal consistency
for individual social cohesion scores (N=39000)
Individual social cohesion
scores
formula alpha
Trust(Z) (ZVAI01+ ZVAI02+ ZVAI03+ ZVAI04)/4 0.823
Solidarity(Z) (ZVAI05 +ZVAI06)/2 0.673
Political Participation(Z) (ZVAI07+ ZVAI08+ ZVAI09)/3 0.529
Sociocultural Participation(Z) (ZVAI10 +ZVAI11+ ZVAI12+ ZVAI13)/4 0.684
Formal(Z) (ZVA01+ZVA02+ZVA03+ ZVAI04 +ZVAI05 +ZVAI06)/6 0.713
Substantial(Z) (ZVAI07+ ZVAI08+ ZVAI09+ ZVAI10 +ZVAI11+ ZVAI12+ ZVAI13)/7 0.635
Source : Dickes, 2010
Z=standardized
In a second step the individual social cohesion scores are linearly standar-
dized. This individual standardized cohesion scores provides comparable norms for
all the 39000 respondents. Statistical characteristics of the scores are reproduced in
table 3.
Table 3. Statistical characteristics of the individual standardized social cohesion scores (N=39000)
Z-Trust in
institution
Z-Solidarity Z-Political
Participation
Z-
Sociocultural
Participation
Z-Formal Z-Substantial
Mean 0.000 0.000 0.000 0.000 0.000 0.000
sd 1.000 1.000 1.000 1.000 1.000 1.000
Minimum -2.804 -2.955 -1.462 -0.464 -3.690 -1.142
Maximum 3.005 2.275 3.878 10.260 3.552 9.232
Quartiles 25 -0.672 -0.609 -0.723 -0.464 -0.663 -0.656
50 0.006 0.003 -0.144 -0.464 -0.004 -0.251
75 0.675 0.690 0.629 0.078 0.656 0.399
Source : Dickes 2010
9
Finally we created the VALCOS Index for each country by aggregating the
standardized social cohesion mean scores and merging them with the 66 indicators of
the macro data-base.
4.2 VALCOS Index and five European countries groups
In order to facilitate the reading of the statistical figures countries have been
grouped into 5 categories following the organization of the Atlas of European Values
(Halman et al., 2005). Variance analysis (table 4) confirms the reliability of the five
categories grouping.
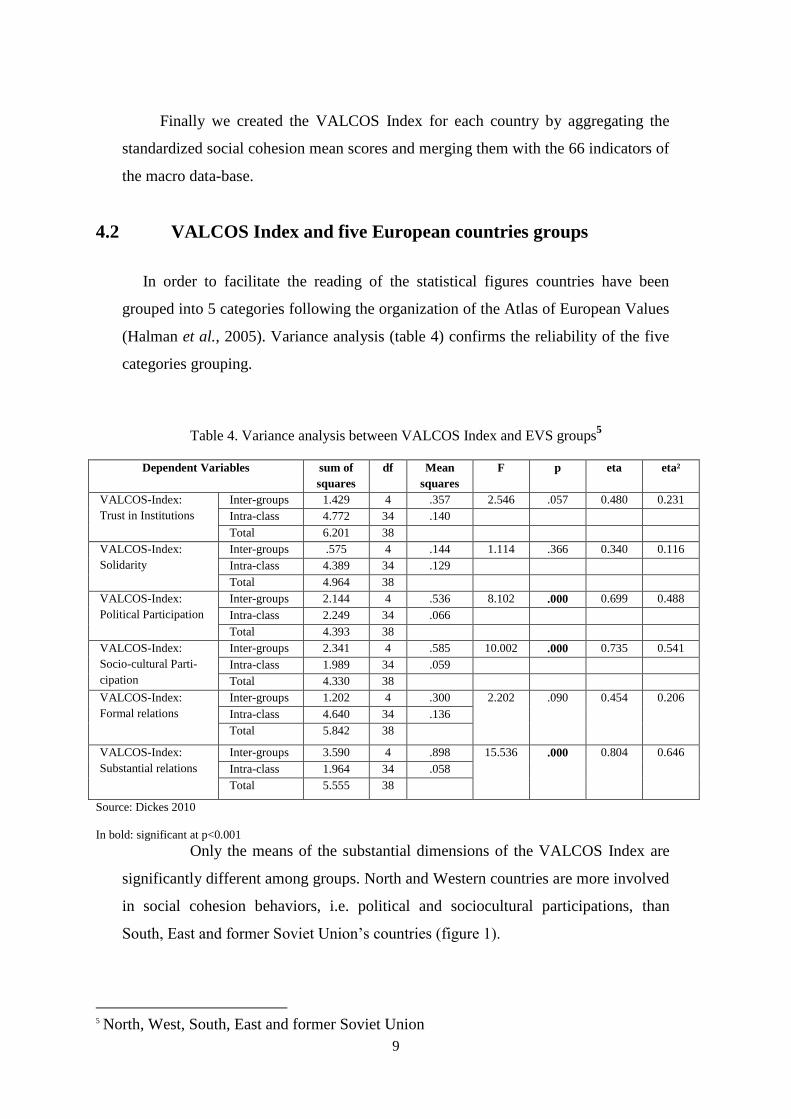
Table 4. Variance analysis between VALCOS Index and EVS groups5
Dependent Variables sum of
squares
df Mean
squares
F p eta eta²
VALCOS-Index:
Trust in Institutions
Inter-groups 1.429 4 .357 2.546 .057 0.480 0.231
Intra-class 4.772 34 .140
Total 6.201 38
VALCOS-Index:
Solidarity
Inter-groups .575 4 .144 1.114 .366 0.340 0.116
Intra-class 4.389 34 .129
Total 4.964 38
VALCOS-Index:
Political Participation
Inter-groups 2.144 4 .536 8.102 .000 0.699 0.488
Intra-class 2.249 34 .066
Total 4.393 38
VALCOS-Index:
Socio-cultural Parti-
cipation
Inter-groups 2.341 4 .585 10.002 .000 0.735 0.541
Intra-class 1.989 34 .059
Total 4.330 38
VALCOS-Index:
Formal relations
Inter-groups 1.202 4 .300 2.202 .090 0.454 0.206
Intra-class 4.640 34 .136
Total 5.842 38 VALCOS-Index:
Substantial relations
Inter-groups 3.590 4 .898 15.536 .000 0.804 0.646
Intra-class 1.964 34 .058
Total 5.555 38 Source: Dickes 2010
In bold: significant at p<0.001
Only the means of the substantial dimensions of the VALCOS Index are
significantly different among groups. North and Western countries are more involved
in social cohesion behaviors, i.e. political and sociocultural participations, than
South, East and former Soviet Union’s countries (figure 1).
5 North, West, South, East and former Soviet Union

10
Figure 1. EVS groups and the substantial dimension of the VALCOS Index
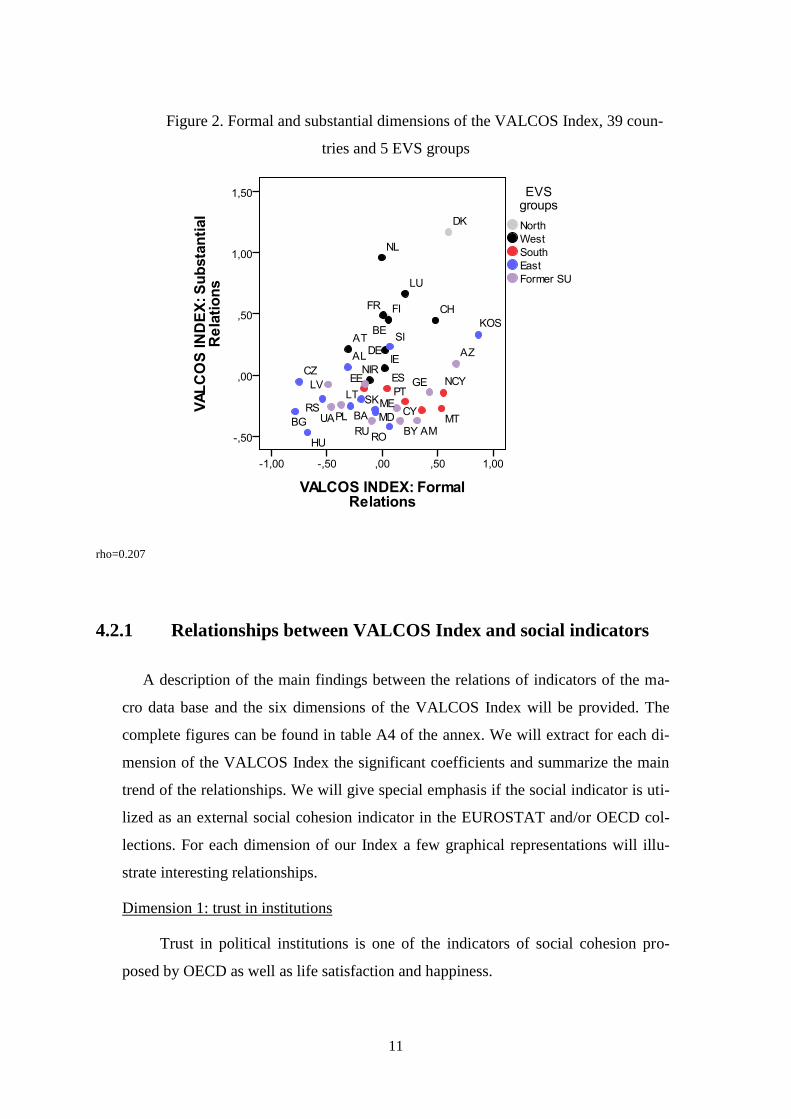
Joint relationship of EVS groups and formal and substantial relations (fig-
ure 2) provide information about the ranking of these VALCOS Indexes. North and
West countries reflect high involvement scores, the North scoring better than the
West. South, East and Former Soviet Union countries report weak participation in
political and socio-cultural associations.
South, East and former Soviet Union countries are characterized by low
substantial relations. North and West countries are middle ranked as far as formal re-
lations are concerned. Nonetheless, they perform much better when substantial rela-
tions are concerned.
11
Figure 2. Formal and substantial dimensions of the VALCOS Index, 39 coun-
tries and 5 EVS groups
rho=0.207
4.2.1 Relationships between VALCOS Index and social indicators
A description of the main findings between the relations of indicators of the ma-
cro data base and the six dimensions of the VALCOS Index will be provided. The
complete figures can be found in table A4 of the annex. We will extract for each di-
mension of the VALCOS Index the significant coefficients and summarize the main
trend of the relationships. We will give special emphasis if the social indicator is uti-
lized as an external social cohesion indicator in the EUROSTAT and/or OECD col-
lections. For each dimension of our Index a few graphical representations will illu-
strate interesting relationships.
Dimension 1: trust in institutions
Trust in political institutions is one of the indicators of social cohesion pro-
posed by OECD as well as life satisfaction and happiness.

12
Table 5. Social Indicators and the dimension of trust in institutions of the VALCOS Index
negative relation positive relation
variable rho CS variable rho CS
var027 People killed in road accidents -.60** var048 Level of Internet access .76**
var017 HICP -,50* var050 Income per capita .69**
var036 Country superficy -.46* var019 Minimum wages .68**
var008 Part-time employment .61**
var012 GDP per inhabitant .60**
var052 Immigration rate .59**
var049 Cinema attendance .58**
var051 Emigration rate .58**
var011 Unionization rate .57*
var057 Vote in European elections .55**
var032 Lifelong learning .54**
happy_mean1 .52** oecd
var046 Air pollution .50*
var053 Type of state .48*
var038 Crude birth rate .46*
var042 Life expectancy at age 65 .45*
var063 Employment rate of young people .45*
SWB2_mean .44**
var039 Fertility rate .44*
var041 Life expectancy at birth .44*
var047 Motorization rate .43*
lifesat_mean .40* oecd
Rho: Spearman rank coefficient; CS: external social cohesion indicator
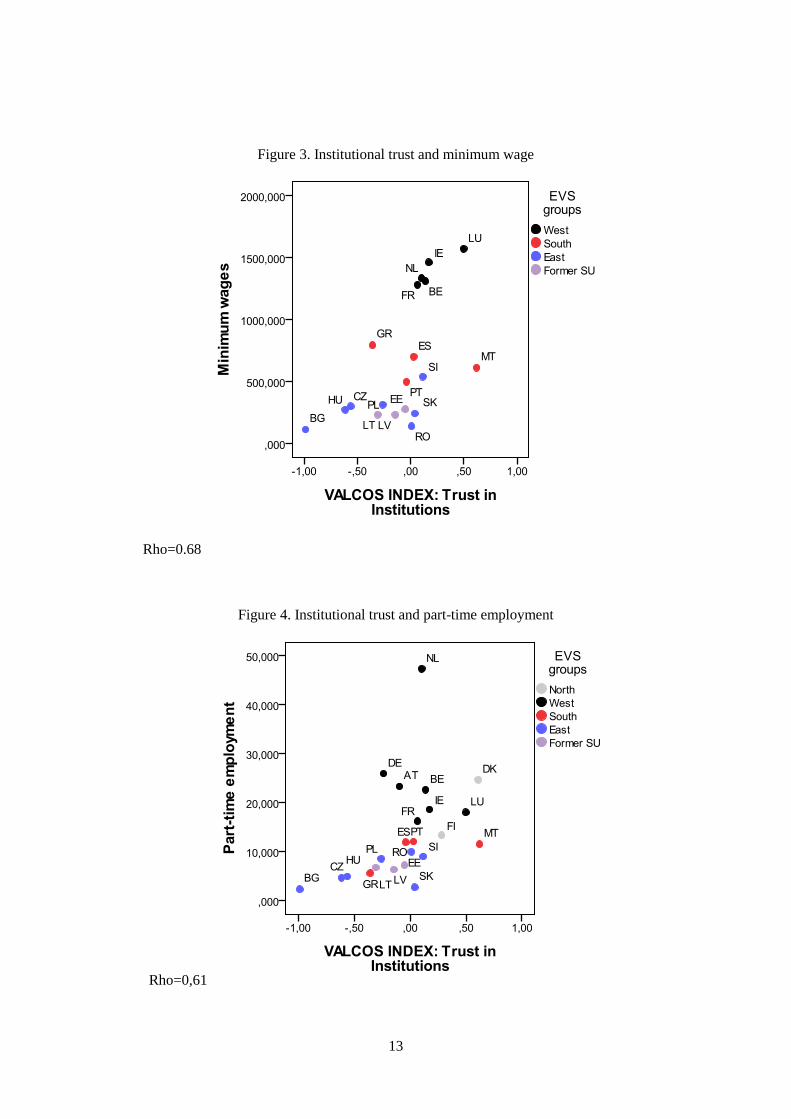
The three main clusters of relationships between the dimension of trust in
institution of the VALCOS Index and the set of macro variables are:
1. GDP or GDP related measures (like income per capita, immigration
and emigration rates, minimum wages) which are highly correlated;
2. Employment variables like employment of young people, life-long
learning, part-time employment and level of internet assessment
which are moderately correlated;
3. Life satisfaction and happiness which are moderately correlated.
13
Figure 3. Institutional trust and minimum wage
Rho=0.68
Figure 4. Institutional trust and part-time employment
Rho=0,61
14
Dimension 2: solidarity
Table 6. Macro-variables and the solidarity dimension of the VALCOS Index
negative relationship positive relationship
variable rho CS variable rho CS
var025 Suicides -.61** oecd var024 Health expenditure .55*
var004 Long-term unemployment rate .45*
var033 Number of inhabitants .45*
var029 Early leavers from education .43* Eurostat
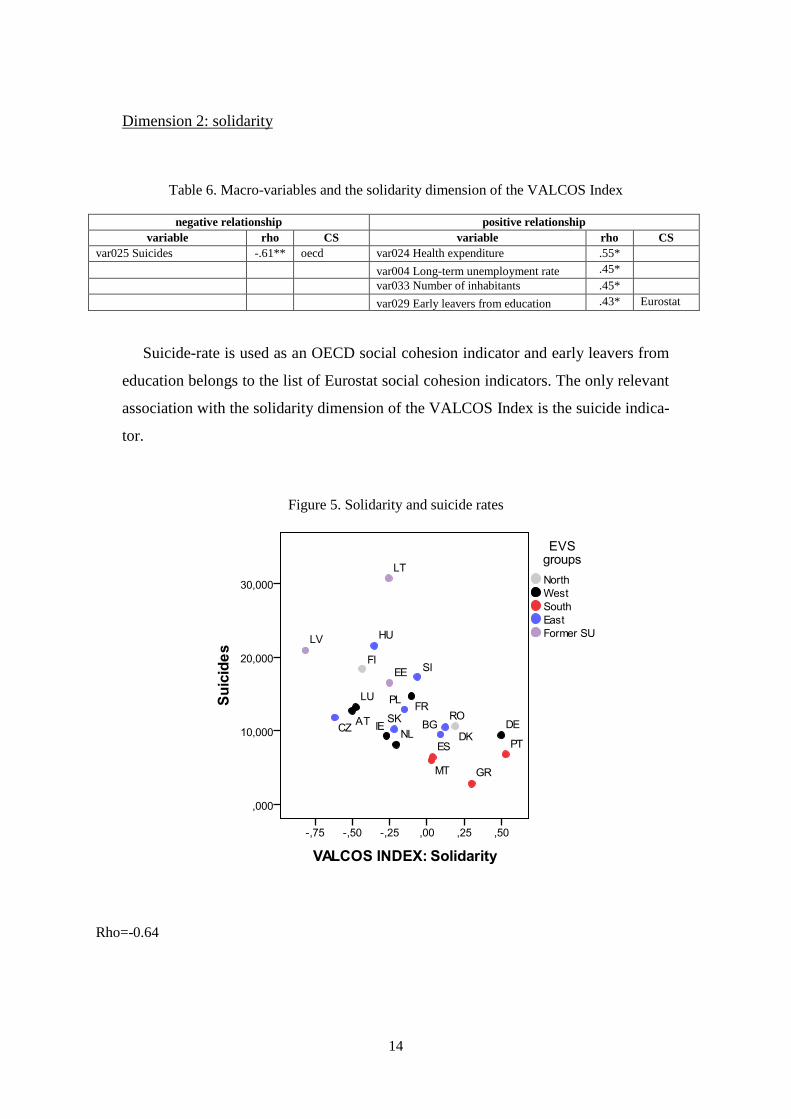
Suicide-rate is used as an OECD social cohesion indicator and early leavers from
education belongs to the list of Eurostat social cohesion indicators. The only relevant
association with the solidarity dimension of the VALCOS Index is the suicide indica-
tor.
Figure 5. Solidarity and suicide rates
Rho=-0.64

15
Dimension 3: political participation
Table 7. Macro-variables and the dimension of political participation of the VALCOS Index
negative relation positive relation
variable rho SC-
indicator
variable rho SC-
indicator
var059 Legal abortions -.71** var050 Income per capita .85**
var017 HICP -.69** var019 Minimum wages .84**
var043 Infant mortality -.59** var042 Life expectancy at age 65 .83**
var018 Recreational and cultural services HICP -.58** var012 GDP per inhabitant .80**
var027 People killed in road accidents -.54** var008 Part-time employment .78**
var002 Jobless households -.40* eurostat var041 Life expectancy at birth .78**
var014 Social protection expenditure .77**
var048 Level of Internet access .76**
var032 Lifelong learning .69**
var049 Cinema attendance .68**
var047 Motorization rate .65**
var051 Emigration rate .61**
var024 Health expenditure .60*
var035 Urbanization rate .58**
var057 Vote in European elections .58** oecd
var039 Fertility rate .56**
var052 Immigration rate .56**
var061 Women in Parliament .56**
happy_mean1 .53** oecd
var001 Employment rate .51*
SWB2_mean .50**
var063 Employment rate of young
people
.48
var046 Air pollution .46*
var053 Type of state .46*
lifesat_mean .45** oecd
var062 Employment rate of women .43*
Political participation is correlated with only one Eurostat social cohesion indicator:
jobless households and three OECD social cohesion-indicators: voting participation,
happiness and life satisfaction.
When considering the political participation dimension of the VALCOS Index,
we identified four main areas of relationships. These are:
1. A strong and significant correlation with GDP or GDP related meas-
ures (income per capita, minimum wages, so as immigration and emi-
gration rates);

16
2. High and significant correlations with health related variables such as:
life expectancies, social protection and health expenditure, legal abor-
tions, infant mortality, people killed in road accidents;
3. Strong correlation with part-time employment and lifelong learning;
4. Life satisfaction and happiness with moderate significant correlations.
Figure 6. Political participation and Income per capita
Rho=0.85

17
Figure 7. Political participation and life expectancy at age 65
Rho=0.83
Figure 8. Political participation and life-long learning
18
Rho=69
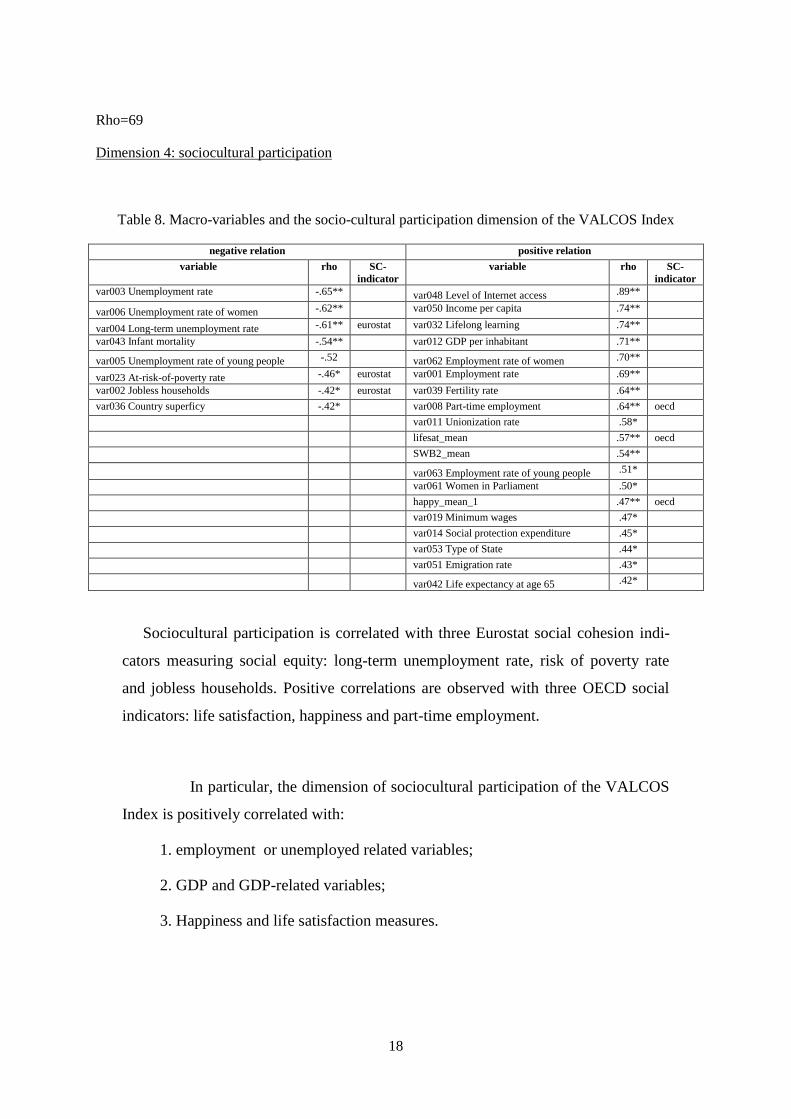
Dimension 4: sociocultural participation
Table 8. Macro-variables and the socio-cultural participation dimension of the VALCOS Index
negative relation positive relation
variable rho SC-
indicator
variable rho SC-
indicator
var003 Unemployment rate -.65** var048 Level of Internet access .89**
var006 Unemployment rate of women -.62** var050 Income per capita .74**
var004 Long-term unemployment rate -.61** eurostat var032 Lifelong learning .74**
var043 Infant mortality -.54** var012 GDP per inhabitant .71**
var005 Unemployment rate of young people -.52 var062 Employment rate of women .70**
var023 At-risk-of-poverty rate -.46* eurostat var001 Employment rate .69**
var002 Jobless households -.42* eurostat var039 Fertility rate .64**
var036 Country superficy -.42* var008 Part-time employment .64** oecd
var011 Unionization rate .58*
lifesat_mean .57** oecd
SWB2_mean .54**
var063 Employment rate of young people .51*
var061 Women in Parliament .50*
happy_mean_1 .47** oecd
var019 Minimum wages .47*
var014 Social protection expenditure .45*
var053 Type of State .44*
var051 Emigration rate .43*
var042 Life expectancy at age 65 .42*
Sociocultural participation is correlated with three Eurostat social cohesion indi-
cators measuring social equity: long-term unemployment rate, risk of poverty rate
and jobless households. Positive correlations are observed with three OECD social
indicators: life satisfaction, happiness and part-time employment.
In particular, the dimension of sociocultural participation of the VALCOS
Index is positively correlated with:
1. employment or unemployed related variables;
2. GDP and GDP-related variables;
3. Happiness and life satisfaction measures.
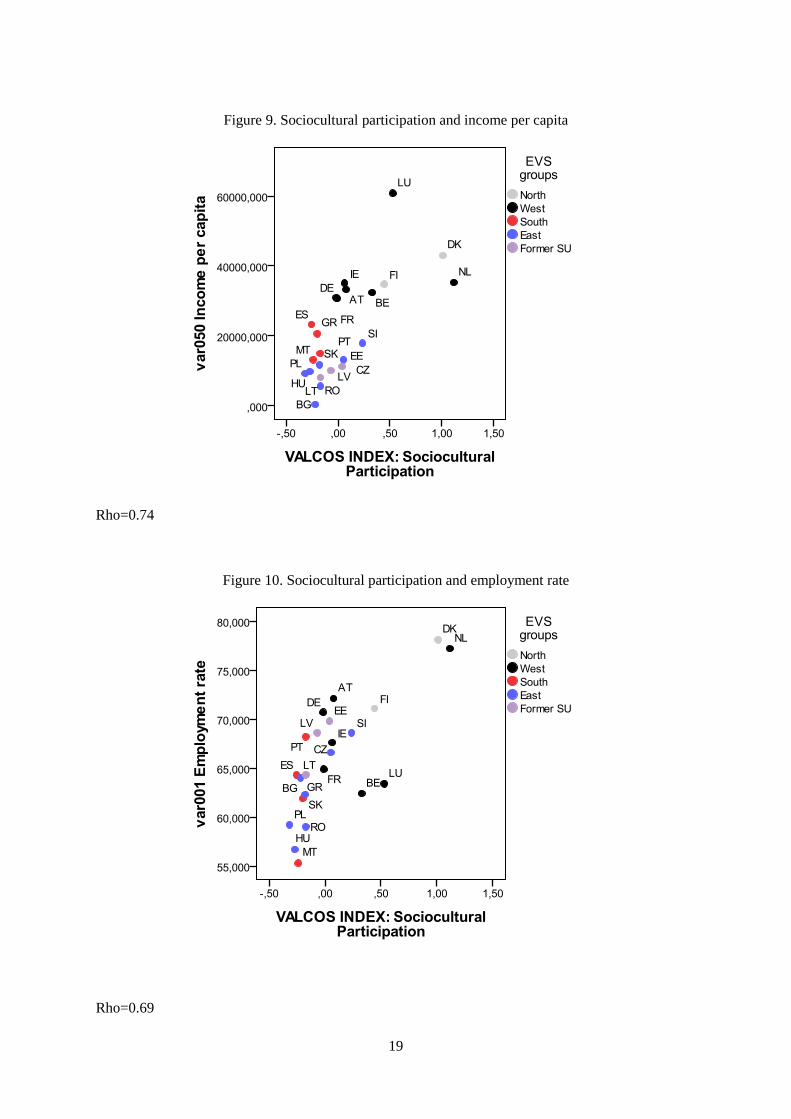
19
Figure 9. Sociocultural participation and income per capita
Rho=0.74
Figure 10. Sociocultural participation and employment rate
Rho=0.69
20
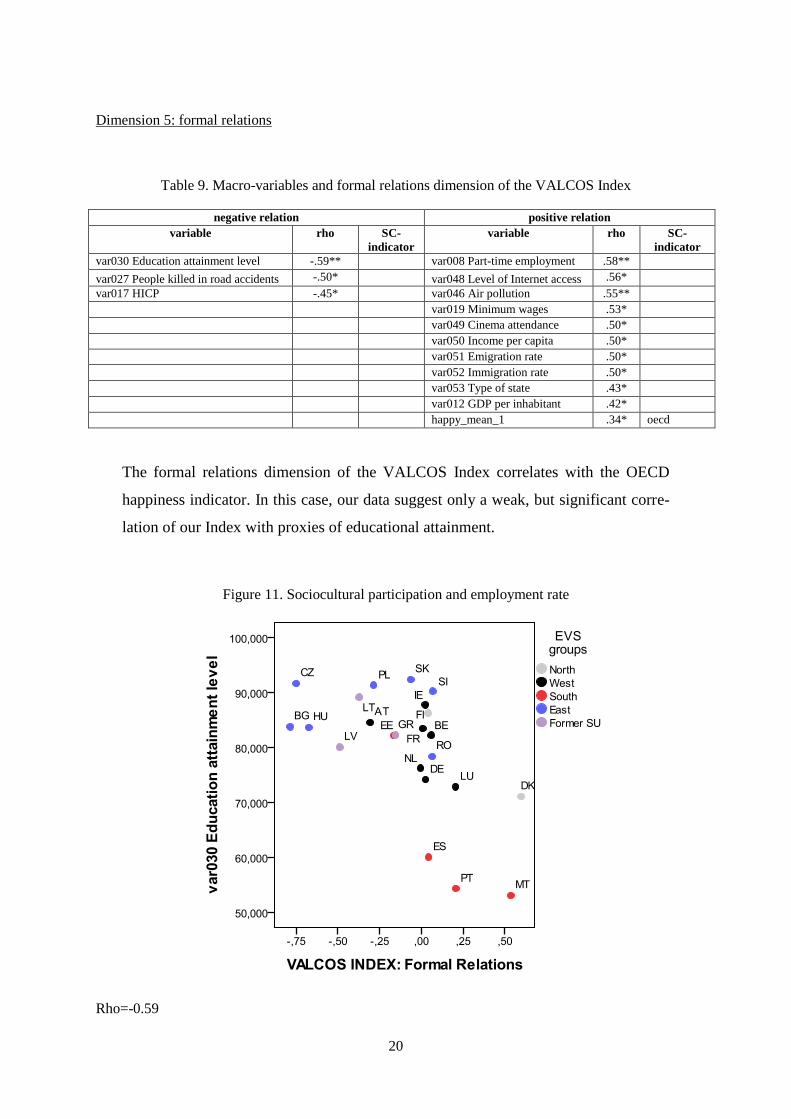
Dimension 5: formal relations
Table 9. Macro-variables and formal relations dimension of the VALCOS Index
negative relation positive relation
variable rho SC-
indicator
variable rho SC-
indicator
var030 Education attainment level -.59** var008 Part-time employment .58**
var027 People killed in road accidents -.50* var048 Level of Internet access .56*
var017 HICP -.45* var046 Air pollution .55**
var019 Minimum wages .53*
var049 Cinema attendance .50*
var050 Income per capita .50*
var051 Emigration rate .50*
var052 Immigration rate .50*
var053 Type of state .43*
var012 GDP per inhabitant .42*
happy_mean_1 .34* oecd
The formal relations dimension of the VALCOS Index correlates with the OECD
happiness indicator. In this case, our data suggest only a weak, but significant corre-
lation of our Index with proxies of educational attainment.
Figure 11. Sociocultural participation and employment rate
Rho=-0.59
21
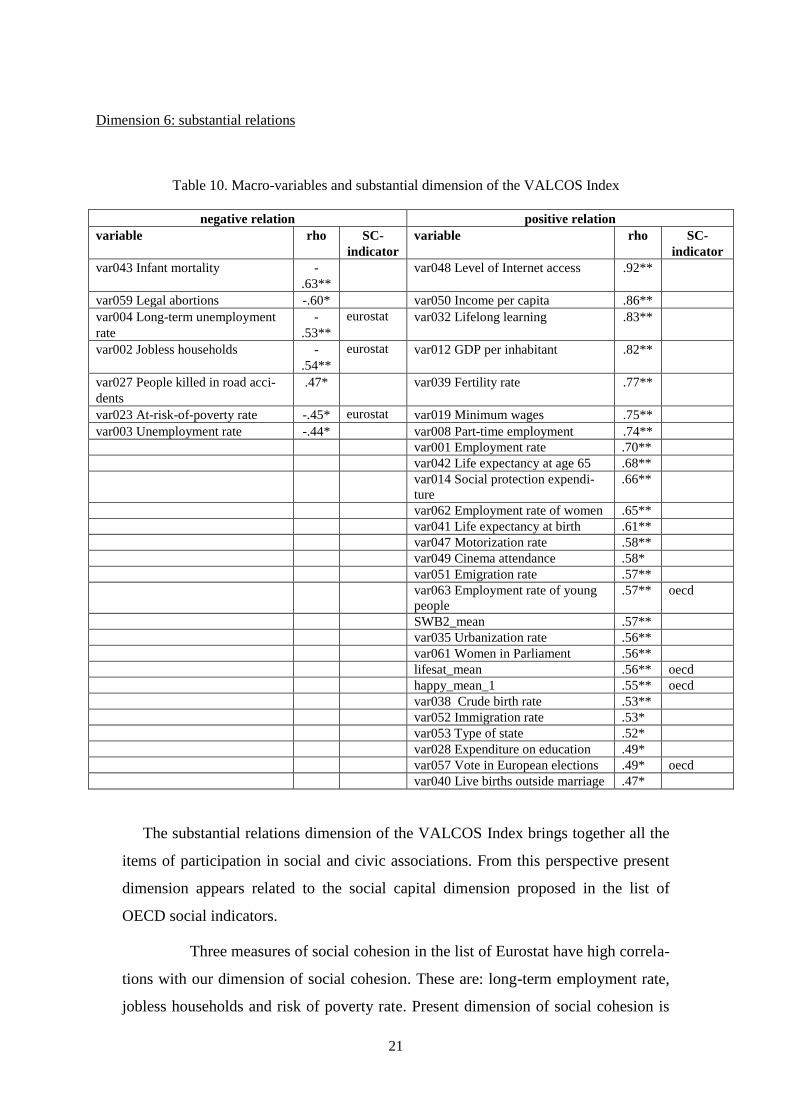
Dimension 6: substantial relations
Table 10. Macro-variables and substantial dimension of the VALCOS Index
negative relation positive relation
variable rho SC-
indicator
variable rho SC-
indicator
var043 Infant mortality -
.63**
var048 Level of Internet access .92**
var059 Legal abortions -.60* var050 Income per capita .86**
var004 Long-term unemployment
rate
-
.53**
eurostat var032 Lifelong learning .83**
var002 Jobless households -
.54**
eurostat var012 GDP per inhabitant .82**
var027 People killed in road acci-
dents
.47* var039 Fertility rate .77**
var023 At-risk-of-poverty rate -.45* eurostat var019 Minimum wages .75**
var003 Unemployment rate -.44* var008 Part-time employment .74**
var001 Employment rate .70**
var042 Life expectancy at age 65 .68**
var014 Social protection expendi-
ture
.66**
var062 Employment rate of women .65**
var041 Life expectancy at birth .61**
var047 Motorization rate .58**
var049 Cinema attendance .58*
var051 Emigration rate .57**
var063 Employment rate of young
people
.57** oecd
SWB2_mean .57**
var035 Urbanization rate .56**
var061 Women in Parliament .56**
lifesat_mean .56** oecd
happy_mean_1 .55** oecd
var038 Crude birth rate .53**
var052 Immigration rate .53*
var053 Type of state .52*
var028 Expenditure on education .49*
var057 Vote in European elections .49* oecd
var040 Live births outside marriage .47*
The substantial relations dimension of the VALCOS Index brings together all the
items of participation in social and civic associations. From this perspective present
dimension appears related to the social capital dimension proposed in the list of
OECD social indicators.
Three measures of social cohesion in the list of Eurostat have high correla-
tions with our dimension of social cohesion. These are: long-term employment rate,
jobless households and risk of poverty rate. Present dimension of social cohesion is
22
also correlated with four OECD social cohesion indicators: employment rate of
young people, life satisfaction and happiness, as well as voting participation.
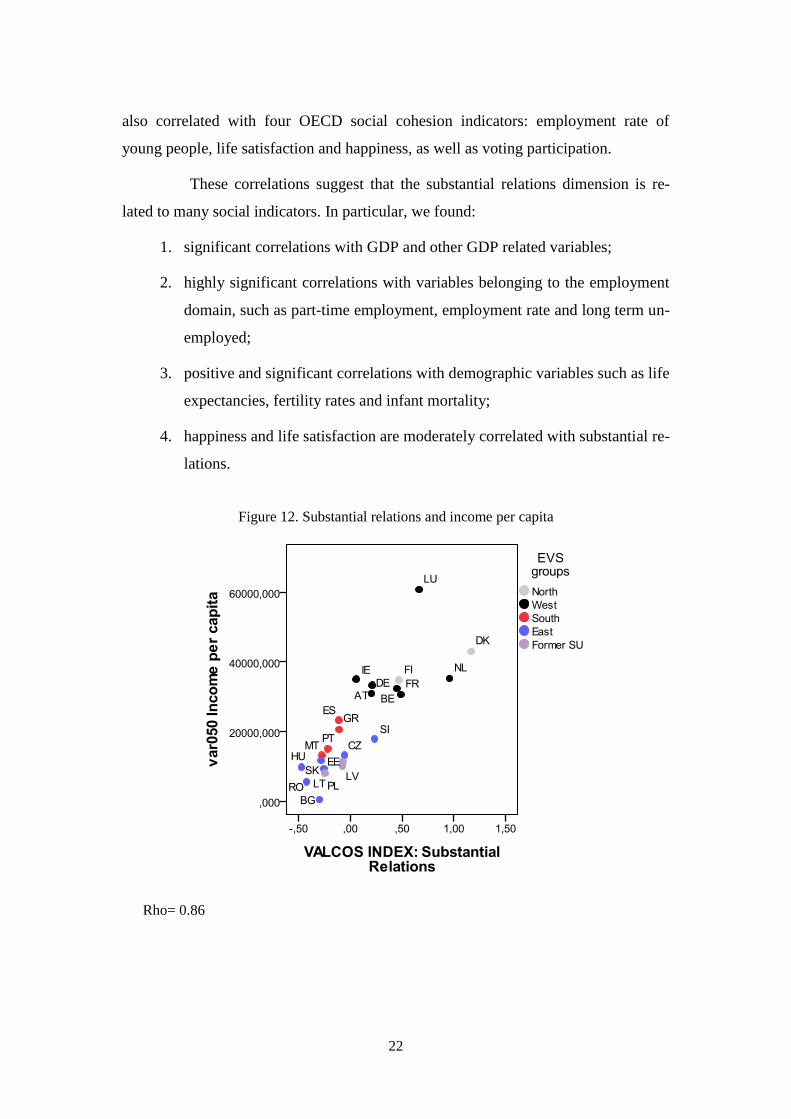
These correlations suggest that the substantial relations dimension is re-
lated to many social indicators. In particular, we found:
1. significant correlations with GDP and other GDP related variables;
2. highly significant correlations with variables belonging to the employment
domain, such as part-time employment, employment rate and long term un-
employed;
3. positive and significant correlations with demographic variables such as life
expectancies, fertility rates and infant mortality;
4. happiness and life satisfaction are moderately correlated with substantial re-
lations.
Figure 12. Substantial relations and income per capita
Rho= 0.86
23
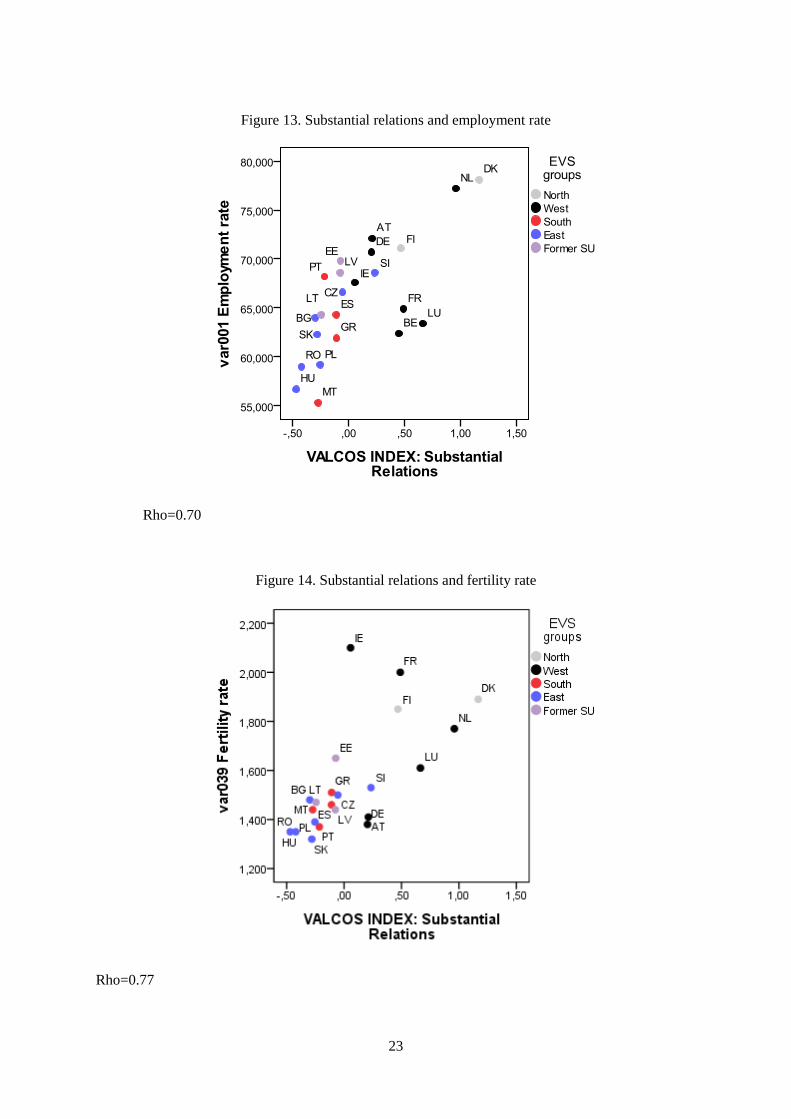
Figure 13. Substantial relations and employment rate
Rho=0.70
Figure 14. Substantial relations and fertility rate
Rho=0.77

24
Figure 15. Substantial relations and happiness
Rho=0.55
5. Conlusions
The aggregation of EVS 2008 data on social cohesion together with many macro in-
dicators of several dimensions of social life (including economic, socio-demographic,
health and subjective well-being indicators) allowed us to rank social cohesion across
39 European countries and to explore differences across groups of countries. Subse-
quently, we validated our index by correlating it with many national level variables.
Results suggest that the VALCOS-Index of social cohesion is strongly and
significantly correlated with other macro indicators largely used by the scientific
community. This is the case of the following variables: suicides, life satisfaction and
happiness, jobless households, voting participation, long-term unemployment rate,
risk of poverty rate, part-time employment, long-term employment, and employment
rate of young people.

25
Social variables of the macro data base presenting the most significant (at
p<0.01) correlations with the six dimensions of the VALCOS Index are the follow-
ing: Part-time employment (5), GDP per inhabitant (4), lifelong learning (4), level of
Internet access (4), income per capita (4), happiness (4), minimum wages (3), fertility
rate (3), cinema attendance (3), emigration rate (3), life satisfaction (3) and infant
mortality (3).
The main domains linked to the VALCOS Index are: Income, employ-
ment, subjective well-being, suicide, health, education and demography.
Summarizing, present results point out the following patterns:
1. countries with higher social cohesion show lower levels of unem-
ployment and higher levels of other forms of employment such as
part-time job. Similarly, these countries are characterized by higher
levels of people investing in education over the life course;
2. more cohesive societies are also reporting better economic perfor-
mances in terms of higher GDP, higher employment and social ex-
penditures, lower levels of inflation, less unequal societies and lower
risk of poverty;
3. those societies are not only richer, but also safer: countries with higher
levels of social cohesion correlate with lower levels of mortality due
to car accidents and lower rates of suicides and of infant mortality. On
the contrary, these countries are characterized by higher fertility rates
and life expectancy when 65;
4. higher social cohesion is positively correlated with a higher participa-
tion of women and young people to the political and working life of
their countries, more intense social participation and confidence in
new technologies.
This framework suggests that more cohesive societies are also characterized by
higher quality of life. This is further confirmed by correlation with aggregated index-
es of subjective well-being as proxied by happiness, life satisfaction and a joined in-
dex of well-being.

26
Nonetheless, it is worth mentioning that these results are subject to some con-
straints. First of all, we must recall the impossibility of taking into account the eco-
nomic sphere of the social cohesion architecture proposed by Bernard. This is mainly
due to lack of appropriate items in the dataset about insertion/exclusion and equality
of chance. Furthermore, present work was limited by the unavailability of informa-
tion concerning some major European countries at the time of writing this paper and
by the lack of weights to account for sampling errors.
Taking into account all the above mentioned constraints, we consider present
results encouraging showing that it is possible to build a reliable index of social co-
hesion starting from individual level variables. The relevant advantage of this ap-
proach is that it is based on micro-observed data which are easy to collect and widely
available for many countries.
The availability of a reliable micro-based synthetic index of social cohe-
sion enables an in-depth analysis of its determinants and effects on many domains of
social life starting from the individual level to the national level. Present results are a
former step forward toward the definition of new tools allowing the design of a new
set of policy interventions to promote or restore social cohesion at many different le-
vels eventually extending the range of available policies. At the same time, our index
provides a way to easily monitor social cohesion across nations starting from indi-
vidual surveys.
27
References
Acket, S. (2010) Cohésion sociale et indicateurs macro, Documents techniques
n°2010-21, CEPS/INSTEAD, Differdange. (Technical report. Available on request)
Bernard, P. (1999) La Cohésion sociale : critique d’un quasi-concept, Lien so-
cial et Politiques – RIAC, 41, 47-59.
Borg, I., & Groenen, P.J.F. (2005) Modern multidimensional scaling. Theory
and applications. New York: Springer (2d. ed.).
Commandeur, J. J. F. and Heiser, W. J. (1993) Mathematical derivations in the
proximity scaling (PROXSCAL) of symmetric data matrices (Tech. Rep. No. RR-93-
03). Leiden, The Netherlands: Department of Data Theory, Leiden University.
Chan, J., To, H. & Chan, E. (2006) Reconsidering social cohesion: developing
a definition and analytical framework for empirical research, Social Indicators Re-
search, 75, 273-302.
Dickes, P. (2010) Mesure de la cohésion sociale dans l’enquête EVS Europe
2008. Documents Techniques n°2010-25, CEPS/INSTEAD, Differdange. (Technical
report. Available on request).
Dickes P., Valentova M., Borsenberger M. (2009) Construct Validation and
Application of a common Measure of Social Cohesion in 33 European Countries. So-
cial Indicators Research, 98(3), 451 - 473. (DOI: 10.1007/s11205-009-9551-5).
Dickes P., Valentova M., Borsenberger M. (2008) Social cohesion: Measure-
ment based on the EVS micro-data. Statistical Applicata, (Italian Journal of Applied
Statistics) (20)2, 1-16.
Durkheim E. (1893) De la Division du travail social, Paris, PUF, coll. « Qua-
drige ».
Halman, L., Luijkx, R., & van Zundert, M. (2005) Atlas of European Values.
Tilburg: Brill.
Tournois. J. & Dickes. P. (1993) La pratique de l’échelonnement multidimen-
sionnel. Bruxelles: De Boeck Université.

28
Annexes
Table A1. Countries and sample size
country abrev source num EVS groups sample
size
equal size
Albania AL 1 4 East 1534 1000
Armenia AM 2 5 Former SU 1500 1000
Austria AT 3 2 West 1510 1000
Azerbaijan AZ 4 5 Former SU 1487 1000
Belarus BY 5 5 Former SU 1500 1000
Belgium BE 6 2 West 1509 1000
Bosnia-Herzegovina BA 7 4 East 1512 1000
Bulgaria BG 8 4 East 1500 1000
Cyprus CY 9 3 South 1000 1000
Cyprus (North) NCY 10 3 South 500 1000
Czech Republic CZ 11 4 East 1821 1000
Denmark DK 12 1 North 1507 1000
Estonia EE 13 5 Former SU 1518 1000
Finland FI 14 1 North 1134 1000
France FR 15 2 West 1499 1000
Georgia GE 16 5 Former SU 1500 1000
Germany DE 17 2 West 2075 1000
Greece GR 18 3 South 1498 1000
Hungary HU 19 4 East 1513 1000
Ireland IE 20 2 West 1013 1000
Kosovo KOS 21 4 East 1601 1000
Latvia LV 22 5 Former SU 1506 1000
Lithuania LT 23 5 Former SU 1500 1000
Luxembourg LU 24 2 West 1610 1000
Malta MT 25 3 South 1500 1000
Moldavia Republik MD 26 5 Former SU 1551 1000
Montenegro ME 27 4 East 1516 1000
The Netherlands NL 28 2 West 1554 1000
Northern Ireland NIR 29 2 West 500 1000
Poland PL 30 4 East 1510 1000
Portugal PT 31 3 South 1553 1000
Romania RO 32 4 East 1489 1000
Russia RU 33 5 Former SU 1504 1000
Serbia RS 34 4 East 1512 1000
Slovakia SK 35 4 East 1509 1000
Slovenia SI 36 4 East 1366 1000
Spain ES 37 3 South 1500 1000
Switzerland CH 38 2 West 1272 1000
Ukraine UA 39 5 Former SU 1507 1000
Total 56190 39000 Source: Dickes 2010
Countries not available in august 2010: Croatia, Great Britain, Iceland, Italy, Macedonia, Norway, Sweden,
Turkey.

29
Table A2. Intermediate social cohesion variables (VAI): composition, internal consistency and statis-
tical characteristics (N=39000)
Intermediates
variables
items
α M
sd
Skew
Kurt
Political sphere – Formal relations
Dimension: Legitimacy/Illegitimacy
VAI01 Confidence in
national distributive
systems
v207r Confidence in: education system
v213r Confidence in: social security system
v217r Confidence in: health care system
v218r Confidence in: justice system
.77 10.26
2.54
-.097
-.147
VAI02 Confidence in
national organiza-
tions
v208r Confidence in: the press
v209r Confidence in: trade unions
v211r Confidence in: parliament
v212r Confidence in: civil service
.74 9.15
2.42
.193
.199
VAI03 Confidence in
authority institutions
v205r Confidence in: church
v206r Confidence in: armed forces
v210r Confidence in: the police
.57 7.99
1.97
-.112
-.248
VAI04 Satisfaction
and approval of
democracy and
government
v221r Confidence in: political parties
v222r Confidence in: government
v223r Are you satisfied with democracy
v224r View government: very bad-very good (4 categories)
.76 9.15
2.64
.086
-.543
Sociocultural sphere – Formal relation
Dimension: Acceptance/Reject
VAI05 Proximal
solidarity
v285r Concerned with people in the neighbourhood
v286r Concerned with people in the region
v287r Concerned with fellow countrymen
.87 9.03
2.82
-.062
-.229
VAI06 Distal solidar-
ity
v290r Concerned with elderly people
v291r Concerned with unemployed people
v292r Concerned with immigrants
v293r Concerned with sick and disabled people
v294r Concerned with poor children
.85 17.41
4.15
-.330
.047

30
Political sphere –substantial relation
Dimension: Participation/Passivity
VAI07 Participation
in legal political
activities
v187r Signing a petition
v188r Joining in boycotts
v189r Attending lawful demonstrations
.75 4,98
1.80
.478
-.822
VAI08 Participation
in illegal political
activities
v190r Joining unofficial strikes
v191r Occupying buildings/factories
.63 2.41
0.80
2.040
3.781
VAI09 Political
concern
v7r How often discuss politics with friends
v281r How often do you follow politics in media (3 categories)
.50 3.93
1.26
-.071
-1.076
Sociocultural sphere - substantial relation
Dimension: Belonging/Isolation
VAI10 Participation
in social associations
v10r Do you belong to: welfare organisation
v28r Do you work unpaid for: welfare organisation
v15r Do you belong to: local community action
v33r Do you work unpaid for: local community action
.68 4.12
0.49
4,84
26,53
VAI11 Participation
in political associa-
tions
v13r Do you belong to: trade unions
v31r Do you work unpaid for: trade unions
v14r Do you belong to: political parties/groups
v32r Do you work unpaid for: political parties/groups
v18r Do you belong to: professional associations
v36r Do you work unpaid for: professional associations
.64 6.24
0.70
4.04
21.10
VAI12 Participation
in cultural associa-
tions
v11r Do you belong to: religious organisation
v29r Do you work unpaid for: religious organisation
v12r Do you belong to: cultural activitiesa
v30r Do you work unpaid for: cultural activities
v21r Do you belong to: womens groups
v39r Do you work unpaid for: womens groups
.65 6.29
0.77
3.37
13.96
VAI13 Participation
in youth & leisure
associations
v19r Do you belong to: youth work
v37r Do you work unpaid for: youth work
v20r Do you belong to: sports/recreation
v38r Do you work unpaid for: sports/recreation
.66 4.23
0.64
3.27
11.68
Source: Dickes 2010
α= alpha coefficient of Cronbach; sd=standard deviation; skew=skeweness; kurt=kurtosis.
Standard-error for skeweness = 0,012 and standard-error for kurtosis = 0,25.
31
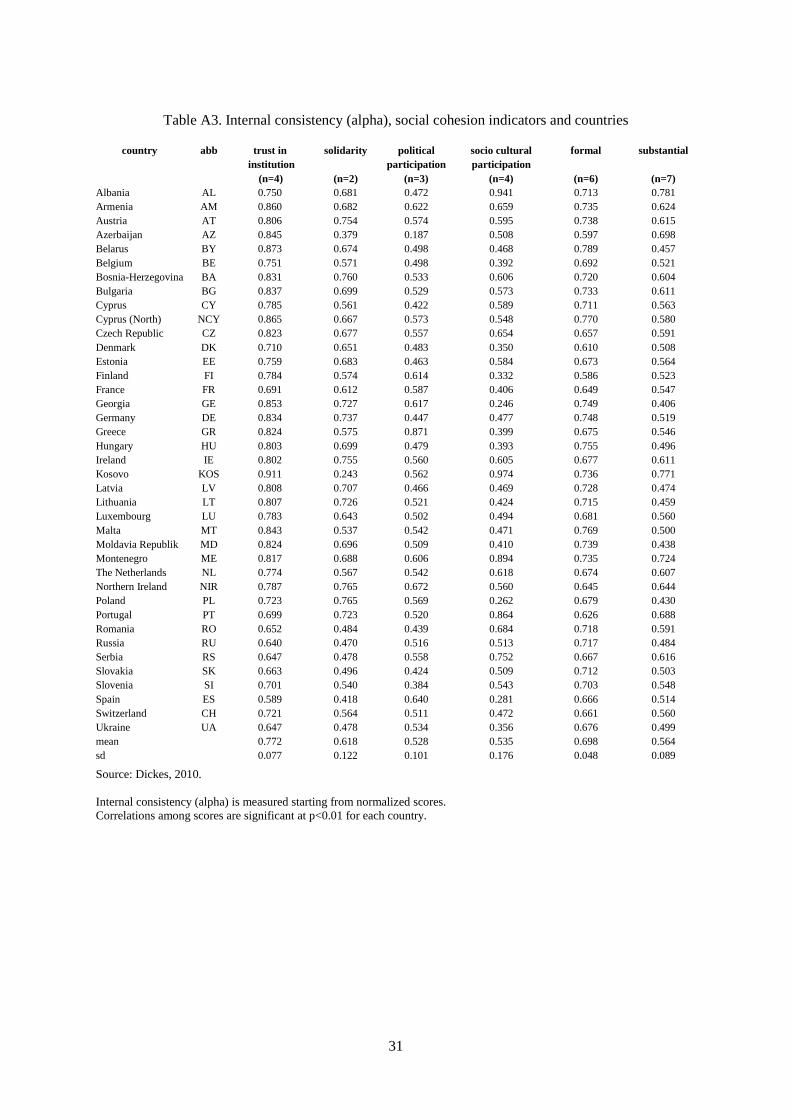
Table A3. Internal consistency (alpha), social cohesion indicators and countries
country abb trust in
institution
(n=4)
solidarity
(n=2)
political
participation
(n=3)
socio cultural
participation
(n=4)
formal
(n=6)
substantial
(n=7)
Albania AL 0.750 0.681 0.472 0.941 0.713 0.781
Armenia AM 0.860 0.682 0.622 0.659 0.735 0.624
Austria AT 0.806 0.754 0.574 0.595 0.738 0.615
Azerbaijan AZ 0.845 0.379 0.187 0.508 0.597 0.698
Belarus BY 0.873 0.674 0.498 0.468 0.789 0.457
Belgium BE 0.751 0.571 0.498 0.392 0.692 0.521
Bosnia-Herzegovina BA 0.831 0.760 0.533 0.606 0.720 0.604
Bulgaria BG 0.837 0.699 0.529 0.573 0.733 0.611
Cyprus CY 0.785 0.561 0.422 0.589 0.711 0.563
Cyprus (North) NCY 0.865 0.667 0.573 0.548 0.770 0.580
Czech Republic CZ 0.823 0.677 0.557 0.654 0.657 0.591
Denmark DK 0.710 0.651 0.483 0.350 0.610 0.508
Estonia EE 0.759 0.683 0.463 0.584 0.673 0.564
Finland FI 0.784 0.574 0.614 0.332 0.586 0.523
France FR 0.691 0.612 0.587 0.406 0.649 0.547
Georgia GE 0.853 0.727 0.617 0.246 0.749 0.406
Germany DE 0.834 0.737 0.447 0.477 0.748 0.519
Greece GR 0.824 0.575 0.871 0.399 0.675 0.546
Hungary HU 0.803 0.699 0.479 0.393 0.755 0.496
Ireland IE 0.802 0.755 0.560 0.605 0.677 0.611
Kosovo KOS 0.911 0.243 0.562 0.974 0.736 0.771
Latvia LV 0.808 0.707 0.466 0.469 0.728 0.474
Lithuania LT 0.807 0.726 0.521 0.424 0.715 0.459
Luxembourg LU 0.783 0.643 0.502 0.494 0.681 0.560
Malta MT 0.843 0.537 0.542 0.471 0.769 0.500
Moldavia Republik MD 0.824 0.696 0.509 0.410 0.739 0.438
Montenegro ME 0.817 0.688 0.606 0.894 0.735 0.724
The Netherlands NL 0.774 0.567 0.542 0.618 0.674 0.607
Northern Ireland NIR 0.787 0.765 0.672 0.560 0.645 0.644
Poland PL 0.723 0.765 0.569 0.262 0.679 0.430
Portugal PT 0.699 0.723 0.520 0.864 0.626 0.688
Romania RO 0.652 0.484 0.439 0.684 0.718 0.591
Russia RU 0.640 0.470 0.516 0.513 0.717 0.484
Serbia RS 0.647 0.478 0.558 0.752 0.667 0.616
Slovakia SK 0.663 0.496 0.424 0.509 0.712 0.503
Slovenia SI 0.701 0.540 0.384 0.543 0.703 0.548
Spain ES 0.589 0.418 0.640 0.281 0.666 0.514
Switzerland CH 0.721 0.564 0.511 0.472 0.661 0.560
Ukraine UA 0.647 0.478 0.534 0.356 0.676 0.499
mean 0.772 0.618 0.528 0.535 0.698 0.564
sd 0.077 0.122 0.101 0.176 0.048 0.089
Source: Dickes, 2010.
Internal consistency (alpha) is measured starting from normalized scores.
Correlations among scores are significant at p<0.01 for each country.

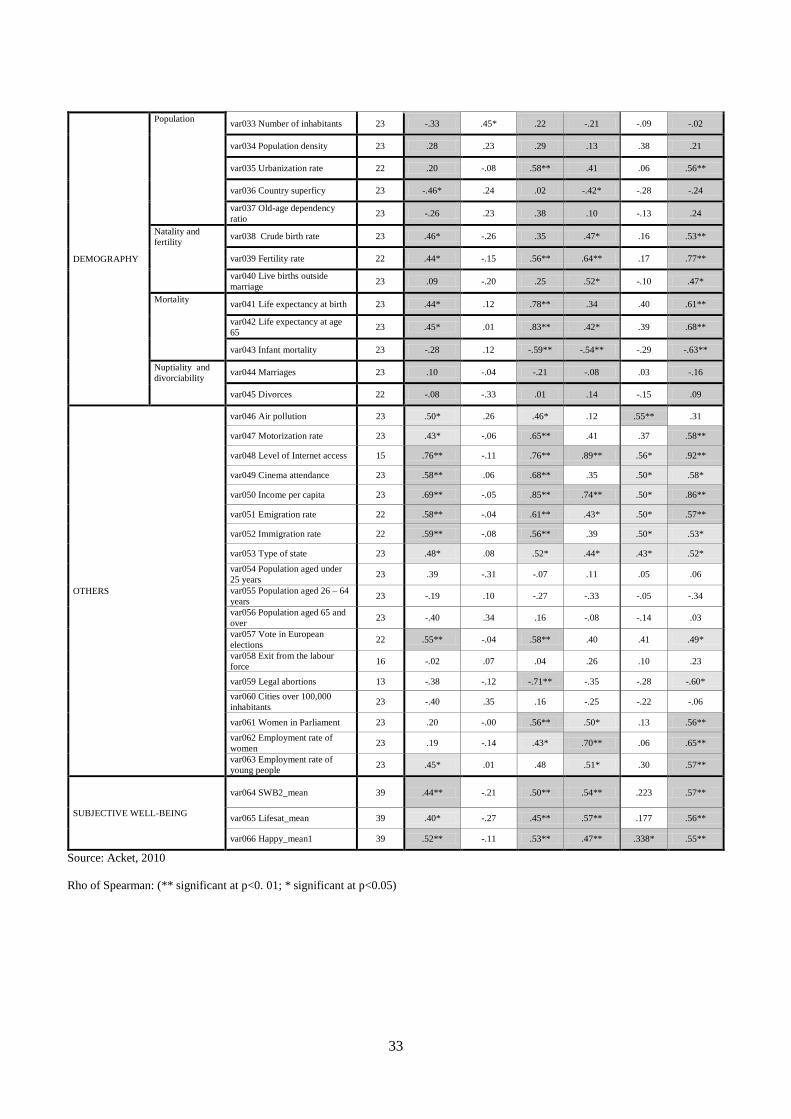
32
Table A4. Spearman rank coefficients between social cohesion indicators and other social macro-
variables
N
Coun-
tries
Trust in
institution
Solidarity Political
partici-
pation
Sociocultu-
ral parti-
cipation
Formal Substan-
tial
EMPLOYMENT
WORK
AND
ECONOMY
Employment and
Unemployment var001 Employment rate 23 .19 -.12 .51* .69** .08 .70**
var002 Jobless households 23 -.30 -.071 -.40* -.42* -.37 -.54**
var003 Unemployment rate 23 -.20 .20 -.15 -.65** -.07 -.44*
var004 Long-term unemploy-
ment rate 23 -.34 .45* -.31 -.61** -.07 -.53**
Vulnerable
groups
var005 Unemployment rate of
young people 23 -.11 .10 -.18 -.52 -.02 -.40
var006 Unemployment rate of
women 23 -.23 .22 -.04 -.62** -.07 -.36
var007 Employment rate of
older workers 23 -.06 -.05 .07 .35 -.10 .27
Working condi-
tions var008 Part-time employment 23 .61** .14 .78** .64** .58** .74**
var009 Accidents at work 22 .22 -.32 -.17 .05 .07 -.02
var010 Number of working days
lost 16 .09 .45 .37 .08 .45 .21
var011 Unionization rate 13 .57* -.19 .15 .58* .39 .30
Economy var012 GDP per inhabitant 23 .60** -.12 .80** .71** .42* .82**
var013 government debt 23 -.01 .28 .35 -.15 .08 .10
var014 Social protection expen-
diture 23 .32 .24 .77** .45* .34 .66**
var015 renewable sources 22 -.00 .04 -.03 -.01 .14 -.05
Purchasing
power var016 Purchasing power parity 23 -.14 -.29 -.03 .17 -.18 .09
var017 HICP 23 .50* -.16 -.69** -.38 -.45* -.58**
var018 Recreational and cultural
services HICP 23 -.32 -.09 -.58** -.12 -.25 -.40
Power and life
conditions var019 Minimum wages 19 .68** .00 .84** .47* .53* .75**
var020 Gender pay gap in
unadjusted form 23 -.36 -.31 .03 .15 -.53** .18
var021 S80/S20 income quintile
share ratio 23 -.35 .31 -.23 -.40 -.12 -.37
var022 Gini coefficient 23 -.38 .27 -.25 -.38 -.17 -.36
var023 At-risk-of-poverty rate 23 -.29 .29 -.31 -.46* -.08 -.45*
HEALTH AND
EDUCATION
Health var024 Health expenditure 16 .17 .55* .60* .25 .35 .45
var025 Suicide 22 -.15 -.61** -.06 .20 -.34 .1
var026 Hospital beds 21 -.38 -.28 -.16 -.32 -.39 -.29
var027 People killed in road
accidents 23 -.60** -.16 -.54** -.36 -.50* -.47*
Education var028 Expenditure on educa-
tion 20 .37 .10 .40 .44 .29 .49*
var029 Early leavers from
education 23 .06 .43* -.10 -.29 .30 -.25
var030 Education attainment
level 23 -.33 -.49 -.27 -.02 -.59** -.13
var031 School expectancy 23 .04 -.09 .19 .31 -.027 .33
var032 Lifelong learning 23 .54** -.21 .69** .74** .36 .83**
(continued on the next page)
33
DEMOGRAPHY
Population var033 Number of inhabitants 23 -.33 .45* .22 -.21 -.09 -.02
var034 Population density 23 .28 .23 .29 .13 .38 .21
var035 Urbanization rate 22 .20 -.08 .58** .41 .06 .56**
var036 Country superficy 23 -.46* .24 .02 -.42* -.28 -.24
var037 Old-age dependency
ratio 23 -.26 .23 .38 .10 -.13 .24
Natality and
fertility var038 Crude birth rate 23 .46* -.26 .35 .47* .16 .53**
var039 Fertility rate 22 .44* -.15 .56** .64** .17 .77**
var040 Live births outside
marriage 23 .09 -.20 .25 .52* -.10 .47*
Mortality var041 Life expectancy at birth 23 .44* .12 .78** .34 .40 .61**
var042 Life expectancy at age
65 23 .45* .01 .83** .42* .39 .68**
var043 Infant mortality 23 -.28 .12 -.59** -.54** -.29 -.63**
Nuptiality and
divorciability var044 Marriages 23 .10 -.04 -.21 -.08 .03 -.16
var045 Divorces 22 -.08 -.33 .01 .14 -.15 .09
OTHERS
var046 Air pollution 23 .50* .26 .46* .12 .55** .31
var047 Motorization rate 23 .43* -.06 .65** .41 .37 .58**
var048 Level of Internet access 15 .76** -.11 .76** .89** .56* .92**
var049 Cinema attendance 23 .58** .06 .68** .35 .50* .58*
var050 Income per capita 23 .69** -.05 .85** .74** .50* .86**
var051 Emigration rate 22 .58** -.04 .61** .43* .50* .57**
var052 Immigration rate 22 .59** -.08 .56** .39 .50* .53*
var053 Type of state 23 .48* .08 .52* .44* .43* .52*
var054 Population aged under
25 years 23 .39 -.31 -.07 .11 .05 .06
var055 Population aged 26 – 64
years 23 -.19 .10 -.27 -.33 -.05 -.34
var056 Population aged 65 and
over 23 -.40 .34 .16 -.08 -.14 .03
var057 Vote in European
elections 22 .55** -.04 .58** .40 .41 .49*
var058 Exit from the labour
force 16 -.02 .07 .04 .26 .10 .23
var059 Legal abortions 13 -.38 -.12 -.71** -.35 -.28 -.60*
var060 Cities over 100,000
inhabitants 23 -.40 .35 .16 -.25 -.22 -.06
var061 Women in Parliament 23 .20 -.00 .56** .50* .13 .56**
var062 Employment rate of
women 23 .19 -.14 .43* .70** .06 .65**
var063 Employment rate of
young people 23 .45* .01 .48 .51* .30 .57**
SUBJECTIVE WELL-BEING
var064 SWB2_mean 39 .44** -.21 .50** .54** .223 .57**
var065 Lifesat_mean 39 .40* -.27 .45** .57** .177 .56**
var066 Happy_mean1 39 .52** -.11 .53** .47** .338* .55**
Source: Acket, 2010
Rho of Spearman: (** significant at p<0. 01; * significant at p<0.05)

B.P. 48L-4501 DifferdangeTél.: +352 58.58.55-801www.ceps.lu