Embed Size (px)
Citation preview
Measuring and Evaluating
Bank Performance

The purpose of this session is to discover what
analytical tools can be applied to a bank’s
financial statements so that management and
the public can identify the most critical
problems inside each bank and develop ways
to deal with those problems
Introduction
• Banks today are under great pressure to perform due to ever rising expectations of their
– Stockholders, Employees, Depositors etc.
• Banks entry in open market for funds raising means their financial statements are being scrutinised by investors and general public regularly
• As a result there is a need of performance evaluation not only for banks itself but whole community of stockholders, employees, depositors, borrowing customers, and government regulators.

Introduction
• Two important dimensions for any bank-
profitability and risk
• Some banks want to grow faster and achieve
some long range growth objectives. Others
seem to prefer a quiet life, minimising risk and
conveying the image of a sound bank but with
modest rewards for their shareholders
• If stock fails to rise in value correspond to
stockholders expectations, current investors
may seek to unload their shares and the bank
will have difficulty in raising new capital to
support its future growth.
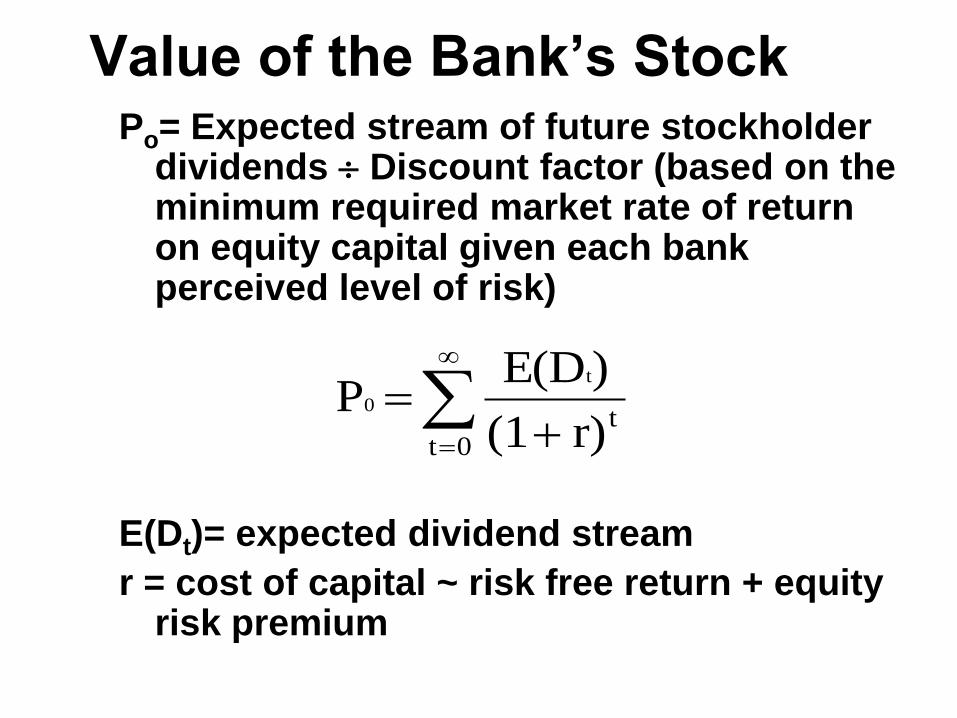
Value of the Bank’s Stock Po= Expected stream of future stockholder
dividends Discount factor (based on the minimum required market rate of return on equity capital given each bank perceived level of risk)
E(Dt)= expected dividend stream
r = cost of capital ~ risk free return + equity risk premium
0ttr) (1
)E(D P
t
0
Value of a Bank’s Stock Rises
When:
• Expected Dividends Increase
• Risk to the Bank Falls
• Combination of Expected Dividend
Increase and Risk Decline
Profitability Ratios in
Banking
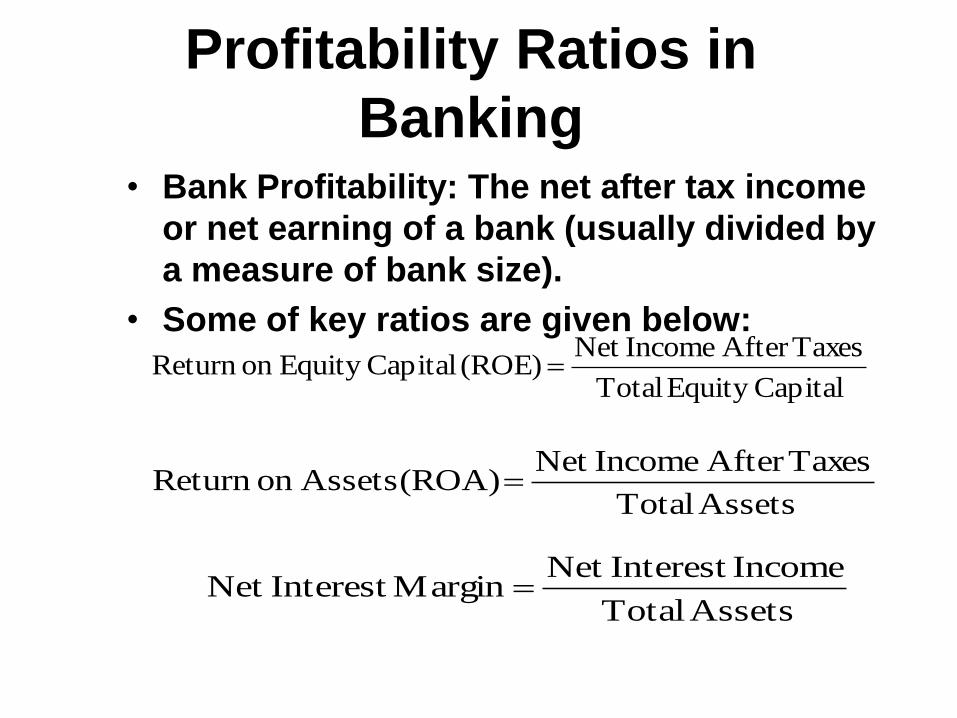
• Bank Profitability: The net after tax income
or net earning of a bank (usually divided by
a measure of bank size).
• Some of key ratios are given below:
CapitalEquity Total
TaxesAfter IncomeNet (ROE) CapitalEquity on Return
Assets Total
TaxesAfter IncomeNet (ROA) Assetson Return
Assets Total
IncomeInterest Net Margin Interest Net
Profitability Ratios in
Banking
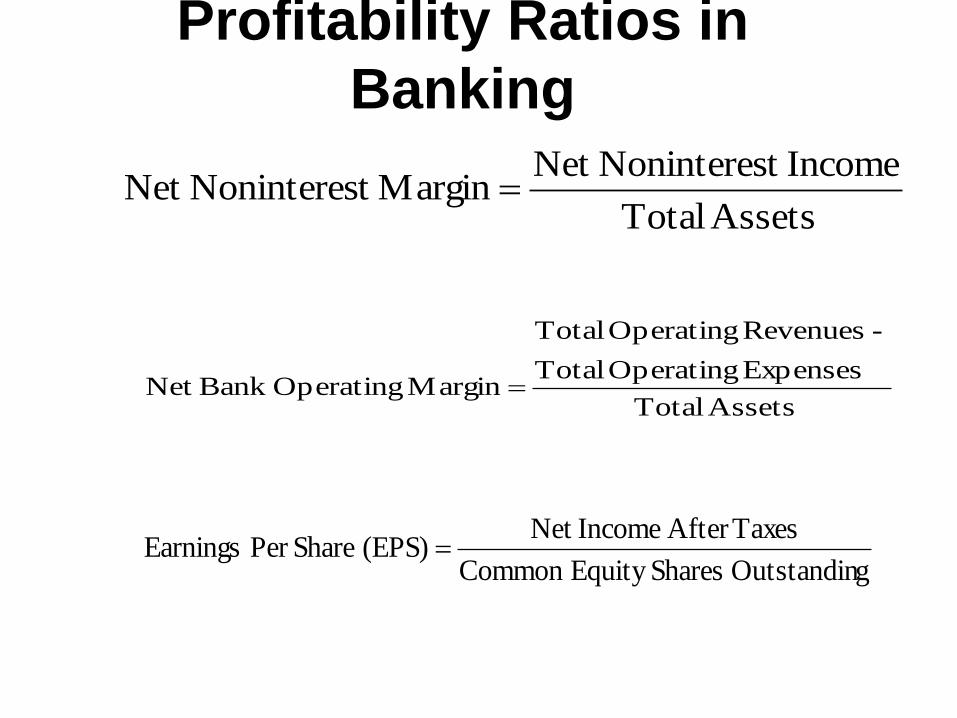
Assets Total
Expenses Operating Total
- Revenues Operating Total
Margin OperatingBank Net
gOutstandin SharesEquity Common
TaxesAfter IncomeNet (EPS) SharePer Earnings
Assets Total
Incomet NoninteresNet Margin t NoninteresNet
Profitability Ratios in Banking
• Banks normally borrow from savers and lend
to the investors. A key measure of the
success of this intermediation function is
certainly the spread between the yield on
average earning assets to the cost rate on
interest-bearing sources of funds. That is, to
measure the true cost of intermediation, we
must look at:
– Yield Spread = (Percent yield on average earning
assets -- Percent cost on interest-earning sources
of funds)
Profitability Ratios in Banking
• Are ROA and ROE equal good proxies for the
return of ownership of a financial institution?
Does it matter which earnings ratio we use?
• The answer is yes, because ROA and ROE
reveal different information about a bank or
other financial institution.
• ROA is a measure of efficiency. It conveys
information on how well the institution’s
resources are being used in order to generate
income.
Profitability Ratios in Banking
• ROE is a more direct measure of returns to
the shareholders. Since the reward to the
owners are a key goal for the whole
organization, ROE is generally superior to
ROA as a measure of profitability.
• One point should be obvious here: ROE is
strongly influenced by the capital structure
of a financial institution, in particular, how
much use it makes of equity financing.
Profitability Ratios in Banking
• Management may be able to boost ROE
simply by greater use of financial leverage-
that is, increasing the ratio of debt to equity
capital. This can be seen clearly if we note
that
ROE = ROA x (total assets/total equity
capital)
or equivalently,
ROE=ROA x ((total equity+total debt) / total
equity)
Profitability Ratios in Banking
• The elements which make up ROE can be
derived by multiplying together three other
financial ratios:
– Ratio of net income to total operating income
(revenue). This is known as the profit margin.
– Ratio of operating income to total assets--known
as asset utilization ratio.
– Ratio of total assets to equity capital--known as
equity multiplier.
– ROE=(NI/TE) = (NI/OI) x (OI/TA) x (TA/TE)
Profitability Ratios in Banking
• ROE = (Profit margin x Asset utilization x
Equity multiplier)
– The importance of the above formula is that it can
aid management in pinpointing where the problem
lies if a financial institution’s ROE is lower or
falling.
– For example, if the profit margin is falling, this
implies that less net income is being recovered
from each dollar of operating revenue.
Profitability Ratios in Banking
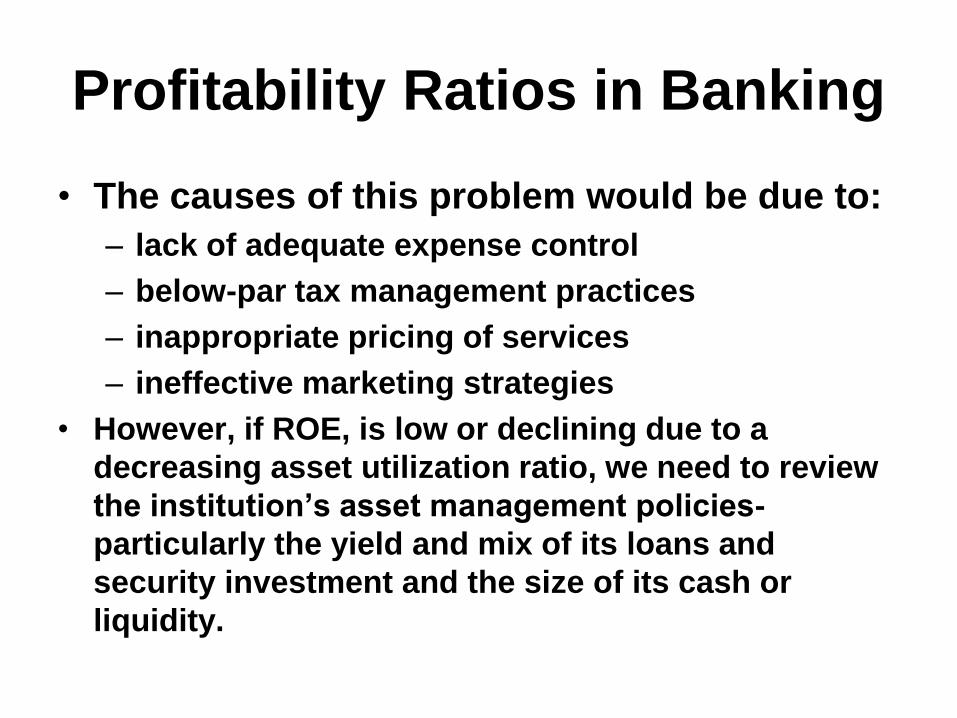
• The causes of this problem would be due to:
– lack of adequate expense control
– below-par tax management practices
– inappropriate pricing of services
– ineffective marketing strategies
• However, if ROE, is low or declining due to a
decreasing asset utilization ratio, we need to review
the institution’s asset management policies-
particularly the yield and mix of its loans and
security investment and the size of its cash or
liquidity.
Profitability Ratios in Banking
• Finally, the equity multiplier sheds light on
the financing mix of the institution -- what
proportion of assets are supported by
owner’s equity (particularly stock and
retained earnings) as opposed to debt
capital.
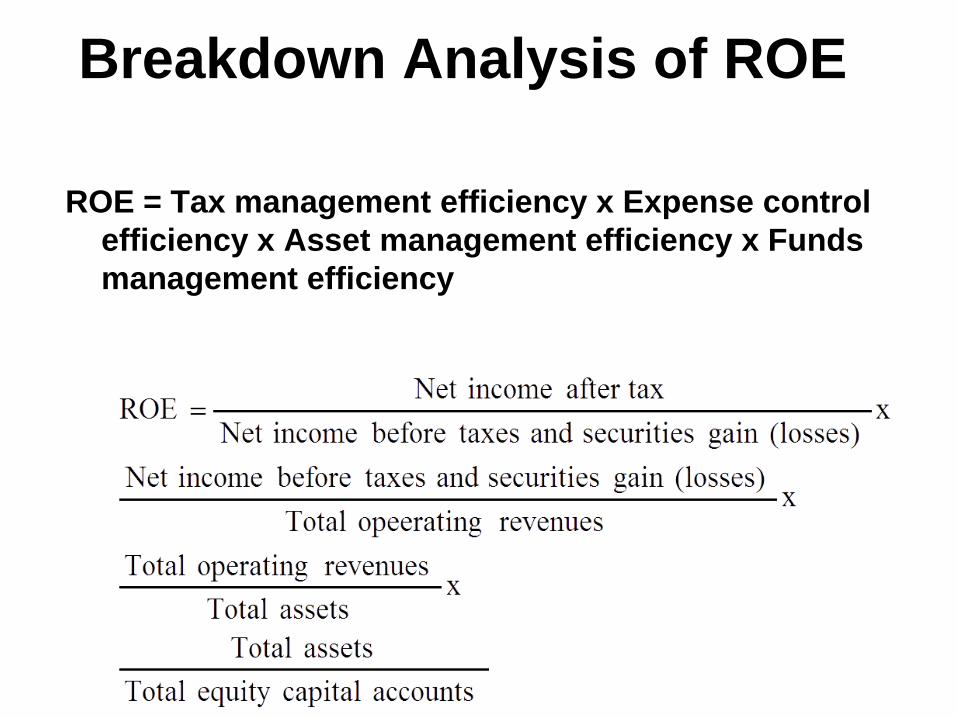
Breakdown Analysis of ROE
ROE = Tax management efficiency x Expense control
efficiency x Asset management efficiency x Funds
management efficiency
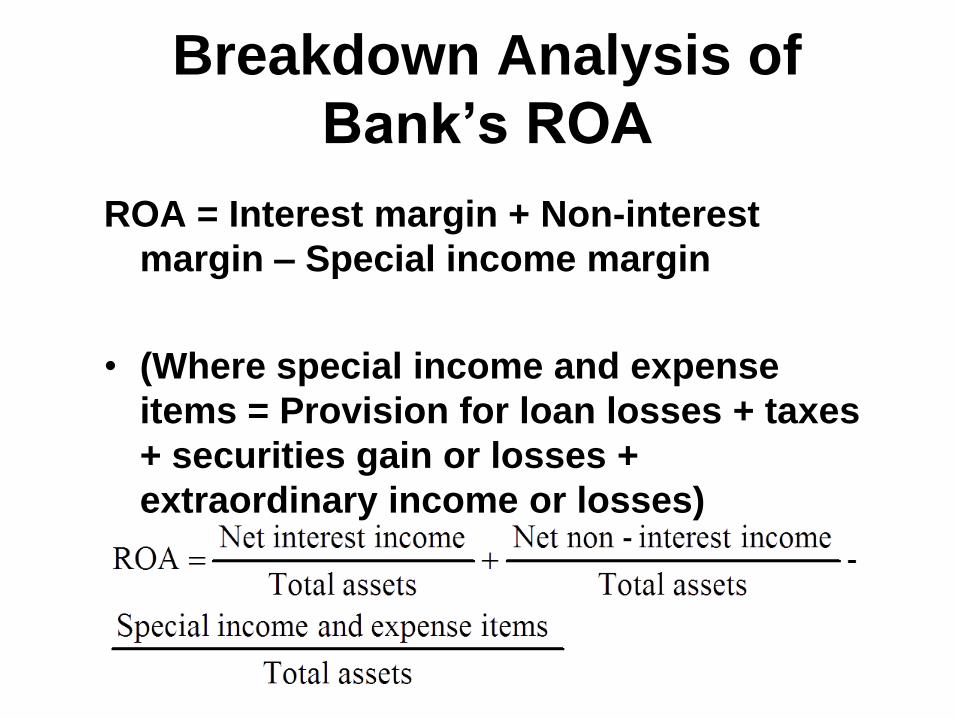
Breakdown Analysis of
Bank’s ROA
ROA = Interest margin + Non-interest
margin – Special income margin
• (Where special income and expense
items = Provision for loan losses + taxes
+ securities gain or losses +
extraordinary income or losses)
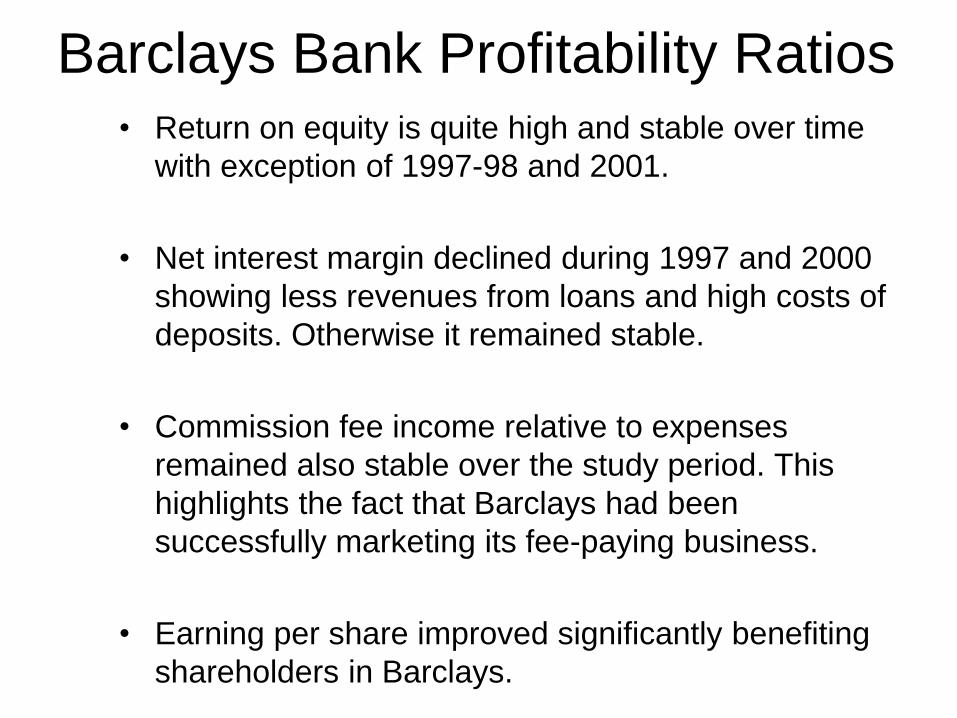
Barclays Bank Profitability Ratios • Return on equity is quite high and stable over time
with exception of 1997-98 and 2001.
• Net interest margin declined during 1997 and 2000
showing less revenues from loans and high costs of
deposits. Otherwise it remained stable.
• Commission fee income relative to expenses
remained also stable over the study period. This
highlights the fact that Barclays had been
successfully marketing its fee-paying business.
• Earning per share improved significantly benefiting
shareholders in Barclays.
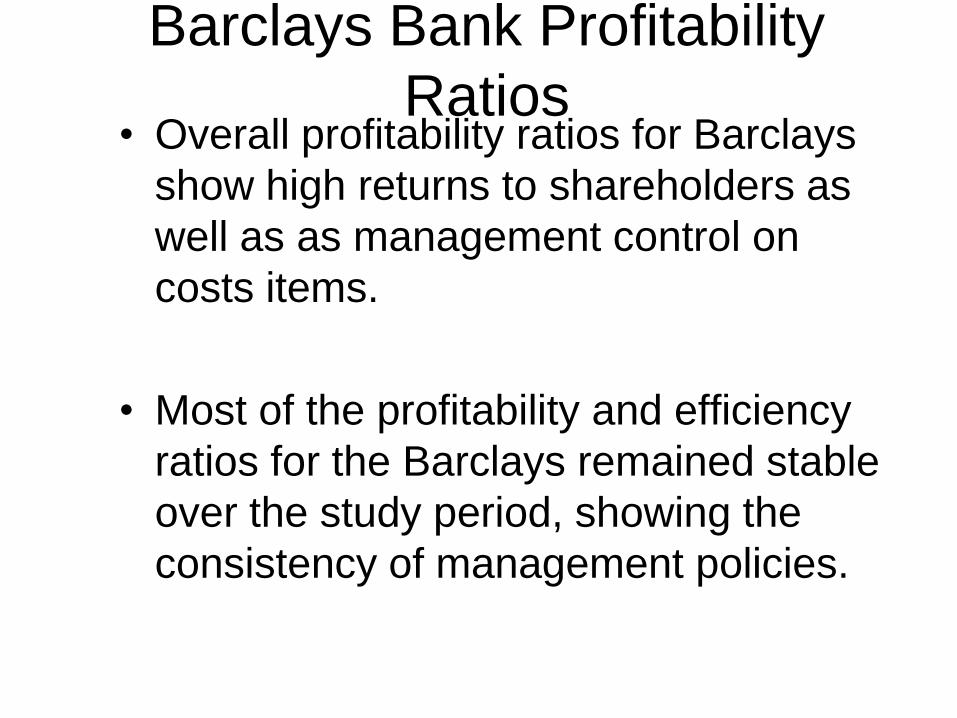
Barclays Bank Profitability
Ratios • Overall profitability ratios for Barclays
show high returns to shareholders as
well as as management control on
costs items.
• Most of the profitability and efficiency
ratios for the Barclays remained stable
over the study period, showing the
consistency of management policies.

However…
• Profitability taken in isolation is only
half the story.
• We also need to know about risk
exposure….
Bank Risks
• Credit Risk
• Liquidity Risk
• Market Risk
• Interest Rate Risk
• Earnings Risk
• Solvency Risk

Credit Risk
• The Probability that Some of the
Bank’s Assets Will Decline in Value
and Perhaps Become Worthless
Credit Risk Measures
• Non-performing Loans/Total Loans
• Net Charge-Offs (Written Off Loans)/Total Loans
• Provision for Loan Losses/Total Loans
• Provision for Loan Losses/Equity Capital
• Total Loans/Total Deposits
Liquidity Risk
• Probability the Bank Will Not Have
Sufficient Cash and Borrowing
Capacity to Meet Deposit
Withdrawals and Other Cash
Needs
Liquidity Risk Measures
• Purchased Funds (Eurodollars, federal funds, large value certificate of deposits (CDs) and commercial papers)/Total Assets
• Net Loans/Total Assets
• Cash assets and Due from Banks/Total Assets
• Cash assets and Government Securities/Total Assets
Market Risk
• Probability of the Market Value of the
Bank’s Investment Portfolio Declining
in Value Due to a Rise in Interest
Rates
Market Risk Measures • Book-Value of Assets/ Estimated
Market Value of Assets
• Book-Value of Equity/ Market Value of Equity
• Market Value of Bonds/Book-Value of Bonds
• Market Value of Preferred Stock and Common Stock
Interest Rate Risk
• The Danger that Shifting Interest
Rates May Adversely Affect a
Bank’s Net Income, the Value of
its Assets or Equity
Interest Rate Risk Measures
• Interest Sensitive Assets/Interest
Sensitive Liabilities
• Uninsured Deposits/Total Deposits
Earnings Risk
• The Risk to the Bank’s Bottom Line –
Its Net Income After All Expenses
Earnings Risk Measures
• Standard Deviation of Net Income
• Standard Deviation of ROE
• Standard Deviation of ROA
Solvency or Default Risk
• Probability of the Value of the
Bank’s Assets Declining Below the
Level of its Total Liabilities. The
Probability of the Bank’s Long Run
Survival
Solvency Risk Measures
• Stock Price/Earnings Per Share
• Equity Capital/Total Assets
• Purchased Funds/Total Liabilities
• Equity Capital/Risk Assets
Credit Risk
• Total loans to total deposits: As this ratio grow, banks examiners may become more concerned because they may endanger the interest of depositors.
• Non-performing loans to total loans and leases: The rise in this ratio signals that bank’s credit risk is increasing. If this ratio persistently rise, then bank’s failure may be just around the corner.
• Annual provision for loan losses/Total loans and leases: The increase in this ratio signals that the management is having enough funds to control the bad loans. More is better.
Liquidity Risk
• Net loans to total assets: Higher the value of the ratio, lower cash available and higher chance to liquidity crunch.
• Cash and due to total assets: The higher the value higher the liquidity. More is better.
• Cash asset and government securities to total assets: Higher the value, more easily the bank can convert these securities into cash. More is better.
• Purchased funds to total assets: Higher use of purchased funds increase the chances of liquidity crunch
Interest Rate Risk
• Ratio of interest sensitive assets to
interest sensitive liabilities: When interest
sensitive assets exceeds interest sensitive
liabilities in a particular maturity range, a
bank is vulnerable to falling interest rate.
Same is the case for opposite.
Earning Risk
• Standard Deviation: The higher the
standard deviation or variance of bank
income, the more risky the banks earning
picture is.
Solvency/Default Risk
• PE: This ratio often falls if investors come to believe that a bank is undercapitalised relative to the risks it has taken on.
• Ratio of equity capital to assets: A decline in equity funding relative to assets may indicate increased risk exposure for the banks shareholders and debtholders.
• Ratio of equity capital to risk assets: It reflects how well current bank capital covers potential losses from these assets most likely to decline in value.
Economic value added (EVA) …an approach to measuring performance
that compares a bank’s (or line of business) net operating profit after-tax (NOPAT) with a
capital charge.
• Economic Value Added (EVA) is the
capital charge which represents the
required return to stockholders assuming a
specific allocated risk capital amount.
Economic Value Added (EVA) • EVA measures the extent to which the firm
has increased shareholder value in a given year.
• EVA represents the residual value that remains after the cost of all capital, including equity capital has been deducted.
• Increase Economic Value Added (EVA) – Increase operating efficiency
– Commit new resources that promise a high return
– Redirect resources to more productive uses
– Make prudent use of tax benefits of debt financing
Some analysts criticize traditional earnings measures
such as ROE, ROA, and EPS because they provide no
information about how a bank’s management is adding
to shareholder value.
• If the objective of the firm is to maximize
stockholders’ wealth, such measures do not
indicate whether stockholder wealth has
increased over time, let alone whether it has
been maximized.
• Stern, Stewart & Company has introduced the
concepts of market value added (MVA) and its
associated economic value added (EVA) in an
attempt to directly link performance to
shareholder wealth creation.
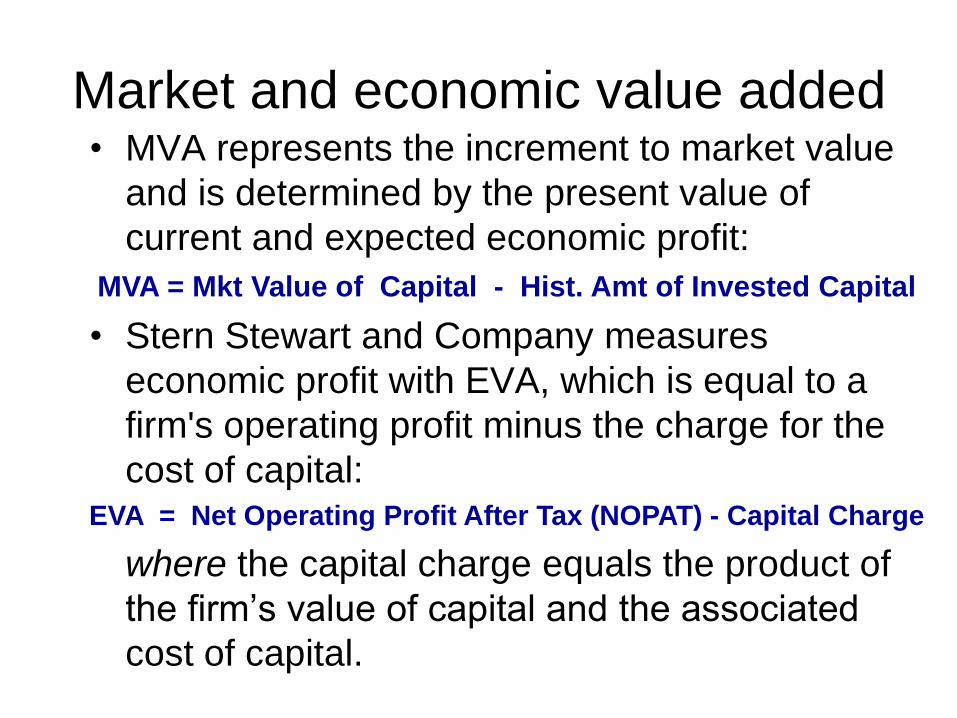
Market and economic value added • MVA represents the increment to market value
and is determined by the present value of
current and expected economic profit:
• Stern Stewart and Company measures
economic profit with EVA, which is equal to a
firm's operating profit minus the charge for the
cost of capital:
where the capital charge equals the product of
the firm’s value of capital and the associated
cost of capital.
MVA = Mkt Value of Capital - Hist. Amt of Invested Capital
EVA = Net Operating Profit After Tax (NOPAT) - Capital Charge
Difficulties in measuring EVA for
the entire bank • It is often difficult to obtain an accurate measure of a
firm's cost of capital.
• The amount of bank capital includes not just
stockholders' equity, but also includes loan loss
reserves, deferred (net) tax credits, non-recurring
items such as restructuring charges and
unamortized securities gains.
• NOPAT should reflect operating profit associated
with the current economics of the firm. Thus,
traditional GAAP-based accounting data, which
distort true profits, must be modified to obtain
estimates of economic profit.
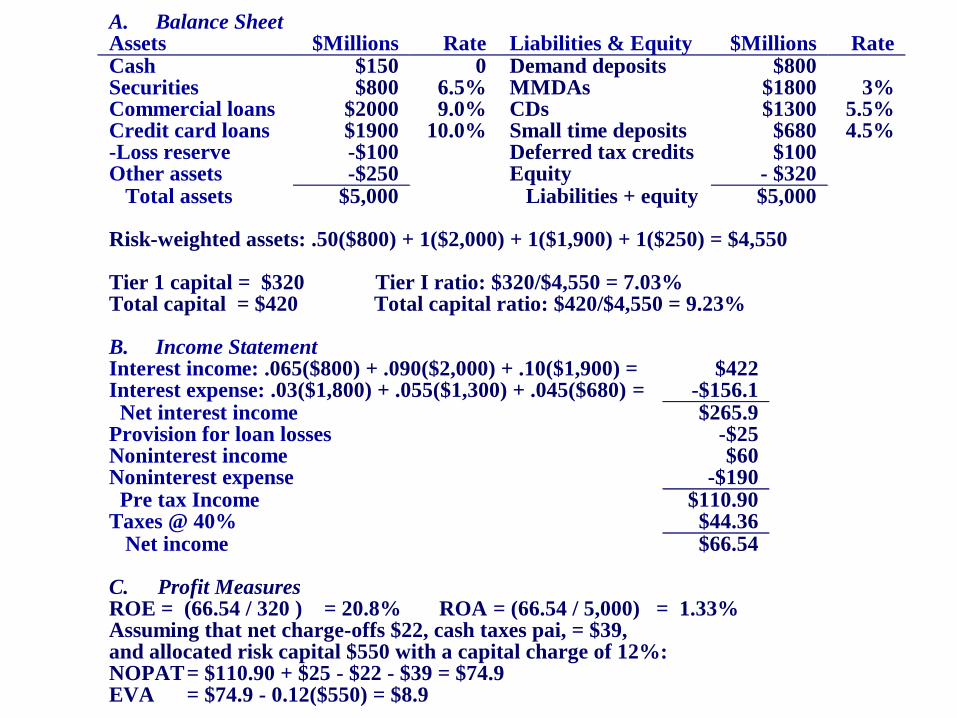
A. Balance Sheet Assets $Millions Rate Liabilities & Equity $Millions Rate Cash $150 0 Demand deposits $800 Securities $800 6.5% MMDAs $1800 3% Commercial loans $2000 9.0% CDs $1300 5.5% Credit card loans $1900 10.0% Small time deposits $680 4.5% -Loss reserve -$100 Deferred tax credits $100 Other assets -$250 Equity - $320 Total assets $5,000 Liabilities + equity $5,000 Risk-weighted assets: .50($800) + 1($2,000) + 1($1,900) + 1($250) = $4,550 Tier 1 capital = $320 Tier I ratio: $320/$4,550 = 7.03% Total capital = $420 Total capital ratio: $420/$4,550 = 9.23% B. Income Statement Interest income: .065($800) + .090($2,000) + .10($1,900) = $422 Interest expense: .03($1,800) + .055($1,300) + .045($680) = -$156.1 Net interest income $265.9 Provision for loan losses -$25 Noninterest income $60 Noninterest expense -$190 Pre tax Income $110.90 Taxes @ 40% $44.36 Net income $66.54 C. Profit Measures ROE = (66.54 / 320 ) = 20.8% ROA = (66.54 / 5,000) = 1.33% Assuming that net charge-offs $22, cash taxes pai, = $39, and allocated risk capital $550 with a capital charge of 12%: NOPAT = $110.90 + $25 - $22 - $39 = $74.9 EVA = $74.9 - 0.12($550) = $8.9