Embed Size (px)
Citation preview
Ministry of Land, Infrastructure, Transport and Tourism
Measures on Compact City in Japan
Oct 31, 2016
Masahiko KIKUCHIDirector, City Planning Survey and Information office
City Planning Division, City Bureau, Ministry of Land, Infrastructure, Transport and Tourism
Table of Contents
1. Demographic Trends in Japan
2. Challenges and Policy Direction
3. Compact City Measures
4. Efforts for Policy Coordination
1
1. Demographic Trends in Japan
2
0
20
40
60
80
100
120
140
1980 85 90 95 2000 05 10 15 20 25 30 35 '40
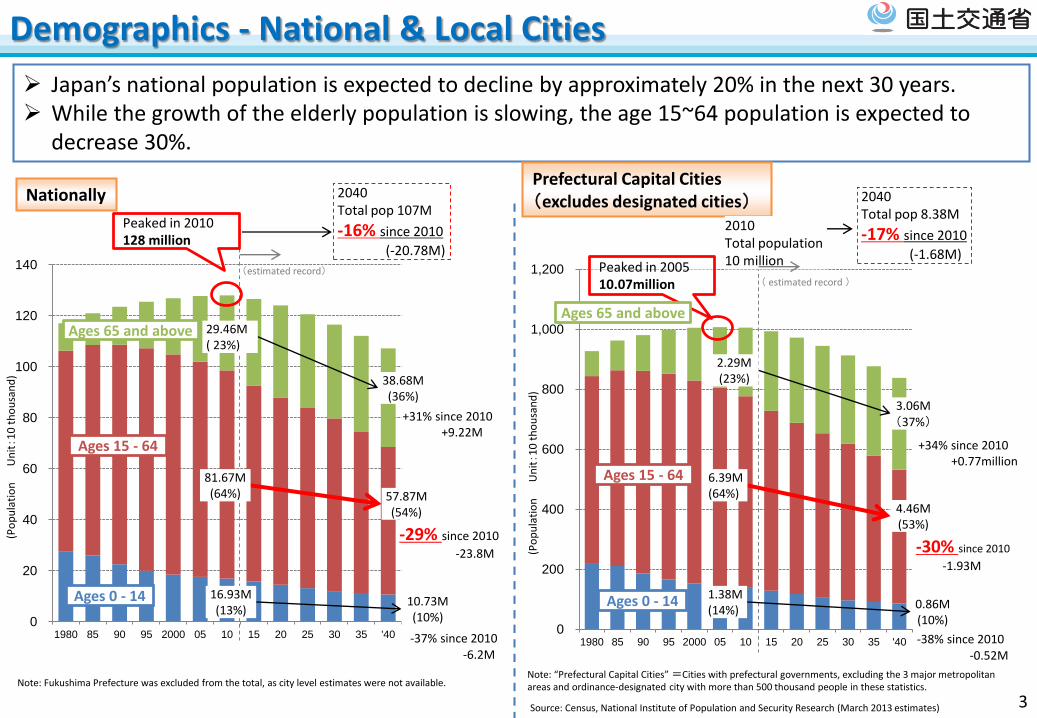
Japan’s national population is expected to decline by approximately 20% in the next 30 years. While the growth of the elderly population is slowing, the age 15~64 population is expected to
decrease 30%.
Note: Fukushima Prefecture was excluded from the total, as city level estimates were not available.
Source: Census, National Institute of Population and Security Research (March 2013 estimates)
Note: “Prefectural Capital Cities” =Cities with prefectural governments, excluding the 3 major metropolitan areas and ordinance-designated city with more than 500 thousand people in these statistics.
2040Total pop 107M
-16% since 2010
(-20.78M)
Nationally
Peaked in 2010128 million
29.46M( 23%)
81.67M(64%)
16.93M(13%)
Ages 65 and above
Ages 15 - 64
Ages 0 - 14 10.73M(10%)
57.87M(54%)
38.68M(36%)
+31% since 2010+9.22M
-29% since 2010
-23.8M
-37% since 2010-6.2M
0
200
400
600
800
1,000
1,200
1980 85 90 95 2000 05 10 15 20 25 30 35 '40
2040Total pop 8.38M
-17% since 2010
(-1.68M)
Prefectural Capital Cities(excludes designated cities)
Peaked in 200510.07million
2010Total population 10 million
2.29M(23%)
6.39M(64%)
1.38M(14%) 0.86M
(10%)
4.46M(53%)
3.06M(37%)
+34% since 2010+0.77million
-30% since 2010
-1.93M
-38% since 2010-0.52M
Demographics - National & Local Cities
3
(estimated record)( estimated record )
(Po
pu
lati
on
Un
it:
10
th
ou
san
d)
(Po
pu
lati
on
Un
it:
10
th
ou
san
d)
Ages 0 - 14
Ages 15 - 64
Ages 65 and above
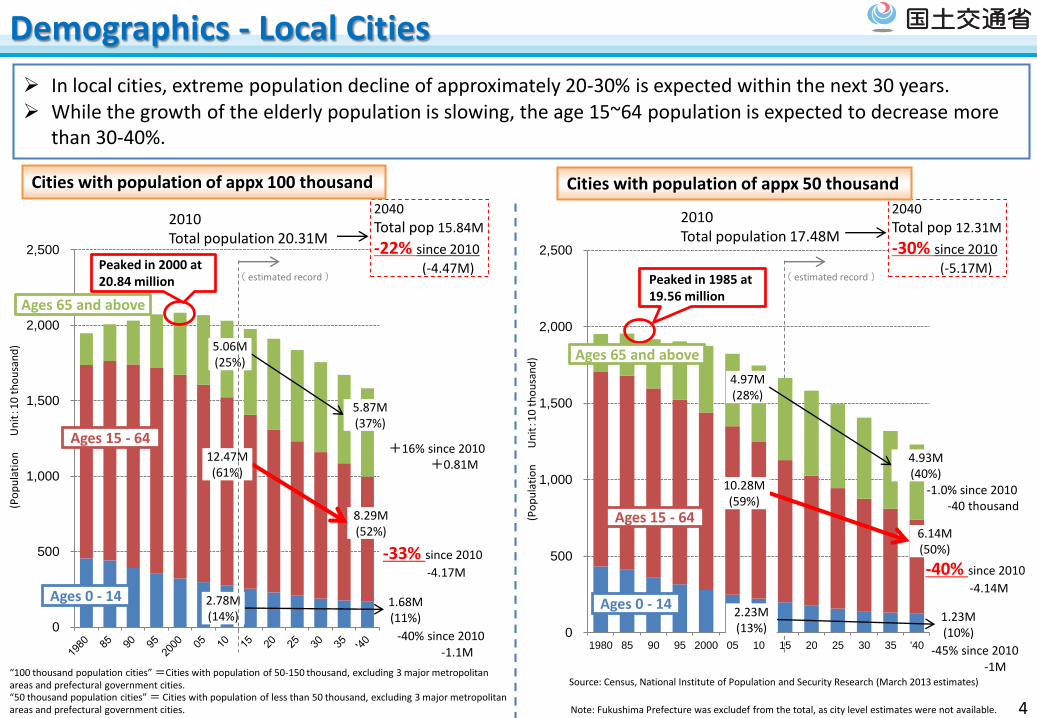
In local cities, extreme population decline of approximately 20-30% is expected within the next 30 years. While the growth of the elderly population is slowing, the age 15~64 population is expected to decrease more
than 30-40%.
0
500
1,000
1,500
2,000
2,500
1980 85 90 95 2000 05 10 15 20 25 30 35 '40
4.97M(28%)
10.28M(59%)
2.23M(13%)
-40% since 2010
-4.14M
2010Total population 17.48M
2040
Total pop 12.31M
-30% since 2010
(-5.17M)
Cities with population of appx 50 thousand
“50 thousand population cities” = Cities with population of less than 50 thousand, excluding 3 major metropolitan areas and prefectural government cities.
1.23M(10%)
6.14M(50%)
4.93M(40%)
-1.0% since 2010-40 thousand
-45% since 2010-1M
Peaked in 1985 at 19.56 million
0
500
1,000
1,500
2,000
2,500
5.06M(25%)
12.47M(61%)
2.78M(14%)
-33% since 2010
-4.17M
2010Total population 20.31M
2040
Total pop 15.84M
-22% since 2010
(-4.47M)
Cities with population of appx 100 thousand
Peaked in 2000 at 20.84 million
1.68M(11%)
8.29M(52%)
5.87M(37%)
+16% since 2010+0.81M
-40% since 2010-1.1M
“100 thousand population cities” =Cities with population of 50-150 thousand, excluding 3 major metropolitan areas and prefectural government cities.
Demographics - Local Cities
4
( estimated record ) ( estimated record )
Note: Fukushima Prefecture was excludef from the total, as city level estimates were not available.
Source: Census, National Institute of Population and Security Research (March 2013 estimates)
Ages 0 - 14 Ages 0 - 14
Ages 15 - 64
Ages 15 - 64
Ages 65 and above
Ages 65 and above
(Po
pu
lati
on
Un
it:
10
th
ou
san
d)
(Po
pu
lati
on
Un
it:
10
th
ou
san
d)
0
500
1,000
1,500
2,000
2,500
3,000
3,500
4,000
1980 85 90 95 2000 05 10 15 20 25 30 35 '400
500
1,000
1,500
2,000
2,500
3,000
3,500
4,000
1980 85 90 95 2000 05 10 15 20 25 30 35 '40
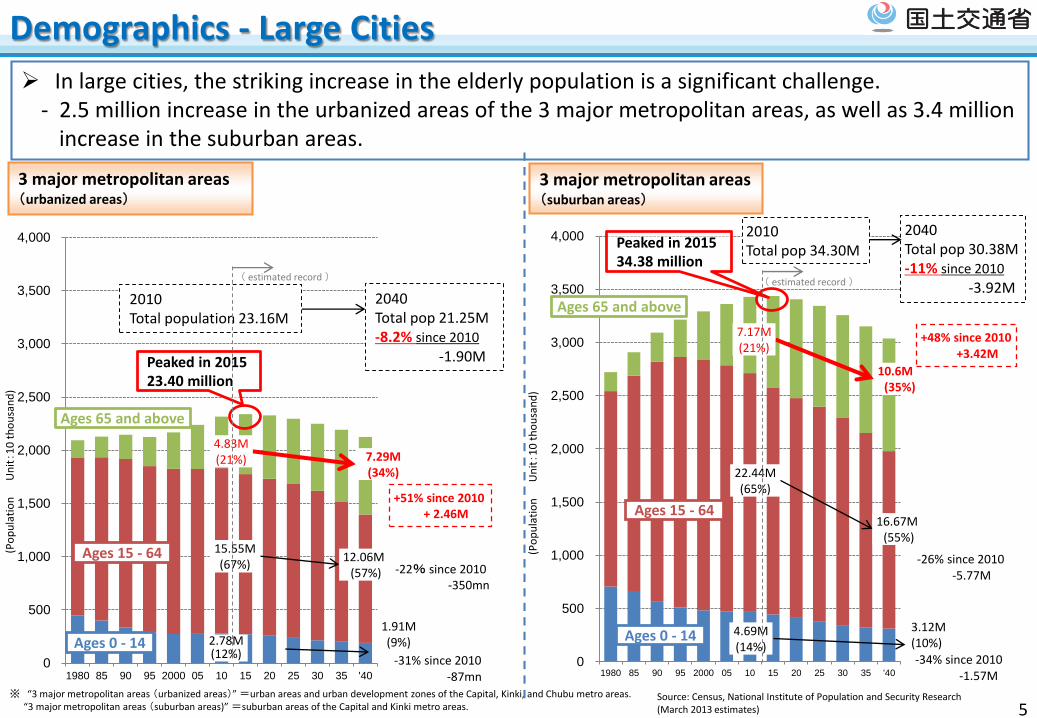
In large cities, the striking increase in the elderly population is a significant challenge. - 2.5 million increase in the urbanized areas of the 3 major metropolitan areas, as well as 3.4 million
increase in the suburban areas.
-31% since 2010-87mn
2040Total pop 21.25M-8.2% since 2010
-1.90M
3 major metropolitan areas(urbanized areas)
Peaked in 201523.40 million
-34% since 2010-1.57M
2040Total pop 30.38M-11% since 2010
-3.92M
3 major metropolitan areas(suburban areas)
Peaked in 201534.38 million
-22% since 2010-350mn
Source: Census, National Institute of Population and Security Research (March 2013 estimates)
※ “3 major metropolitan areas (urbanized areas)” =urban areas and urban development zones of the Capital, Kinki, and Chubu metro areas. “3 major metropolitan areas (suburban areas)” =suburban areas of the Capital and Kinki metro areas.
4.83M(21%)
15.55M(67%)
2.78M(12%)
2010Total population 23.16M
7.17M(21%)
22.44M(65%)
4.69M(14%)
5
1.91M(9%)
12.06M(57%)
7.29M(34%)
3.12M(10%)
16.67M(55%)
10.6M(35%)
+51% since 2010+ 2.46M
+48% since 2010+3.42M
-26% since 2010-5.77M
Demographics - Large Cities
Ages 0 - 14 Ages 0 - 14
Ages 15 - 64
Ages 15 - 64
Ages 65 and above
Ages 65 and above
(Po
pu
lati
on
Un
it:
10
th
ou
san
d)
(Po
pu
lati
on
Un
it:
10
th
ou
san
d)
2010Total pop 34.30M
( estimated record ) ( estimated record )
2. Challenges and Policy Direction
6
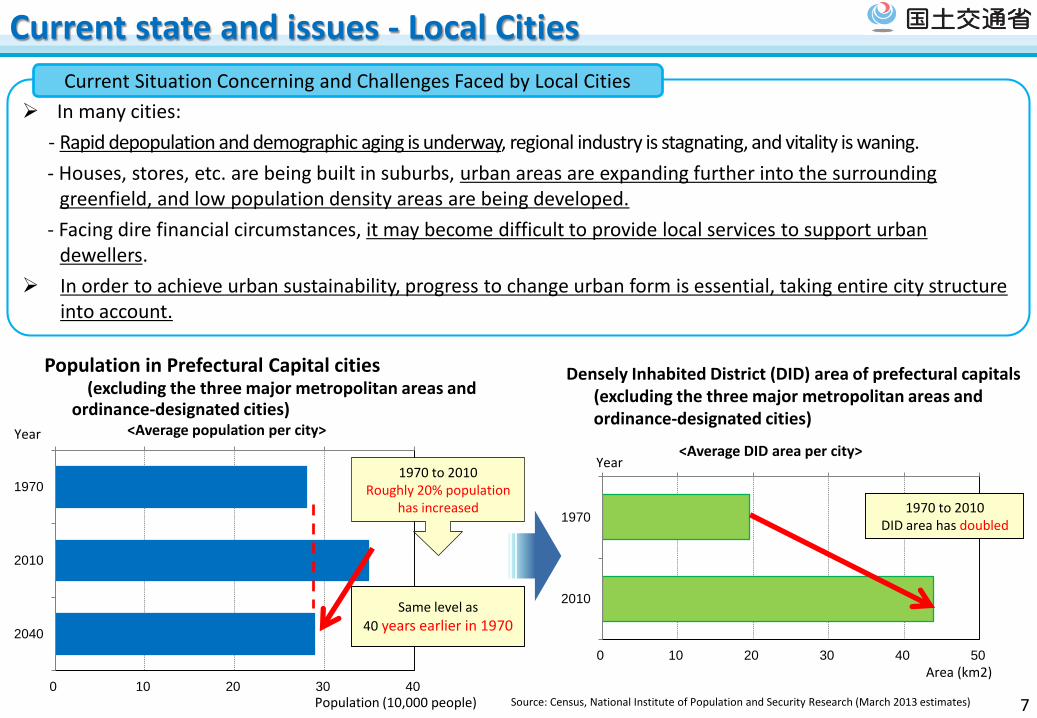
Current state and issues - Local Cities
0 10 20 30 40 50
1970
2010
0 10 20 30 40
1970
2010
2040
Population in Prefectural Capital cities(excluding the three major metropolitan areas and
ordinance-designated cities)
Population (10,000 people)
Year
Densely Inhabited District (DID) area of prefectural capitals (excluding the three major metropolitan areas and ordinance-designated cities)
Year
Area (km2)
1970 to 2010DID area has doubled
<Average population per city>
1970 to 2010Roughly 20% population
has increased
Same level as
40 years earlier in 1970
<Average DID area per city>
In many cities:
- Rapid depopulation and demographic aging is underway, regional industry is stagnating, and vitality is waning.
- Houses, stores, etc. are being built in suburbs, urban areas are expanding further into the surrounding greenfield, and low population density areas are being developed.
- Facing dire financial circumstances, it may become difficult to provide local services to support urban dewellers.
In order to achieve urban sustainability, progress to change urban form is essential, taking entire city structure into account.
Current Situation Concerning and Challenges Faced by Local Cities
7Source: Census, National Institute of Population and Security Research (March 2013 estimates)
0
20
40
60
80
100
120
0
2
4
6
8
10
12
1960 1965 1970 1975 1980 1985 1990 1995 2000 2005 2010 2015 2020 2025 2030 2035 2040
人口集中地区人口密度(人/
h
a)
15歳未満 15~64歳 65歳以上 総人口 DID人口密度(人/ha)
Demographics and urban areas of a typical case of local cities
8
(estimated record)
:1960 (year with highest DID population density after 1960)
:2005
Areas of DID (1996 vs 2005)Trends in population and density of DID
Standard for DID designation4 times
Ages 65 and above
Ages 15 - 64
Ages 0 - 14
1960
107 thousand
2010
105 thousand
2040
80 thousand
Central station
City Center
Source: Census, National Institute of Population and Security Research (March 2013 estimates)
DID population density (person/ha)
~ Case of city A (population appx. 100 thousand) ~
(Po
pu
lati
on
Un
it:
10
th
ou
san
d)
0-14 yrs 15-64 yrs
DID
po
pu
lati
on
den
sity
(p
erso
n/h
a)
65 + yrsTotal popu.
9
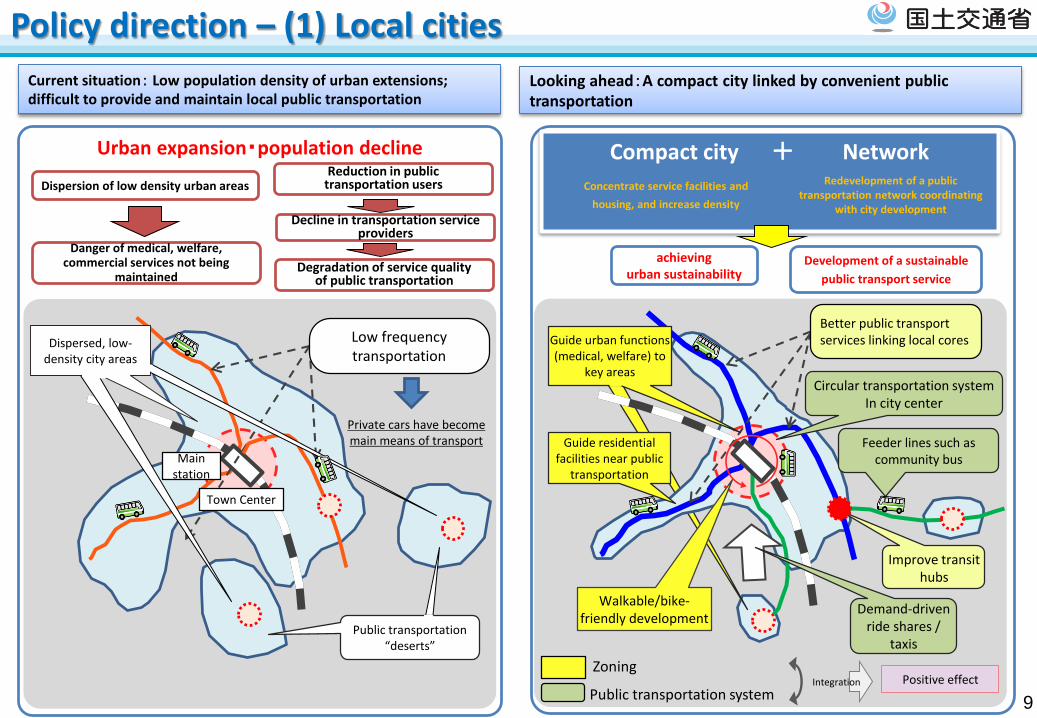
Current situation: Low population density of urban extensions; difficult to provide and maintain local public transportation
Looking ahead:A compact city linked by convenient public transportation
Urban expansion・population decline
Private cars have become main means of transport
Main station
Town Center
Public transportation “deserts”
Dispersed, low-density city areas
Low frequency transportation Z
Guide residential facilities near public
transportation
Guide urban functions (medical, welfare) to
key areasCircular transportation system
In city center
Walkable/bike-friendly development
Feeder lines such as community bus
Zoning
Public transportation system
Improve transit hubs
Better public transport services linking local cores
Positive effect
Demand-driven ride shares /
taxis
Compact city + Network
Development of a sustainable
public transport service
achieving urban sustainability
Policy direction – (1) Local cities
Dispersion of low density urban areas
Danger of medical, welfare, commercial services not being
maintainedDegradation of service quality
of public transportation
Decline in transportation service providers
Reduction in public transportation users Concentrate service facilities and
housing, and increase density
Redevelopment of a public transportation network coordinating
with city development
Integration
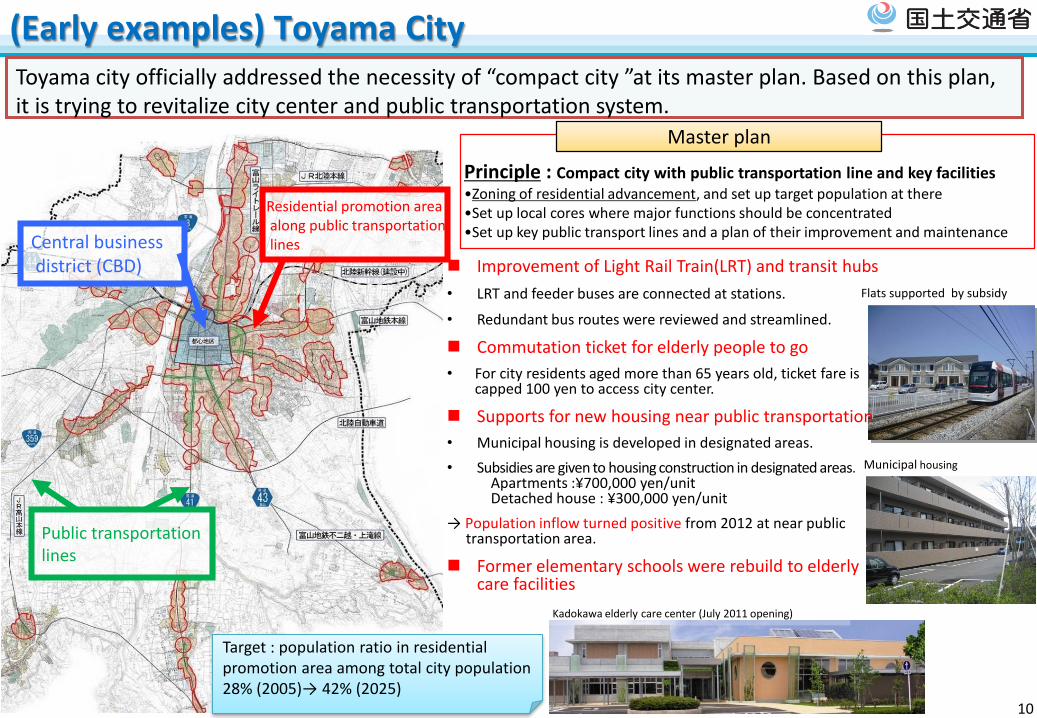
(Early examples) Toyama City
Residential promotion areaalong public transportationlinesCentral business
district (CBD)
Public transportationlines
Principle : Compact city with public transportation line and key facilities•Zoning of residential advancement, and set up target population at there•Set up local cores where major functions should be concentrated•Set up key public transport lines and a plan of their improvement and maintenance
Master plan
Toyama city officially addressed the necessity of “compact city ”at its master plan. Based on this plan, it is trying to revitalize city center and public transportation system.
Improvement of Light Rail Train(LRT) and transit hubs
• LRT and feeder buses are connected at stations.
• Redundant bus routes were reviewed and streamlined.
Commutation ticket for elderly people to go
• For city residents aged more than 65 years old, ticket fare is capped 100 yen to access city center.
Supports for new housing near public transportation
• Municipal housing is developed in designated areas.
• Subsidies are given to housing construction in designated areas. Apartments :¥700,000 yen/unitDetached house : ¥300,000 yen/unit
→ Population inflow turned positive from 2012 at near public transportation area.
Former elementary schools were rebuild to elderly care facilities
Flats supported by subsidy
Kadokawa elderly care center (July 2011 opening)
Municipal housing
Target : population ratio in residential promotion area among total city population 28% (2005)→ 42% (2025)
10
376
117
222
158
61
103
0
50
100
150
200
250
300
350
400
東京圏 名古屋圏 関西圏平成37年施設利用者数(推計)平成22年介護保険施設定員
Current State and Issues - Large Cities
11
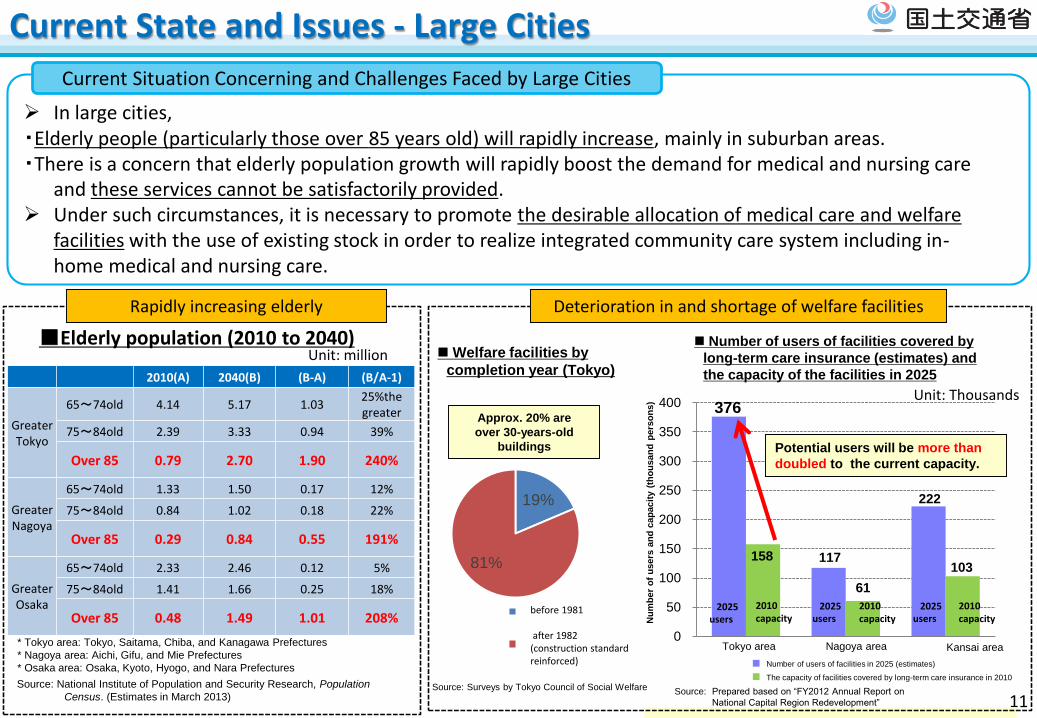
In large cities,・Elderly people (particularly those over 85 years old) will rapidly increase, mainly in suburban areas.・There is a concern that elderly population growth will rapidly boost the demand for medical and nursing care
and these services cannot be satisfactorily provided. Under such circumstances, it is necessary to promote the desirable allocation of medical care and welfare
facilities with the use of existing stock in order to realize integrated community care system including in-home medical and nursing care.
■Elderly population (2010 to 2040)
2010(A) 2040(B) (B-A) (B/A-1)
GreaterTokyo
65~74old 4.14 5.17 1.0325%the greater
75~84old 2.39 3.33 0.94 39%
Over 85 0.79 2.70 1.90 240%
Greater Nagoya
65~74old 1.33 1.50 0.17 12%
75~84old 0.84 1.02 0.18 22%
Over 85 0.29 0.84 0.55 191%
Greater Osaka
65~74old 2.33 2.46 0.12 5%
75~84old 1.41 1.66 0.25 18%
Over 85 0.48 1.49 1.01 208%2025
users2010capacity
2025users
2010capacity
2025 users
2010capacity
19%
81%
昭和56年以前
昭和57年以降
before 1981
after 1982(construction standard reinforced)
Current Situation Concerning and Challenges Faced by Large Cities
Source: National Institute of Population and Security Research, Population
Census. (Estimates in March 2013)
* Tokyo area: Tokyo, Saitama, Chiba, and Kanagawa Prefectures
* Nagoya area: Aichi, Gifu, and Mie Prefectures
* Osaka area: Osaka, Kyoto, Hyogo, and Nara Prefectures
Unit: million
Rapidly increasing elderly Deterioration in and shortage of welfare facilities
Unit: Thousands
Nu
mb
er
of
users
an
d c
ap
acit
y (
tho
usan
d p
ers
on
s)
Potential users will be more than
doubled to the current capacity.
Source: Prepared based on “FY2012 Annual Report on
National Capital Region Redevelopment”
Source: Surveys by Tokyo Council of Social Welfare
Tokyo area
Number of users of facilities in 2025 (estimates)
The capacity of facilities covered by long-term care insurance in 2010
Nagoya area Kansai area
Number of users of facilities covered by
long-term care insurance (estimates) and
the capacity of the facilities in 2025
Welfare facilities by
completion year (Tokyo)
Approx. 20% are
over 30-years-old
buildings
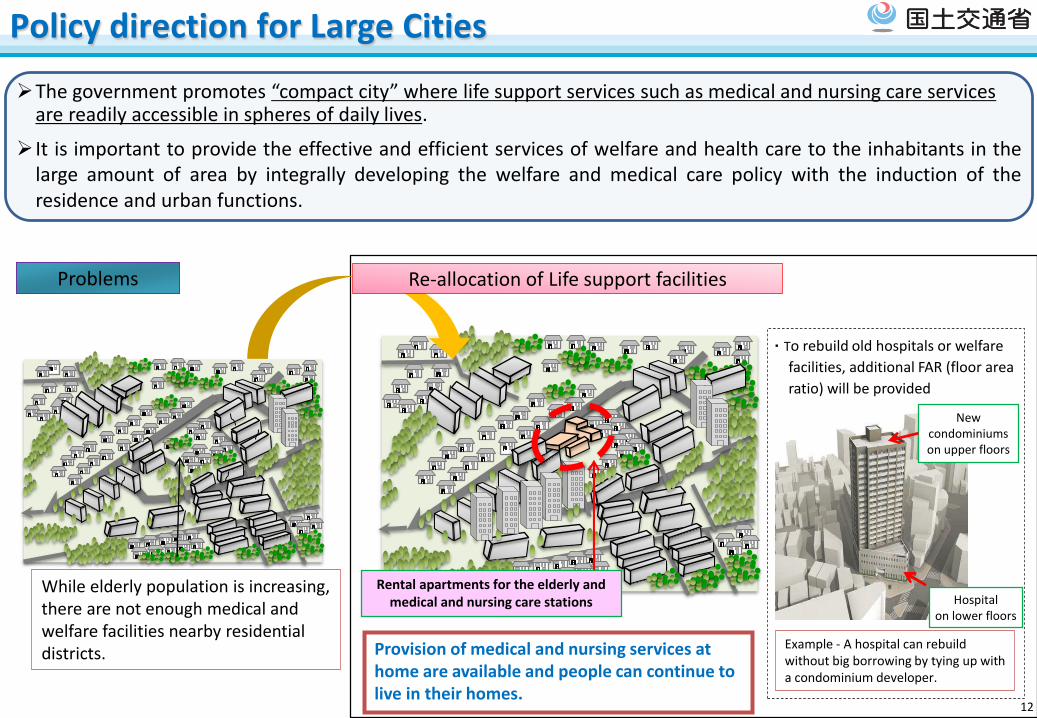
Policy direction for Large Cities
12
Hospitalon lower floors
New condominiumson upper floors
Example - A hospital can rebuild without big borrowing by tying up with a condominium developer.
・To rebuild old hospitals or welfare
facilities, additional FAR (floor area
ratio) will be provided
While elderly population is increasing, there are not enough medical and welfare facilities nearby residential districts.
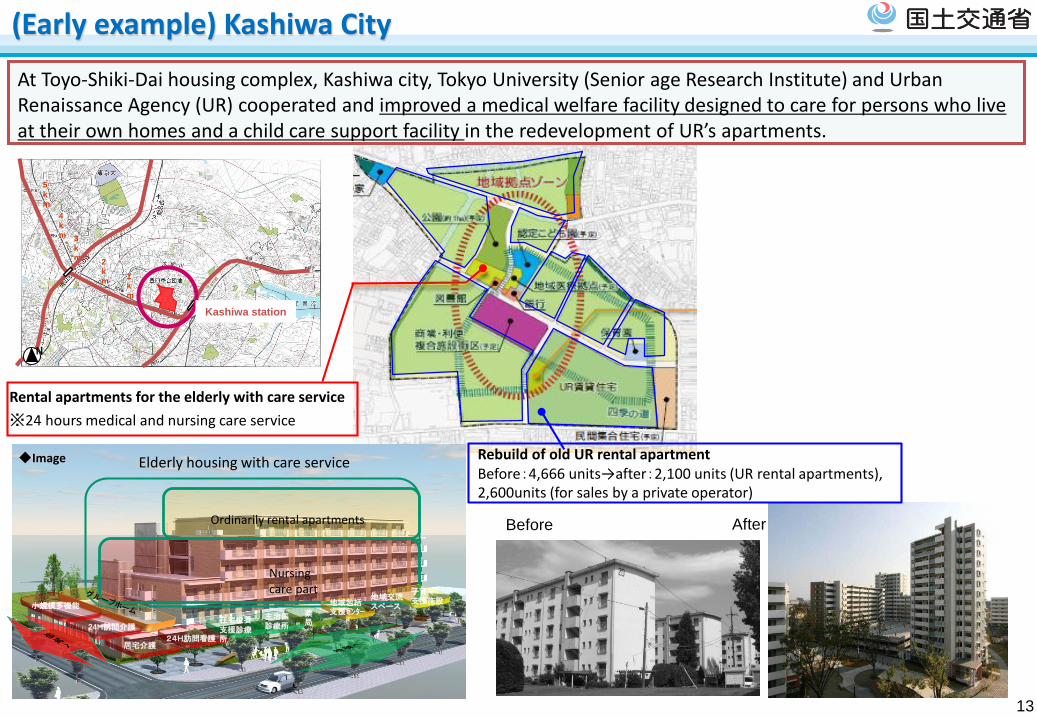
Rental apartments for the elderly and medical and nursing care stations
Problems Re-allocation of Life support facilities
Provision of medical and nursing services at home are available and people can continue to live in their homes.
The government promotes “compact city” where life support services such as medical and nursing care services are readily accessible in spheres of daily lives.
It is important to provide the effective and efficient services of welfare and health care to the inhabitants in thelarge amount of area by integrally developing the welfare and medical care policy with the induction of theresidence and urban functions.
Before After
Rebuild of old UR rental apartmentBefore:4,666 units→after:2,100 units (UR rental apartments), 2,600units (for sales by a private operator)
Elderly housing with care service
薬局
Ordinarily rental apartments
Nursing care part
居宅介護
小規模多機能
24H訪問看護
24H訪問介護
子育て支援施設
主治医診療所
在宅療養
支援診療所
地域包括支援センター
地域交流スペース
◆Image
Rental apartments for the elderly with care service
※24 hours medical and nursing care service
1
k
m
2
k
m
3
k
m
4
k
m
5
k
m
N
Kashiwa station
13
(Early example) Kashiwa City
At Toyo-Shiki-Dai housing complex, Kashiwa city, Tokyo University (Senior age Research Institute) and Urban Renaissance Agency (UR) cooperated and improved a medical welfare facility designed to care for persons who live at their own homes and a child care support facility in the redevelopment of UR’s apartments.
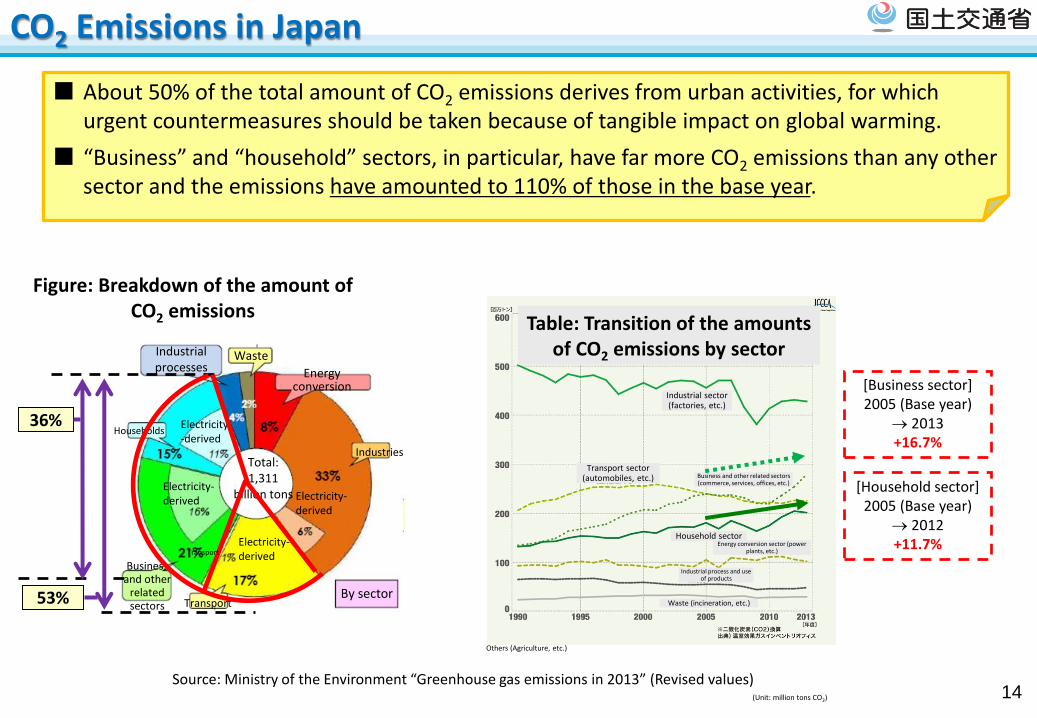
WasteIndustrial processes Energy
conversion
Electricity-derived
Electricity-derived
Electricity-derived
Electricity-derived
By sector
Business and other
related sectors
Households
Total: 1,311
billion tons
Industries
Transport
Industrial sector (factories, etc.)
Transport sector (automobiles, etc.) Business and other related sectors
(commerce, services, offices, etc.)
Energy conversion sector (power plants, etc.)
Industrial process and use of products
Waste (incineration, etc.)
Others (Agriculture, etc.)
(Unit: million tons CO2)
Household sector
53%
36%
Transport
Figure: Breakdown of the amount of CO2 emissions
About 50% of the total amount of CO2 emissions derives from urban activities, for which urgent countermeasures should be taken because of tangible impact on global warming.
“Business” and “household” sectors, in particular, have far more CO2 emissions than any other sector and the emissions have amounted to 110% of those in the base year.
Source: Ministry of the Environment “Greenhouse gas emissions in 2013” (Revised values)14
[Business sector]2005 (Base year)
2013+16.7%
[Household sector]2005 (Base year)
2012+11.7%
CO2 Emissions in Japan
Table: Transition of the amounts of CO2 emissions by sector
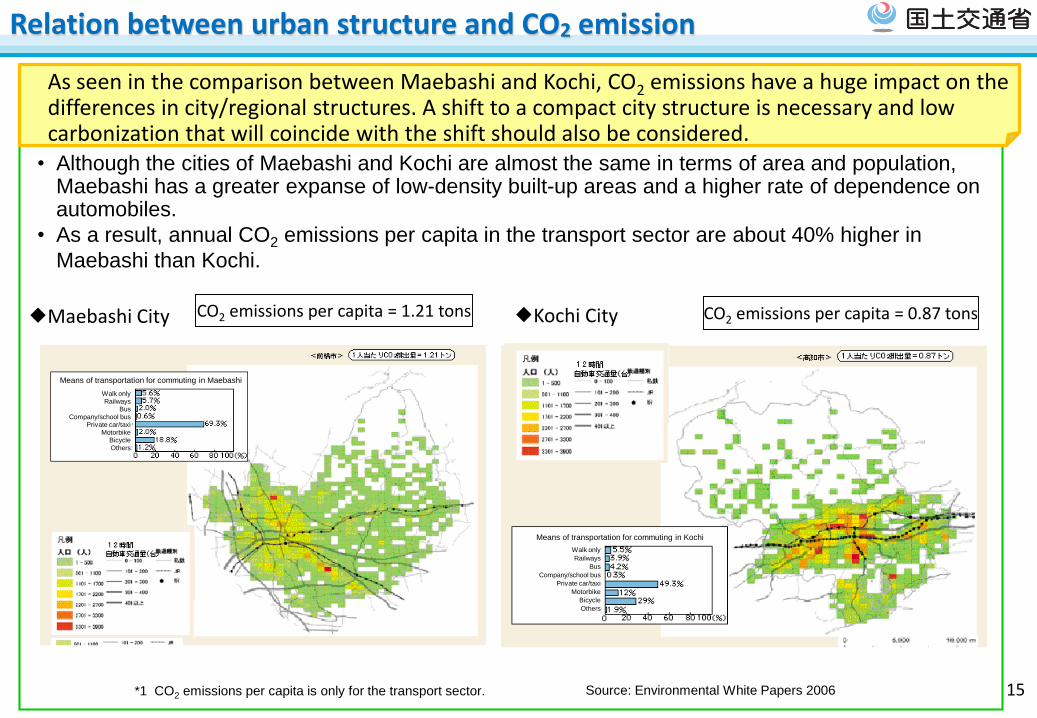
Means of transportation for commuting in Kochi
Walk only
Railways
Bus
Company/school bus
Private car/taxi
Motorbike
Bicycle
Others
Means of transportation for commuting in Maebashi
Walk onlyRailways
BusCompany/school bus
Private car/taxiMotorbike
BicycleOthers
• Although the cities of Maebashi and Kochi are almost the same in terms of area and population, Maebashi has a greater expanse of low-density built-up areas and a higher rate of dependence on automobiles.
• As a result, annual CO2 emissions per capita in the transport sector are about 40% higher in
Maebashi than Kochi.
Maebashi City Kochi CityCO2 emissions per capita = 1.21 tons CO2 emissions per capita = 0.87 tons
*1 CO2 emissions per capita is only for the transport sector. Source: Environmental White Papers 2006
As seen in the comparison between Maebashi and Kochi, CO2 emissions have a huge impact on the differences in city/regional structures. A shift to a compact city structure is necessary and low carbonization that will coincide with the shift should also be considered.
15
Relation between urban structure and CO2 emission
3. Compact City Measures
16
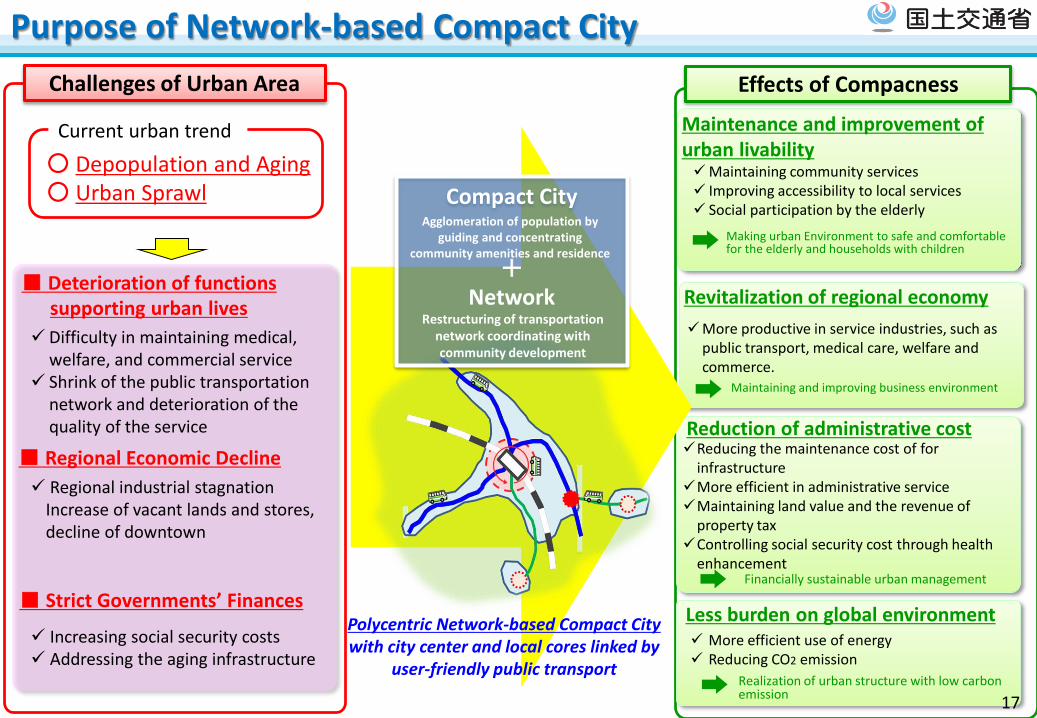
Purpose of Network-based Compact City
Difficulty in maintaining medical, welfare, and commercial service
Shrink of the public transportation network and deterioration of the quality of the service
■ Regional Economic Decline
■ Deterioration of functions supporting urban lives
Regional industrial stagnation Increase of vacant lands and stores, decline of downtown
Increasing social security costs Addressing the aging infrastructure
■ Strict Governments’ Finances
Challenges of Urban Area Effects of Compacness
Maintenance and improvement of urban livabilityMaintaining community services Improving accessibility to local services Social participation by the elderly
Revitalization of regional economy
More productive in service industries, such as public transport, medical care, welfare and commerce.
Reduction of administrative costReducing the maintenance cost of for
infrastructureMore efficient in administrative serviceMaintaining land value and the revenue of
property taxControlling social security cost through health
enhancement
Less burden on global environment
Compact CityAgglomeration of population by
guiding and concentrating community amenities and residence
Restructuring of transportation network coordinating with community development
+Network
More efficient use of energy Reducing CO2 emission
Polycentric Network-based Compact City with city center and local cores linked by
user-friendly public transport
Making urban Environment to safe and comfortable for the elderly and households with children
Maintaining and improving business environment
Financially sustainable urban management
Realization of urban structure with low carbon emission
○ Depopulation and Aging○ Urban Sprawl
Current urban trend
17
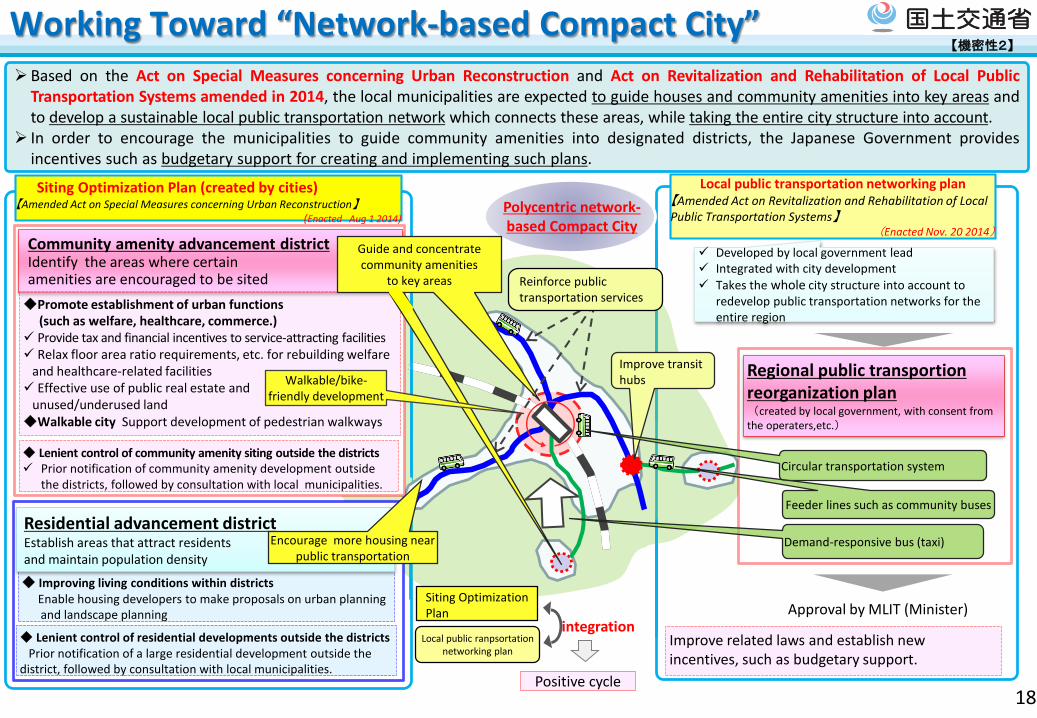
【機密性2】
◆ Lenient control of residential developments outside the districtsPrior notification of a large residential development outside the
district, followed by consultation with local municipalities.
Working Toward “Network-based Compact City”Based on the Act on Special Measures concerning Urban Reconstruction and Act on Revitalization and Rehabilitation of Local Public
Transportation Systems amended in 2014, the local municipalities are expected to guide houses and community amenities into key areas andto develop a sustainable local public transportation network which connects these areas, while taking the entire city structure into account.
In order to encourage the municipalities to guide community amenities into designated districts, the Japanese Government providesincentives such as budgetary support for creating and implementing such plans.
Siting Optimization Plan (created by cities)【Amended Act on Special Measures concerning Urban Reconstruction】
(Enacted Aug 1 2014)
◆ Lenient control of community amenity siting outside the districts Prior notification of community amenity development outside
the districts, followed by consultation with local municipalities.
◆ Improving living conditions within districtsEnable housing developers to make proposals on urban planning and landscape planning
Residential advancement districtEstablish areas that attract residents and maintain population density
Community amenity advancement districtIdentify the areas where certain amenities are encouraged to be sited
◆Promote establishment of urban functions (such as welfare, healthcare, commerce.)
Provide tax and financial incentives to service-attracting facilities Relax floor area ratio requirements, etc. for rebuilding welfare
and healthcare-related facilities Effective use of public real estate and
unused/underused land◆Walkable city Support development of pedestrian walkways
Local public transportation networking plan【Amended Act on Revitalization and Rehabilitation of Local Public Transportation Systems】
(Enacted Nov. 20 2014)
Developed by local government lead Integrated with city development
Takes the whole city structure into account to redevelop public transportation networks for the entire region
Approval by MLIT (Minister)
Improve related laws and establish new incentives, such as budgetary support.
Regional public transportionreorganization plan(created by local government, with consent from the operaters,etc.)
Reinforce public transportation services
Improve transit hubs
ZGuide and concentrate community amenities
to key areas
Walkable/bike-friendly development
Circular transportation system
Feeder lines such as community buses
Demand-responsive bus (taxi)
Siting Optimization Plan
Local public ranpsortation networking plan
integration
Positive cycle
Polycentric network-based Compact City
18
Encourage more housing near public transportation
4. Efforts for Policy Coordination
19
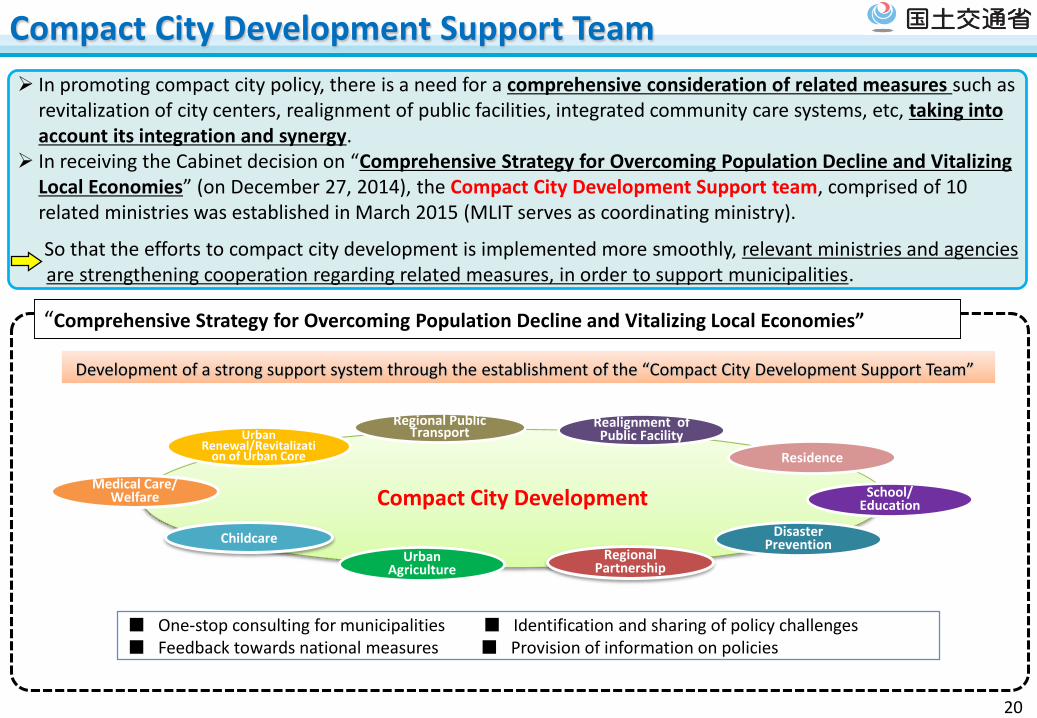
■ One-stop consulting for municipalities ■ Identification and sharing of policy challenges■ Feedback towards national measures ■ Provision of information on policies
Compact City Development Support Team
Development of a strong support system through the establishment of the “Compact City Development Support Team”
20
In promoting compact city policy, there is a need for a comprehensive consideration of related measures such as revitalization of city centers, realignment of public facilities, integrated community care systems, etc, taking into account its integration and synergy.
In receiving the Cabinet decision on “Comprehensive Strategy for Overcoming Population Decline and Vitalizing Local Economies” (on December 27, 2014), the Compact City Development Support team, comprised of 10 related ministries was established in March 2015 (MLIT serves as coordinating ministry).
So that the efforts to compact city development is implemented more smoothly, relevant ministries and agencies are strengthening cooperation regarding related measures, in order to support municipalities.
“Comprehensive Strategy for Overcoming Population Decline and Vitalizing Local Economies”
Compact City Development
Urban Renewal/Revitalizati
on of Urban Core
Medical Care/ Welfare
Disaster Prevention
Urban Agriculture
Residence
Realignment of Public Facility
Regional Public Transport
School/Education
ChildcareRegional
Partnership
連携
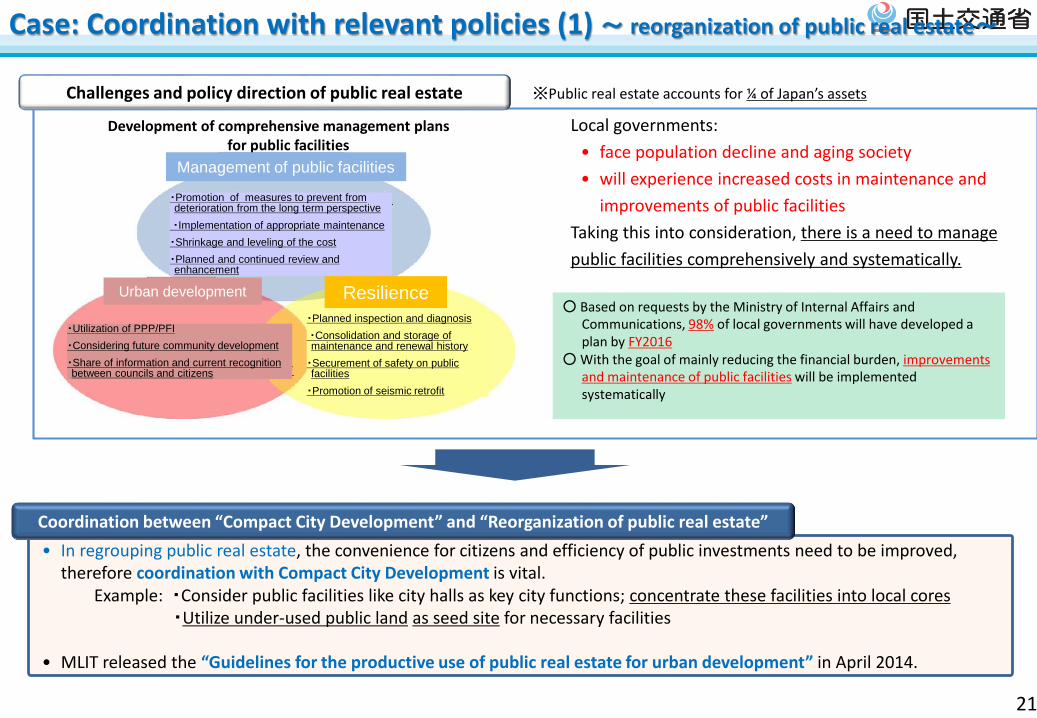
• In regrouping public real estate, the convenience for citizens and efficiency of public investments need to be improved, therefore coordination with Compact City Development is vital.
Example: ・Consider public facilities like city halls as key city functions; concentrate these facilities into local cores・Utilize under-used public land as seed site for necessary facilities
• MLIT released the “Guidelines for the productive use of public real estate for urban development” in April 2014.
Coordination between “Compact City Development” and “Reorganization of public real estate”
Case: Coordination with relevant policies (1) ~ reorganization of public real estate~
Local governments:
• face population decline and aging society
• will experience increased costs in maintenance and
improvements of public facilities
Taking this into consideration, there is a need to manage
public facilities comprehensively and systematically.
○ Based on requests by the Ministry of Internal Affairs and Communications, 98% of local governments will have developed a plan by FY2016
○ With the goal of mainly reducing the financial burden, improvements and maintenance of public facilities will be implemented systematically
Challenges and policy direction of public real estate
Development of comprehensive management plans for public facilities
※Public real estate accounts for ¼ of Japan’s assets
21
ResilienceUrban development
Management of public facilities
・Utilization of PPP/PFI
・Considering future community development
・Share of information and current recognition between councils and citizens
・Planned inspection and diagnosis
・Consolidation and storage of maintenance and renewal history
・Securement of safety on public facilities
・Promotion of seismic retrofit
・Promotion of measures to prevent from deterioration from the long term perspective
・Implementation of appropriate maintenance
・Shrinkage and leveling of the cost
・Planned and continued review and enhancement
Prior
land use
Current or future
land useProcurement Land owner
Atago E.S. Toyama Yuho H.S. Public Prefecture
Yasunoya E.S.Toyama Chubu H.S.
Sub-groundPublic
Prefecture and
City
Sogawa E.S.
Hub facility for regional
medical and care
(in consideration)
In Consideration City
Hachininmachi
E.S.
City education center
(temporary)
Use of existing
facilityCity
Hoshii-cho E.SKadokawa care prevention
center etc.
Public own and
private operationCity
Gobanmachi E.S. Chuo E.S. PFI City
Shimizumachi E.S.Supermarket, pharmacy,
community center, etc.PPP with proposal
City(The city is a
fixed-term
leaseholder on
private facilities
商業店舗等(予定)シネマコンプレックス、ホテル等
市街地再開発事業
民有地
商業店舗等(予定)市立図書館、ガラス美
術館、銀行等市街地再開発事業
民有地To
yama Ligh
t Rail
Shibazono E.S.
Chuo E.S.
Promotion of Compact City→Promoting Compact City by vitalizing public transportation and
encouraging people to live near public transport facilities
Development of necessary urban function・Vitalized the downtown area by utilizing closed elementary
school sites for necessary urban functions
[City of Toyama] Case of community development with PRE on old elementary school sites
Closed elementary school Care prevention centerMAP: Downtown area in the City of Toyama
Source: City of Toyama
22
Example: Coordination on reorganization of public real estate ~Toyama city~
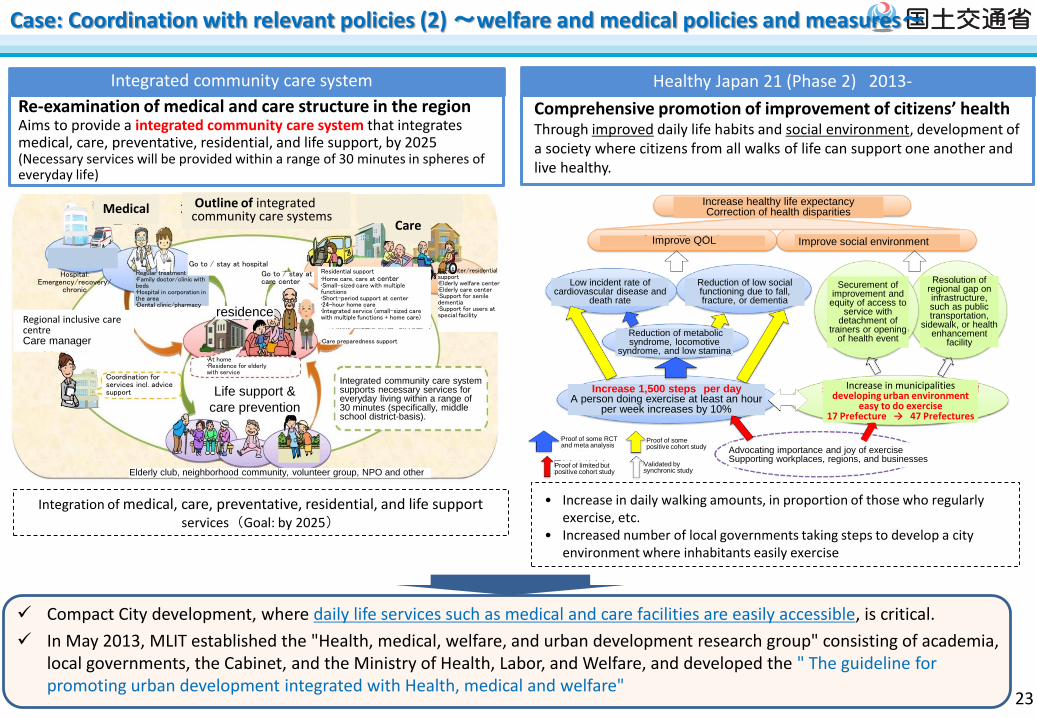
Re-examination of medical and care structure in the regionAims to provide a integrated community care system that integrates medical, care, preventative, residential, and life support, by 2025(Necessary services will be provided within a range of 30 minutes in spheres of everyday life)
Integrated community care system
Integration of medical, care, preventative, residential, and life supportservices(Goal: by 2025)
Compact City development, where daily life services such as medical and care facilities are easily accessible, is critical.
In May 2013, MLIT established the "Health, medical, welfare, and urban development research group" consisting of academia, local governments, the Cabinet, and the Ministry of Health, Labor, and Welfare, and developed the " The guideline for promoting urban development integrated with Health, medical and welfare"
Case: Coordination with relevant policies (2) ~welfare and medical policies and measures~
Comprehensive promotion of improvement of citizens’ healthThrough improved daily life habits and social environment, development of a society where citizens from all walks of life can support one another and live healthy.
• Increase in daily walking amounts, in proportion of those who regularly exercise, etc.
• Increased number of local governments taking steps to develop a city environment where inhabitants easily exercise
Healthy Japan 21 (Phase 2) 2013-
23
Outline of integrated community care systems
MedicalCare
residence
Life support &
care prevention
Increase healthy life expectancyCorrection of health disparities
Improve QOL Improve social environment
Regional inclusive care centreCare manager
Reduction of metabolic syndrome, locomotive
syndrome, and low stamina
Low incident rate of cardiovascular disease and
death rate
Reduction of low social functioning due to fall, fracture, or dementia
Securement of improvement and
equity of access to service with
detachment of trainers or opening
of health event
Resolution of regional gap on infrastructure, such as public transportation,
sidewalk, or health enhancement
facility
Increase in municipalities developing urban environment
easy to do exercise17 Prefecture → 47 Prefectures
Increase 1,500 steps per dayA person doing exercise at least an hour
per week increases by 10%
Advocating importance and joy of exerciseSupporting workplaces, regions, and businesses
Proof of some RCT and meta analysis
Proof of some positive cohort study
Validated by synchronic study
Proof of limited but positive cohort study
Hospital:Emergency/recovery/
chronic
Regular treatment•Family doctor/clinic with beds•Hospital in corporation in the area•Dental clinic/pharmacy
Go to / stay at hospitalGo to / stay at care center
Residential support•Home care, care at center•Small-sized care with multiple functions•Short-period support at center•24-hour home care•Integrated service (small-sized care with multiple functions + home care)
At-center/residential support•Elderly welfare center•Elderly care center•Support for senile dementia•Support for users at special facility
Coordination for services incl. advice support
•At home•Residence for elderly with service
Integrated community care system supports necessary services for everyday living within a range of 30 minutes (specifically, middle school district-basis).
Elderly club, neighborhood community, volunteer group, NPO and other
•Care preparedness support
Conclusion
Urban policy in Japan has focused on controlling the development pressure in the suburb with regulatoryapproaches. Given the rapid depopulation, the effort of transforming urban sprawl area into the compact urbanform as well as with inductive approaches, is needed, taking the entire city structure into account.
Therefore, the government introduced ”Siting Optimization Plan” scheme in 2014 and promote to guide andconcentrate residential and urban functional locations with the moderate development control and inductivemethods such as the economic incentive and the deregulation.
Urban compactness is, through clustering residential and community amenities and realizing “Economies ofDensity”, an effective policy method of achieving multiple goals: maintenance of livability, revitalization of regionaleconomy, and reduction of administrative costs by making public services more efficient.
276 municipalities are taking action to develop the siting optimization plan (as of March 2016).
To increase effects of the compact city policy, an integrated approach, coordinating urban planning with relevantpolicy fields, such as medical care, welfare, public transportation, housing, and realignment of public facilities, isessential.
To support municipalities, a main actor for urban policy, to develop effective strategies based on the integratedapproach, the “Compact City Support Team” which is constituted by ten governmental agencies was set up.Through this framework, the government will support municipal efforts in the following methods.
Striving to enhance policies in accordance with challenges and needs Identifying excellent efforts as a best practice, and providing the persuasive information about the specific
cases and the effects
24
25
Thank you for your attention!
City Planning Division, City Bureau, Ministry of Land, Infrastructure, Transport and Tourism2-1-3 Kasumigaseki Chiyoda-ku Tokyo 100-8918 Japan
http://www.mlit.go.jp/en/index.html