Embed Size (px)
Citation preview

Measures of Central Tendency10-3
Warm UpWarm Up
Lesson PresentationLesson Presentation
Problem of the DayProblem of the Day
Lesson QuizzesLesson Quizzes
Measures of Central Tendency10-3
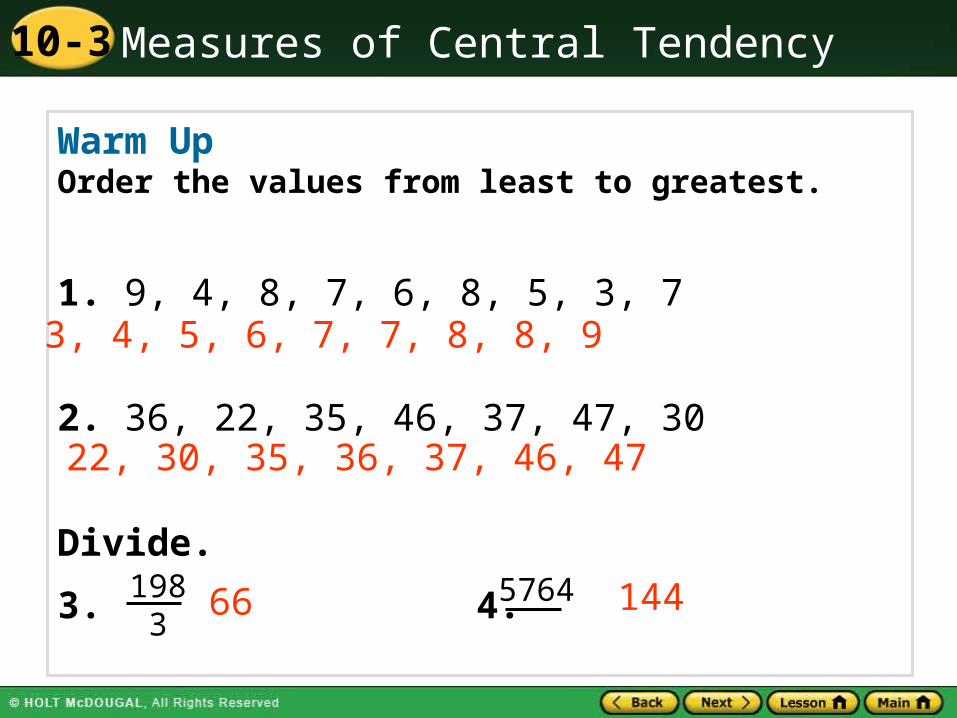
Warm UpOrder the values from least to greatest.
1. 9, 4, 8, 7, 6, 8, 5, 3, 7
2. 36, 22, 35, 46, 37, 47, 30
Divide.
3. 4.
3, 4, 5, 6, 7, 7, 8, 8, 9
22, 30, 35, 36, 37, 46, 47
661983
5764
144
Measures of Central Tendency10-3
Problem of the Day
A mom buys a white, a green, a blue, and a yellow sweater for her 4 children. Bill and Bob refuse to wear yellow. Barb doesn’t like green, and Beth hates green and white. Mom will not put the boys in white, and Bob wont wear blue. Which sweater will each child wear? Barb:iwhite, Beth:iyellow,
Bob:igreen, Bill:iblue
Measures of Central Tendency10-3
MA.8.S.3.2 Determine and describe how changes in data values impact measures of central tendency.
Sunshine State Standards
Measures of Central Tendency10-3
Vocabulary
meanmedianmoderangeoutlier
Measures of Central Tendency10-3
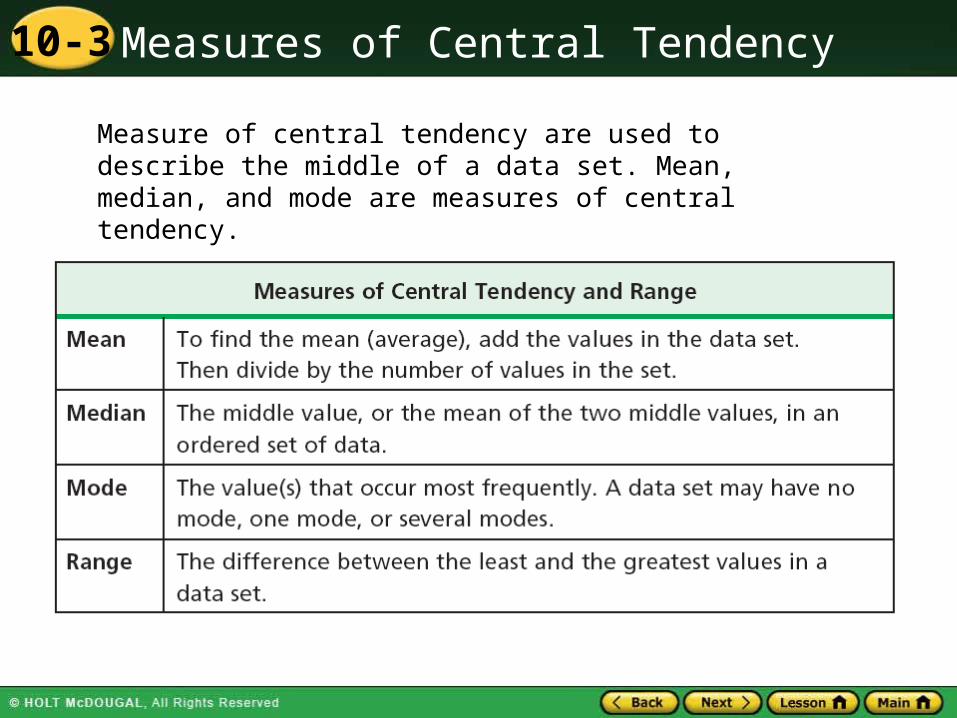
Measure of central tendency are used to describe the middle of a data set. Mean, median, and mode are measures of central tendency.
Measures of Central Tendency10-3
An outlier is a value that is either far less than or far greater than the rest of the values in the data.
Measures of Central Tendency10-3
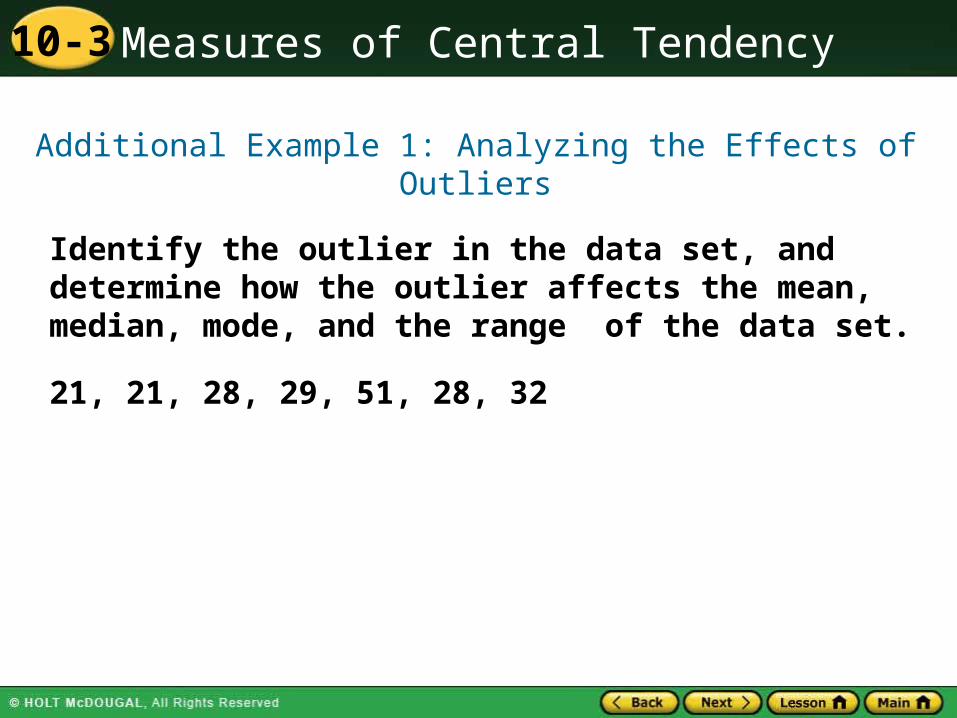
21, 21, 28, 29, 51, 28, 32
Additional Example 1: Analyzing the Effects of Outliers
Identify the outlier in the data set, and determine how the outlier affects the mean, median, mode, and the range of the data set.
Measures of Central Tendency10-3
21, 21, 28, 29, 51, 28, 32
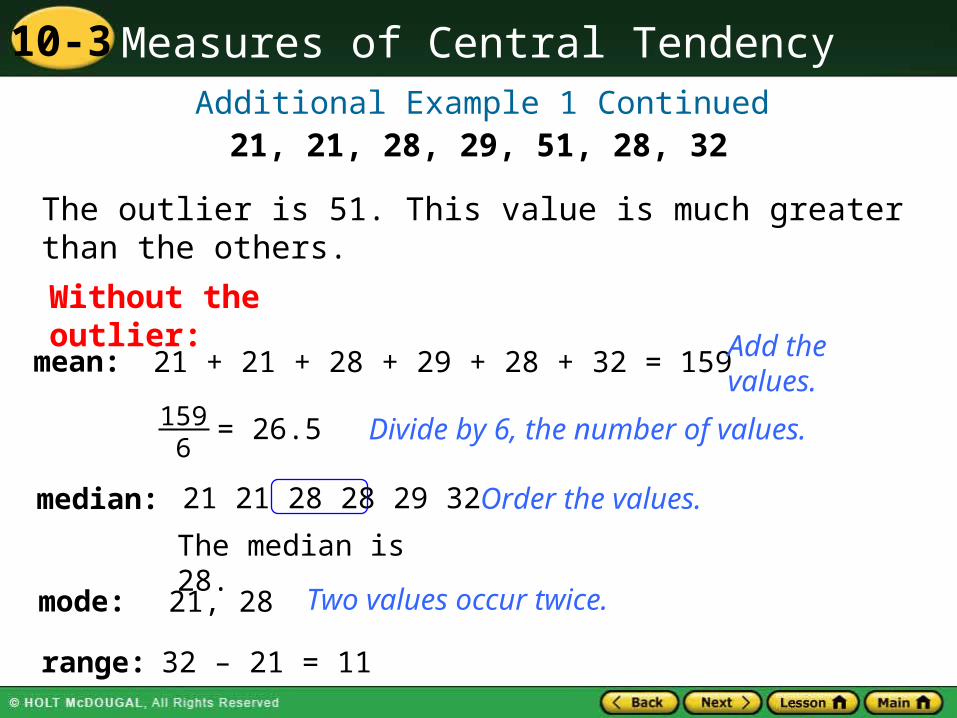
mean: 21 + 21 + 28 + 29 + 28 + 32 = 159 Add the values.
Divide by 6, the number of values.1596
= 26.5
median: 21 21 28 28 29 32 Order the values.
mode: Two values occur twice.
The median is 28.
21, 28
Additional Example 1 Continued
range: 32 – 21 = 11
The outlier is 51. This value is much greater than the others.
Without the outlier:
Measures of Central Tendency10-3
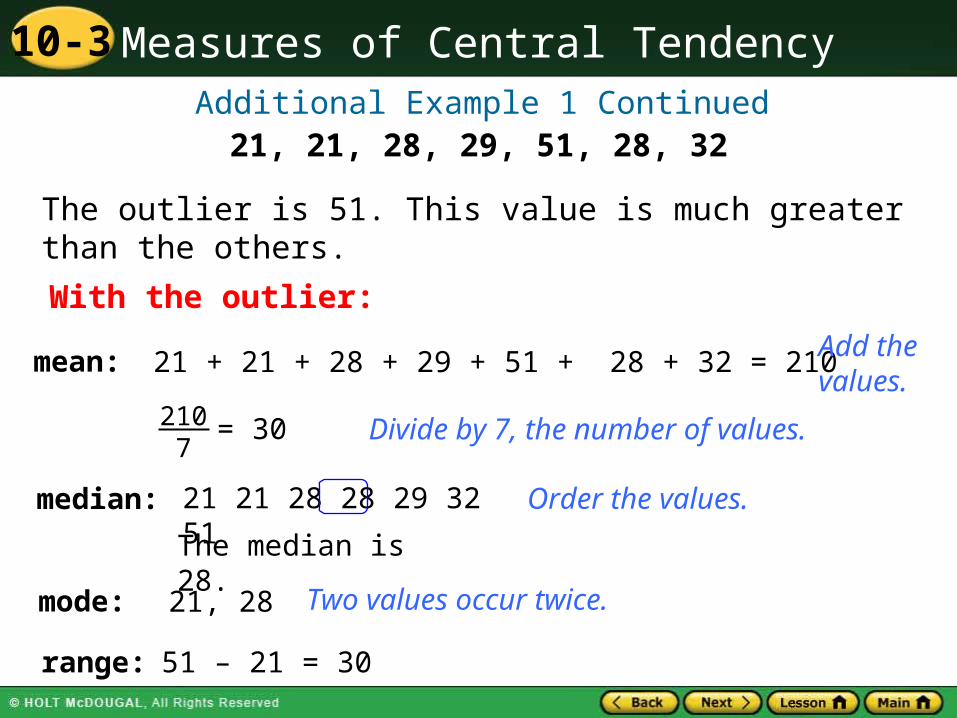
21, 21, 28, 29, 51, 28, 32
mean: 21 + 21 + 28 + 29 + 51 + 28 + 32 = 210 Add the values.
Divide by 7, the number of values.2107
= 30
median: 21 21 28 28 29 32 51 Order the values.
mode: Two values occur twice.
The median is 28.
21, 28
Additional Example 1 Continued
range: 51 – 21 = 30
The outlier is 51. This value is much greater than the others.
With the outlier:
Measures of Central Tendency10-3
21, 21, 28, 29, 51, 28, 32Additional Example 1 Continued
The outlier increases the mean by 3.5 and the range by 19. It has no effect on the median or modes.
Measures of Central Tendency10-3
4, 12, 7, 5, 20, 9
Check It Out: Example 1A
Identify the outlier in the data set, and determine how the outlier affects the mean, median, mode, and range of the data.
Measures of Central Tendency10-3
4, 12, 7, 5, 20, 9
Check It Out: Example 1A Continued
The outlier is 20. It increases the mean by 2.1, the median by 1, and the range by 8. It has no effect on the mode (still no mode).
Measures of Central Tendency10-3
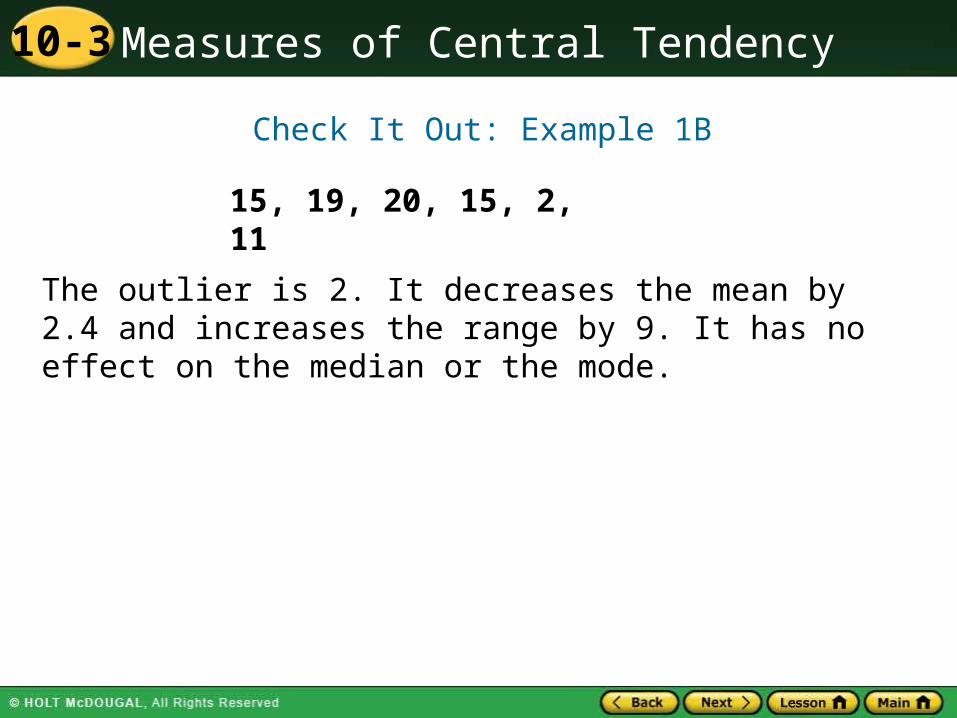
15, 19, 20, 15, 2, 11
Check It Out: Example 1B
The outlier is 2. It decreases the mean by 2.4 and increases the range by 9. It has no effect on the median or the mode.

Measures of Central Tendency10-3
Additional Example 2: Analyzing the Effect of Changing Data
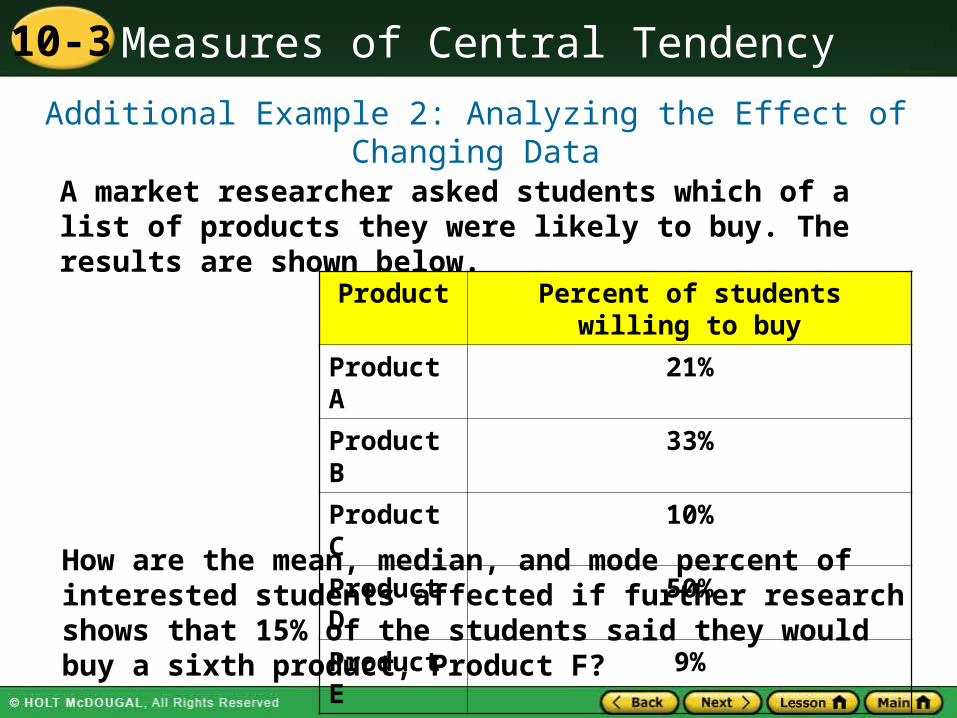
A market researcher asked students which of a list of products they were likely to buy. The results are shown below.
How are the mean, median, and mode percent of interested students affected if further research shows that 32% of the students said they would buy a sixth product, Product F?
Product Percent of students willing to buy
Product A 48%
Product B 25%
Product C 32%
Product D 42%
Product E 19%
Measures of Central Tendency10-3
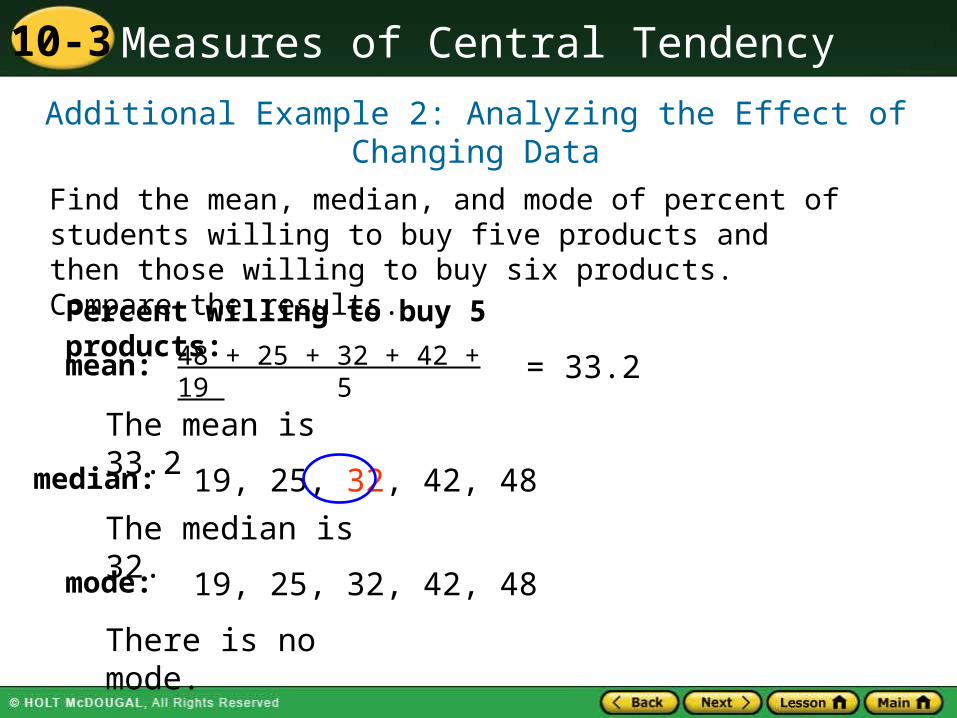
Find the mean, median, and mode of percent of students willing to buy five products and then those willing to buy six products. Compare the results.
mean: 48 + 25 + 32 + 42 + 19 5
= 33.2
median: 19, 25, 32, 42, 48
mode: 19, 25, 32, 42, 48
There is no mode.
Percent willing to buy 5 products:
The median is 32.
The mean is 33.2
Additional Example 2: Analyzing the Effect of Changing Data
Measures of Central Tendency10-3
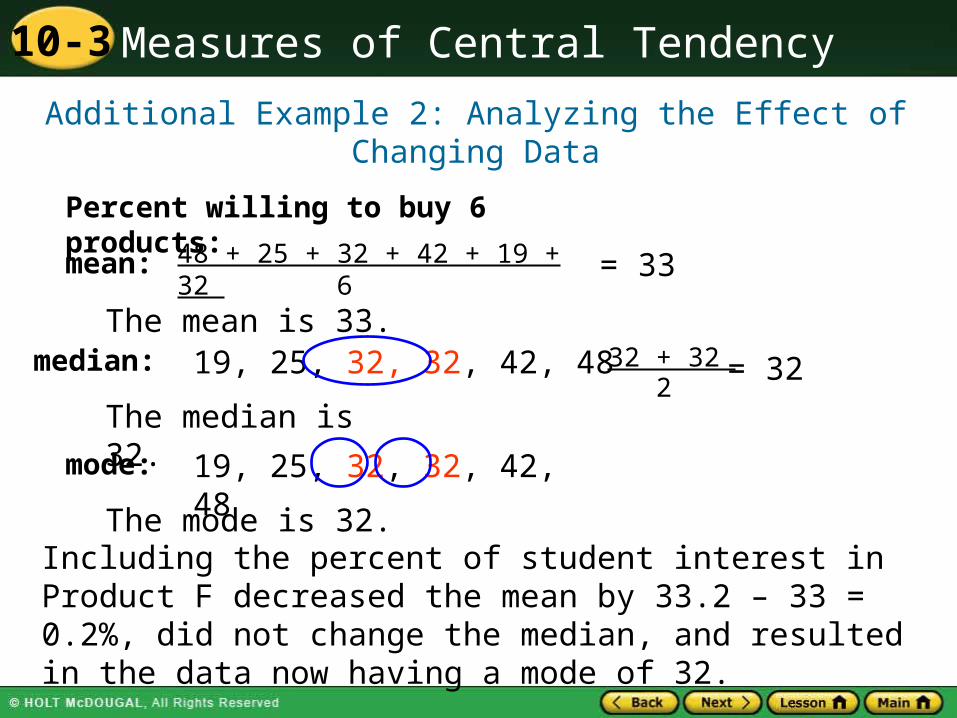
mean: 48 + 25 + 32 + 42 + 19 + 32 6
= 33
median: 19, 25, 32, 32, 42, 48
mode: 19, 25, 32, 32, 42, 48
The mode is 32.
Percent willing to buy 6 products:
The median is 32.
The mean is 33.32 + 32
2= 32
Including the percent of student interest in Product F decreased the mean by 33.2 – 33 = 0.2%, did not change the median, and resulted in the data now having a mode of 32.
Additional Example 2: Analyzing the Effect of Changing Data
Measures of Central Tendency10-3
Additional Example 2: Analyzing the Effect of Changing Data
A market researcher asked students which of a list of products they were likely to buy. The results are shown below.
How are the mean, median, and mode percent of interested students affected if further research shows that 15% of the students said they would buy a sixth product, Product F?
Product Percent of students willing to buy
Product A 21%
Product B 33%
Product C 10%
Product D 50%
Product E 9%
Measures of Central Tendency10-3
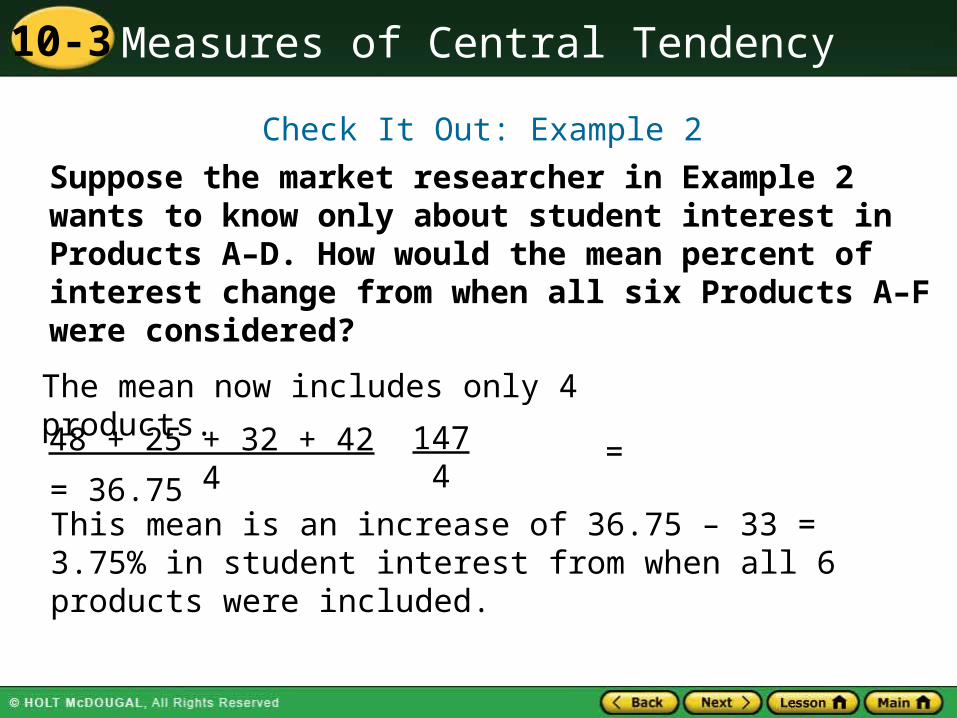
Suppose the market researcher in Example 2 wants to know only about student interest in Products A–D. How would the mean percent of interest change from when all six Products A–F were considered?
Check It Out: Example 2
This mean is an increase of 36.75 – 33 = 3.75% in student interest from when all 6 products were included.
= = 36.7548 + 25 + 32 + 424
1474
The mean now includes only 4 products.
Measures of Central Tendency10-3
Standard Lesson Quiz
Lesson Quizzes
Lesson Quiz for Student Response Systems
Measures of Central Tendency10-3Lesson Quiz
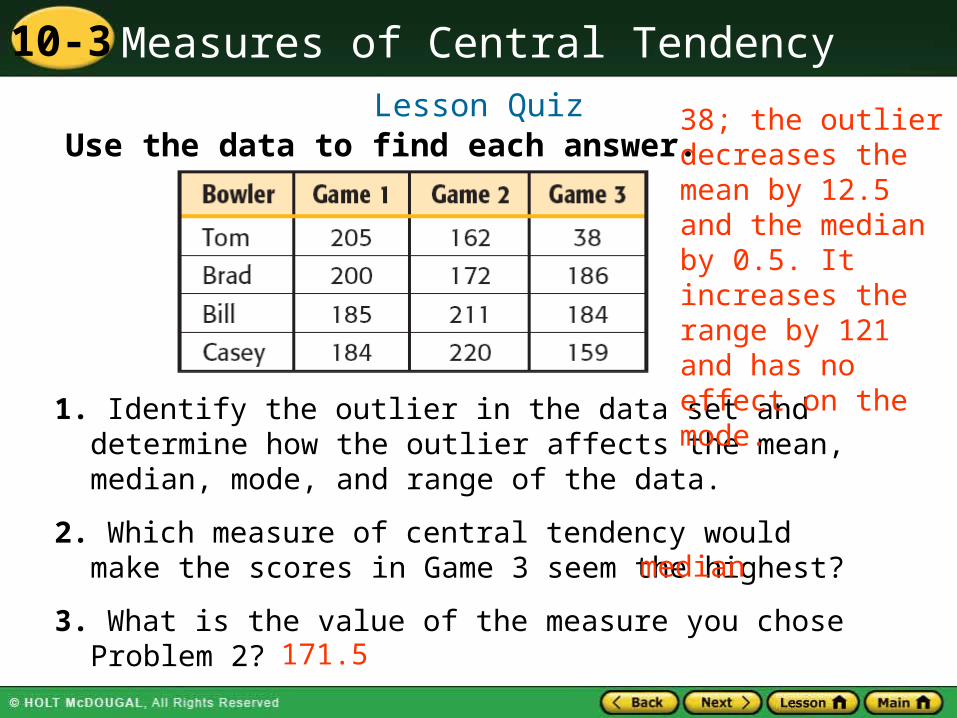
Use the data to find each answer.
1. Identify the outlier in the data set and determine how the outlier affects the mean, median, mode, and range of the data.
2. Which measure of central tendency would make the scores in Game 3 seem the highest?
3. What is the value of the measure you chose Problem 2?
38; the outlier decreases the mean by 12.5 and the median by 0.5. It increases the range by 121 and has no effect on the mode.
median
171.5
Measures of Central Tendency10-3
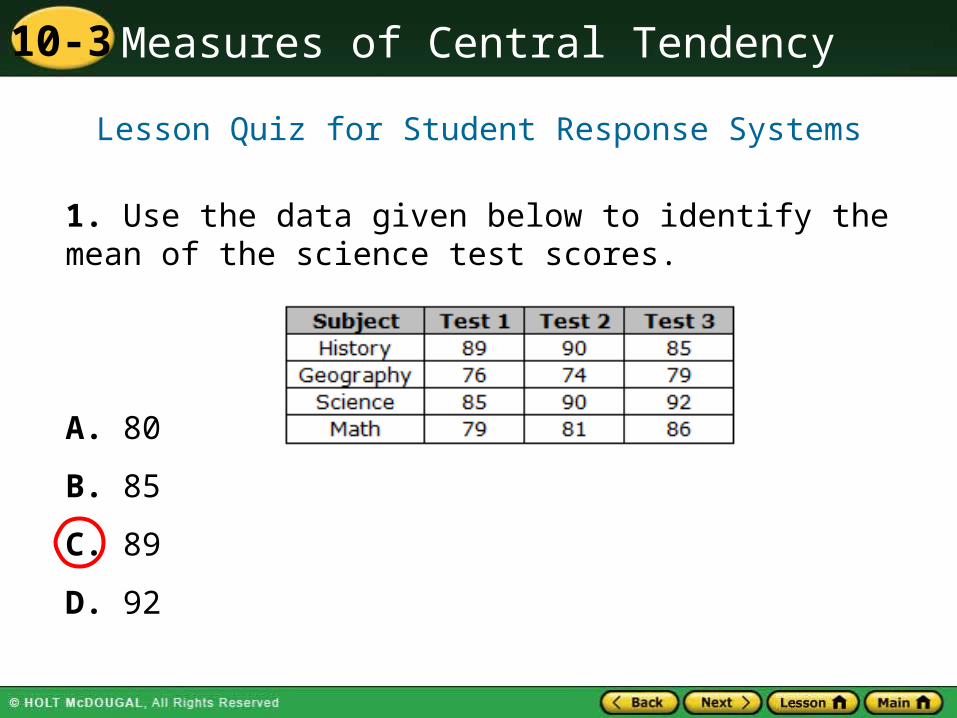
1. Use the data given below to identify the mean of the science test scores.
A. 80
B. 85
C. 89
D. 92
Lesson Quiz for Student Response Systems
Measures of Central Tendency10-3
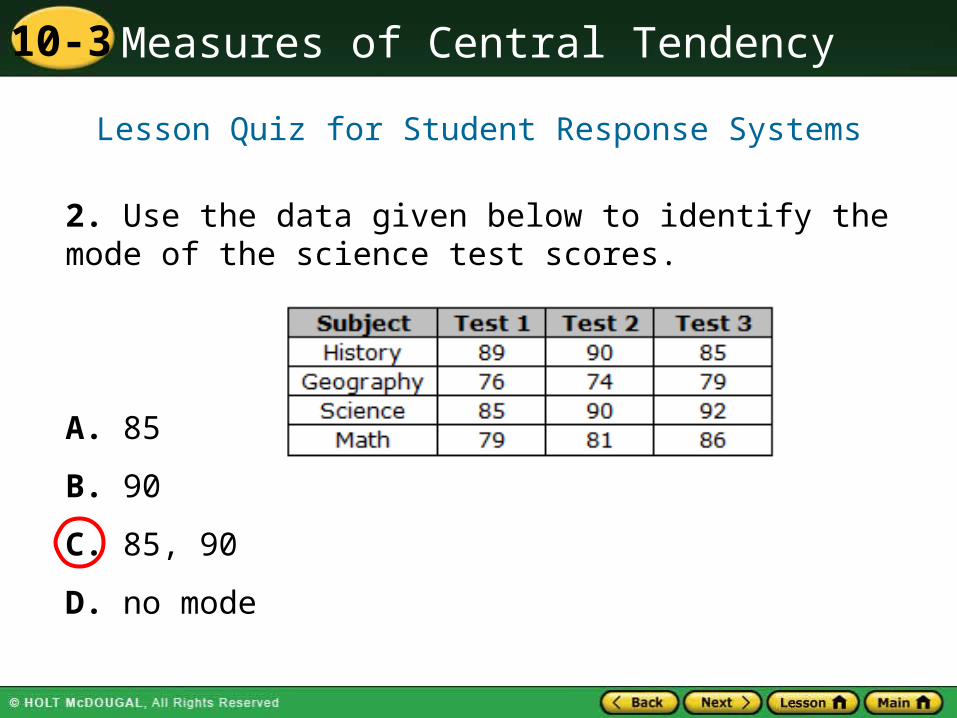
2. Use the data given below to identify the mode of the science test scores.
A. 85
B. 90
C. 85, 90
D. no mode
Lesson Quiz for Student Response Systems
Measures of Central Tendency10-3
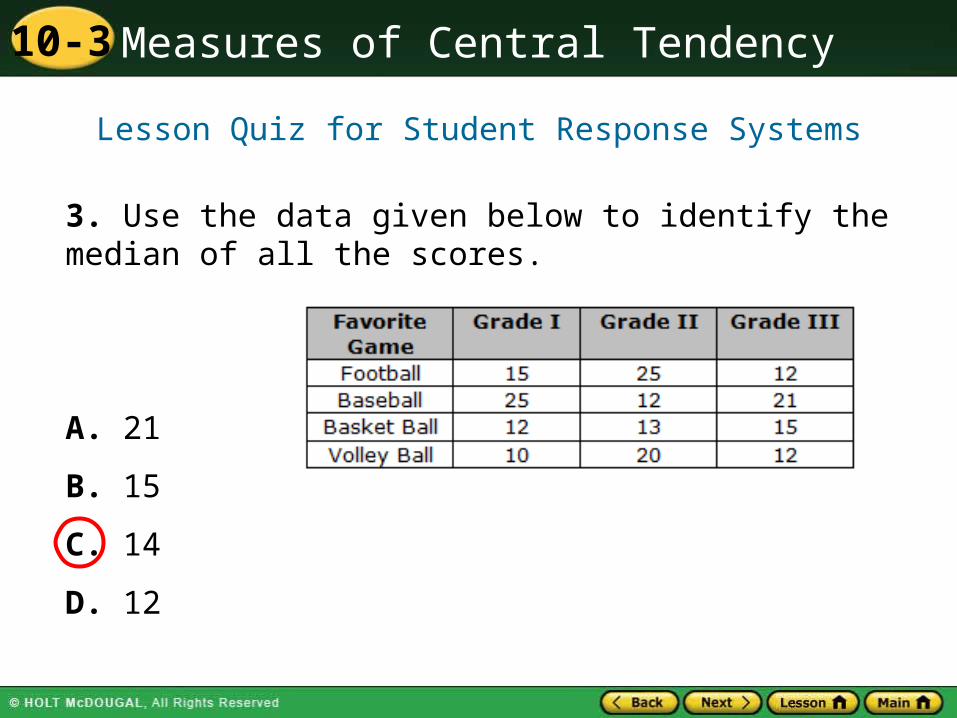
3. Use the data given below to identify the median of all the scores.
A. 21
B. 15
C. 14
D. 12
Lesson Quiz for Student Response Systems