Embed Size (px)
Citation preview
DWESD6, 1–26, 2013
Measures for safedrinking water
M. A. Tahir andH. Rasheed
Title Page
Abstract Introduction
Conclusions References
Tables Figures
J I
J I
Back Close
Full Screen / Esc
Printer-friendly Version
Interactive Discussion
Discussion
Paper
|D
iscussionP
aper|
Discussion
Paper
|D
iscussionP
aper|
Drink. Water Eng. Sci. Discuss., 6, 1–26, 2013www.drink-water-eng-sci-discuss.net/6/1/2013/doi:10.5194/dwesd-6-1-2013© Author(s) 2013. CC Attribution 3.0 License.
History of Geo- and Space
SciencesOpen
Acc
ess
Advances in Science & ResearchOpen Access Proceedings
Drinking Water Engineering and Science
Open Access
Ope
n A
cces
s Earth System
Science
Data
Drinking Water Engineering and Science
DiscussionsOpe
n Acc
ess
Ope
n A
cces
s Earth System
Science
DataD
iscussio
ns
This discussion paper is/has been under review for the journal Drinking Water Engineering andScience (DWES). Please refer to the corresponding final paper in DWES if available.
Cost and impact analysis of preventiveand remedial measures for safe drinkingwaterM. A. Tahir1 and H. Rasheed2
1National Water Quality Laboratory, Pakistan Council of Research in Water Resources,Kheyaban-e-Johar, H-8/1, Islamabad, Pakistan2Pakistan Council of Research in Water Resources, Kheyaban-e-Johar, H-8/1, Islamabad,Pakistan
Received: 3 May 2012 – Accepted: 21 May 2012 – Published: 29 January 2013
Correspondence to: M. A. Tahir ([email protected]) andH. Rasheed ([email protected])
Published by Copernicus Publications on behalf of the Delft University of Technology.
1

DWESD6, 1–26, 2013
Measures for safedrinking water
M. A. Tahir andH. Rasheed
Title Page
Abstract Introduction
Conclusions References
Tables Figures
J I
J I
Back Close
Full Screen / Esc
Printer-friendly Version
Interactive Discussion
Discussion
Paper
|D
iscussionP
aper|
Discussion
Paper
|D
iscussionP
aper|
Abstract
Preventive measures yield much higher cost effective benefits as compared to remedialmeasures. To verify this hypothesis, a survey was conducted in two different regionsof Rawalpindi district of Pakistan by comparing the cost on medication and mitigationexpenditures for reduction in the burden of water borne diseases. Water Quality moni-5
toring of the study areas in comparison to WHO Drinking Water Guidelines revealed thesatisfactory level of physico-chemical parameters, however; significant bacteriologicalcontamination was found at 86 % of the monitored sites in Gujar Khan and 87 % in Mur-ree region. A field questionnaire was used to estimate the expenditures on disinfectionand sanitation and concluded that 8.09 % of total income of each family were spent by10
the inhabitants of the study area on medication for water borne diseases. Correlationwas worked out between the rate of water related diseases (VWRD), unsafe drinking wa-ter (CDW), poor sanitation (PS), unhealthy personal hygiene and environment (UHPHE).A simulation model “Victim’s Rate Calculator” was developed to forecast the estimatednumber of victims within a population. Findings of the study verified the hypothesis15
that preventive measures are better choice than remedial measures due to cost benefitratio (1 : 1.6) with a clear advantage of 60 %.
1 Introduction
Lack of safe drinking water and sanitation is the single largest cause of illness in theworld, contributing to the death of 5 million people a year and about 5000 children every20
day. On the other hand, 1 billion people lack access to water and 2.6 billion people –two in five people in the world do not have access to improved sanitation, defined asa simple pit latrine or better as reported by WHO and UNICEF (2005). Safe drinkingwater is a basic necessity and legitimate right of all human beings irrespective of theirsocio-economic status. Water-borne infectious disease caused by viruses, bacteria,25
protozoa and other microorganisms is associated with outbreaks and background rates
2

DWESD6, 1–26, 2013
Measures for safedrinking water
M. A. Tahir andH. Rasheed
Title Page
Abstract Introduction
Conclusions References
Tables Figures
J I
J I
Back Close
Full Screen / Esc
Printer-friendly Version
Interactive Discussion
Discussion
Paper
|D
iscussionP
aper|
Discussion
Paper
|D
iscussionP
aper|
of disease in developed and developing countries worldwide. Thus, 90 % of deathsfrom diarrhoeal diseases are children younger than five because children lack effectiveimmune response to waterborne pathogens and toxins (WHO and UNICEF, 2005).
The most affected are the populations in developing countries, living in extreme con-ditions of poverty, normally peri-urban dwellers or rural inhabitants. Among the main5
problems which are responsible for this situation are: lack of priority given to the waterand sanitation sector, lack of financial resources, sustainability concerns of water sup-ply and sanitation services, poor hygiene behaviors, and inadequate sanitation in ruralareas specifically at the public places including hospitals, health centers and schools.The 21st century vision about drinking water is to concentrate and adopt the concept of10
preventive measures rather than sticking to remedial measures as practiced in all thedeveloping countries during the 20th century. A number of studies documented by FAOand WHO had confirmed the importance of preventive measures over the remedialones (Tahir, 1989). World Health Organization (WHO) technical reports have revealedthat after installation of safe water pipes alone in 30 rural settlements of Japan, com-15
municable intestinal diseases were reduced by 71.5 % and that of trachoma by 64 %(i.e infection of the mucous membrane of the eyelids caused by the bacterium Chlamy-dia trachomatis), while the death rate for infants and young children fell by 51.7 %.Similarly, in Uttarpardesh (India), after improvements in water works sewerage andsanitation, the cholera death rate decreased by 74.1 %, the typhoid fever death rate by20
63.3 % and the dysentery by 23.1 % (Ray et al., 2000).Preventive actions are generally taken if there is a chance of outbreaks of water-
borne and water related diseases. One of the success stories of preventive actions ispolio drop campaign all over the world. IPOL (Poliovirus Vaccine Inactivated) is givento infants (as young as 6 weeks of age), children, and adults to prevent polio caused by25
poliovirus Types 1, 2, and 3. Patient suffering from polio disease needs much financefor medicines and prolonged treatment. Therefore, preventive measures are justifiedas much better choice than taking remedial measures after problem occurrence. Stud-ies like these have shown that timely prevention is not only better for health but also
3

DWESD6, 1–26, 2013
Measures for safedrinking water
M. A. Tahir andH. Rasheed
Title Page
Abstract Introduction
Conclusions References
Tables Figures
J I
J I
Back Close
Full Screen / Esc
Printer-friendly Version
Interactive Discussion
Discussion
Paper
|D
iscussionP
aper|
Discussion
Paper
|D
iscussionP
aper|
comparatively less expensive. This research concept is highly applicable in the drinkingwater sector with systematic integration of preventive measures.
It is more feasible and economical to improve or optimize the water supply infrastruc-ture by adopting the cost effective water quality treatment techniques. Otherwise, it maycreate an obligatory situation for the Governments and other health related agencies5
to make huge investments on medication of diversified water borne diseases, hospitalinfrastructure and man power etc. The sufferings of the patients due to water bornediseases will also have direct and indirect consequences for masses along with othersocio-economic problems in the society. Considering such unwanted situations, theobjectives of the study were; to investigate the water quality problems and water re-10
lated diseases in the selected study area; to co-relate the health hazards to poor waterquality; to develop cost relationship between preventive and remedial measures and;to develop simulation model for the prediction of victim’s rate in relation to water bornediseases. The outcome of this study negates the perception of most of the policy mak-ers of developing countries that the sufficient funds cannot be allocated to improve15
water quality situations being a poor nation. However, situation in case of investmentsin water and sanitation sector in developed countries is more attractive due to betterbenefit to cost ratio as proved by this study.
2 Experimental section
The target areas for this case study consisted of Gujar Khan and Murree tehsils20
in Rawalpindi district. The district has five tehsils i.e., Gujar Khan, Kahuta, Murree,Rawalpindi, and Taxila having three topographical categories i.e. plain, semi hilly andhilly areas (Table 1).
Two types of field proforma were used: (i) village profile, which was used duringthe drinking water sampling, reflects the basic information regarding the village such25
as: household numbers, major occupations of inhabitants, type of roads, educationand health facilities, literacy rate, ratio of male and female, water supply and sanitary
4

DWESD6, 1–26, 2013
Measures for safedrinking water
M. A. Tahir andH. Rasheed
Title Page
Abstract Introduction
Conclusions References
Tables Figures
J I
J I
Back Close
Full Screen / Esc
Printer-friendly Version
Interactive Discussion
Discussion
Paper
|D
iscussionP
aper|
Discussion
Paper
|D
iscussionP
aper|
drainage system etc., In total, 10 % of households were selected randomly from eachvillage around the basic health units for using this village profile. (ii) Household pro-file, which was used to collect statistics on family members, family literacy rate, basichealth facilities and sanitation. The type of information for compilation of these statis-tics included but not limited to: average income per family per month, distance of Basic5
Health Units (BHU) from home, availability of doctor and medicines, medication cost,when ill, the preference of patients to go for treatment i.e. Basic Health Unit, hospital,dispensary, homoeopathic, medical store or any other, suggestion for the improvementof Basic Health Unit, frequency of visit to BHU in a year for treatment, possible rea-son of illness due to diseases such as; Water Borne Diseases: (Typhoid, Cholera,10
Infective Hepatics, Dysentery, Enteric Diarrhocas), Water Washed Diseases: (Scabies,Trachoma, Dysentery), Water Based Diseases: (Schistomiasis, Guinea Worm), WaterRelated Vector Diseases: (Malaria, Yellow Fever, Onchoarciasis), Chemical Based Dis-eases: (Methaemoglobinaemia, Fluorosis, Toxic Metal Sickness) and Sanitation BasedDiseases:(Hook Worm, Ascariasis, Trichuris, Leprospiroris), charges of treatment other15
than BHU, number of illness suffering days, average loss of income per day due to ail-ment of respondent, drinking water sources, contamination sources and treatmentsavailable to respondent, types of sanitation/drainage facilities, if any available to therespondents. Based on the information collected through village and household pro-files, data analysis was done to develop a relationship between comparative economic20
cost of health and drinking water treatment. A summary of such information is given inTable 2.
The information collected through this survey was utilized to develop correlation be-tween water quality, expenditure to be incurred due to water-related diseases and ex-penditure to be needed for preventive measures. Based on this correlation, a simulation25
model in Microsoft Visual Basic backed by a Database built in Microsoft Access wasdeveloped to forecast the possible number of victims of water borne diseases within agiven community.
5

DWESD6, 1–26, 2013
Measures for safedrinking water
M. A. Tahir andH. Rasheed
Title Page
Abstract Introduction
Conclusions References
Tables Figures
J I
J I
Back Close
Full Screen / Esc
Printer-friendly Version
Interactive Discussion
Discussion
Paper
|D
iscussionP
aper|
Discussion
Paper
|D
iscussionP
aper|
3 Results and discussion
In total, 300 drinking water samples were collected from the study areas and ana-lyzed for 22 basic physico-chemical and microbiological parameters (alkalinity, alu-minum, bicarbonates, carbonates, calcium, chloride, copper, electrical conductivity,free CO2, hardness, iron, magnesium, manganese, nitrate (N), pH, phosphate, potas-5
sium, sodium, Total Dissolved Solids, zinc, Total Coliforms and E-coli) in National WaterQuality Laboratory of PCRWR. Analytical findings were compared with World HealthOrganization Drinking Water Guideline values (WHO, 2006) to conclude the contami-nation load.
There was no significant problem of chemical contamination in both the tehsils except10
slightly excessive Nitrate (N) in Gujar Khan and iron contents in Murree tehsil (Table 3),however; the bacteriological quality of drinking water in 06 villages (i.e Rajoha, Banote,Jajja, Jungal, Gojra and Baghana) of Tehsil Gujar Khan and in 04 villages (Jugial, DholKoni Dana, Durrah Gali, and Phagwari) of Tehsil Murree was evaluated as unsafe dueto presence of Total Coliforms and E-coli (Figs. 1 and 2).15
An analysis of data collected using field questionnaire on socio-economic aspectsfrom households and basic health units revealed that 32.84 % populations were suf-fering from water borne and water related diseases in the area. The percentage distri-bution of water related cases included dysentery (23.79 %), diarrhea (5.37 %), scabies(21.48 %), malaria (20.46 %), hookworm (9.21 %), cholera (6.91 %), and goiter (6.65 %)20
and other water related diseases such as typhoid (1.79 %), ascariases (0.51 %) as de-tailed in Table 4.
Findings were actualized in respect of economic facts due to contaminated watersupply on the basis of collected information. It was concluded that 8.09 % of total in-come of each family in Pakistan is being spent on medication of water related diseases25
based on correlation between expenditure incurred on medicine and total income ofthe family per month. The precise digest of this analysis is presented in Table 5.
6

DWESD6, 1–26, 2013
Measures for safedrinking water
M. A. Tahir andH. Rasheed
Title Page
Abstract Introduction
Conclusions References
Tables Figures
J I
J I
Back Close
Full Screen / Esc
Printer-friendly Version
Interactive Discussion
Discussion
Paper
|D
iscussionP
aper|
Discussion
Paper
|D
iscussionP
aper|
For estimating the water treatment expenditures, water demand per capita was re-quired. Minimum water quantity per capita is the estimate to be needed for maintaininghuman survival. Basic human requirements of water are given in Table 6 according torecommendations of Gleick (1999).
A review of studies from developed and developing countries (Howard and Bartram,5
2003; Chenoweth, 2007; NRC, 1999; UNESCO, 2003; WHO, 2006) have suggestedthat an average of 10 to 20 l per person will meet basic needs. Minimum drinking waterrequirements have been estimated at about three liters per day under average temper-ate climate conditions. With changing climate and levels of activity, these daily minimumwater requirements can also increase. However, domestic water requirement of many10
countries has been estimated below 100 L per person per day and is also assumedsufficient for domestic water requirement. Keeping in view of water quality data, esti-mates were calculated assuming 100 L water requirements per capita per day on thebasis of low-cost, simple and dependable water treatment i.e., appropriate chlorinationfor the provision of safe drinking water to the inhabitants of the study area. Tri-Chloro-15
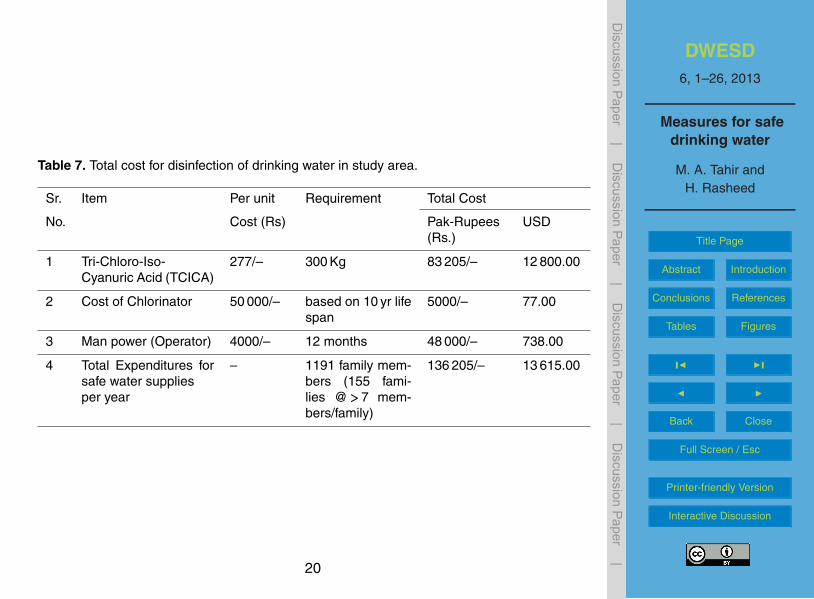
Iso-Cyanuric Acid (TCICA) is water-soluble (12 gram per liter at 25 ◦C) having 90 %active Chlorine and is best for effective disinfection. Summing up, the overall water re-quirement 43 471 cubic meters per year is needed, 277 kg of TCICA for Chlorination of1191 family members (155 families @>7 members per family) of study area at the rateof 100 L per capita per day. The details of expenditure to be spent for the disinfection20
process are as given in Table 7.To improve 100 % sanitation conditions, 155 toilets (one per each family) were re-
quired in that area. An amount of Rs. 11 574 (USD 178.00) was calculated for onelow cost toilet with life span of 40 yr and having width and length of 4×4 feet, heightof 7 feet with walls of 4.5 inches brick masonry (1 : 6 cement mortars), roof of 3 or 425
inches thick concrete slabs cover the whole toilet with WC ceramic. As the concretestructures have an average service life of 60 yr (Lemay and Leed, 2011), however, cal-culations are made on the basis of 40 yr life span depending on several environmental
7

DWESD6, 1–26, 2013
Measures for safedrinking water
M. A. Tahir andH. Rasheed
Title Page
Abstract Introduction
Conclusions References
Tables Figures
J I
J I
Back Close
Full Screen / Esc
Printer-friendly Version
Interactive Discussion
Discussion
Paper
|D
iscussionP
aper|
Discussion
Paper
|D
iscussionP
aper|
and other factors. Horizontal and vertical X-sections of toilet are shown in Figs. 3 and 4,respectively. The cost of improved sanitation for 155 families is calculated as following:
i. Expenditure on 155 units=11 574×155=Rs. 1 793 970∼=USD 27 599.00
ii. Cost per year for sanitation system=1 793 970/40=Rs. 44 849∼=USD 690
Therefore, total cost to improve water and sanitation conditions in study area was Ta-5
ble 8.In view of the above actualities regarding economic statistics collected through field
questionnaire, it is unquestionably established that an amount of Pak Rs 2, 99 706(USD 4611.00) was being spent on medicine per year to deal with water related dis-eases as remedial measures. However, some distinct and significant factors that can10
absolutely increase the estimation are not considered at this moment due to certainlimitations. These factors include Loss of working hours, hardship for depended fam-ily members, expenditure on infrastructure for medical facilities, expenses on trans-portation and nutritional needs, manpower looking after the patients, reduction in lifeexpectancy rate, Immunity loss and anxiety.15
Concluding the above estimates, an amount of Pak Rs. 181 054 (USD 2785.00) wasneeded to improve water and sanitation facilities against the expenditure of Rs. 299 706(USD 4611.00) in the study area, assuming no cost needed for the improvement ofpersonnel hygiene and environment. The improvement in personnel hygiene and en-vironment can easily be achieved through education by means of print and electronic20
media. Mosques in the target areas can also play an effective role in this regard. Itmay be concluded from the ratio (1 : 1.66) of both costs that the preventive measuresare better choice for water supply improvement like polio handling in the developingcountries.
The benefit-cost analysis is often used to determine the acceptability of various25
projects in the public sector. Conceptually, it is an analysis considering the worthi-ness of allocating resources to a project and the extent to which the benefits ex-ceed the costs for the various alternatives. The mechanisms of the benefit-to-cost
8

DWESD6, 1–26, 2013
Measures for safedrinking water
M. A. Tahir andH. Rasheed
Title Page
Abstract Introduction
Conclusions References
Tables Figures
J I
J I
Back Close
Full Screen / Esc
Printer-friendly Version
Interactive Discussion
Discussion
Paper
|D
iscussionP
aper|
Discussion
Paper
|D
iscussionP
aper|
comparisons are straightforward and simple for calculating the highest Benefit-to-Costratio (B/C). In this case, comparison between the Benefit (B= saving of the expen-ditures occurred to purchase medicines i.e., Rs. 2, 99 706∼=USD 4611.00) and theCost (C=Expenditure to be needed to improve water and sanitation facilities i.e., Rs.181 054∼=USD 2785.00) is very reasonable. Therefore, the determined Benefit-to-Cost5
ratio (B/C)=299 706/181 054=1.66 (B/C>1). B/C greater than 1, indicates a good al-ternative, which can be adopted as a better option in future projects by the policy anddecision makers.
3.1 Victim’s Vs drinking water, sanitation and PHE
Hypothetically and truly three main factors are considered to reduce water related dis-10
eases that are ultimately responsible for excessive motility (M) and morbidity (MO)rates. These include main factors Drinking Water, Sanitation, Personal Hygiene andEnvironment. The rate of water related diseases are directly proportional to unsafe wa-ter quality or contaminated drinking water (CDW), poor sanitation (PS) and unhealthypersonal hygiene and environment (UHPHE). We may make this statement in an alter-15
native way that the contaminated water quality, poor sanitation and lack of personalhygiene and unhealthy environment can increase the victims’ rate (VWRD). Mathemati-cally, it can be written as:
VWRD rate α(CDW + PS +UHPHE)/3 or
[VWRD rate = k(CDW + PS +UHPHE)/3] (1)20
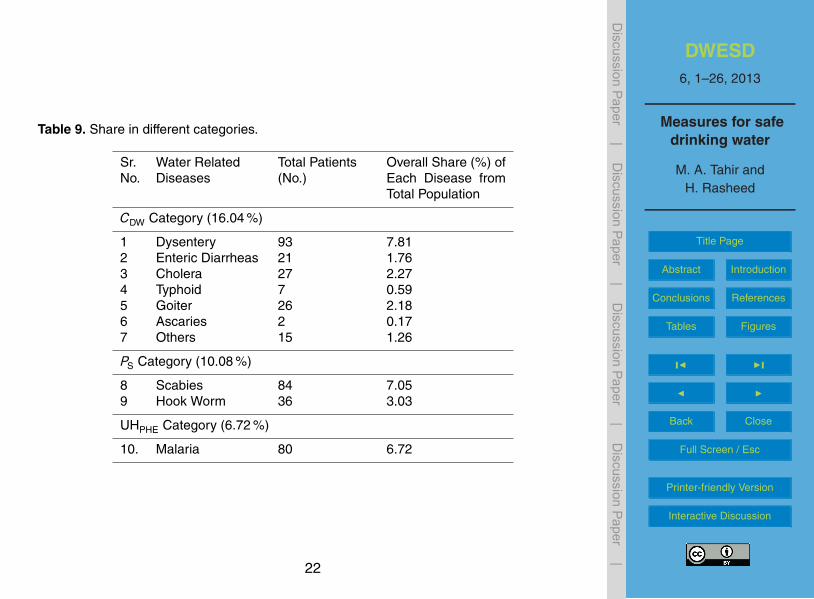
Where k is a constant.Victims’ rate due to water related diseases (in three categories) in the study area
and ratio for each category are calculated with the help of data shown in Table 9.Share and ratio in three categories is self explanatory and presented as under:
a. Share of diseases over total population in CDW Category = 16.04 %25
b. Share of diseases over total population in PS Category = 10.08 %9
DWESD6, 1–26, 2013
Measures for safedrinking water
M. A. Tahir andH. Rasheed
Title Page
Abstract Introduction
Conclusions References
Tables Figures
J I
J I
Back Close
Full Screen / Esc
Printer-friendly Version
Interactive Discussion
Discussion
Paper
|D
iscussionP
aper|
Discussion
Paper
|D
iscussionP
aper|
c. Share of diseases over total population in UHPHE Category = 6.72 %
d. CDW % in study area = 87 % (based on water quality assessment)
e. PS % in study area = 82 % (based on sanitation facilities from household profile)
f. UHPHE % in study area = 51 % (based on illiteracy rate from household profile)
g. VWRD rate in the study area = 32.84 % (391 from 1191 population)5
h. VWRD rate if CDW (100 %) = 16.04/87×100 = 18.44
i. VWRD rate if PS (100 %) = 10.07/82×100 = 12.28
j. VWRD rate if UHPHE (100 %) = 6.72/51×100 = 13.18
k. VWRD rate = 43.9 % (Based on study)
l. Ratio (UHPHE: PS: CDW) = 1.073 : 1 : 1.510
By putting these values in Eq. (1), we can find
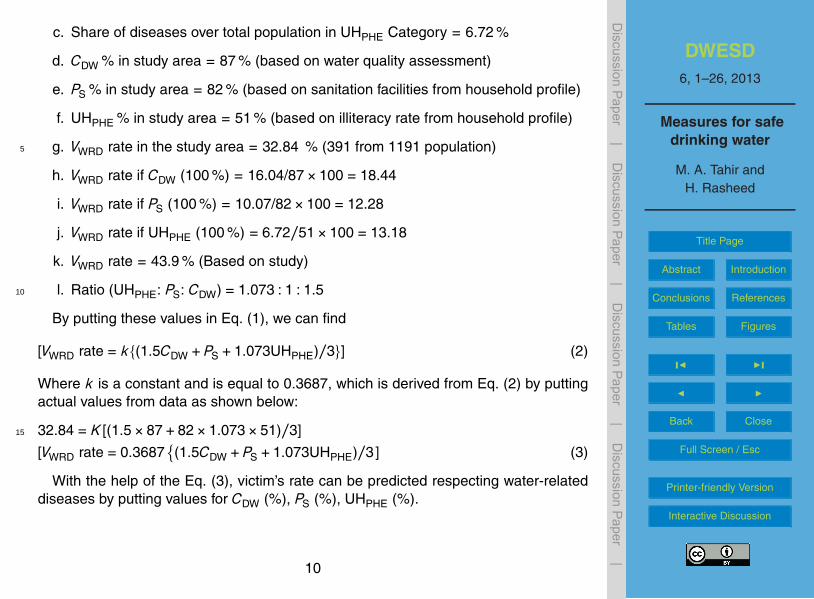
[VWRD rate = k{(1.5CDW + PS +1.073UHPHE)/3}] (2)
Where k is a constant and is equal to 0.3687, which is derived from Eq. (2) by puttingactual values from data as shown below:
32.84 = K [(1.5×87+82×1.073×51)/3]15
[VWRD rate = 0.3687{(1.5CDW + PS +1.073UHPHE)/3] (3)
With the help of the Eq. (3), victim’s rate can be predicted respecting water-relateddiseases by putting values for CDW (%), PS (%), UHPHE (%).
10
DWESD6, 1–26, 2013
Measures for safedrinking water
M. A. Tahir andH. Rasheed
Title Page
Abstract Introduction
Conclusions References
Tables Figures
J I
J I
Back Close
Full Screen / Esc
Printer-friendly Version
Interactive Discussion
Discussion
Paper
|D
iscussionP
aper|
Discussion
Paper
|D
iscussionP
aper|
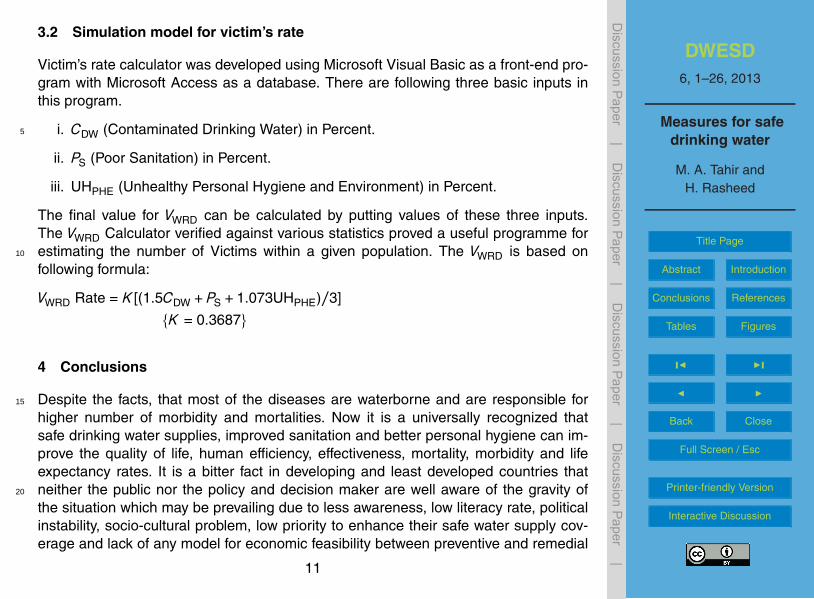
3.2 Simulation model for victim’s rate
Victim’s rate calculator was developed using Microsoft Visual Basic as a front-end pro-gram with Microsoft Access as a database. There are following three basic inputs inthis program.
i. CDW (Contaminated Drinking Water) in Percent.5
ii. PS (Poor Sanitation) in Percent.
iii. UHPHE (Unhealthy Personal Hygiene and Environment) in Percent.
The final value for VWRD can be calculated by putting values of these three inputs.The VWRD Calculator verified against various statistics proved a useful programme forestimating the number of Victims within a given population. The VWRD is based on10
following formula:
VWRD Rate = K [(1.5CDW + PS +1.073UHPHE)/3]
{K = 0.3687}
4 Conclusions
Despite the facts, that most of the diseases are waterborne and are responsible for15
higher number of morbidity and mortalities. Now it is a universally recognized thatsafe drinking water supplies, improved sanitation and better personal hygiene can im-prove the quality of life, human efficiency, effectiveness, mortality, morbidity and lifeexpectancy rates. It is a bitter fact in developing and least developed countries thatneither the public nor the policy and decision maker are well aware of the gravity of20
the situation which may be prevailing due to less awareness, low literacy rate, politicalinstability, socio-cultural problem, low priority to enhance their safe water supply cov-erage and lack of any model for economic feasibility between preventive and remedial
11

DWESD6, 1–26, 2013
Measures for safedrinking water
M. A. Tahir andH. Rasheed
Title Page
Abstract Introduction
Conclusions References
Tables Figures
J I
J I
Back Close
Full Screen / Esc
Printer-friendly Version
Interactive Discussion
Discussion
Paper
|D
iscussionP
aper|
Discussion
Paper
|D
iscussionP
aper|
measures. Correlation between preventive and remedial measures proved the conceptof taking preventive measures as the principal priority and is far better than treatment.B/C ratio (1.66, B/C>1) also indicated a righteous alternative and is strongly recom-mended to implement this option in water and sanitation sector on the format of poliopreventive treatment approach, which was adopted countrywide. This will uplift the5
standard of life of common and poor population. The computer simulation model forthe prediction of victim’s rate will also be helpful to create awareness and initiation oftimely preventive actions. Gateways are open for further research studies in the similarsphere.
References10
APHA, AWWA and WEF: Standard Methods for the Examination of Water and Wastewater,American Public Health Association, American Water Works Association and Water Envi-ronment Federation, 21st Edn., Washington DC, 2–1 to 9–55, 2005.
Chenoweth, J.: Minimum Water Requirement for Social and Economic Development, Desalina-tion, 229, 245–256, 2007.15
Gleick, P. H.: Basic Water Requirements for Human Activities: Meeting Basic Needs, in: TheHuman Right to Water, Pacific Institute for Studies in Development, Environment and Secu-rity, USA, 84–88, 1999.
Howard, G. and Bartram, J.: Domestic Water Quantity, Service Level and Health, World HealthOrganization Document Production Services, Geneva, Switzerland, WHO/SDE/WSH/03.02,20
4–6, 2003.Lemay, L. and Leed, A. P.: Life Cycle Assessment of Concrete Buildings. Sustainable Develop-
ment, NRMCA, Concrete Sustainability Report, National Ready Mixed Concrete AssociationCSR04-October, 2011.
NRC: Recommended Dietary Allowances, 10th Edn., Subcommittee on the Tenth Edition of the25
RDAs, Food and Nutrition Board Commission on Life Sciences, National Research Council;National Academy Press, Washington, DC, USA, 247–250, 1999.
12

DWESD6, 1–26, 2013
Measures for safedrinking water
M. A. Tahir andH. Rasheed
Title Page
Abstract Introduction
Conclusions References
Tables Figures
J I
J I
Back Close
Full Screen / Esc
Printer-friendly Version
Interactive Discussion
Discussion
Paper
|D
iscussionP
aper|
Discussion
Paper
|D
iscussionP
aper|
Ray, B. D., Mazhari, H. K., Passah, P. M., and Pandey, M. C.: Population, Poverty and Envi-ronment in North East India, Noth East India Council for Social Science Research, Shillong,Concept Publishing Company, New Delhi, India, 318 pp., 2000.
Tahir, M. A.: Pollution Problems in the Water Supply Systems of Islamabad and Rawalpindi,Technical Report of the Pakistan Council of Research in Water Resources, Islamabad, Pak-5
istan, 10–15, 1989.UNESCO: World Water Assessment Programme, Water for People, Water for Life: The United
Nations World Water Development Report, UNESCO Publishing, Berghahn Books, Paris,7–23, 2003.
WHO: Guidelines for Drinking-Water Quality: incorporating first addendum, 3rd Edn., World10
Health Organization, Geneva, 210–459, 2006.WHO and UNICEF: Joint Monitoring Programme for Water Supply and Sanitation, World Health
Organization and United Nation’s Children Education Funds, Water for Life: Making It Hap-pen, 4–10, 2005, http://www.who.int/water sanitation health/waterforlife.pdf, last access: 21December 2009.15
13

DWESD6, 1–26, 2013
Measures for safedrinking water
M. A. Tahir andH. Rasheed
Title Page
Abstract Introduction
Conclusions References
Tables Figures
J I
J I
Back Close
Full Screen / Esc
Printer-friendly Version
Interactive Discussion
Discussion
Paper
|D
iscussionP
aper|
Discussion
Paper
|D
iscussionP
aper|
Table 1. Water sources and topography.
Sr. # Tehsil Water Sources Topography
1 Gujar Khan Well, Tube well, Hand pump,Water supply and pond
Plain and semi-hilly area
2 Murree Spring, well, water supply Hilly area
3 Kahuta Well, Hand pump, water supply,spring
Hilly area
4 Taxila Well, Tube well, spring Plain and semi-hilly area
5 Rawalpindi Well, Tube well, Hand pump,water supply
Plain and semi-hilly area
14

DWESD6, 1–26, 2013
Measures for safedrinking water
M. A. Tahir andH. Rasheed
Title Page
Abstract Introduction
Conclusions References
Tables Figures
J I
J I
Back Close
Full Screen / Esc
Printer-friendly Version
Interactive Discussion
Discussion
Paper
|D
iscussionP
aper|
Discussion
Paper
|D
iscussionP
aper|
Table 2. Important facts about study area.
1. Total families interviewed 155 No.
2. Total family members 1191 Nos.
3. Literate 611 No.
4. Literacy rate 51.30 %
5. Average income per family per month Rs. 1992
6. Basic Health Unit:i. Approachableii. Non approachable
70.32 %29.68 %
7. Patients satisfied from BHU 15.48 %
8. Patients not satisfied from BHU 84.52 %
9. Drinking water sources;i. Wellii. Springii. Hand Pumpiii. Tap
41.29 %35.48 %20.65 %4 %
10. Families treating water with chemicals 12.26 %
11. Families with proper sanitation and drainage None
12. Families using open field latrine 81.94 %
13. Families using pit latrine 18.06 %
14. Total numbers of water related cases 391
15. Population suffering with water related diseases per year 32.84 %
14. Annual medical expenditures on all families Rs. 299 706(USD∗ 4611.00)
15. Annual medical expenditures per family Rs. 1934(USD∗ 30.00)
∗ 1 USD equivalent to Rs. 64.4 at the time of study.
15

DWESD6, 1–26, 2013
Measures for safedrinking water
M. A. Tahir andH. Rasheed
Title Page
Abstract Introduction
Conclusions References
Tables Figures
J I
J I
Back Close
Full Screen / Esc
Printer-friendly Version
Interactive Discussion
Discussion
Paper
|D
iscussionP
aper|
Discussion
Paper
|D
iscussionP
aper|
Table 3. Physico-chemical water quality of Gujar Khan and Murree Tehsils.
Sr. Parameters Unit Guideline Gujar Khan Murree
# Values Mean Max Min Mean Max Min
1 Alkalinity m mol l−1 NGVS 7.67 15.6 2 5.55 8.2 32 Aluminum mg l−1 0.2 (WHO) 0.08 0.3 0 – – –3 Bicarbonates mg l−1 NGVS 383 780 100 278 410 1504 Carbonates mg l−1 NGVS 0.69 10 0 0 0 05 Calcium mg l−1 75 (KSA) 32 76 3 35 66 206 Chloride mg l−1 250 (WHO) 129 1540 17.7 26 96 147 Copper mg l−1 1 (WHO) 0.073 0.17 0 0.02 0.11 08 EC µS cm−1 NGVS 983 5500 103 318 532 1739 Free CO2 mg l−1 NGVS 0.67 1.1 0 0.99 1.9 0.2710 Hardness mg l−1 500 (WHO) 353 825 125 336 537 7411 Iron mg l−1 0.3 (WHO) 0.06 0.14 0 0.24 0.39 0.0512 Magnesium mg l−1 150 (Canadian) 26 89 3 47 29 513 Manganese mg l−1 0.1 (WHO) 0.19 0.81 0 0.04 0.2 014 Nitrate (N) mg l−1 10 (WHO) 11 72 0.3 – – –15 pH – 6.5–8.5 7.53 8.33 7.02 7.26 7.97 6.3516 Phosphate mg l−1 1–5 0.02 0.06 0 0.01 0.04 017 Potassium mg l−1 NGVS 2.54 7.8 0.5 1.76 9.1 0.318 Sodium mg l−1 200 (WHO) 185 1520 4 11 27 319 T.D.S. mg l−1 1000 585 3280 61 189 317 10220 Zinc mg l−1 5 (WHO) 0.16 0.76 0 0.09 0.7 0.01
16

DWESD6, 1–26, 2013
Measures for safedrinking water
M. A. Tahir andH. Rasheed
Title Page
Abstract Introduction
Conclusions References
Tables Figures
J I
J I
Back Close
Full Screen / Esc
Printer-friendly Version
Interactive Discussion
Discussion
Paper
|D
iscussionP
aper|
Discussion
Paper
|D
iscussionP
aper|
Table 4. Water related diseases and their pertinent information.
Sr.#
Water RelatedDiseases
Total Patients(No.)
Overall Share(%) of EachDisease
Overall Share (%) ofEach Disease fromTotal Population
1. Dysentery 93 23.79 7.812. Enteric Diarrheas 21 5.37 1.763. Scabies 84 21.48 7.054. Hook Worm 36 9.21 3.035. Malaria 80 20.46 6.726. Goiter 26 6.65 2.187. Cholera 27 6.91 2.278. Typhoid 7 1.79 0.599. Ascaris 2 0.51 0.1710. Others 15 3.84 1.26
11. Total 391
17

DWESD6, 1–26, 2013
Measures for safedrinking water
M. A. Tahir andH. Rasheed
Title Page
Abstract Introduction
Conclusions References
Tables Figures
J I
J I
Back Close
Full Screen / Esc
Printer-friendly Version
Interactive Discussion
Discussion
Paper
|D
iscussionP
aper|
Discussion
Paper
|D
iscussionP
aper|
Table 5. Economic facts due to unsafe water supplies (in Rupees).
Sr. No Socio-Economic Facts Share
Pak Rupees USD∗
1. Annual Income of all families 3 705 600 57 009.00
2. Monthly Income of all families 308 800 4751.00
3. Annual Income of Single family 23 907 3678.00
4. Average family income per month 1992 31.00
5. Average income per person per year 3111 48.00
6. Average income per person per month 259 4.00
7. Average expenditure on medicines(Water Related Diseases) per family per year
1934 30.00
8. Average expenditure on medicines per familyper month
161 2.5
9. Average expenditure on medicines per personper year
252 3.9
10. Average expenditure on medicines per personper month
21 0.32
11. Total expenditure on medicine (Water RelatedDiseases) per year
299 706 4611
12. Expenditure percentage on medicine of total in-come
8.09 % 8.09 %
∗1 USD equivalent to Rs. 64.4 at the time of study.
18

DWESD6, 1–26, 2013
Measures for safedrinking water
M. A. Tahir andH. Rasheed
Title Page
Abstract Introduction
Conclusions References
Tables Figures
J I
J I
Back Close
Full Screen / Esc
Printer-friendly Version
Interactive Discussion
Discussion
Paper
|D
iscussionP
aper|
Discussion
Paper
|D
iscussionP
aper|
Table 6. Recommended basic requirements for human needs.
Usage RecommendedLit./person/day
Range Lit./person/day
Drinking water 5 2 to 5Sanitation services 20 to 75 –Bathing 15 5 to 70Cooking and kitchen 10 10 to 50
Total recommended basic water requirements 50 –
19
DWESD6, 1–26, 2013
Measures for safedrinking water
M. A. Tahir andH. Rasheed
Title Page
Abstract Introduction
Conclusions References
Tables Figures
J I
J I
Back Close
Full Screen / Esc
Printer-friendly Version
Interactive Discussion
Discussion
Paper
|D
iscussionP
aper|
Discussion
Paper
|D
iscussionP
aper|
Table 7. Total cost for disinfection of drinking water in study area.
Sr. Item Per unit Requirement Total Cost
No. Cost (Rs) Pak-Rupees(Rs.)
USD
1 Tri-Chloro-Iso-Cyanuric Acid (TCICA)
277/– 300 Kg 83 205/– 12 800.00
2 Cost of Chlorinator 50 000/– based on 10 yr lifespan
5000/– 77.00
3 Man power (Operator) 4000/– 12 months 48 000/– 738.00
4 Total Expenditures forsafe water suppliesper year
– 1191 family mem-bers (155 fami-lies @>7 mem-bers/family)
136 205/– 13 615.00
20

DWESD6, 1–26, 2013
Measures for safedrinking water
M. A. Tahir andH. Rasheed
Title Page
Abstract Introduction
Conclusions References
Tables Figures
J I
J I
Back Close
Full Screen / Esc
Printer-friendly Version
Interactive Discussion
Discussion
Paper
|D
iscussionP
aper|
Discussion
Paper
|D
iscussionP
aper|
Table 8. Total cost for improvement of water and sanitation condition.
Sr. Cost Total Cost
No Pak-Rupees (Rs.) USD
1 Safe water supplies per year Rs. 136 205/– 2095.00
2 Improvement of sanitationfacilities per year
Rs. 44 849/– 690.00
3 Total cost to improve waterand sanitation facilities
Rs. 181 054/– 2785.00
21
DWESD6, 1–26, 2013
Measures for safedrinking water
M. A. Tahir andH. Rasheed
Title Page
Abstract Introduction
Conclusions References
Tables Figures
J I
J I
Back Close
Full Screen / Esc
Printer-friendly Version
Interactive Discussion
Discussion
Paper
|D
iscussionP
aper|
Discussion
Paper
|D
iscussionP
aper|
Table 9. Share in different categories.
Sr.No.
Water RelatedDiseases
Total Patients(No.)
Overall Share (%) ofEach Disease fromTotal Population
CDW Category (16.04 %)
1 Dysentery 93 7.812 Enteric Diarrheas 21 1.763 Cholera 27 2.274 Typhoid 7 0.595 Goiter 26 2.186 Ascaries 2 0.177 Others 15 1.26
PS Category (10.08 %)
8 Scabies 84 7.059 Hook Worm 36 3.03
UHPHE Category (6.72 %)
10. Malaria 80 6.72
22

DWESD6, 1–26, 2013
Measures for safedrinking water
M. A. Tahir andH. Rasheed
Title Page
Abstract Introduction
Conclusions References
Tables Figures
J I
J I
Back Close
Full Screen / Esc
Printer-friendly Version
Interactive Discussion
Discussion
Paper
|D
iscussionP
aper|
Discussion
Paper
|D
iscussionP
aper|
7
and Baghana) of Tehsil Gujar Khan and in 04 villages (Jugial, Dhol Koni Dana, Durrah Gali, and
Phagwari) of Tehsil Murree was evaluated as unsafe due to presence of Total Coliforms and E-coli
(Figure 1&2).
0
20
40
60
80
100
Safe Total Coliforms
Non‐Fecal Coliforms E‐Coli
%age Co
ntam
ination
Figure-1: Bacterial Contamination in Gujar Khan
0
50
100
Safe Total Coliforms
Non‐Fecal ColiformsE‐Coli
%age Co
ntam
ination
Figure-2: Bacterial Contamination in Murree
An analysis of data collected using field questionnaire on socio-economic aspects from households
and basic health units has revealed that 32.84% populations were found suffering from water borne
and water related diseases in the target area. The percentage distribution of water related cases
Fig. 1. Bacterial contamination in Gujar Khan.
23

DWESD6, 1–26, 2013
Measures for safedrinking water
M. A. Tahir andH. Rasheed
Title Page
Abstract Introduction
Conclusions References
Tables Figures
J I
J I
Back Close
Full Screen / Esc
Printer-friendly Version
Interactive Discussion
Discussion
Paper
|D
iscussionP
aper|
Discussion
Paper
|D
iscussionP
aper|
7
and Baghana) of Tehsil Gujar Khan and in 04 villages (Jugial, Dhol Koni Dana, Durrah Gali, and
Phagwari) of Tehsil Murree was evaluated as unsafe due to presence of Total Coliforms and E-coli
(Figure 1&2).
0
20
40
60
80
100
Safe Total Coliforms
Non‐Fecal Coliforms E‐Coli
%age Co
ntam
ination
Figure-1: Bacterial Contamination in Gujar Khan
0
50
100
Safe Total Coliforms
Non‐Fecal ColiformsE‐Coli
%age Co
ntam
ination
Figure-2: Bacterial Contamination in Murree
An analysis of data collected using field questionnaire on socio-economic aspects from households
and basic health units has revealed that 32.84% populations were found suffering from water borne
and water related diseases in the target area. The percentage distribution of water related cases
Fig. 2. Bacterial contamination in Murree.
24

DWESD6, 1–26, 2013
Measures for safedrinking water
M. A. Tahir andH. Rasheed
Title Page
Abstract Introduction
Conclusions References
Tables Figures
J I
J I
Back Close
Full Screen / Esc
Printer-friendly Version
Interactive Discussion
Discussion
Paper
|D
iscussionP
aper|
Discussion
Paper
|D
iscussionP
aper|
6 ft
4 ft
2 ft
4 ft
4 ft
Toilet
Decomposition block
7 ft
Toilet G.L G.L
Fig. 3. Horizontal X-section of the Toilet.
25

DWESD6, 1–26, 2013
Measures for safedrinking water
M. A. Tahir andH. Rasheed
Title Page
Abstract Introduction
Conclusions References
Tables Figures
J I
J I
Back Close
Full Screen / Esc
Printer-friendly Version
Interactive Discussion
Discussion
Paper
|D
iscussionP
aper|
Discussion
Paper
|D
iscussionP
aper|
6 ft
4 ft
2 ft
4 ft
4 ft
Toilet
Decomposition block
7 ft
Toilet G.L G.L
Fig. 4. Vertical X-section of the Toilet.
26


![0 Safe Drinking Water [ ]](https://img.pdfslide.us/doc/110x75/577ccfb31a28ab9e789057c9/0-safe-drinking-water-.jpg)