Embed Size (px)
Citation preview

Report ITU-R BT.2215-5 (07/2015)
Measurements of protection ratios and overload thresholds for
broadcast TV receivers
BT Series
Broadcasting service
(television)

ii Rep. ITU-R BT.2215-5
Foreword
The role of the Radiocommunication Sector is to ensure the rational, equitable, efficient and economical use of the radio-
frequency spectrum by all radiocommunication services, including satellite services, and carry out studies without limit
of frequency range on the basis of which Recommendations are adopted.
The regulatory and policy functions of the Radiocommunication Sector are performed by World and Regional
Radiocommunication Conferences and Radiocommunication Assemblies supported by Study Groups.
Policy on Intellectual Property Right (IPR)
ITU-R policy on IPR is described in the Common Patent Policy for ITU-T/ITU-R/ISO/IEC referenced in Annex 1 of
Resolution ITU-R 1. Forms to be used for the submission of patent statements and licensing declarations by patent holders
are available from http://www.itu.int/ITU-R/go/patents/en where the Guidelines for Implementation of the Common
Patent Policy for ITU-T/ITU-R/ISO/IEC and the ITU-R patent information database can also be found.
Series of ITU-R Reports
(Also available online at http://www.itu.int/publ/R-REP/en)
Series Title
BO Satellite delivery
BR Recording for production, archival and play-out; film for television
BS Broadcasting service (sound)
BT Broadcasting service (television)
F Fixed service
M Mobile, radiodetermination, amateur and related satellite services
P Radiowave propagation
RA Radio astronomy
RS Remote sensing systems
S Fixed-satellite service
SA Space applications and meteorology
SF Frequency sharing and coordination between fixed-satellite and fixed service systems
SM Spectrum management
Note: This ITU-R Report was approved in English by the Study Group under the procedure detailed in
Resolution ITU-R 1.
Electronic Publication
Geneva, 2015
ITU 2015
All rights reserved. No part of this publication may be reproduced, by any means whatsoever, without written permission of ITU.

Rep. ITU-R BT.2215-5 1
REPORT ITU-R BT.2215-5
Measurements of protection ratios and overload thresholds
for broadcast TV receivers
(2011-2011-2012-2012-2014-2015)
TABLE OF CONTENTS
Page
1 Executive summary ........................................................................................................ 3
2 Abbreviations.................................................................................................................. 3
3 Useful definitions ........................................................................................................... 4
3.1 Radio frequency signal-to-interference ratio (C/I) ............................................. 4
3.2 Radio frequency protection ratio (PR) ................................................................ 4
3.3 Receiver (front-end) overload threshold ............................................................. 4
3.4 Adjacent channel leakage power ratio ................................................................ 4
3.5 “Can” tuners ........................................................................................................ 5
3.6 “Silicon” tuners ................................................................................................... 5
4 References ...................................................................................................................... 5
4.1 Broadcsasting technology characteristics ........................................................... 5
4.2 Mobile technology characteristics ...................................................................... 5
5 Measurement methodology ............................................................................................ 5
5.1 Example test setup .............................................................................................. 5
5.2 Wanted signal levels ........................................................................................... 8
5.3 Frequency offsets between interfering signal and wanted signal ....................... 8
5.4 Measurements in the presence of a time varying interfering signal ................... 8
5.5 UMTS uplink ...................................................................................................... 8
5.6 LTE – downlink .................................................................................................. 8
5.7 LTE – uplink ....................................................................................................... 9
5.8 Interferer reference power level .......................................................................... 9
5.9 Characterization of the interfering signal ........................................................... 9
2 Rep. ITU-R BT.2215-5
Page
5.10 Failure point assessment methods ...................................................................... 9
5.10.1 ESR5 Criterion for the Assessment of DTT Transmission Quality...... 9
5.11 Method for determining protection ratios and overload thresholds .................... 11
6 Conclusions and further work required ............................................................... 19
Annex 1 – DVB-T receiver performance in the presence of interfering signals from DVB-
T, UMTS, and LTE......................................................................................................... 20
A.1.1 Measurements of protection ratios and overload thresholds for
DVB-T receivers under interference from DVB-T in adjacent
channels ................................................................................................ 20
A.1.2 Measurements of protection ratio and overload threshold for DVB-T
receivers under interference from UMTS BS and UE in co- and
adjacent channels ................................................................................. 20
A.1.3 Measurements of protection ratios and overload thresholds for
DVB-T receivers under interference from LTE BS and UE in co-
and adjacent channels ........................................................................... 21
Annex 2 – DVB-T2 receiver performance in the presence of interfering signals from
DVB-T2 and LTE ........................................................................................................... 23
A.2.1 Measurements of protection ratios and overload thresholds for
DVB-T2 receivers under interference from DVB-T2 in other
channels ................................................................................................ 23
A.2.2 Measurements of protection ratios and overload thresholds for
DVB-T2 receivers under interference from LTE BS in co- and
adjacent channels ................................................................................. 23
A.2.4 Measurements of protection ratios and overload thresholds for
DVB-T2 receivers under interference from wireless broadband
access systems in co- and adjacent channels........................................ 24
Annex 3 –s ATSC receiver performance in the presence of interfering signals from ATSC .. 25
A.3.1 Measurements of protection ratios and receiver desensitisation for
ATSC receivers under interference from ATSC on adjacent
channels ............................................................................................... 25
Rep. ITU-R BT.2215-5 3
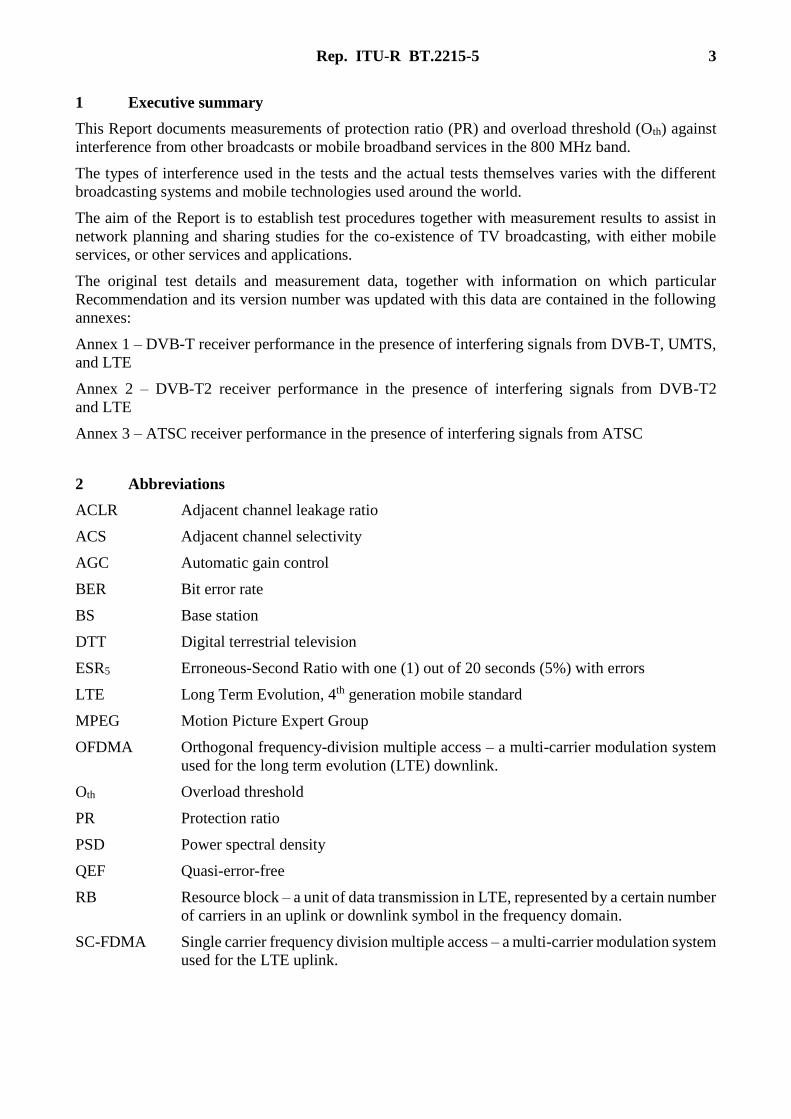
1 Executive summary
This Report documents measurements of protection ratio (PR) and overload threshold (Oth) against
interference from other broadcasts or mobile broadband services in the 800 MHz band.
The types of interference used in the tests and the actual tests themselves varies with the different
broadcasting systems and mobile technologies used around the world.
The aim of the Report is to establish test procedures together with measurement results to assist in
network planning and sharing studies for the co-existence of TV broadcasting, with either mobile
services, or other services and applications.
The original test details and measurement data, together with information on which particular
Recommendation and its version number was updated with this data are contained in the following
annexes:
Annex 1 – DVB-T receiver performance in the presence of interfering signals from DVB-T, UMTS,
and LTE
Annex 2 – DVB-T2 receiver performance in the presence of interfering signals from DVB-T2
and LTE
Annex 3 – ATSC receiver performance in the presence of interfering signals from ATSC
2 Abbreviations
ACLR Adjacent channel leakage ratio
ACS Adjacent channel selectivity
AGC Automatic gain control
BER Bit error rate
BS Base station
DTT Digital terrestrial television
ESR5 Erroneous-Second Ratio with one (1) out of 20 seconds (5%) with errors
LTE Long Term Evolution, 4th generation mobile standard
MPEG Motion Picture Expert Group
OFDMA Orthogonal frequency-division multiple access – a multi-carrier modulation system
used for the long term evolution (LTE) downlink.
Oth Overload threshold
PR Protection ratio
PSD Power spectral density
QEF Quasi-error-free
RB Resource block – a unit of data transmission in LTE, represented by a certain number
of carriers in an uplink or downlink symbol in the frequency domain.
SC-FDMA Single carrier frequency division multiple access – a multi-carrier modulation system
used for the LTE uplink.
4 Rep. ITU-R BT.2215-5
SFP Subjective failure point
TPC Transmit power control
UE User equipment – the mobile handset
UMTS Universal Telecommunications System, 3rd generation mobile standard
3 Useful definitions
3.1 Radio frequency signal-to-interference ratio (C/I)
It is the ratio, generally expressed in dB, of the power of the wanted signal to the total power of
interfering signals and noise, evaluated at the receiver input (see Recommendation ITU-R V.573).
The power of the wanted signal is measured in a bandwidth equal to the wanted signal bandwidth,
while the total power of interfering signal and noise is measured in a bandwidth equal to the
interfering signal bandwidth.
3.2 Radio frequency protection ratio (PR)
It is the minimum value of the signal-to-interference ratio required to obtain a specified reception
quality under specified conditions at the receiver input (note that this differs from the definition in
Recommendation ITU-R V.573). In this Report, the “specified reception quality” and the “specified
conditions” have been defined separately by each entity that has undertaken measurements.
Usually, PR is specified as a function of the frequency offset between the wanted and interfering
signals over a wide frequency range. In this Report, PR specified in this way is referred to as “PR
curve”. PR curves show the ability of a receiver to discriminate against interfering signals on
frequencies differing from that of the wanted signal.
3.3 Receiver (front-end) overload threshold
Overload threshold (Oth) is the interfering signal level expressed in dBm, above which the receiver
begins to lose its ability to discriminate against interfering signals at frequencies differing from that
of the wanted signal (i.e., the onset of strong non-linear behaviour). Therefore, above the overload
threshold the receiver will behave in a non-linear way, but does not necessarily fail immediately
depending on the receiver and interference characteristics.
3.4 Adjacent channel leakage power ratio
Adjacent channel leakage power ratio (ACLR) is the ratio of the filtered mean power centred on the
assigned channel frequency to the filtered mean power centred on an adjacent channel frequency.
The requirements shall apply whatever the type of transmitter considered (single carrier or
multi-carrier). It applies for all transmission modes foreseen by the manufacturer's specification. For
a multi-carrier base station (BS), the requirement applies for the adjacent channel frequencies below
the lowest carrier frequency transmitted by the BS and above the highest carrier frequency transmitted
by the BS for each supported multi-carrier transmission configuration. The requirement applies
during the transmitter ON period.

Rep. ITU-R BT.2215-5 5
3.5 “Can” tuners
“Can” tuners are classical superheterodyne tuners housed in a metal enclosure containing discrete
components. Classically, there are fixed and tunable circuits made up from discrete inductors and
transistors usually with varactor diode frequency control. The metal enclosure should minimize RF
interference and eliminate crosstalk and stray radiation.
3.6 “Silicon” tuners
“Silicon” tuners are IC-based tuners integrating all tuner circuitry into a small package directly to be
fitted onto main boards. The tuned circuits may be completely absent or can be integrated onto the
silicon. The silicon chip may be protected from external electromagnetic interference by a metallic
cover. Silicon tuners have different characteristics to can tuners and their performance can be better
and worse at some frequency offsets compared to can tuners.
4 References
4.1 Broadcsasting technology characteristics
The following references explain the characteristics of the different broadcast systems including
transmitter spectrum masks.
− DVB-T system characteristics: Recommendation ITU-R BT.1306, ETSI EN 300 744
− DVB-T2 system characteristics: Recommendation ITU-R BT.1877, ETSI EN 302 755
− ISDB-T system characteristics: Recommendation ITU-R BT.1306, ARIB STD-B31
− ATSC system characteristics: Recommendation ITU-R BT.1306, ATSC A/53
− DTMB system characteristics: Recommendation ITU-R BT.1306, GB20600-2006.
4.2 Mobile technology characteristics
The following references explain the characteristics of the different mobile broadband systems.
− UMTS system characteristics: ETSI TS 125.101, ETSI TS.125.104
− LTE system characteristics: ETSI TS 136.101, ETSI TS.136.104.
5 Measurement methodology
5.1 Example test setup
An example basic test setup for protection ratio and overload threshold measurements for digital
terrestrial television (DTT) is depicted in Fig. 1.

6 Rep. ITU-R BT.2215-5
FIGURE 1
Example test setup
It is necessary to insert an adjustable band-pass filter between the interfering signal generator and the
combiner. The objective of this filter is to eliminate the noise generated by the interfering signal
generator and adjust the interfering signal to the correct interference transmission mask and ACLR
values. In fact, most of the RF signal generators have a wide frequency range (from several hundred
of kHz to several GHz) prohibiting the use of an internal adjustable RF channel filter over their whole
frequency range. Consequently, depending on the generated signal level, a non-negligible wideband
noise may be observed at the generator output. The higher the generated interfering signal level, the
higher the noise level. The reduction of the undesired wideband noise by filtering at the output of
interfering signal generator is shown as an example in Fig. 2. If this noise is not reduced by filtering,
it is impossible to measure the actual protection ratios of the receiver under test. This is due to the
wideband noise generated by the interfering signal generator, falling into the wanted signal channel,
which cannot be reduced by the receiver filter. In this particular case, the receiver loses its ability to
discriminate against interfering signals on frequencies differing from that it is tuned to. This
phenomenon is shown in Fig. 3. It is also advisable to insert an isolator between the combiner and the
DTT signal generator to keep the power from the interfering signal generator returning to the DTT
signal generator output.
DTT
receiver
Interfering
signal
generator
Combiner
Interfering signal path
Wanted signalpath
Adjustable
band-pass
filter
DTT signal
generator
Video/Audio
sourceIsolator
Observer
Spectrum
analyser
Variable
attenuator
Impedancematching
(50W/75W)

Rep. ITU-R BT.2215-5 7
FIGURE 2
The benefit of band-pass filtering at the interfering signal generator output
Report BT.2215-02
–90
–80
–70
–60
–50
–40
–30
600 610 620 630 640 650 660 670 680
Frequency (MHz)
Useful DVB-T signalUseful DVB-T signal + unfiltered interfering signalUseful DVB-T signal + filtered interfering signal
–100
–110
–120
psd (
dB
m/1
0 k
Hz)
FIGURE 3
The benefit of band-pass filtering at the output of the interfering signal generator
(wanted signal level = Rx sensitivity +10 dB)
Report BT.2215-03
–80
–70
–60
–50
–40
–30
–20
–70 –60 –50 –40 –30 –20 –10 0 10 20 30 40 50 60 70 80
Frequency offset in MHz (fi-fw)
Measurements conducted without filter
Measurements conducted with a filter
CI/ (
dB
)
–80
8 Rep. ITU-R BT.2215-5
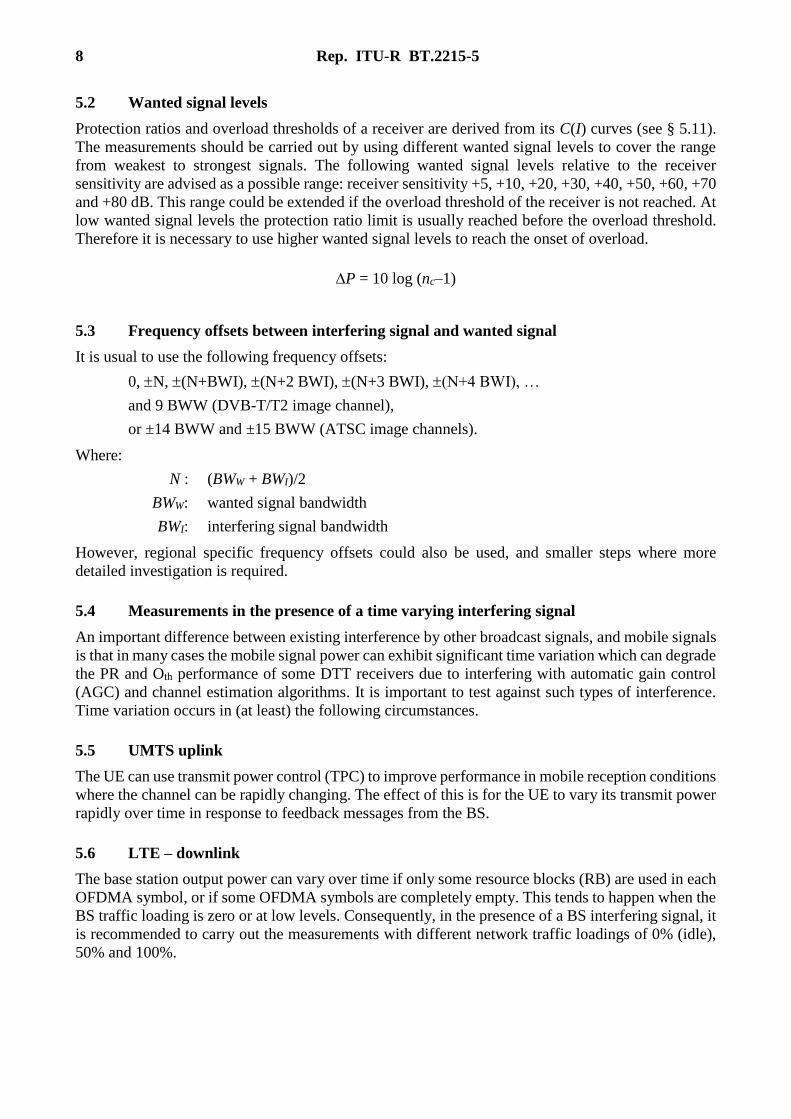
5.2 Wanted signal levels
Protection ratios and overload thresholds of a receiver are derived from its C(I) curves (see § 5.11).
The measurements should be carried out by using different wanted signal levels to cover the range
from weakest to strongest signals. The following wanted signal levels relative to the receiver
sensitivity are advised as a possible range: receiver sensitivity +5, +10, +20, +30, +40, +50, +60, +70
and +80 dB. This range could be extended if the overload threshold of the receiver is not reached. At
low wanted signal levels the protection ratio limit is usually reached before the overload threshold.
Therefore it is necessary to use higher wanted signal levels to reach the onset of overload.
P = 10 log (nc–1)
5.3 Frequency offsets between interfering signal and wanted signal
It is usual to use the following frequency offsets:
0, N, (N+BWI), (N+2 BWI), (N+3 BWI), (N+4 BWI), …
and 9 BWW (DVB-T/T2 image channel),
or ±14 BWW and ±15 BWW (ATSC image channels).
Where:
N : (BWW + BWI)/2
BWW: wanted signal bandwidth
BWI: interfering signal bandwidth
However, regional specific frequency offsets could also be used, and smaller steps where more
detailed investigation is required.
5.4 Measurements in the presence of a time varying interfering signal
An important difference between existing interference by other broadcast signals, and mobile signals
is that in many cases the mobile signal power can exhibit significant time variation which can degrade
the PR and Oth performance of some DTT receivers due to interfering with automatic gain control
(AGC) and channel estimation algorithms. It is important to test against such types of interference.
Time variation occurs in (at least) the following circumstances.
5.5 UMTS uplink
The UE can use transmit power control (TPC) to improve performance in mobile reception conditions
where the channel can be rapidly changing. The effect of this is for the UE to vary its transmit power
rapidly over time in response to feedback messages from the BS.
5.6 LTE – downlink
The base station output power can vary over time if only some resource blocks (RB) are used in each
OFDMA symbol, or if some OFDMA symbols are completely empty. This tends to happen when the
BS traffic loading is zero or at low levels. Consequently, in the presence of a BS interfering signal, it
is recommended to carry out the measurements with different network traffic loadings of 0% (idle),
50% and 100%.

Rep. ITU-R BT.2215-5 9
5.7 LTE – uplink
The uplink signal can vary considerably in both the time and frequency domains depending upon the
traffic loading required. In the frequency domain the number of RBs allocated for each SC-FDMA
symbol can vary rapidly. In the time domain, there can be long periods where the UE does not transmit
at all, leading to an irregular pulse like power profile.
Consequently, in the presence of a UE interfering signal, it is recommended to carry out the
measurements with different data rates on the uplink. The modes should include both fully loaded
continuous operation and time division multiplexed i.e., pulsed operation.
5.8 Interferer reference power level
Signal level variation can be from level reductions or time division occupancy. In order to be able to
see the degradations caused by time variation in the interfering signal, it is necessary to set the
appropriate rms power or power spectral density (psd) of the active portions of the time varying
interference signal relative to the rms power or psd of the interferer with a 100% traffic loading (time
invariant power condition).
5.9 Characterization of the interfering signal
Protection ratios and overload thresholds of a receiver strongly depend on the frequency and time
domain characteristics of the interfering signal used in the measurements. Therefore, it is necessary
to record the psd, the adjacent channel leakage power ratio as well as the amplitude as function of
time of the interfering signal. These pieces of information allow comparisons of different
measurement results from different measurement campaigns.
5.10 Failure point assessment methods
Initial studies of the protection ratios for the DVB-T system were based on a target bit error rate
(BER) of 2 10–4 measured between the inner and outer codes, before Reed-Solomon decoding. For
the case of a noise-like interferer, this has been taken to correspond to a quasi-error-free (QEF) picture
quality with the BER < 1 10–11 at the input of the MPEG-2 demultiplexer.
For domestic receivers it may not be possible to measure the BER and therefore a new method called
the subjective failure point (SFP) method has been proposed in Recommendation ITU-R BT.1368 for
protection ratio measurements in a unified manner. The quality criterion for protection ratio
measurements is to find a limit for a just error-free picture at the TV screen. The RF protection ratio
for the wanted DVB-T signal is a value of wanted-to-unwanted signal ratio at the receiver input,
determined by the SFP method, and rounded to the next higher integer value.
The SFP method corresponds to the picture quality where no more than one error is visible in the
picture for an average observation time of 20 s. The adjustment of the wanted and unwanted signal
levels for the SFP method is to be carried out in small steps, usually in steps of 0.1 dB. For a
“noise-like” interferer the difference in a value of wanted-to-unwanted signal ratio between the QEF
method with a BER of 2 10–4 and the SFP method is less than 1 dB. It is proposed that the SFP
method should be adopted for assessment of all DTT systems.
5.10.1 ESR5 Criterion for the Assessment of DTT Transmission Quality
The “erroneous-second ratio” or ESR5 criterion is used to assess the DTT (e.g., DVB-T) transmission
quality at portable and mobile reception. It is used instead of the “quasi error-free” (QEF) or the
“subjective failure point” (SFP) criterion.
10 Rep. ITU-R BT.2215-5
The bit error rate (BER) after the Viterbi decoder given in the DVB-T standard for quasi error-free
DVB-T reception is 2*10-4. This transmission quality assessment criterion is suitable for fixed
reception using a roof antenna, where the transmission channel transmitter – receiver is of type Gauss
or Rice. The bit error rate is quite constant with time and can be easily measured.
The QEF criterion is not suitable for portable or mobile reception. The transmission channel is mostly
of type Rayleigh (multipath). The BER fluctuation is very large and averaging over a longer time
period is necessary. An average BER of 2*10-4 after the Viterbi decoder is nevertheless no guaranty
for an error free reception.
The impairments at DVB-T transmission in Rayleigh channels occur in bursts. Even if the average
BER after the Viterbi decoder is well below 2*10-4 (QEF), the BER peaks during error bursts are so
high from time to time, that there are visible errors and also some losses of MPEG-2 transport stream
synchronization. Synchronization losses generate serious video errors.
For transmission quality assessments at portable and mobile DVB-T reception other criterion than
QEF have to be used. One such alternative criterion used is called “subjective failure point” (SFP).
The TV program received is observed on a monitor. The quality of the received signal fulfils the SFP
criterion if, in a 20-seconds time interval, there is no visible failure in the picture. The measurement
has the drawback, that it cannot be made automatically, and a person has to monitor permanently the
picture quality. It is not very accurate and gives different results for different observation times.
A more accurate criterion used to assess the transmission quality at portable and mobile DVB-T
reception is the “erroneous second ratio” criterion, also called ESR5 criterion. Compared to the SFP
criterion it has the advantage, that its accomplishment can be checked automatically, without the need
for a measuring engineer, and it can therefore be analyzed over a large time span. The errors in a
MPEG 2 transport stream, which generate visible failures of the picture, are the packet uncorrectable
errors signaled by a flag set by the Viterbi decoder, and the transport stream synchronization loss.
The ESR5 criterion is fulfilled if, in a time interval of 20 seconds, there is at most one second with
packet uncorrectable errors. If there is a transport stream synchronization loss, the ESR5 criterion is
not fulfilled for the corresponding 20 seconds time interval.
The ratio second with errors to all seconds in the 20-seconds time interval is 5 %, explaining the index
5 in ESR5.
The ESR5 and the SFP criteria are somehow equivalent. The time interval for the basic assessment is
20 seconds for both. The smallest time interval for the error assessment at ESR5 is the second. One
or more errors in the transport stream during one second have the same subjective influence on the
video quality and are perceived at a SFP measurement as one error. Not all transport-stream errors
are producing visible errors, and for this reason, in contrast to SFP, at ESR5 one erroneous second in
a 20 second interval is allowed.
The description of the transmission quality is correct and accurate if the assessment is done for a
larger time span, for example 15 to 60 minutes. In this case the measurement time is segmented in
20 seconds intervals, and in every interval the fulfillment of the ESR5 criterion is tested. The ratio
number of 20-second intervals fulfilling the ESR5 criterion to the number of all 20-second intervals
shows an average of the transmission quality. The averaging is important because a Rayleigh
transmission channel has big fluctuations in time.
In a Gaussian or Rice channel the receiving quality is poor if the carrier to noise (C/N) value is only
so high, that the SFP or the ESR5 criterion is just fulfilled. One possible error each 20-seconds interval
is too much. The criteria are nevertheless suitable for quick measurements, and a 1-2 dB carrier power
increase enhances the transmission quality considerably. This is due to the low power variation in
time in Gaussian and Rice channels.

Rep. ITU-R BT.2215-5 11
In a Rayleigh channel the power variation with time is remarkably higher. The DVB-T transmission
quality is good, if the ESR5 criterion is fulfilled for at least 99 % of time. The BER variation is quite
high, and if only 1% of the 20-second intervals have more than one erroneous second within, most of
the other intervals will have no erroneous second at all within. The assessment of the transmission
quality takes now also its time variation into account.
The segmentation of the measurement time in 20 second intervals for the assessment of the
compliance with the ESR5 criterion is an arbitrary process. For short time intervals, the position of
the starting point can influence the results, for large time intervals, there is a statistical smoothing of
the results.
The ESR5 criterion is less demanding than the QEF criterion. For the mode 16 QAM 2/3 the signal
to noise ratio C/N in a Gaussian channel for 99% of time good quality transmission in accordance to
the ESR5 criterion is 1.2 dB lower than for the QEF-criterion.
In a Rayleigh channel, especially at mobile reception, the QEF criterion cannot be fulfilled for all the
time, even for unrealistically high field strength levels. The only realistic requirement is the
compliance to the ESR5 criterion.
In conclusion, the “erroneous-second ratio”- or ESR5-criterion is a suitable criterion to assess the
longtime, average DTT transmission quality at portable and mobile reception. It states that, if in a
time interval of 20 seconds there is at most one erroneous second, the transmission quality for this
20-seconds interval is good. The average, longtime transmission quality is good, if the ESR5 criterion
is fulfilled for at least 99 % of time.
5.11 Method for determining protection ratios and overload thresholds
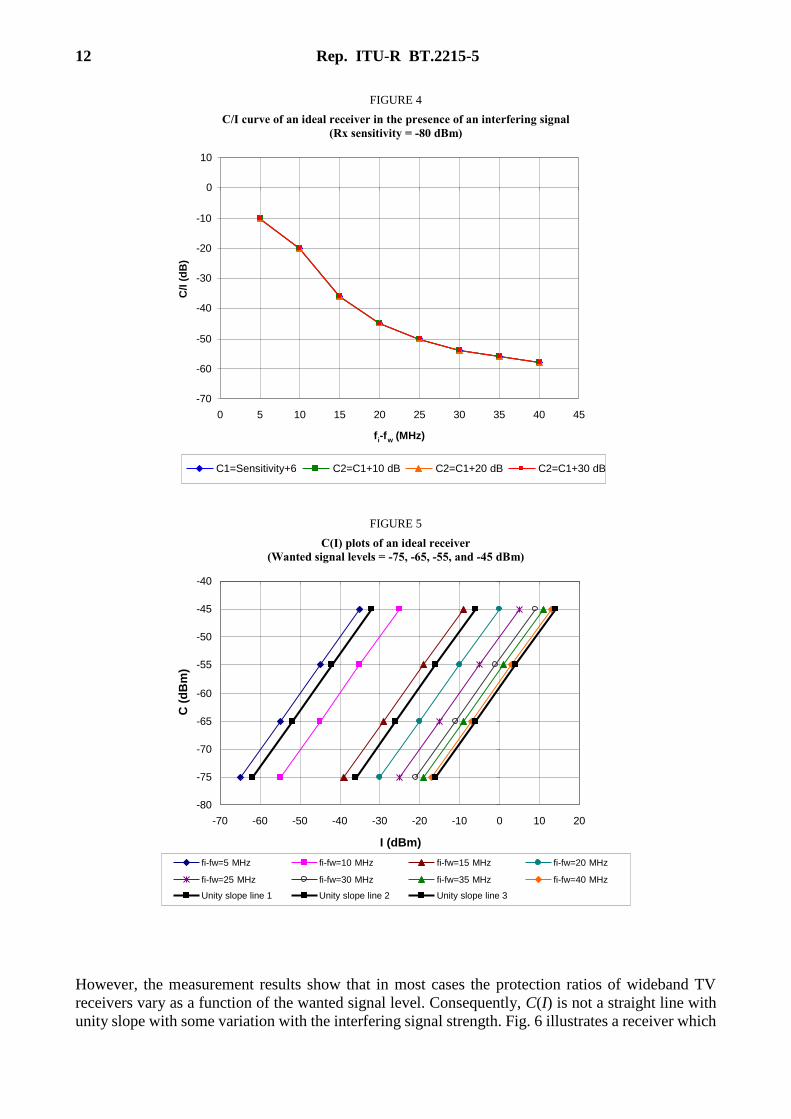
It should be stressed that the protection ratios are generally considered and used as independent of
the wanted signal level. That is C(I) is supposed to be a linear function with unity slope (a straight
line with unity slope). The protection ratio of the receiver is obtained by subtracting I from C(I) at
any point on this line and can be used for all wanted signal levels. Fig. 4 illustrates the C/I curve of
an ideal receiver in the presence of an interfering signal. The ideal receiver has perfectly linear
behavior under all circumstances without overload. Fig. 5 illustrates the C(I) plots for the ideal
receiver described in Fig. 4. The ideal receiver has identical C/I curves. Consequently, unity slope
C(I) lines show that the receiver protection ratios depend neither on the wanted nor the interfering
signal levels, but only C/I.
12 Rep. ITU-R BT.2215-5
FIGURE 4
C/I curve of an ideal receiver in the presence of an interfering signal
(Rx sensitivity = -80 dBm)
FIGURE 5
C(I) plots of an ideal receiver
(Wanted signal levels = -75, -65, -55, and -45 dBm)
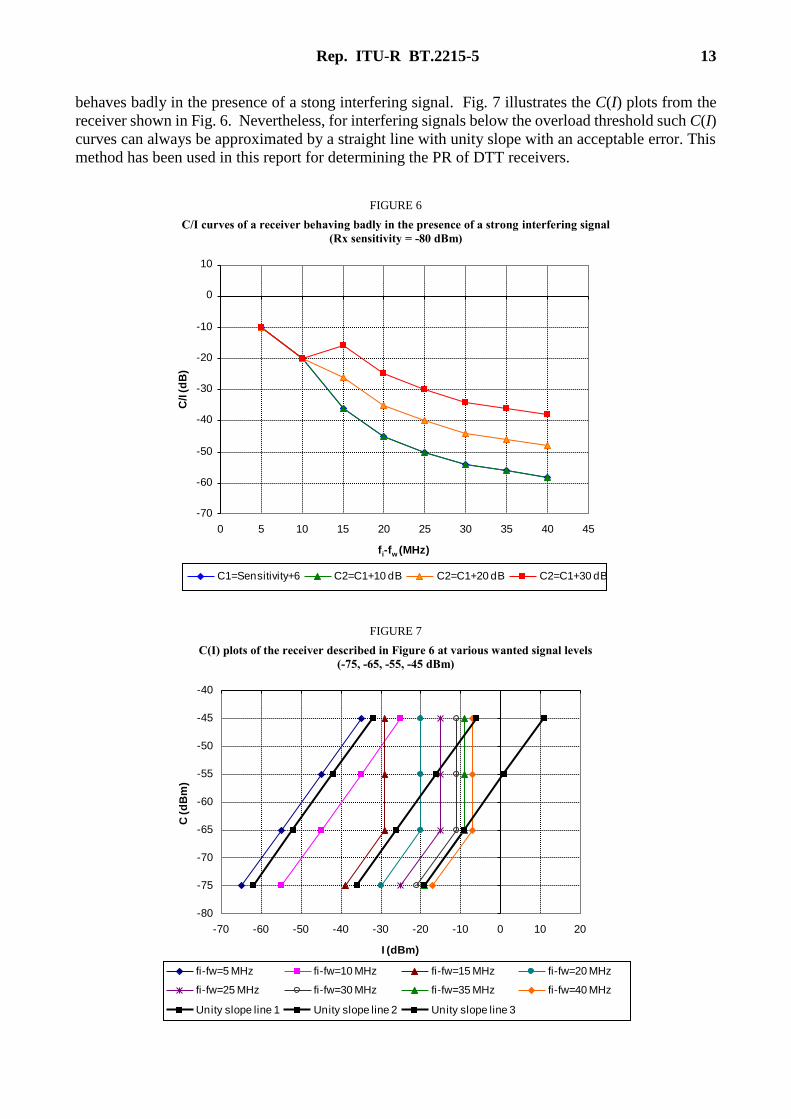
However, the measurement results show that in most cases the protection ratios of wideband TV
receivers vary as a function of the wanted signal level. Consequently, C(I) is not a straight line with
unity slope with some variation with the interfering signal strength. Fig. 6 illustrates a receiver which
-70
-60
-50
-40
-30
-20
-10
0
10
0 5 10 15 20 25 30 35 40 45
fi-fw (MHz)
C/I
(d
B)
C1=Sensitivity+6 C2=C1+10 dB C2=C1+20 dB C2=C1+30 dB
-80
-75
-70
-65
-60
-55
-50
-45
-40
-70 -60 -50 -40 -30 -20 -10 0 10 20
I (dBm)
C (
dB
m)
fi-fw=5 MHz fi-fw=10 MHz fi-fw=15 MHz fi-fw=20 MHz
fi-fw=25 MHz fi-fw=30 MHz fi-fw=35 MHz fi-fw=40 MHz
Unity slope line 1 Unity slope line 2 Unity slope line 3
Rep. ITU-R BT.2215-5 13
behaves badly in the presence of a stong interfering signal. Fig. 7 illustrates the C(I) plots from the
receiver shown in Fig. 6. Nevertheless, for interfering signals below the overload threshold such C(I)
curves can always be approximated by a straight line with unity slope with an acceptable error. This
method has been used in this report for determining the PR of DTT receivers.
FIGURE 6
C/I curves of a receiver behaving badly in the presence of a strong interfering signal
(Rx sensitivity = -80 dBm)
FIGURE 7
C(I) plots of the receiver described in Figure 6 at various wanted signal levels
(-75, -65, -55, -45 dBm)
-70
-60
-50
-40
-30
-20
-10
0
10
0 5 10 15 20 25 30 35 40 45
fi-fw (MHz)
C/I (d
B)
C1=Sensitivity+6 C2=C1+10 dB C2=C1+20 dB C2=C1+30 dB
-80
-75
-70
-65
-60
-55
-50
-45
-40
-70 -60 -50 -40 -30 -20 -10 0 10 20
I (dBm)
C (d
Bm
)
fi-fw=5 MHz fi-fw=10 MHz fi-fw=15 MHz fi-fw=20 MHz
fi-fw=25 MHz fi-fw=30 MHz fi-fw=35 MHz fi-fw=40 MHz
Unity slope line 1 Unity slope line 2 Unity slope line 3

14 Rep. ITU-R BT.2215-5
The method used for determining protection ratios and overload thresholds is composed of two steps:
1) The measured C(I) curve is approximated by a straight line with unity slope which represents
the ideal linear behaviour of the receiver front-end (constant PR case). The protection ratio
of the receiver is obtained by subtracting I from C(I) at any point on this line. The protection
ratio obtained can be used for all wanted signal levels.
2) A strong deviation of the measured C(I) curve from the straight line with unity slope indicates
where the interfering signal reaches the overload threshold; i.e., the onset of strong non-linear
behaviour. The deviated segment of C(I) curve is approximated by a line vertical to I-axis
(constant I case). The value of I at the point of intersection between the straight line with
unity slope and the line vertical to I-axis is considered to be the receiver overload threshold
(I = Oth).
This two steps procedure is depicted in Fig. 8.
FIGURE 8
Determination of the receiver protection ratio and overload threshold
from its C(I) curve; PR = −46 dB, Oth = −2 dBm
Report BT.2215-04
Receiver (I) curve - = 16 MHz
Cf fi w
–80
–70
–60
–50
–40
–30
–20
–10
–40 –35 –30 –25 –20 –15 –10 –5 0 5 10 15 20
I (dBm)
Measured C(I) Constant PR case Oth
0
C (
dB
m)
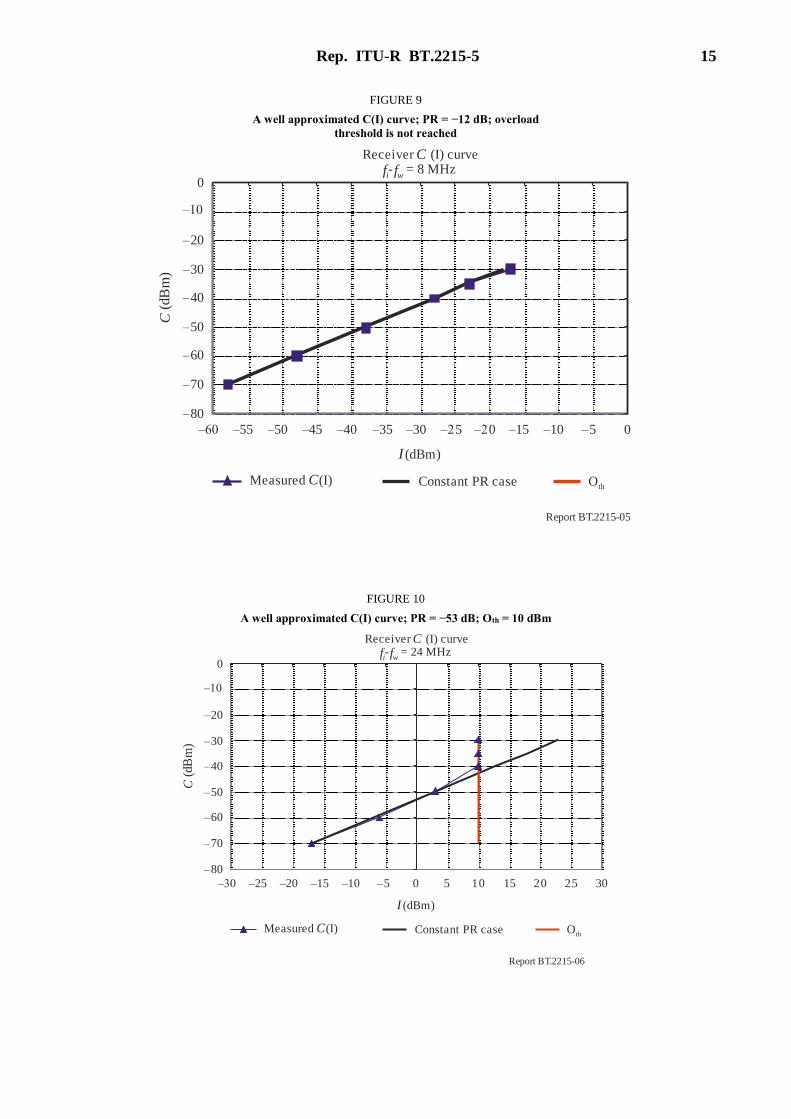
In some cases the approximation of a measured C(I) curve by a straight line with unity slope and a
line vertical to I-axis may seem not to be very straight forward, but it is always possible to do it with
an acceptable approximation error that should be in favour of the victim receiver.
Examples of approximations are shown in Figs 9 to 16. These examples use a wanted signal level
range starting at −70 dBm, but lower levels are possible depending upon the sensitivity of the receiver
mode being tested.
Rep. ITU-R BT.2215-5 15
FIGURE 9
A well approximated C(I) curve; PR = −12 dB; overload
threshold is not reached
Report BT.2215-05
Receiver (I) curve- = 8 MHz
Cf fi w
–80
–70
–60
–50
–40
–30
–20
–10
–60 –55 –50 –45 –20 –15 –10 –5 0
I (dBm)
Measured (I)C Constant PR case Oth
0
C (
dB
m)
–40 –35 –30 –25
FIGURE 10
A well approximated C(I) curve; PR = −53 dB; Oth = 10 dBm
Report BT.2215-06
Receiver (I) curve- = 24 MHz
Cf fi w
–80
–70
–60
–50
–40
–30
–20
–10
–30 –25 –20 –15 10 15 20 25 30
I (dBm)
Measured (I)C Constant PR case Oth
0
C (
dB
m)
–10 –5 0 5
16 Rep. ITU-R BT.2215-5
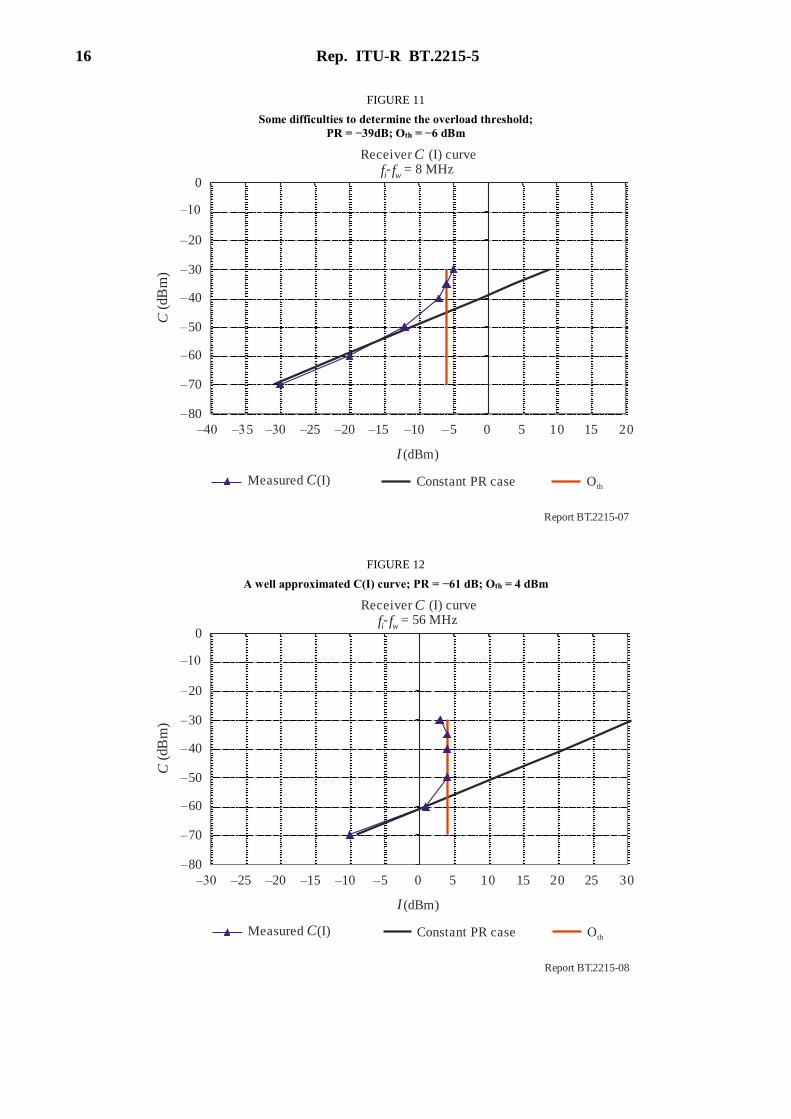
FIGURE 11
Some difficulties to determine the overload threshold;
PR = −39dB; Oth = −6 dBm
Report BT.2215-07
Receiver (I) curve- = 8 MHz
Cf fi w
–80
–70
–60
–50
–40
–30
–20
–10
–30 –25 –20 –15 10 15 20
I (dBm)
Measured (I)C Constant PR case Oth
0
C (
dB
m)
–10 –5 0 5–40 –35
FIGURE 12
A well approximated C(I) curve; PR = −61 dB; Oth = 4 dBm
Report BT.2215-08
Receiver (I) curve- = 56 MHz
Cf fi w
–80
–70
–60
–50
–40
–30
–20
–10
–30 –25 –20 –15 10 15 20
I (dBm)
Measured (I)C Constant PR case Oth
0
C (
dB
m)
–10 –5 0 5 25 30

Rep. ITU-R BT.2215-5 17
In the following example the receiver appears to behave in a non linear fashion when the interfering
signal level reaches −21 dBm, but is quite linear for higher interfering signal levels up to 3 dBm.
FIGURE 13
A well approximated C(I) curve; PR = −39 dB; Oth = 4 dBm
Report BT.2215-09
Receiver (I) curve- = 36.5 MHz
Cf fi w
–80
–70
–60
–50
–40
–30
–20
–10
–30 –25 –20 –15 10 15 20
I (dBm)
Measured (I)C Constant PR case Oth
0
C (
dB
m)
–10 –5 0 5–40 –35
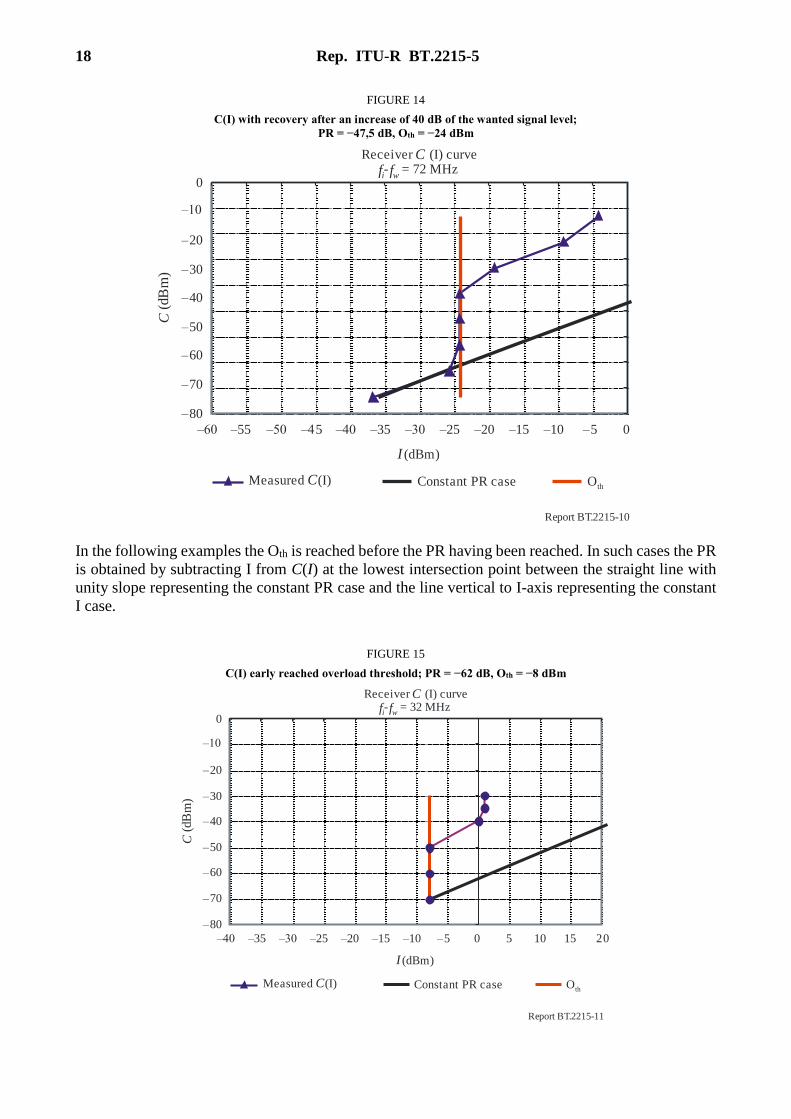
In the following example the Oth is reached at an interfering signal level of −24 dBm. However, the
measured C(I) curve shows that an increase of the wanted signal level by about 30 dB allows the
receiver to behave linearly once again but with a reduced PR (−16 dB instead of −48 dB).
18 Rep. ITU-R BT.2215-5
FIGURE 14
C(I) with recovery after an increase of 40 dB of the wanted signal level;
PR = −47,5 dB, Oth = −24 dBm
Report BT.2215-10
Receiver (I) curve- = 72 MHz
Cf fi w
–80
–70
–60
–50
–40
–30
–20
–10
–30 –25 –20 –15
I (dBm)
Measured (I)C Constant PR case Oth
0
C (
dB
m)
–10 –5 0–40 –35–50 –45–60 –55
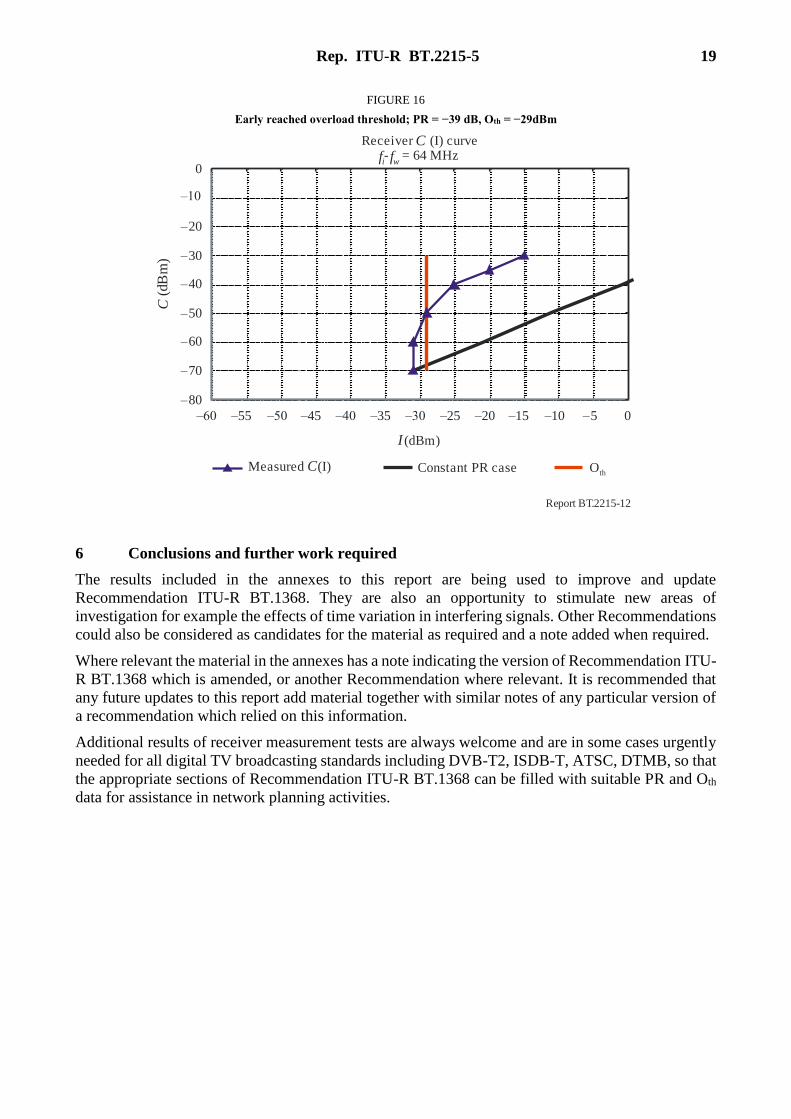
In the following examples the Oth is reached before the PR having been reached. In such cases the PR
is obtained by subtracting I from C(I) at the lowest intersection point between the straight line with
unity slope representing the constant PR case and the line vertical to I-axis representing the constant
I case.
FIGURE 15
C(I) early reached overload threshold; PR = −62 dB, Oth = −8 dBm
Report BT.2215-11
Receiver (I) curve- = 32 MHz
Cf fi w
–80
–70
–60
–50
–40
–30
–20
–10
–30 –25 –20 –15
I (dBm)
Measured (I)C Constant PR case Oth
0
C (
dB
m)
–10 –5 0–40 –35 5 10 15 20
Rep. ITU-R BT.2215-5 19
FIGURE 16
Early reached overload threshold; PR = −39 dB, Oth = −29dBm
Report BT.2215-12
Receiver (I) curve- = 64 MHz
Cf fi w
–80
–70
–60
–50
–40
–30
–20
–10
–30 –25 –20 –15
I (dBm)
Measured (I)C Constant PR case Oth
0C
(dB
m)
–10 –5 0–40 –35–50 –45–60 –55
6 Conclusions and further work required
The results included in the annexes to this report are being used to improve and update
Recommendation ITU-R BT.1368. They are also an opportunity to stimulate new areas of
investigation for example the effects of time variation in interfering signals. Other Recommendations
could also be considered as candidates for the material as required and a note added when required.
Where relevant the material in the annexes has a note indicating the version of Recommendation ITU-
R BT.1368 which is amended, or another Recommendation where relevant. It is recommended that
any future updates to this report add material together with similar notes of any particular version of
a recommendation which relied on this information.
Additional results of receiver measurement tests are always welcome and are in some cases urgently
needed for all digital TV broadcasting standards including DVB-T2, ISDB-T, ATSC, DTMB, so that
the appropriate sections of Recommendation ITU-R BT.1368 can be filled with suitable PR and Oth
data for assistance in network planning activities.
20 Rep. ITU-R BT.2215-5
Annex 1
DVB-T receiver performance in the presence of interfering signals
from DVB-T, UMTS, and LTE
Annex 1 contains measurements of protection ratios and overload thresholds for DVB-T receivers
in the presence of various interfering signals including DVB-T, base stations (BS) and user
equipment (UE) for UMTS, and BS and UE for LTE.
A.1.1 Measurements of protection ratios and overload thresholds for DVB-T receivers under
interference from DVB-T in adjacent channels
Annex 1A contains measurements of protection ratios and overload thresholds for eight DVB-T
receivers (four with “can” tuners and four with silicon tuners) under interference from DVB-T in
adjacent channels. This information was used in the generation of Recommendation ITU-R
BT.1368-8.
Annex 1A
A.1.2 Measurements of protection ratio and overload threshold for DVB-T receivers under
interference from UMTS BS and UE in co- and adjacent channels
Annex 1B contains measurements of protection ratios and overload thresholds for seven DVB-T
receivers (four with “can” tuners and three with silicon tuners) under interference from a UMTS BS
and UE in adjacent channels. This information was used in the generation of Recommendation ITU-
R BT.1368-8.
Annex 1B
Annex 1C contains graphical plots of protection ratios for DVB-T under interference from a UMTS
BS and UE with and without TPC in co- and adjacent channels and with different TPC speed profiles.
Only can tuners were tested. Note the test methodology may differ from the recommended
methodology used for other measurements in this report, and for future measurements.
Annex 1C
Annex 1D contains measurements of protection ratios and overload thresholds for ten DVB-T
receivers (all with “can” tuners) under interference from a UMTS BS and UE in co- and adjacent
channels. Note the test methodology may differ from the recommended methodology used for other
measurements in this report, and for future measurements.
Annex 1D
Rep. ITU-R BT.2215-5 21
A.1.3 Measurements of protection ratios and overload thresholds for DVB-T receivers under
interference from LTE BS and UE in co- and adjacent channels
Annex 1E contains measurements of protection ratios and overload thresholds for 13 DVB-T
receivers (nine with “can” tuners and four with silicon tuners) under interference from an LTE BS
and UE in adjacent channels. These measurements use the recommended test methodology. This
information was used in the generation of Recommendation ITU-R BT.1368-8.
Annex 1E
Annex 1F contains measurements of protection ratios and overload thresholds in adjacent channels
for 20 DVB-T receivers (ten “can” tuners and ten silicon tuners) under interference from an LTE BS
with three traffic loadings (idle, 50%, and 100%). These measurements use the recommended test
methodology. This information was used in the generation of Recommendation ITU-R BT.1368-8.
Annex 1F
Annex 1G contains measurements of protection ratios in co- and adjacent channels for five DVB-T
receivers (two “can” tuners and three silicon tuners) under interference from an LTE BS with two
traffic loadings (idle and 100%). These measurements use the recommended test methodology.
Annex 1G
Annex 1H investigates the adjacent channel interfering effect of an LTE BS and UE in 17 DVB-T
receivers. Protection ratios were measured for transmission channels which included Gaussian, static
Rayleigh, and time-varying Rayleigh. Results for 90th percentiles are tabulated. Note the tests used
the ESR5 methodology which may differ from the recommended methodology used for other
measurements in this report, and for future measurements.
Annex 1H
Annex 1I contains measurements of protection ratios and overload thresholds in adjacent channels
for 14 DVB-T receivers (seven “can” tuners and seven silicon tuners) under interference from an LTE
BS and UE with three traffic loadings (idle, 50%, and 100%). The measurements consider the reduced
ACLR performance of the UE, compared to the BS, and the resulting increase in the protection ratios.
Annex 1I
22 Rep. ITU-R BT.2215-5
Annex 1J contains measurements of protection ratios and overload thresholds in adjacent channels
for five DVB-T receivers with silicon tuners under interference from an LTE UE with traffic loadings
of 1 Mbps, 10 Mbps, and 20 Mbps. The measurements use the recommended test methodology and
is the same as that used in Annex 1F.
Annex 1J
Annex 1K contains an updated analysis of the protection ratios and overload thresholds in adjacent
channels from measurements made in Annexes 1I and 1J for DVB-T receivers under interference
from an LTE UE. This analysis provided revisions to Tables 38 and 38A in Recommendation
ITU-R BT.1368-9.
Annex 1K
Annex 1L contains measurements of protection ratios and overload thresholds for five DVB-T
receivers under interference from an LTE UE in an adjacent channel with a 9 MHz guard band. The
measurements were made with an LTE UE ACLR of 60 and 70 dB as well as a continuous and a
discontinuous LTE UE transmission. The impact of a bandpass filter centred in the DVB-T channel
was also measured.
Annex 1L
Rep. ITU-R BT.2215-5 23
Annex 2
DVB-T2 receiver performance in the presence of
interfering signals from DVB-T2 and LTE
Annex 2 contains measurements of protection ratios and overload thresholds for DVB-T2 receivers
in the presence of various interfering signals including DVB-T2, base stations (BS) and user
equipment (UE) for LTE, and wireless broadband access systems.
A.2.1 Measurements of protection ratios and overload thresholds for DVB-T2 receivers
under interference from DVB-T2 in other channels
Annex 2A contains measurements of protection ratios and overload thresholds for 14 DVB-T2
receivers, three with “can” tuners and eleven with silicon tuners, under interference from DVB-T2 in
adjacent channels.
Annex 2A
A.2.2 Measurements of protection ratios and overload thresholds for DVB-T2 receivers
under interference from LTE BS in co- and adjacent channels
Annex 2B contains measurements of protection ratios and overload thresholds for 14 DVB-T2
receivers under interference from an LTE BS in adjacent channels. The measurements were made
with the same receivers as those used in Annex 2A. The protection ratios have been corrected for the
actual LTE BS ACLR values.
Annex 2B
Annex 2C compares the protection ratios and overload threshold measurements of DVB-T2 receivers
at 690 MHz, 754 MHz and 786 MHz with LTE BS interference in adjacent channels. Four DVB-T2
receivers (two with “can” tuners and two with silicon tuners) and the test setup described in Annex
2B were used.
Annex 2C
Annex 2D contains measurements of protection ratios for nine DVB-T2 receivers (four with “can”
tuners and five with silicon tuners) under interference in co- and adjacent channels from an LTE BS
with traffic loadings at idle and 100 percent. Measurements were made at three DVB-T2 signal levels
(-70, -50, and -30 dBm). The test setup and interfering signals are described in Annex 1G.
Annex 2D
A.2.3 Measurements of protection ratios and overload thresholds for DVB-T2 receivers
under interference from LTE UE in adjacent channels
Annex 2E contains measurements of protection ratios for three DVB-T2 receivers (two “can” and
one silicon) under interference in two adjacent channels from a gated “LTE UE signal” using an

24 Rep. ITU-R BT.2215-5
arbitrary signal generator as described in Annex 1I. The ACLR was better than 50 dB and no
corrections were made to the protection ratios.
Annex 2E
Annex 2F contains measurements of protection ratios and overload thresholds for 14 DVB-T2
receivers under interference in adjacent channels from an LTE UE with traffic loadings of 1 Mbps,
10 Mbps, and 20 Mbps. The measurements were made with the same receivers as those used in
Annex 2A. The degradation of the protection ratios due to the ACLR (75, 85, and 90 dB) of the
LTE UE was evaluated.
Annex 2F
Annex 2G contains measurements of protection ratios for three DVB-T2 receivers with different
silicon tuners under interference in adjacent channels from an LTE UE with full traffic loading. The
tests evaluated the performance with and without filtering at the DVB-T2 receiver input as well as
the LTE UE output. The results include calculation of the receiver adjacent channel selectivity (ACS)
as well as calculation of the minimum separation distance for fixed rooftop and portable indoor DTT
reception.
Annex 2G
Annex 2H contains measurements of protection ratios and overload thresholds for five DVB-T2
receivers under interference from an LTE UE in an adjacent channel with a 9 MHz guard band. The
measurements were made with an LTE UE ACLR of 60 and 70 dB as well as a continuous and a
discontinuous LTE UE transmission. The impact of a bandpass filter centred in the DVB-T channel
was also measured. The test setup and LTE UE signals are described in Annex 1L.
Annex 2H
A.2.4 Measurements of protection ratios and overload thresholds for DVB-T2 receivers
under interference from wireless broadband access systems in co- and adjacent
channels
Annex 2I contains measurements of protection ratios for three DVB-T2 test receivers under
interference from a simulated wireless broadband access system operating in co- and adjacent
channels. Field measurements were made in addition to the initial laboratory tests.
Annex 2I

Rep. ITU-R BT.2215-5 25
Annex 3
ATSC receiver performance in the presence of
interfering signals from ATSC
Annex 3 contains measurements of protection ratios and receiver desensitisation for ATSC receivers
in the presence of various interfering signals including ATSC.
A.3.1 Measurements of protection ratios and receiver desensitisation for ATSC receivers
under interference from ATSC on adjacent channels
Annex 3A contains measurements of protection ratios and receiver desensitization for 48 ATSC
receivers (26 “can”, 18 silicon, and four indeterminate) under interference from ATSC signals on
adjacent channel pairs. Protection ratios for specific wanted ATSC signal levels (Weak: -68dBm and
Moderate: -53 dBm) are interpolated.
Annex 3A
Annex 3B contains measurements of protection ratios for 12 ATSC receivers under interference from
single and multiple ATSC signals on adjacent channels. Protection ratios at wanted ATSC signal
levels of -68 dBm (Weak) and -78 dBm (Very Weak) were measured. The results confirm that ATSC
receivers, in general, meet the ATSC performance targets. In addition, the selectivity of ATSC
receivers can be degraded by the presence of third order intermodulation products.
Annex 3B
Annex 3C contains measurements of protection ratio thresholds and receiver desensitization for 24
ATSC receivers (six “can”, 14 silicon, and four indeterminate tuners) under interference from ATSC
signals on adjacent channels. The results demonstrate that the protection ratios in Recommendation
ITU-R BT.1368 are adequate except for weak wanted signals. Significantly increases in signal field
strength are required in order to maintain reception in the presence of adjacent channel interference.
Annex 3C
Annex 3D contains the results of measurements made on 12 ATSC receivers under interference from
various interference sources including multiple ATSC signals on adjacent channels. Based on the
unit sales data and the manufacturer input, it was determined that 12 receivers carefully selected
from specific manufacturers would represent approximately 85% of the DTV shipments in the
United States market in 2012 – 2013. A subset of six were used for more extensive testing and
represents approximately 75% of the DTV shipments in the United States market.
Annex 3D
Annex 3E contains an analysis of the measurements contained in Annexes 3A through 3D. Protection
ratios at threshold were considered for 60 ATSC receivers at wanted ATSC signal levels of –53 dBm
26 Rep. ITU-R BT.2215-5
(moderate), –68 dBm (Weak) and –78 dBm (Very Weak). The results provide planning factors based
upon the 90th percentile of receivers being able to maintain reception under multiple interference
conditions.
Annex 3E