Embed Size (px)
Citation preview
Office of Research & Library ServicesWSDOT Research Report
Measurements of Pile Driving Noise from Control Piles and Noise-Reduced Piles at the Vashon Island Ferry Dock
Peter H. DahlDavid R. Dall’Osto Jim Laughlin
WA-RD 861.2 April 2017
17-02-0075

Research Report Agreement T1461, Task 25
Impact Pile Driving Noise, Vashon Island
WA-RD 861.2
MEASUREMENTS OF PILE DRIVING NOISE FROM CONTROL PILES AND NOISE-REDUCED PILES
AT THE VASHION ISLAND FERRY DOCK
by
Peter H. Dahl David R. Dall’Osto
Applied Physics Laboratory University of Washington
Seattle, Washington 98105
Washington State Transportation Center (TRAC)
University of Washington, Box 354802 1107 NE 45th Street, Suite 535
Seattle, Washington 98105-4631
and
Jim LaughlinWashington State Department of Transportation
Technical Monitor
Prepared for
The State of Washington Department of Transportation
Roger Millar, Secretary
April 2017

TECHNICAL REPORT STANDARD TITLE PAGE
1. REPORT NO. 2. GOVERNMENT ACCESSION NO. 3. RECIPIENT'S CATALOG NO.
WA-RD 861.2 5. REPORT DATE4. TITLE AND SUBTITLE
Measurements of Pile Driving Noise from Control Piles and Noise-Reduced Piles at the Vashon Island Ferry Dock
April 2017 6. PERFORMING ORGANIZATION CODE
7. AUTHOR(S) 8. PERFORMING ORGANIZATION REPORT NO.
Peter H. Dahl, David R. Dall’Osto, Jim Laughlin
9. PERFORMING ORGANIZATION NAME AND ADDRESS 10. WORK UNIT NO.
Washington State Transportation Center (TRAC) University of Washington, Box 354802 University District Building; 1107 NE 45th Street, Suite 535 Seattle, Washington 98105-4631
11. CONTRACT OR GRANT NO.
Agreement T1461, Task 25
12. SPONSORING AGENCY NAME AND ADDRESS 13. TYPE OF REPORT AND PERIOD COVERED
Research Office Washington State Department of Transportation Transportation Building, MS 47372 Olympia, Washington 98504-7372 Project Manager: Jon Peterson, 360.705.7499
Research Report14. SPONSORING AGENCY CODE
15. SUPPLEMENTARY NOTES
This study was conducted in cooperation with the U.S. Department of Transportation, Federal Highway Administration.
16. ABSTRACT:
As part of the Washington State Department of Transportation (WSDOT) pile attenuation test program, researchers from the University of Washington Applied Physics Laboratory (APL-UW) conducted underwater sound measurements on 7 and 8 December 2015 at the Vashon Island ferry dock. A WSDOT team operating closer to the construction barge also took measurements. The goals of the APL-UW team were to measure the underwater sound field over nearly the entire water column and away from interfering structures, as well as to make robust estimates of sound mitigation performance of two test pile designs in terms of sound exposure level (SEL) and peak pressure. Measurements on the R/V Robertson were taken at a range of 120 m from the construction barge complex and pile source location and at a water depth 12.5 m by using a vertical line array (VLA) that spanned 1.25 to 9.25 m in depth. A comparison of the 7 December measurements from the double wall test pile with the control pile showed reductions in peak pressure (8.7–13.5 dB), RMS pressure (8.8–12.7 dB), and SEL (7–10.3 dB). A comparison of the 8 December measurements from the mandrel test pile with the 7 December measurements from the control pile showed reductions in peak pressure (11.4–14 dB), RMS pressure (10.8–12.6 dB), and SEL (9.3 and 11.1 dB). The reduction in peak pressure generally increased as measurement depth on the VLA increased; for the RMS and SEL metrics, no trend was observed. 17. KEY WORDS 18. DISTRIBUTION STATEMENT
Impact pile driving, underwater sound, sound mitigation, attenuation, sound exposure level (SEL)
No restrictions. This document is available to the public through the National Technical Information Service,
Springfield, VA 22616
19. SECURITY CLASSIF. (of this report) 20. SECURITY CLASSIF. (of this page) 21. NO. OF PAGES 22. PRICE
None None
iii
DISCLAIMER
The contents of this report reflect the views of the authors, who are responsible for the facts
and the accuracy of the data presented herein. The contents do not necessarily reflect the official
views or policies of the Washington State Department of Transportation or Federal Highway
Administration. This report does not constitute a standard, specification, or regulation.

iv
v
Table of Contents
EXECUTIVE SUMMARY ....................................................................................... ix
INTRODUCTION AND SEQUENCE OF EVENTS ............................................... 1
MEASUREMENT GEOMETRY AND INSTRUMENTATION ON THE R/V ROBERTSON ...................................................................................................... 4
RESULTS FROM THE R/V ROBERTSON MEASUREMENTS ........................... 7
Underwater Sound Level Meter (USLM) ............................................................ 7
Vertical Line Array (VLA) .................................................................................. 10
RESULS FROM WSDOT MEASURMENTS .......................................................... 19
ACKNOWLEDGMENTS ......................................................................................... 24
APPENDIX A: DETERMINATION OF RMS AND SEL MEASUREMENTS ...... 25
APPENDIX B: A NOTE ON ACOUSTIC MEASUREMENT UNCERTAINTY ... 26
vi
FIGURES
Figures Page
1 Plan view showing proposed anchor position of the R/V Robertson approxi- mately 100 m from the test pile center and construction barge complex. ..... 1
2a Photograph from the stern of the anchored R/V Robertson overlooking the A-frame and looking toward the construction barge complex....................... 2
2b Photograph taken from the ferry dock looking toward the construction barge complex ................................................................................................ 2
3a The placement of the impact hammer on the control pile ............................. 3
3b The three piles in the template ....................................................................... 3
4 Depth distribution of the hydrophones deployed from the R/V Robertson ... 4
5 Locations of the underwater sound measurements ........................................ 5
6 Sound speed vs depth ..................................................................................... 6
7a Phase 1: Results in terms of peak pressure, RMS pressure, and SEL of the first approximately 40 strikes made on the control pile ................................. 7
7b Phase 2: Results in terms of peak pressure, RMS pressure, and SEL of 231 strikes made on the control pile ..................................................................... 8
8a Phase 3: Results in terms of peak pressure, RMS pressure, and SEL of 272 strikes made on the double wall test pile ....................................................... 8
8b Phase 4: Results in terms of peak pressure, RMS pressure, and SEL of 23 strikes made on the double wall test pile ....................................................... 9
8c Phase 5: Results in terms of peak pressure, RMS pressure, and SEL of 95 strikes on the double wall test pile ................................................................. 9
9 Phase 6: Results in terms of peak pressure, RMS pressure, and SEL of 320 strikes on the mandrel test pile....................................................................... 10
10 Measurements of the control pile (Phase 2) ................................................... 12
11 Measurements of the double wall test pile (phases 3 and 5).......................... 13
12 Measurements of the mandrel test pile (phase 6)........................................... 14
13 Frequency content of each strike as measured by the Loggerhead system at a depth of 9.5 m ............................................................................................. 15
vii
14 Frequency content of each strike as measured by the Loggerhead system at a depth of 9.5 m ............................................................................................. 16
15 Summary of the double wall test pile noise attenuation measurements as a function of ...................................................................................................... 17
16 Summary of the double wall test pile noise attenuation measurements as a function of measurement depth ...................................................................... 18
17 Summary of the double wall test pile noise attenuation measurements as a function of measurement depth ...................................................................... 19
18 Summary of the double wall test pile noise attenuation measurements as a function of measurement depth ...................................................................... 19
19 Summary of the double wall test pile noise attenuation measurements as a function of measurement depth ...................................................................... 20
20 Summary of the double wall test pile measurements made on 7 December for peak pressure, at a range of 20 m and a depth of 5.0 m ........................... 20
21 Summary of the double wall test pile measurements made on 7 December for RMS pressure, at a range of 20 m and a depth of 5.0 m .......................... 21
22 Summary of the double wall test pile measurements made on 7 December for SEL, at a range of 20 m and a depth of 5.0 m .......................................... 21
23 Summary of the mandrel test pile measurements made on 8 December for peak pressure, at a range of 20 m and a depth of 5.0 m ................................. 22
24 Summary of the mandrel test pile measurements made on 8 December for RMS pressure, at a range of 20 m and a depth of 5.0 m ................................ 22
25 Summary of the mandrel test pile measurements made on 8 December for SEL, at a range of 20 m and a depth of 5.0 m................................................ 23

viii

ix
EXECUTIVE SUMMARY
As the part of the Washington State Department of Transportation (WSDOT) pile
attenuation test program, researchers conducted underwater sound measurements on 7 and 8
December 2015 at the Vashon Island ferry dock. Measurements were made by a University of
Washington team aboard the R/V Robertson, operated by the University of Washington Applied
Physics Laboratory (APL-UW), and by a WSDOT team operating closer to the construction barge.
Another measurement effort was also undertaken closer to the pile by a team from the University
of Washington Department of Mechanical Engineering. Results from that effort are available in a
separate WSDOT report.
The goals of the APL-UW team aboard the R/V Robertson were to measure the underwater
sound field over nearly the entire water column and away from interfering structures, as well as to
make robust estimates of sound mitigation performance of two test pile designs in terms of sound
exposure level (SEL) and peak pressure.
Measurements on the R/V Robertson were taken at a range of 120 m from the construction
barge complex and pile source location and at a water depth 12.5 m by using a vertical line array
(VLA) that spanned 1.25 to 9.25 m in depth. The results are summarized as follows:
A comparison of the 7 December measurements from the double wall test pile with the
control pile showed reductions in peak pressure (8.7–13.5 dB), RMS pressure (8.8–
12.7 dB), and SEL (7–10.3 dB).
A comparison of the 8 December measurements from the mandrel test pile with the 7
December measurements from the control pile showed reductions in peak pressure
(11.4–14 dB), RMS pressure (10.8–12.6 dB), and SEL (9.3 and 11.1 dB).
The reduction in peak pressure generally increased as measurement depth on the VLA
increased; for the RMS and SEL metrics, no trend was observed.
The WSDOT measurements taken at a range of 20 m, a water depth of 8.5 m, and using a
single hydrophone system at a depth of 5.0 m are summarized as follows:
A comparison of the 7 December measurements of the double wall test pile with the
control pile showed reductions in peak pressure (12 dB), RMS pressure (10 dB), and
SEL (9 dB).

x
A comparison of the 8 December measurements from the mandrel test pile with the 7
December measurements from the control pile showed reductions in peak pressure (12
dB), RMS pressure (11 dB), and SEL (11 dB).
The APL-UW and WSDOT measurements at the respective ranges of 120 m and 20 m
from the pile driving source were in good agreement.
Double Wall Test Pile Peak reduction (dB) RMS reduction (dB) SEL reduction (dB)
range 20 m water depth 8.5 m hydrophone depth 5.0 m
12 10 9
range 120 m water depth 12.5 m hydrophone depths 1.25–9.25m
8.7–13.5 8.8–12.7 7–10.3
Mandrel Test Pile Peak reduction (dB) RMS reduction (dB) SEL reduction (dB)
range 20 m water depth 8.5 m hydrophone depth 5.0 m,
12 11 11
range 120 m water depth 12.5m hydrophone depths 1.25–9.25m
11.4–14 10.8–12.6 9.3–11.1
Measurements from the control pile and both test piles varied over the duration of pile
strikes (hundreds of strikes over a duration of minutes); acoustic measurements from the two test
piles varied more over the period than those from the control pile.
The frequency content of the underwater sound changed after about 175 strikes for both
the double wall and mandrel test piles. The spectrum band narrowed in comparison with the
spectral characteristics from earlier strikes. Because the change occurred at about the same strike
number, and therefore pile depth, it is possible that the substrate encountered at this depth
influenced both test piles in the same manner. An alternative explanation is that the steel-framed
pile template used to position the piles possibly influenced results; in this case, additional
underwater sound may have been transmitted via structural paths introduced by metal-to-metal
contact between the piles and the template.
1
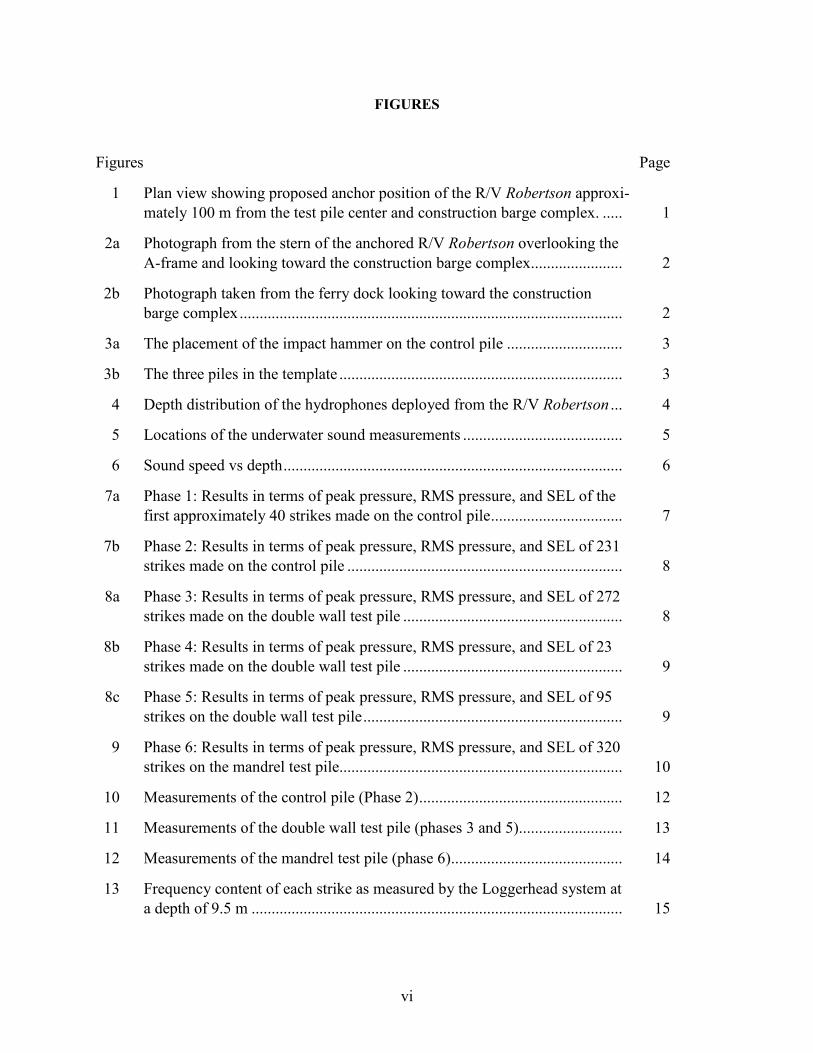
INTRODUCTION AND SEQUENCE OF EVENTS
The original planning documents called for the R/V Robertson to be positioned 100 m
(Figure 1, proposed anchor 1) from the test pile center and construction barge complex at the
Vashon Island ferry dock. The depth at the anchorage site, which was offshore from the eel grass
beds, was 12–14 m, depending on the tide.
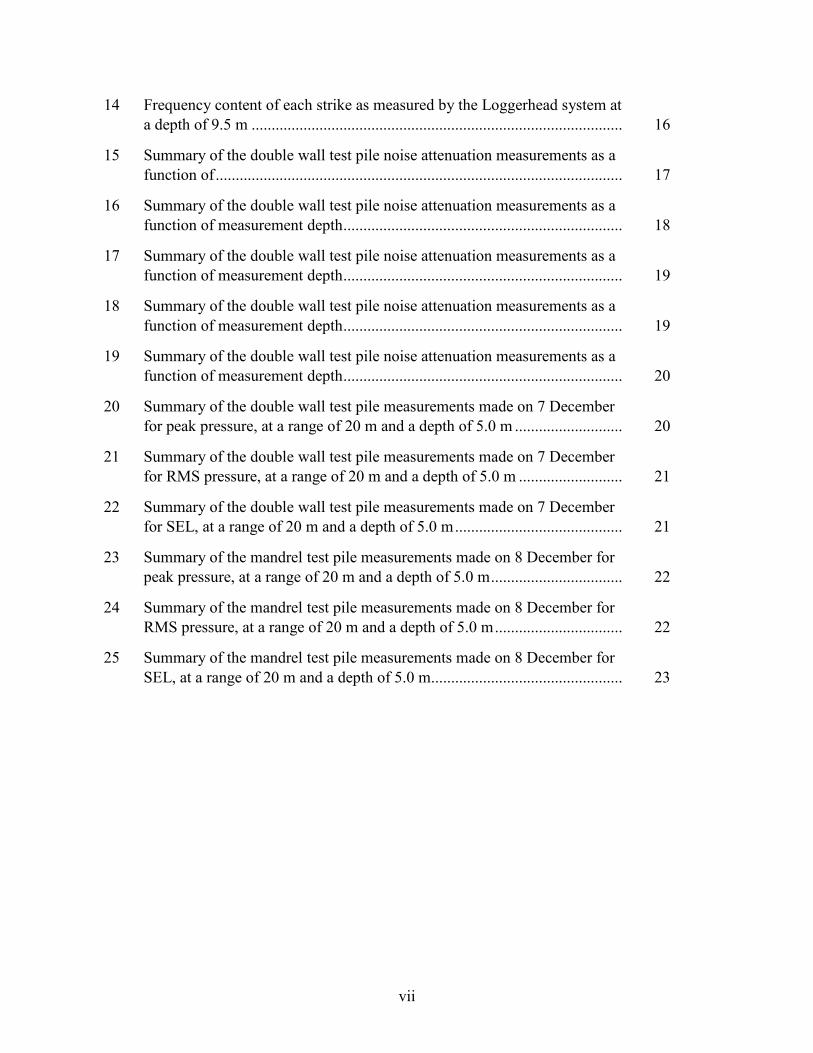
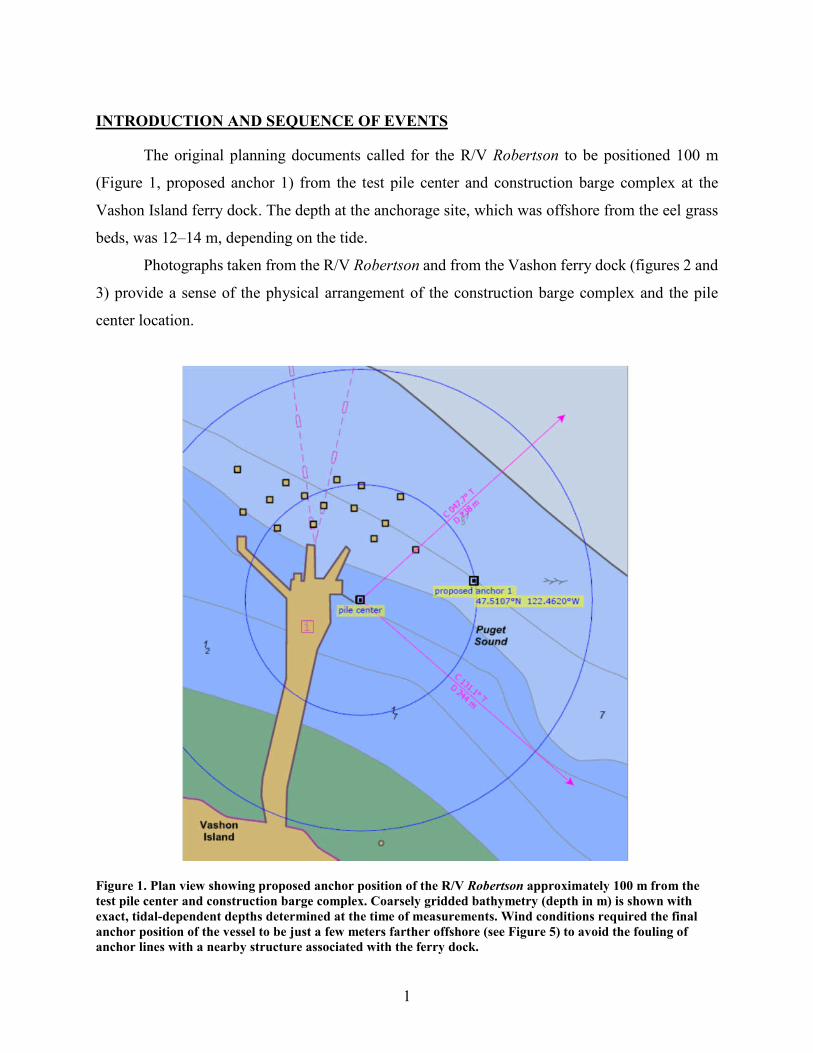
Photographs taken from the R/V Robertson and from the Vashon ferry dock (figures 2 and
3) provide a sense of the physical arrangement of the construction barge complex and the pile
center location.
Figure 1. Plan view showing proposed anchor position of the R/V Robertson approximately 100 m from the test pile center and construction barge complex. Coarsely gridded bathymetry (depth in m) is shown with exact, tidal-dependent depths determined at the time of measurements. Wind conditions required the final anchor position of the vessel to be just a few meters farther offshore (see Figure 5) to avoid the fouling of anchor lines with a nearby structure associated with the ferry dock.
2
Figure 2a. Photograph from the stern of the anchored R/V Robertson overlooking the A-frame and looking toward the construction barge complex, taken at 9:00 am on 7 December.
Figure 2b. Photograph taken from the ferry dock looking toward the construction barge complex, taken on 7 December. The R/V Robertson is seen at a distance in the center of the picture.

3
Figure 3a. The placement of the impact hammer on the control pile, taken from the R/V Robertson on 7 December.
Figure 3b. The three piles in the template, taken on 8 December. The control pile is on the left, the double wall pile is in the middle, and the mandrel pile is on the right.
The sequence of events for 7 and 8 December 2015 was as follows:
1. Measurements of the control pile (30-in diameter) began at approximately noon on 7
December with a short period of about 50 impact strikes (Measurement Phase 1). This
was followed by a period of about 50 minutes during which the piles were examined
and dynamic instrumentation was set up, after which an additional 250 impact strikes
on the pile were made (Measurement Phase 2).
2. The double wall test pile was placed in position and measurements were taken at
approximately 2:50–3:10 pm. Impact pile driving and sound measurements occurred in
three phases, with the first the longest in duration (Measurement Phases 3, 4, 5). This
completed the underwater sound test measurements for 7 December.
3. On 8 December the mandrel test pile was assembled and positioned, and
measurements were taken commencing at 12:47 pm (Measurement Phase 6). This
completed the underwater sound test measurements for 8 December.
4
MEASUREMENT GEOMETRY AND INSTRUMENTATION ON THE R/V ROBERTSON
The following acoustic systems were deployed as part of this test:
1. A vertical line array (VLA) was suspended off the A-frame (Figure 2) of the R/V
Robertson. Hydrophone sensitivity was determined for each hydrophone and accounted
for separately with an average of –206 dB re 1 V/Pa. This system recorded with a
single hydrophone sampling frequency of 62,500 Hz.
2. An autonomous single hydrophone recording system (Loggerhead) attached to the
VLA, with an overall sensitivity of –220 dB re 1 V/Pa for the measurements on 7
December and –200 dB re 1 V/Pa for the measurements on 8 December, had a
sampling frequency of 50,000 Hz.
3. A single-hydrophone underwater sound level meter (USLM), deployed over the port
side of the R/V Robertson, had an overall sensitivity of –205 dB re 1 V/Pa and a
sampling frequency of 52,000 Hz.
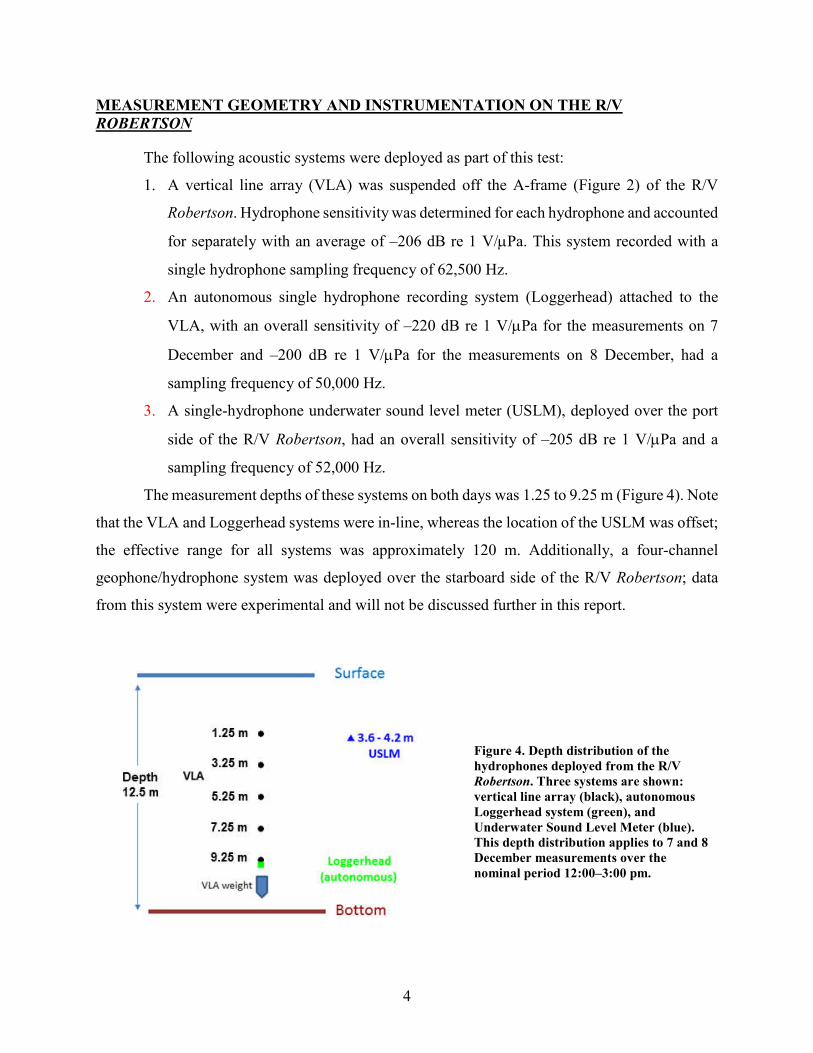
The measurement depths of these systems on both days was 1.25 to 9.25 m (Figure 4). Note
that the VLA and Loggerhead systems were in-line, whereas the location of the USLM was offset;
the effective range for all systems was approximately 120 m. Additionally, a four-channel
geophone/hydrophone system was deployed over the starboard side of the R/V Robertson; data
from this system were experimental and will not be discussed further in this report.
Figure 4. Depth distribution of the hydrophones deployed from the R/V Robertson. Three systems are shown: vertical line array (black), autonomous Loggerhead system (green), and Underwater Sound Level Meter (blue). This depth distribution applies to 7 and 8 December measurements over the nominal period 12:00–3:00 pm.
5
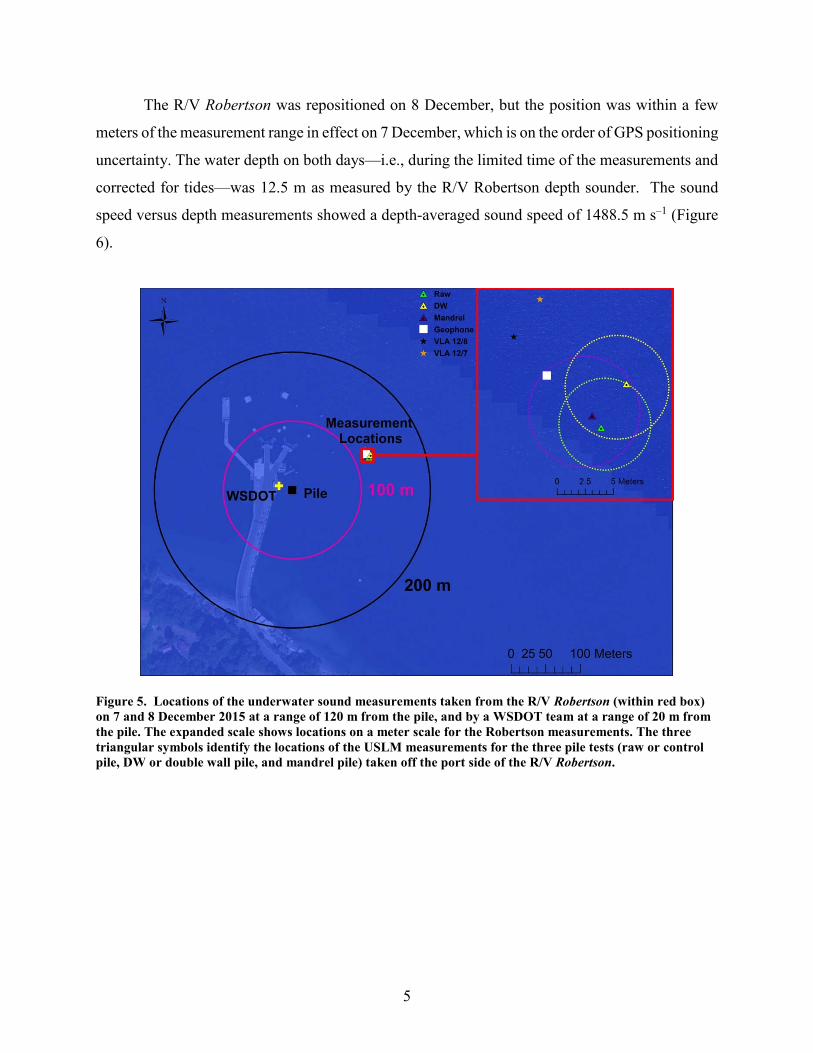
The R/V Robertson was repositioned on 8 December, but the position was within a few
meters of the measurement range in effect on 7 December, which is on the order of GPS positioning
uncertainty. The water depth on both days—i.e., during the limited time of the measurements and
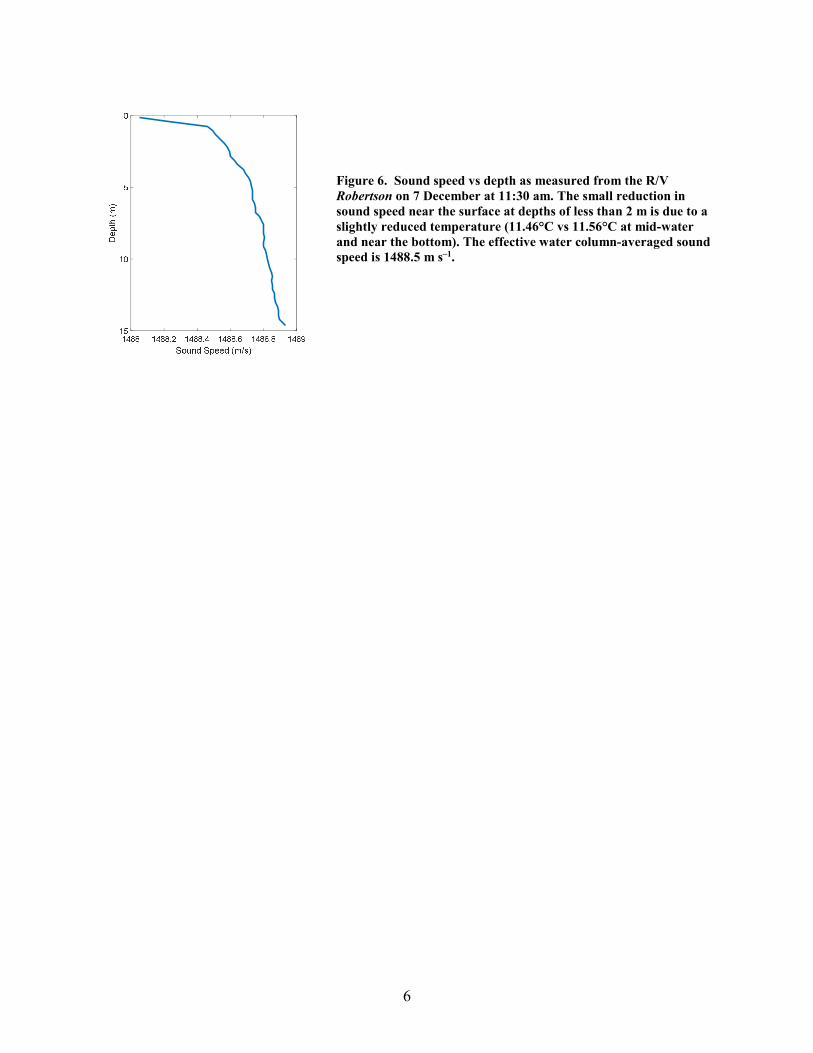
corrected for tides—was 12.5 m as measured by the R/V Robertson depth sounder. The sound
speed versus depth measurements showed a depth-averaged sound speed of 1488.5 m s–1 (Figure
6).
Figure 5. Locations of the underwater sound measurements taken from the R/V Robertson (within red box) on 7 and 8 December 2015 at a range of 120 m from the pile, and by a WSDOT team at a range of 20 m from the pile. The expanded scale shows locations on a meter scale for the Robertson measurements. The three triangular symbols identify the locations of the USLM measurements for the three pile tests (raw or control pile, DW or double wall pile, and mandrel pile) taken off the port side of the R/V Robertson.
6
Figure 6. Sound speed vs depth as measured from the R/V Robertson on 7 December at 11:30 am. The small reduction in sound speed near the surface at depths of less than 2 m is due to a slightly reduced temperature (11.46°C vs 11.56°C at mid-water and near the bottom). The effective water column-averaged sound speed is 1488.5 m s–1.

7
RESULTS FROM R/V ROBERTSON MEASUREMENTS
Underwater Sound Level Meter (USLM)
An Underwater Sound Level Meter (USLM) produced by the University of Washington
and scheduled for delivery to the Navy was used by permission for an additional measurement
from aboard the R/V Robertson. Data processing screen shots from the USLM were taken
immediately after each measurement phase (figures 7–9); these summarize the six measurement
phases of the two-day test.
The USLM computed the peak pressure and RMS pressure, both expressed in dB re 1 Pa,
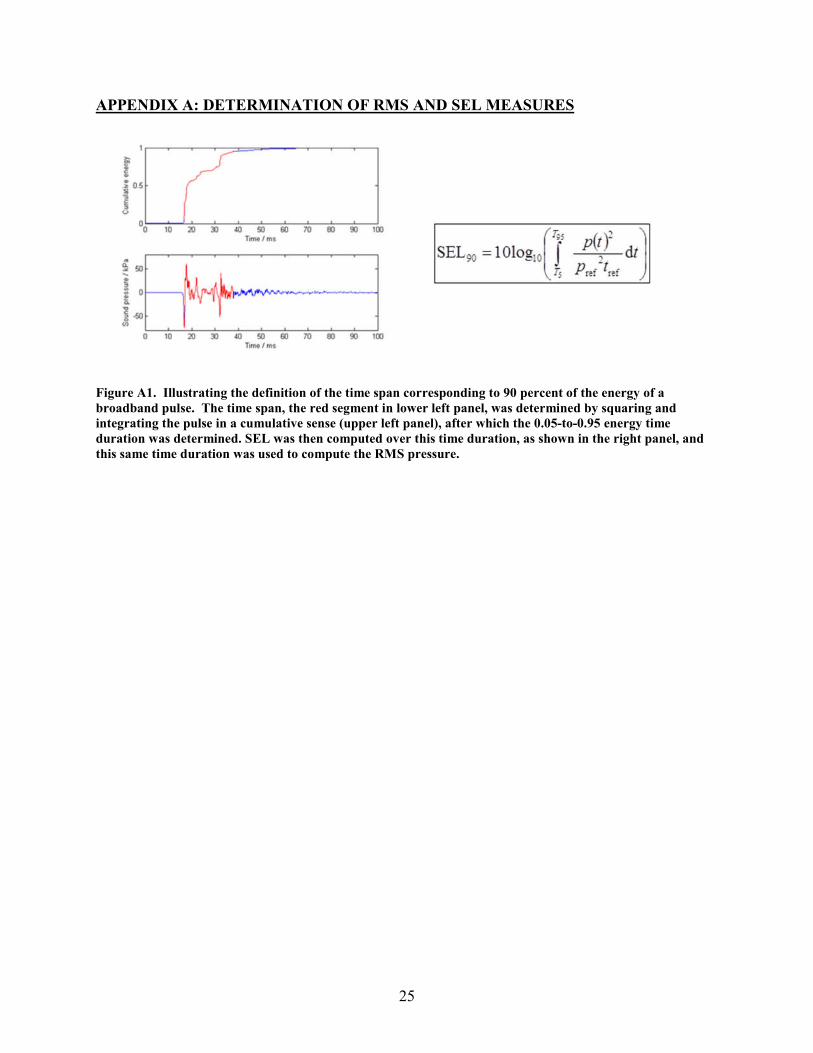
and SEL, expressed in dB 1 Pa2-sec (Figure A1). Data from the VLA and Loggerhead recording
systems were also processed into these metrics by the same methods.
The file start times were noted in HHMMSS, such as 120034 (Figure 7a). The USLM
processing screen shots (figures 7–9) showed the results of all data processed over the
measurement period in the lower plots (with colored symbols). The upper plots showed pressure
measurements for only the last period (about 50 s) of the entire time series.
Figure 7a. Phase 1: Results in terms of peak pressure, RMS pressure, and SEL of the first approximately 40 strikes made on the control pile, commencing at 12:00 pm on 7 December (lower panel). Note that the time scale of the upper panel, showing raw data, is necessarily different, and not all strikes can be shown. The cumulative SEL (SELcum) for these strikes is displayed in the small box, lower right.
8
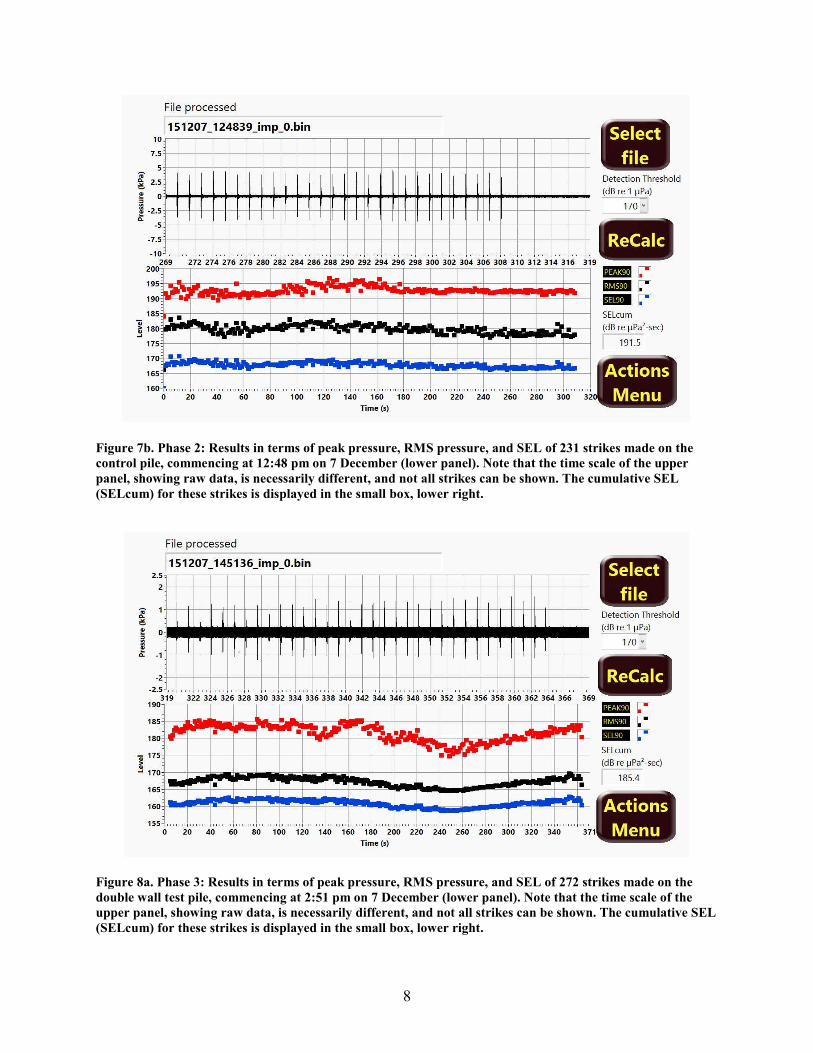
Figure 7b. Phase 2: Results in terms of peak pressure, RMS pressure, and SEL of 231 strikes made on the control pile, commencing at 12:48 pm on 7 December (lower panel). Note that the time scale of the upper panel, showing raw data, is necessarily different, and not all strikes can be shown. The cumulative SEL (SELcum) for these strikes is displayed in the small box, lower right.
Figure 8a. Phase 3: Results in terms of peak pressure, RMS pressure, and SEL of 272 strikes made on the double wall test pile, commencing at 2:51 pm on 7 December (lower panel). Note that the time scale of the upper panel, showing raw data, is necessarily different, and not all strikes can be shown. The cumulative SEL (SELcum) for these strikes is displayed in the small box, lower right.
9
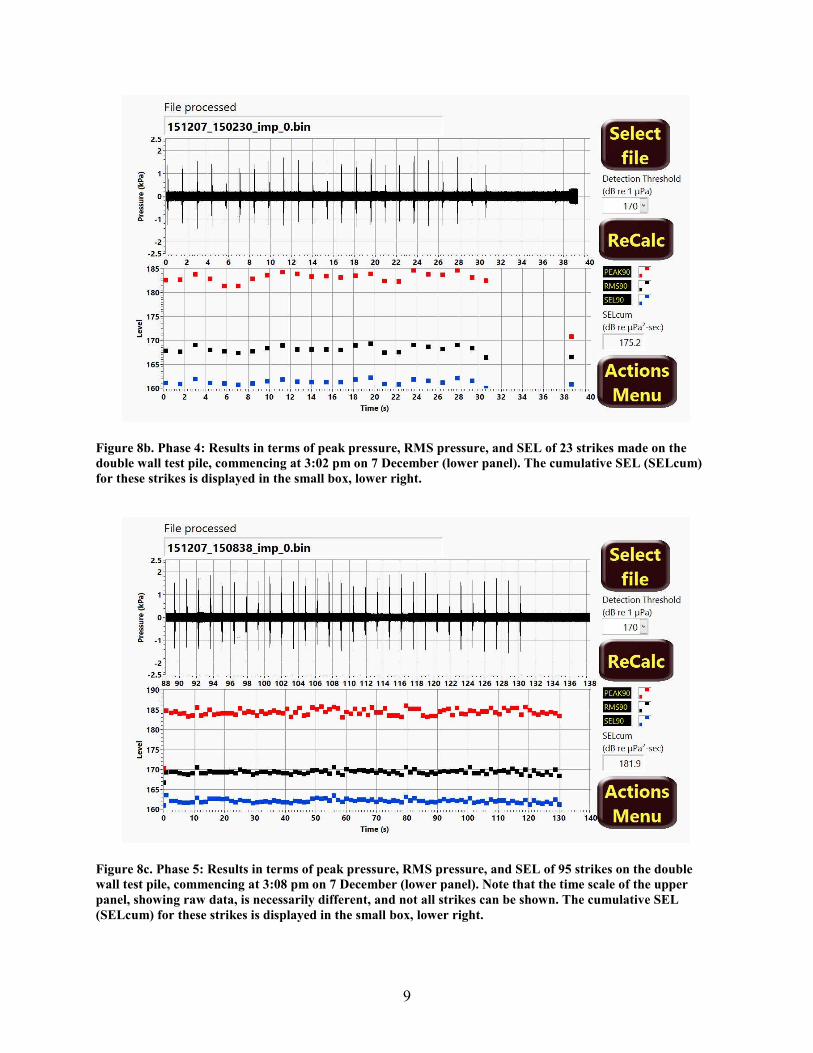
Figure 8b. Phase 4: Results in terms of peak pressure, RMS pressure, and SEL of 23 strikes made on the double wall test pile, commencing at 3:02 pm on 7 December (lower panel). The cumulative SEL (SELcum) for these strikes is displayed in the small box, lower right.
Figure 8c. Phase 5: Results in terms of peak pressure, RMS pressure, and SEL of 95 strikes on the double wall test pile, commencing at 3:08 pm on 7 December (lower panel). Note that the time scale of the upper panel, showing raw data, is necessarily different, and not all strikes can be shown. The cumulative SEL (SELcum) for these strikes is displayed in the small box, lower right.
10
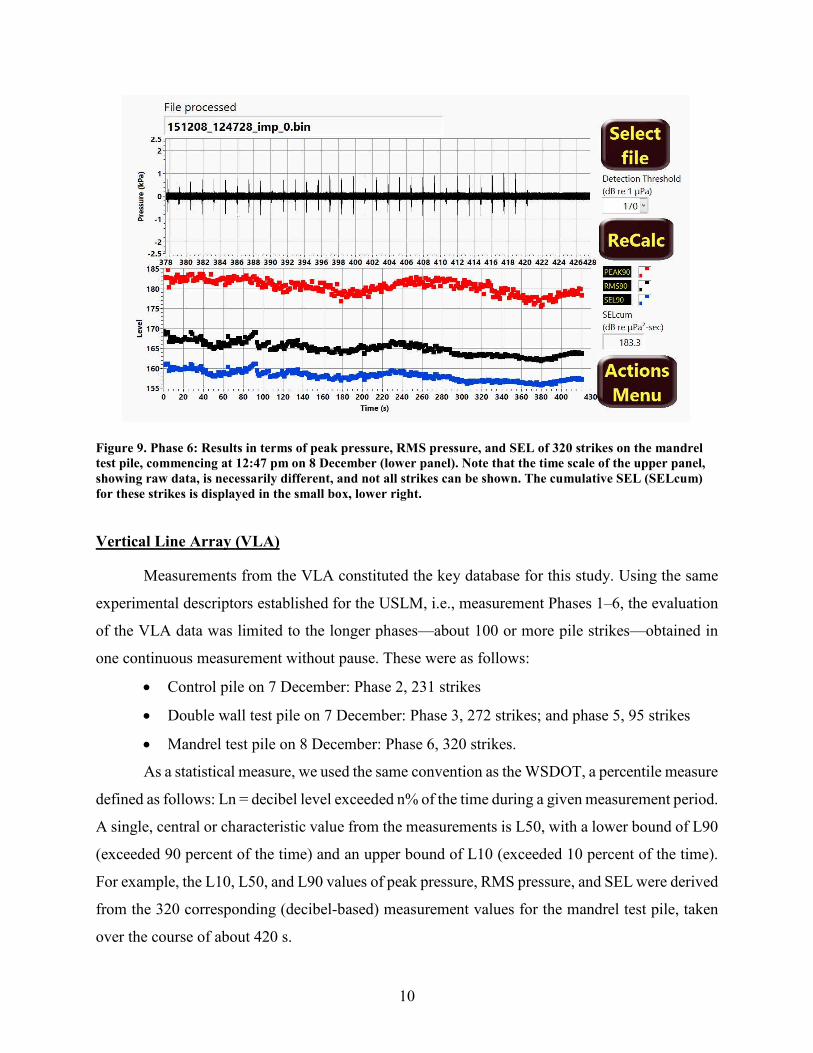
Figure 9. Phase 6: Results in terms of peak pressure, RMS pressure, and SEL of 320 strikes on the mandrel test pile, commencing at 12:47 pm on 8 December (lower panel). Note that the time scale of the upper panel, showing raw data, is necessarily different, and not all strikes can be shown. The cumulative SEL (SELcum) for these strikes is displayed in the small box, lower right.
Vertical Line Array (VLA)
Measurements from the VLA constituted the key database for this study. Using the same
experimental descriptors established for the USLM, i.e., measurement Phases 1–6, the evaluation
of the VLA data was limited to the longer phases—about 100 or more pile strikes—obtained in
one continuous measurement without pause. These were as follows:
Control pile on 7 December: Phase 2, 231 strikes
Double wall test pile on 7 December: Phase 3, 272 strikes; and phase 5, 95 strikes
Mandrel test pile on 8 December: Phase 6, 320 strikes.
As a statistical measure, we used the same convention as the WSDOT, a percentile measure
defined as follows: Ln = decibel level exceeded n% of the time during a given measurement period.
A single, central or characteristic value from the measurements is L50, with a lower bound of L90
(exceeded 90 percent of the time) and an upper bound of L10 (exceeded 10 percent of the time).
For example, the L10, L50, and L90 values of peak pressure, RMS pressure, and SEL were derived
from the 320 corresponding (decibel-based) measurement values for the mandrel test pile, taken
over the course of about 420 s.

11
We consider the best estimate of the noise reduction expressed in decibels as based on the
difference between the L50 values of the control and test pile, or L50. The reasoning is as
follows: results from the control pile and test pile each yielded a probability density function
(PDF) of decibel values, and the PDF for the difference value arises from a convolution of these
PDFs. The L50 of this new PDF is desired, and we found that the L50 value of the control pile
minus that of the test pile (L50) agreed well with a true L50 generated from numerically
convolved PDFs. Therefore, the APL-UW and WSDOT teams used the difference in L50 values
between control and test piles (L50) as the final measure of sound attenuation.
Appendix B provides a note on the measurement uncertainty afforded by the near co-
location of the autonomous hydrophone (Loggerhead system) placed 25 cm below the VLA
hydrophone at a depth of 9.25 m (Figure 4).
Figures 10–12 are displayed in the same aspect ratio—the x-axis represents the pile strike
number such that the evolution over time sound metrics for the control pile (231 strikes) can be
compared readily with the test piles that had more strikes.
The figures display VLA data with measurement depth increasing left to right. The three
sound metrics—peak pressure, RMS pressure, and SEL for a given strike number—are shown by
the black dots. The gray shaded area encompasses the L90- to L10-span for each metric, and the
color-coded solid line identifies the L50 value. For the control pile (Figure 10) there was a slight
trend of increasing peak pressure for increasing depth, with the RMS and SEL metrics being less
dependent on depth.

12
Figure 10. Measurements of the control pile (Phase 2) on 7 December. Solid, colored lines denote the L50 value for each metric as identified in the legend, with black dots representing a single strike value. The gray shaded areas identify the range from L90 (lower bound) to L10 (upper bound). The strike number corresponds to the impact hammer strike count, with the total duration of the 231 strikes approximately 300 s.
There were two phases (3 and 5) for the double wall test pile, the second commencing
approximately 10 min after completion of the first. The short phase in between (phase 4, 23 strikes)
was archived by the USLM (Figure 8b). Phase 5 (95 strikes) is plotted with slightly larger symbols
starting at strike number 272.
Levels for all three sound metrics during Phase 5 formed a continuation of the levels from
the earlier Phase 3. Assuming that pile depth, or position with respect to the frame template,
changed very little during the intervening 23 strikes, then this is evidence that underwater noise
generation was modulated by pile position.
There was a notable change in the frequency content of the underwater sound from pile
strikes commencing at approximately strike 175 for both the double wall (Figure 11) and mandrel
(Figure 12) test piles. This change in the frequency spectrum is shown by figures 13 and 14 and
can be described as the spectrum having broadband and narrow-band content, where the latter
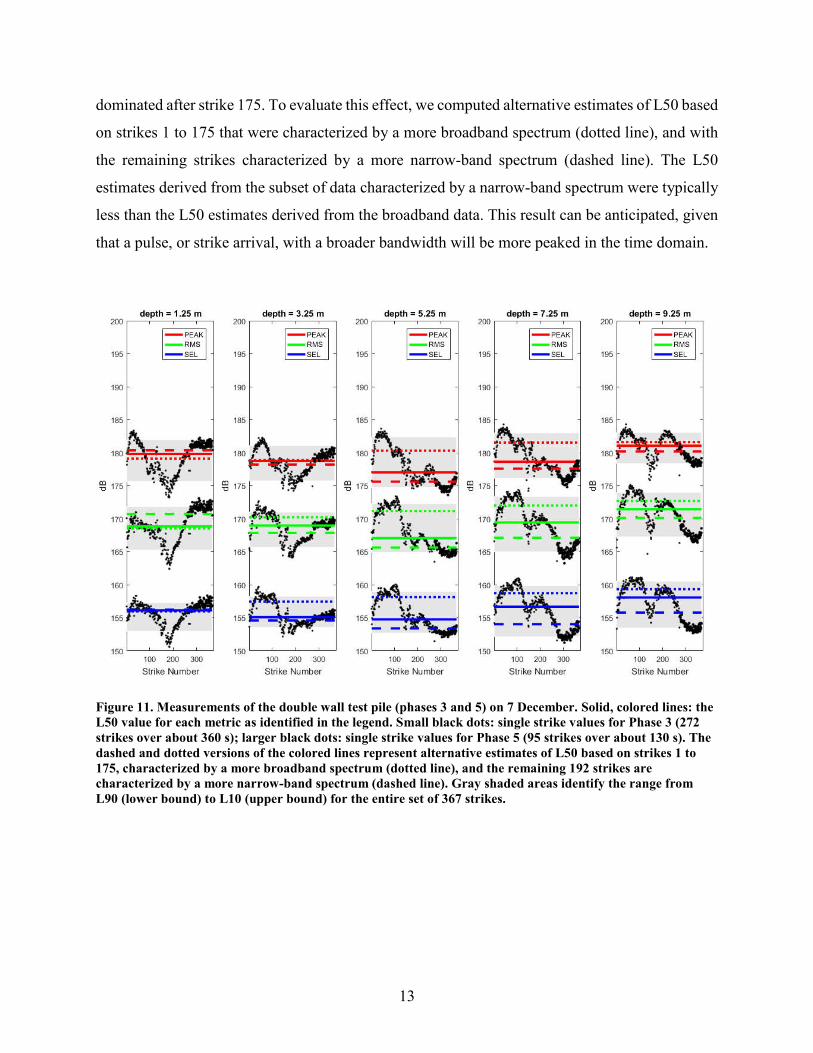
13
dominated after strike 175. To evaluate this effect, we computed alternative estimates of L50 based
on strikes 1 to 175 that were characterized by a more broadband spectrum (dotted line), and with
the remaining strikes characterized by a more narrow-band spectrum (dashed line). The L50
estimates derived from the subset of data characterized by a narrow-band spectrum were typically
less than the L50 estimates derived from the broadband data. This result can be anticipated, given
that a pulse, or strike arrival, with a broader bandwidth will be more peaked in the time domain.
Figure 11. Measurements of the double wall test pile (phases 3 and 5) on 7 December. Solid, colored lines: the L50 value for each metric as identified in the legend. Small black dots: single strike values for Phase 3 (272 strikes over about 360 s); larger black dots: single strike values for Phase 5 (95 strikes over about 130 s). The dashed and dotted versions of the colored lines represent alternative estimates of L50 based on strikes 1 to 175, characterized by a more broadband spectrum (dotted line), and the remaining 192 strikes are characterized by a more narrow-band spectrum (dashed line). Gray shaded areas identify the range from L90 (lower bound) to L10 (upper bound) for the entire set of 367 strikes.

14
Figure 12. Measurements of the mandrel test pile (phase 6) on 8 December. Solid, colored lines: the L50 value for each metric as identified in the legend. Small black dots: single strike values (320 strikes over about 420 s). The dashed, and dotted versions of the colored lines represent alternative estimates of L50 based on strikes 1–175, characterized by a more broadband spectrum (dotted line), and the remaining 192 strikes are characterized by a more narrow-band spectrum (dashed line). The gray shaded areas identify the range from L90 (lower bound) to L10 (upper bound) for the entire set of 320 strikes.
Plotting the energy spectral density of the received signal as a function of strike count for
the control and test piles showed a significant change in frequency content (figures 13 and 14).
The frequency content of data from the control pile (Figure 13, upper) remained largely constant
over the sequence of 231 strikes and was broadly distributed over frequencies of less than about
1000 Hz.
In contrast, the frequency content of the double wall test pile (Figure 13, lower plot)
changed near strike 175, with the spectrum becoming more concentrated in bands centered around
240 Hz and 375 Hz. That is, as a general observation, before strike 175, the sound energy was
more broadly distributed over frequency, whereas after strike 175, energy was more concentrated
around the two bands centered at 240 Hz and 375 Hz. This observation also applies to the mandrel
test pile, for which after roughly the same number of strikes there was a transition in frequency
content (Figure 14, lower plot), which was in agreement with the double wall test pile (Figure 14,
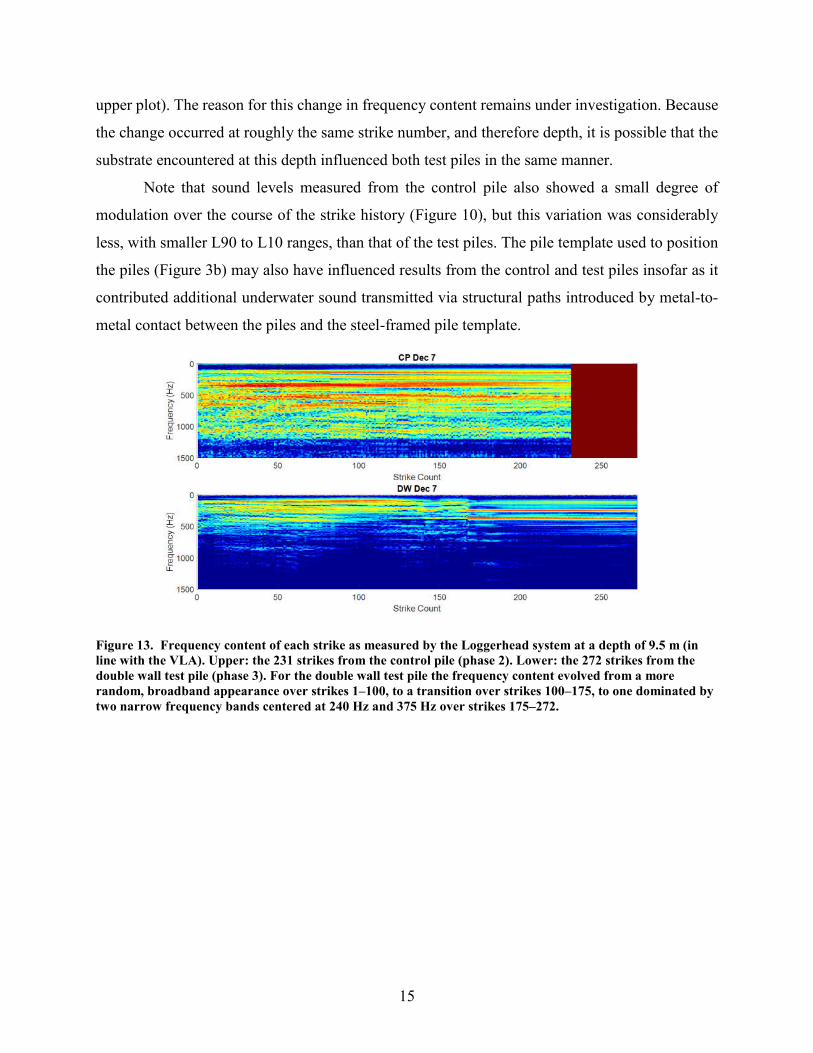
15
upper plot). The reason for this change in frequency content remains under investigation. Because
the change occurred at roughly the same strike number, and therefore depth, it is possible that the
substrate encountered at this depth influenced both test piles in the same manner.
Note that sound levels measured from the control pile also showed a small degree of
modulation over the course of the strike history (Figure 10), but this variation was considerably
less, with smaller L90 to L10 ranges, than that of the test piles. The pile template used to position
the piles (Figure 3b) may also have influenced results from the control and test piles insofar as it
contributed additional underwater sound transmitted via structural paths introduced by metal-to-
metal contact between the piles and the steel-framed pile template.
Figure 13. Frequency content of each strike as measured by the Loggerhead system at a depth of 9.5 m (in line with the VLA). Upper: the 231 strikes from the control pile (phase 2). Lower: the 272 strikes from the double wall test pile (phase 3). For the double wall test pile the frequency content evolved from a more random, broadband appearance over strikes 1–100, to a transition over strikes 100–175, to one dominated by two narrow frequency bands centered at 240 Hz and 375 Hz over strikes 175–272.

16
Figure 14. Frequency content of each strike as measured by the Loggerhead system at a depth of 9.5 m (in line with the VLA). Upper: the 272 strikes from the double wall test pile (Phase 3). Lower: the 320 strikes from the mandrel test pile (Phase 6). Superimposed on each graph (thin white lines) is a plot of peak pressure vs strike count.
Figures 15 and 16 present summaries of the calculated L50 and L50 between the control
and test piles, displayed as a function of depth for the metrics SEL, RMS, and peak pressure. The
control pile L50 estimates form the right-hand, higher values (solid lines), with gray shaded areas
to identify the extent of the L90–L10 bound.
The double wall test pile (Figure 15) and mandrel test pile (Figure 16) L50 estimates form
the left-hand, lower values (solid lines), with gray shaded areas to identify the extent of the L90–
L10 bound. The numbers displayed within each panel are the best estimate of noise reduction for
each metric as a function of depth. These estimates equal the difference, or L50, in L50 values
between the two solid lines at each measurement depth, in decibels rounded to the nearest 0.1 dB.
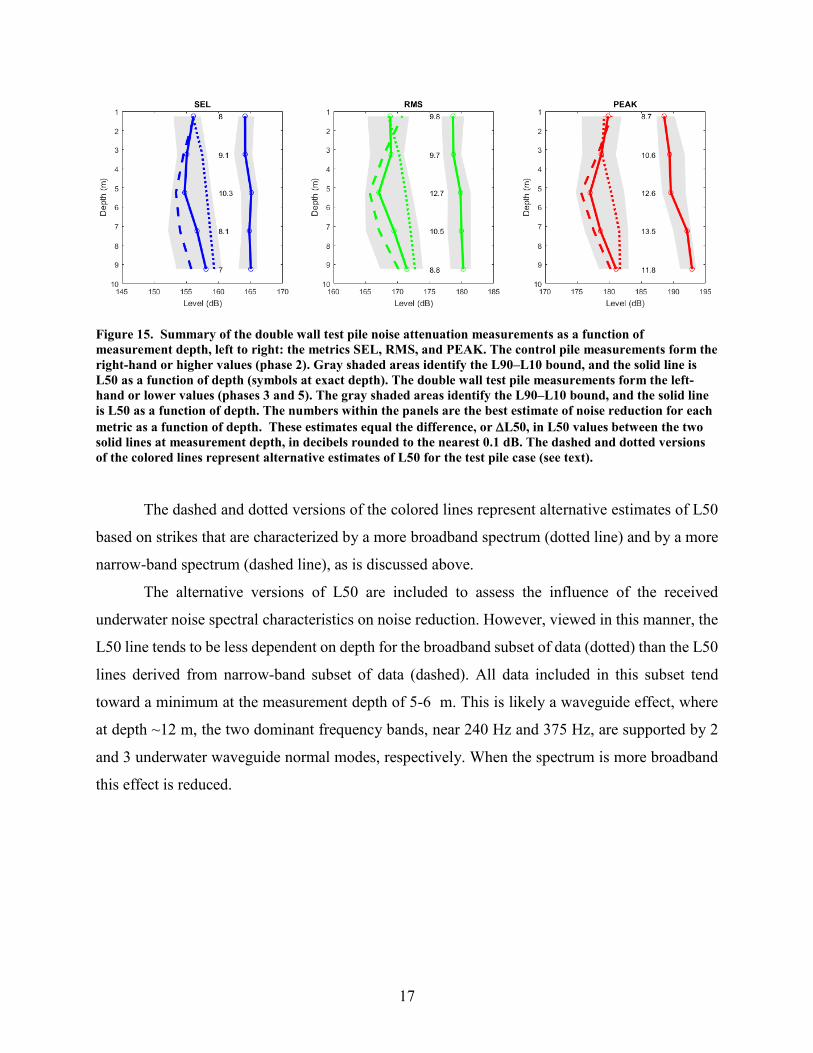
17
Figure 15. Summary of the double wall test pile noise attenuation measurements as a function of measurement depth, left to right: the metrics SEL, RMS, and PEAK. The control pile measurements form the right-hand or higher values (phase 2). Gray shaded areas identify the L90–L10 bound, and the solid line is L50 as a function of depth (symbols at exact depth). The double wall test pile measurements form the left-hand or lower values (phases 3 and 5). The gray shaded areas identify the L90–L10 bound, and the solid line is L50 as a function of depth. The numbers within the panels are the best estimate of noise reduction for each metric as a function of depth. These estimates equal the difference, or L50, in L50 values between the two solid lines at measurement depth, in decibels rounded to the nearest 0.1 dB. The dashed and dotted versions of the colored lines represent alternative estimates of L50 for the test pile case (see text).
The dashed and dotted versions of the colored lines represent alternative estimates of L50
based on strikes that are characterized by a more broadband spectrum (dotted line) and by a more
narrow-band spectrum (dashed line), as is discussed above.
The alternative versions of L50 are included to assess the influence of the received
underwater noise spectral characteristics on noise reduction. However, viewed in this manner, the
L50 line tends to be less dependent on depth for the broadband subset of data (dotted) than the L50
lines derived from narrow-band subset of data (dashed). All data included in this subset tend
toward a minimum at the measurement depth of 5-6 m. This is likely a waveguide effect, where
at depth ~12 m, the two dominant frequency bands, near 240 Hz and 375 Hz, are supported by 2
and 3 underwater waveguide normal modes, respectively. When the spectrum is more broadband
this effect is reduced.

18
Figure 16. Summary of the mandrel test pile noise attenuation measurements as function of measurement depth, left to right: the metrics SEL, RMS and PEAK. The control pile measurements form the right-hand or higher values (Phase 2). Gray shaded areas identify the L90–L10 bound, and the solid line is L50 as a function of depth (symbols at exact depth). The mandrel test pile measurements form the left-hand or lower values (Phase 6), with the solid line the L50 as a function of depth and the gray shaded area the L90–L10 bound. The numbers within the panels are the best estimate of noise reduction for each metric as a function of depth. These estimates equal the difference, or L50, in L50 values between the two solid lines at measurement depth, in decibels rounded to the nearest 0.1 dB. The dashed and dotted versions of the colored lines represent alternative estimates of L50 for the test pile case (see text).
19
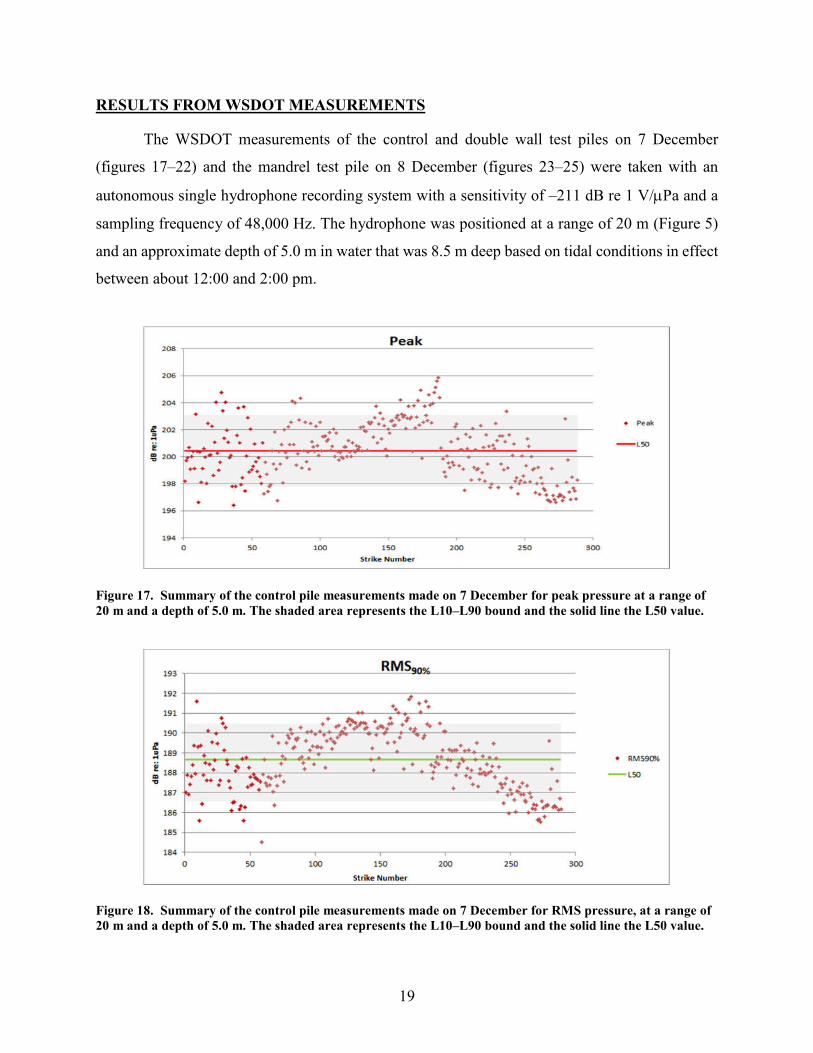
RESULTS FROM WSDOT MEASUREMENTS
The WSDOT measurements of the control and double wall test piles on 7 December
(figures 17–22) and the mandrel test pile on 8 December (figures 23–25) were taken with an
autonomous single hydrophone recording system with a sensitivity of –211 dB re 1 V/Pa and a
sampling frequency of 48,000 Hz. The hydrophone was positioned at a range of 20 m (Figure 5)
and an approximate depth of 5.0 m in water that was 8.5 m deep based on tidal conditions in effect
between about 12:00 and 2:00 pm.
Figure 17. Summary of the control pile measurements made on 7 December for peak pressure at a range of 20 m and a depth of 5.0 m. The shaded area represents the L10–L90 bound and the solid line the L50 value.
Figure 18. Summary of the control pile measurements made on 7 December for RMS pressure, at a range of 20 m and a depth of 5.0 m. The shaded area represents the L10–L90 bound and the solid line the L50 value.
20
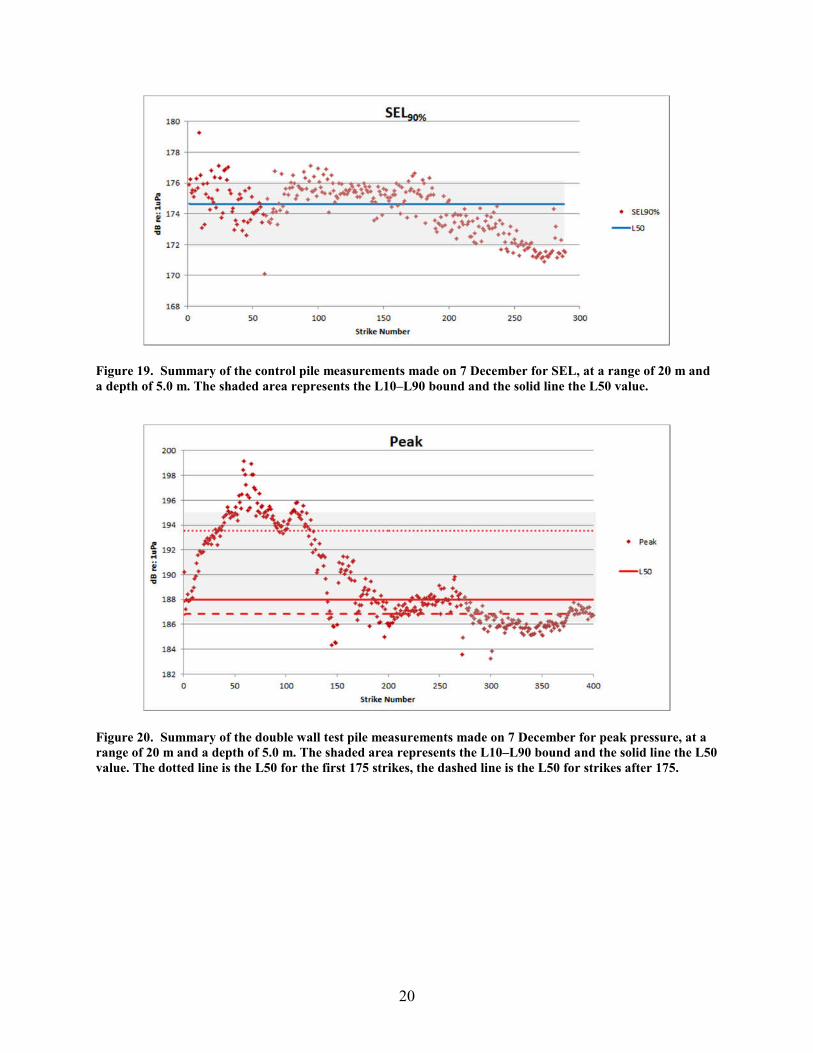
Figure 19. Summary of the control pile measurements made on 7 December for SEL, at a range of 20 m and a depth of 5.0 m. The shaded area represents the L10–L90 bound and the solid line the L50 value.
Figure 20. Summary of the double wall test pile measurements made on 7 December for peak pressure, at a range of 20 m and a depth of 5.0 m. The shaded area represents the L10–L90 bound and the solid line the L50 value. The dotted line is the L50 for the first 175 strikes, the dashed line is the L50 for strikes after 175.

21
Figure 21. Summary of the double wall test pile measurements made on 7 December for RMS pressure, at a range of 20 m and a depth of 5.0 m. The shaded area represents the L10–L90 bound and the solid line the L50 value. The dotted line is the L50 for the first 175 strikes, the dashed line is the L50 for strikes after 175.
Figure 22. Summary of the double wall test pile measurements made on 7 December for SEL, at a range of 20 m and a depth of 5.0 m. The shaded area represents the L10–L90 bound and the solid line the L50 value. The dotted line is the L50 for the first 175 strikes, the dashed line is the L50 for strikes after 175.

22
Figure 23. Summary of the mandrel test pile measurements made on 8 December for peak pressure, at a range of 20 m and a depth of 5.0 m. The shaded area represents the L10–L90 bound and the solid line the L50 value. The dotted line is the L50 for the first 175 strikes, the dashed line is the L50 for strikes after 175.
Figure 24. Summary of the mandrel test pile measurements made on 8 December for RMS pressure, at a range of 20 m and a depth of 5.0 m. The shaded area represents the L10–L90 bound and the solid line the L50 value. The dotted line is the L50 for the first 175 strikes, the dashed line is the L50 for strikes after 175.
23
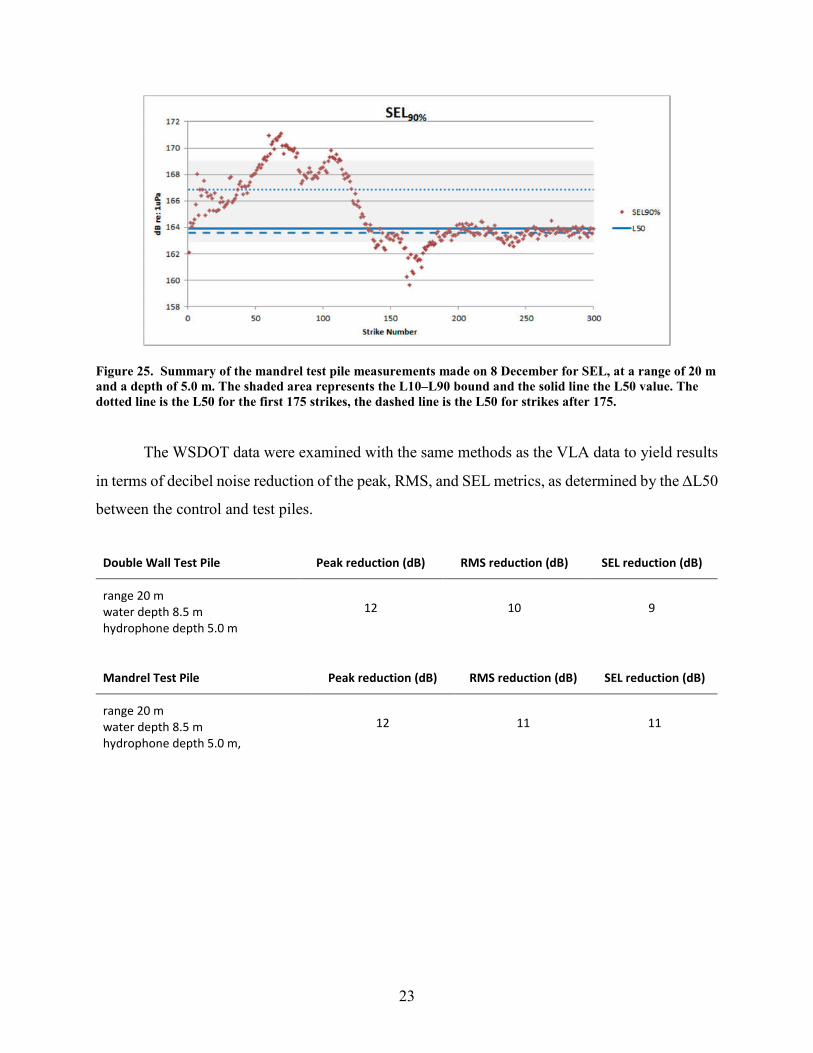
Figure 25. Summary of the mandrel test pile measurements made on 8 December for SEL, at a range of 20 m and a depth of 5.0 m. The shaded area represents the L10–L90 bound and the solid line the L50 value. The dotted line is the L50 for the first 175 strikes, the dashed line is the L50 for strikes after 175.
The WSDOT data were examined with the same methods as the VLA data to yield results
in terms of decibel noise reduction of the peak, RMS, and SEL metrics, as determined by the L50
between the control and test piles.
Double Wall Test Pile Peak reduction (dB) RMS reduction (dB) SEL reduction (dB)
range 20 m water depth 8.5 m hydrophone depth 5.0 m
12 10 9
Mandrel Test Pile Peak reduction (dB) RMS reduction (dB) SEL reduction (dB)
range 20 m water depth 8.5 m hydrophone depth 5.0 m,
12 11 11

24
ACKNOWLEDGMENTS
This research was supported by the Washington State Department of Transportation
(WSDOT). The authors thank Rhonda Brooks, Marion Carey and Jon Peterson of WSDOT for
their support of this effort, and Per Reinhall and Tim Dardis of the University of Washington for
their efforts in arranging for the December field test.
25
APPENDIX A: DETERMINATION OF RMS AND SEL MEASURES
Figure A1. Illustrating the definition of the time span corresponding to 90 percent of the energy of a broadband pulse. The time span, the red segment in lower left panel, was determined by squaring and integrating the pulse in a cumulative sense (upper left panel), after which the 0.05-to-0.95 energy time duration was determined. SEL was then computed over this time duration, as shown in the right panel, and this same time duration was used to compute the RMS pressure.

26
APPENDIX B: A NOTE ON ACOUSTIC MEASUREMENT UNCERTAINTY
An autonomous hydrophone (Loggerhead systems) was placed at a depth of 9.5 m, or 25
cm, below the deepest hydrophone (9.25 m) on the VLA (Figure 4). This allowed for a reasonably
co-located comparison between two completely separate recording systems.
For the control pile measurements (7 December), the L50 value peak pressure derived from
the Loggerhead system exceeded the corresponding L50 value derived from channel 1 of the VLA
(9.25 m) by 0.7 dB. For the mandrel test pile measurements (8 December) the Loggerhead system’s
L50 value exceeded that from channel 1 of the VLA by 1.3 dB. Such small differences are very
encouraging in view of the fact that these measurements were taken down-range of a source by
more than 100 m and that it is difficult to calibrate a single hydrophone to a precision of better
than +/– 1 dB (see http://www.npl.co.uk/upload/pdf/uncertainty.pdf), let alone two independent
hydrophones.
In terms of the noise reduction (peak pressure) metric, or the difference between the L50
values from the control and mandrel test pile measurements, the Loggerhead system data put this
value at 13.4 dB, and channel 1 of the VLA data put this value at 14.0 dB (Figure 16, right panel).

Americans with Disabilities Act (ADA) Information: This material can be made available in an alternate format by emailing the Office of Equal Opportunity at [email protected] or by calling toll free, 855-362-4ADA(4232). Persons who are deaf or hard of hearing may make a request by calling the Washington State Relay at 711.
Title VI Statement to Public: It is the Washington State Department of Transportation’s (WSDOT) policy to assure that no person shall, on the grounds of race, color, national origin or sex, as provided by Title VI of the Civil Rights Act of 1964, be excluded from participation in, be denied the benefits of, or be otherwise discriminated against under any of its federally funded programs and activities. Any person who believes his/her Title VI protection has been violated, may file a complaint with WSDOT’s Office of Equal Opportunity (OEO). For additional information regarding Title VI complaint procedures and/or information regarding our non-discrimination obligations, please contact OEO’s Title VI Coordinator at (360) 705-7082.


![Robertson, B. E., Banerji, M., Cooper, M. C., Davies, R ... · arXiv:1708.01617v1 [astro-ph.GA] 4 Aug 2017 Large Synoptic Survey Telescope Galaxies Science Roadmap Robertson, Brant](https://img.pdfslide.us/doc/110x75/5ea22d653a97b8604340961c/robertson-b-e-banerji-m-cooper-m-c-davies-r-arxiv170801617v1-astro-phga.jpg)