Embed Size (px)
Citation preview

Measurements of net radiation and its components insemi-arid climate of Baghdad
M. Al-Riahi a,*, K. Al-Jumaily b, I. Kamies b
a Solar Energy Research Center, Al-Jadiriyah, P.O. Box 13026, Baghdad, Iraqb Meteorological Department, College of Science, Al-Mustansiriyah University, P.O. Box 14022, Baghdad, Iraq
Received 23 October 2001; accepted 20 March 2002
Abstract
Regular measurements of incoming global radiation, net short wave radiation and total net radiationwere taken above a natural prairie grass during a one year period. Air temperature and relative humiditymeasurements were also taken simultaneously. Variations in the seasonal patterns of these quantities havebeen presented and their distributions discussed. Two linear relationships between the monthly means, bothfor 24 h period and daytime, of net radiation and global radiation were developed. Analysis of the hourlyregressions of net radiation and global radiation for clear skies yields four values of heating coefficients:winter, spring, summer and autumn. Heating coefficients were consistently positive, and the values gen-erally found are small compared with unity. For the climate of Baghdad, good agreement is found betweenthe hourly observed total net radiation and estimates made with the simple empirical scheme presented byHoltslag and Van Ulden. For all clear skies data, it appears that the root mean square error is r ¼ 28Wm�2 for the net radiation, which is 7% of the observed average hourly values, and that the correlationcoefficient is 0.992. Two expressions for the temperature difference between the air and the sky were ob-tained. In summer, the temperature difference does not exceed 10 �C, while during winter months, thedifference is �20 �C. This, in turn, is related to the amount of precipitable water vapour.� 2002 Elsevier Science Ltd. All rights reserved.
1. Introduction
Knowledge of the global solar radiation available at the earth�s surface is of great importance insolving many scientific problems, such as practical utilization of solar energy, irradiation of plantswith the wavelengths necessary for photosynthesis and dynamic and life giving processes on the
Energy Conversion and Management 44 (2003) 509–525www.elsevier.com/locate/enconman
*Corresponding author. Tel.: +964-776-1990.
0196-8904/02/$ - see front matter � 2002 Elsevier Science Ltd. All rights reserved.
PII: S0196-8904(02)00075-4

planet earth. On the other hand, the net radiation flux of the underlying surface is the maindeterminant of the climate, as well as the input to crop prediction models and to estimates of cropwater consumption. As in many parts of the world, there have been a large number of stationsmeasuring global radiation, but yet few actual measurements of net radiation are found. Becauseof this lack of measurement, net radiation has been calculated from empirical formulas based onphysical considerations, and it needs some meteorological data. Linacre [13] developed a numberof approximate expressions for net radiation with low accuracy but very simple in estimation. Theexpressions were tested in three climatic regions and incorporation of locally adjusted constantsseem to be required.
From a practical point of view, it is important that net radiation be determined from rela-tionships that are not location dependent but are more universally applicable and easy to use.Several studies have been conducted on relationships between net radiation and global radiation.These include those by Fleischer [6], Monteith and Szeicz [15], Stanhill et al. [20], Idso [11], Daviesand Buttimor [5], Gay [9] and Nkemdirim [17]. In most of these studies, good linear relationshipsbetween net radiation and global radiation were derived, in which the correlation coefficient ex-ceeded 0.95. Therefore, net radiation and global radiation correlate very strongly, and the rela-tionships over a range of climates and ground surfaces should lead to improved estimates of netradiation relative to those depending on empirical formulas, which are only very approximate.
This paper describes the results of measurements of net radiation and its components that weremade during the year 1994 at Baghdad, Iraq, in association with measurements of air temperatureand relative humidity. An attempt is being made to develop appropriate local relationships toestimate net radiation.
2. Location and instrumentation
2.1. Site description
The data for the analysis presented below was obtained from the Automatic Weather Obser-vation Station of the Solar Energy Research Centre (SERC) at Al-Jadiriyah. The station is locatedabout 4 km to the southeast of the Baghdad city centre (Latitude 33� 140 N, Longitude 44� 140 E,34 m above MSL). The site is situated on a flat expanse plot and is surrounded by greenhousesand buildings in different directions, with the nearest obstruction about 150 m away from themeasuring instruments. It is reckoned, therefore, that the observation site affords adequate ex-posure to the sensors, and that the hemispherical sky radiation is undisturbed.
The surface under investigation is natural prairie grass cut short to a height of about 5 cm.During the period of investigation, artificial irrigation was applied to the surface to maintain itsgeneral condition. The climate of the study area is semi-arid and sub-tropical with very littlerainfall during the year.
2.2. Instrumentation for measurements
Three kinds of radiation measurements were made at the same time. Incident total global ra-diation on a horizontal surface was measured with a PSP Epply Pyranometer. Net solar radiation
510 M. Al-Riahi et al. / Energy Conversion and Management 44 (2003) 509–525

was measured with a CM-7 Kipp & Zonen Albedometer. This instrument consists of two sola-rimeters, one facing upwards for total global radiation and the other facing downward formeasuring reflected global radiation. Readings of net radiation of both solar and terrestrial fluxeswere taken with a Miniature Net Radiometer (MNR), which is similar in design to those describedby Fritschen [7,8]. All the instruments were placed about 1.5 m above the ground surface andleveled horizontally. On two occasions during the year, the sensitivity of the sensors was com-pared with similar, but new, instruments kept inside the laboratory. On calibration of the in-struments after one year, no significant changes were found in the original calibration factor ofeach sensor. The horizontality of the instruments and color of the silica gel drying agent (originalcolor is dark blue) were noticed periodically. Cleaning the dome of the sensitive element, on theother hand, was checked daily. Air temperature and relative humidity at 2.0 m height weremonitored by means of a ventilated thermometer and humidity transmitter (hygrometer) withPERNIX measuring elements, respectively. The output signals from the sensors were fed into ahigh technology multipoint strip chart data logger (Solac MP-080), which integrated the sensor�soutput at 3600 points per hour. The data logger printed out one hour average values for eachsensor continuously (24 h), and the recorder values were stored by an on-line computer for furthercomputations.
3. The surface radiation budget
Radiation balance is the expression given to the net amount of energy incident on a certainsurface. In numerical terms, it consists of the sum of the incident short and long wave radiationand the reradiated or reflected long and short wave radiation. Thus, the definitive equation forradiation balance over a surface is given as
Rn ¼ ð1� aÞðQþ qÞ þ RA � RG ð1Þwhere Rn ¼ net radiation of all wavelengths, Q ¼ short wave direct solar radiation, q ¼ shortwave diffuse solar radiation or sky radiation, RA ¼ long wave thermal radiation from the at-mosphere, RG ¼ long wave thermal radiation and a ¼ albedo of the surface.
At many meteorological stations, incoming solar radiation measurements are available that canbe used directly to estimate net radiation. When no measurements are at hand, empirical equa-tions, such as an Angstrom type formula [1] can be used to determine the incoming solar radi-ation. Incoming long wave radiation from the atmosphere RA depends on the temperature andemissivity of gases and particles in the atmosphere. The temperature of these gases and particles isa function of the amounts of solar and long wave surface radiation intercepted and of their heatloss to higher layers in the atmosphere.
For clear skies, a very simple parameterization of the incoming long wave radiation RA wasproposed by Swinbank [21]. He related RA to the air temperature T by
RA ¼ C1T 6 ð2Þwhere C1 ¼ 5:31� 10�13 Wm�2K�6 is an empirical constant. If clouds are present, a furthercorrection is necessary, and the linear correction included by Paltridge and Platt [18] can beemployed so that
M. Al-Riahi et al. / Energy Conversion and Management 44 (2003) 509–525 511

RA ¼ C1T 6 þ C2N ð3Þ
where C2 ¼ 60 Wm�2 is appropriate for mid-latitudes and N ¼ total cloud cover. Other types ofparameterization of RA are discussed in Arnfield [2] and Lind and Katsaroes [14].
Long wave radiation from the surface RG depends on the surface�s absolute temperature and onits emissivity. The outgoing long wave radiation from the surfaces arises from the Stefan–Boltzmann formula,
RG ¼ rT 4s ð4Þ
where the earth�s surface is assumed to be a black body [19], r ¼ 5:67� 10�8 Wm�2K�4 is theStefan–Boltzmann constant and Ts is the surface radiation temperature (true surface temperature).Since measured air temperature rather than the surface radiation temperature, which is notnormally available, is used to determine the outgoing long wave radiation, it is necessary to in-clude the following correction term of Sellers [19]:
4rT 3ðTs � T Þ ð5ÞThe determination of the difference ðTs � T Þ was based on several factors, such as humidity,
surface characteristics, etc. During unstable conditions, the surface radiation temperature Ts ex-ceeds the air temperature T. Then, the actual outgoing long wave radiation is modified as follows:
RG ¼ rT 4 þ 4rT 3ðTs � T Þ ð6ÞHoltslag and Van Ulden [10] in their study on the radiation balance for Cabauw, The Nether-
lands, presented a model for the surface radiation budget that provides the net radiation overshort grass as follows:
Rn ¼ð1� aÞðQþ qÞ þ C1T 6 � rT 4 þ C2N
1þ C3
ð7Þ
where N is the total cloud cover and C3 is the heating coefficient for the surface. C3 ¼ 0:12 wasobtained for a grass covered surface. This model is a generalization of the model by Monteith andSzeicz [15]. The properties of the surface are represented by two adjustable parameters, the albedoa that describes the effect on the net incoming solar radiation and the coefficient C3 that char-acterizes the thermal properties of the surface.
4. Results and discussion
4.1. Diurnal variation
Along with the climatological characteristics of the net radiation and its components for theearth�s surface, it is of interest to know their variability. The data of Figs. 1–3 characterize themean diurnal cycle of global solar radiation, net short wave radiation and net radiation of allwavelengths for each month, respectively. It is evident from the figures that the distributions aresimilar in pattern. The highest values of radiation occur during the months of May, June and July
512 M. Al-Riahi et al. / Energy Conversion and Management 44 (2003) 509–525

in the early part of the afternoon between 1200 and 1300 h, being an average of 912, 561 and 586Wm�2 for the global radiation, net short wave radiation and total net radiation, respectively,while low average values of �446, 279 and 229 Wm�2 were observed around noon during themonths of December, January and February for the above-mentioned quantities, respectively.These values certainly decrease toward the morning and evening hours. The fraction of globalradiation retained as net short wave radiation depends on the surface albedo and varies with themonths of the year. The mean monthly values of this fraction are about 0.8.
Figs. 4 and 5 demonstrate that the distribution patterns of mean air temperature and relativehumidity show some similarities in phase and regularities with those of the radiation distributions,but a number of differences exist between the air temperature and relative humidity on the onehand and the radiation distributions on the other. Whereas the isolines for radiation distributiongenerally run from left to right on the diagrams for radiation, they generally run from top tobottom on the diagrams for air temperature and relative humidity. Secondly, the daily patternshows that the air temperature lags behind the radiation. For example, it is evident that themaximal radiation values are usually observed in May, June and July, whereas the highest tem-perature figures occur in June, July and August. The values of relative humidity normally ob-served vary inversely to those of the air temperatures.
Fig. 1. Monthly mean of hourly distribution of global radiation in Baghdad.
M. Al-Riahi et al. / Energy Conversion and Management 44 (2003) 509–525 513

4.2. Relationship between global and net radiation
Since measurements of net radiation Rn are not available in many parts of the world, estimateshave generally been made using a linear relationship between net radiation Rn and global radi-ation Qþ q. Such relationships usually provide a simpler method for obtaining Rn in areas whereonly the values of Qþ q are available. For the present study area, an examination was made of therelationships between the monthly means of both the 24 h period (daytimeþ nighttime) Rn anddaytime Rnd net radiation and global radiation during clear days as shown in Fig. 6. The resultingequations of the following form were fitted to the points in Fig. 6.
Rnd ¼ 0:731ðQþ qÞ � 812 Wm�2 ðr ¼ 0:979Þ ð8Þ
for the daytime period, and
Rn ¼ 0:731ðQþ qÞ � 1115 Wm�2 ðr ¼ 0:988Þ ð9Þ
for the 24 h period.Since the data for all months of the year have been combined, strong correlation values were
obtained. This indicates that the net effect of seasonal differences on the surface albedo and the
Fig. 2. Monthly mean of hourly distribution of net short wave radiation in Baghdad.
514 M. Al-Riahi et al. / Energy Conversion and Management 44 (2003) 509–525

long wave fluxes is small. The hourly relationship between global radiation and net radiationbased on the daytime hours has also been found for the four seasons (Figs. 7–10). In establishingthe relationships, consideration was given to the daytime period. The 10 h period between 0700and 1700 h has been used for the winter months of December–February and for the autumnmonths of September–November, whereas the 11 h period (0600–1700 h) were used in the otherseasons. It was found from experiment that Rn is strongly correlated with global radiation Qþ qaccording to the empirical equation:
Rn ¼1� a1þ b
� �ðQþ qÞ þ Lno ð10Þ
where Lno is the intercept of the linear regression between net radiation and global radiation andð1� aÞ=ð1þ bÞ is the slope.
Monteith and Szeicz [15], who first obtained Eq. (10), suggested that b could be regarded as aheating coefficient. It specifies the rate of change in long wave radiation loss for a unit change innet radiation. b was derived from the slope of Eq. (10) once the albedo of the underlying surface isknown. The average albedo (constant albedo) values were obtained by applying the method pi-oneered by Stanhill et al. [20], which uses the slope of the regression line relating reflected shortwave radiation to global radiation. The average albedo values resulting from this regression for
Fig. 3. Monthly mean of hourly distribution of net radiation in Baghdad.
M. Al-Riahi et al. / Energy Conversion and Management 44 (2003) 509–525 515

Baghdad, corresponding to the four seasons winter, spring, summer and autumn, were 0.19, 0.22,0.21 and 0.20, respectively.
In Table 1, the constants of the regression line for the relation between net radiation and globalradiation and the correlation coefficients for each of the four seasons are listed. Although fourvalues for the heating coefficient b are reported, the b values show an approximate inverse relationwith the slope of the regression line, the greater the slope, the smaller the b values. The inferredvalues are in agreement with other investigations [9,17,20]. Several authors have reported that theheating coefficient is as much dependent on atmospheric properties as upon the surface condition[12,16]. However, the values generally found are small compared with unity.
4.3. Diurnal variation of net radiation components
Fig. 11A and B represent the diurnal variation in hourly net radiation for four consecutive daysof varying sunshine duration in January and June. There was no regular diurnal variation in thehourly net radiation during overcast days in the winter and dusty days in the summer, while thediurnal net radiation flux showed a typical radiation wave pattern on relatively sunny days. Thisis illustrated by the data of January 28 and 29, when the sunshine duration values were 9.41 and
Fig. 4. Monthly mean of hourly distribution of air temperature in Baghdad.
516 M. Al-Riahi et al. / Energy Conversion and Management 44 (2003) 509–525

6.75 h, respectively. Similar results were observed in the diurnal net radiation of June 2, 3 and 4,when the sunshine duration values were 9.33, 12.17 and 11.08 h, respectively.
Fig. 12 shows the daily cycle of net radiation and its components for Baghdad. The values ofglobal, net short wave and net radiation were averaged from observations on clear days during thewinter, spring, summer and autumn months. The other components of the net radiation wereobtained by calculation. Observations show that, as a rule, the maximal positive values of the netradiation occur around noon with the highest negative values occurring at night. The nightvariation of the net radiation (the nighttime range of effective radiation) is small in comparisonwith its variation during the day. The curve of the diurnal cycle of net radiation is usuallysymmetrical in relation to noon. The afternoon values are somewhat lower, and that is distinctlymarked in normal days rather than in average days. As seen from Fig. 12, the leading componentof the daytime net radiation is the global radiation. So, the maximum in net radiation is observedalmost exactly at noon, between 1100 and 1300 h, and its value is found to differ during thetransitional seasons, being 229, 501, 586 and 346 Wm�2 for winter, spring, summer and autumn,respectively.
The maximum negative net radiation occurred immediately after sunset and decreased grad-ually with the usual decrease of surface temperature during the night, reaching its minimum atsunrise. However, on average, the nighttime negative values of the net radiation were 24, 31, 25
Fig. 5. Monthly mean of hourly distribution of relative humidity in Baghdad.
M. Al-Riahi et al. / Energy Conversion and Management 44 (2003) 509–525 517

and 16 Wm�2 for the winter, spring, summer and autumn months, respectively. The daytimeenergy loss by long wave exchange ðRA � RGÞ showed different values with the seasonal variationand clearly exceeds the energy loss by short wave radiation (reflected radiation), especially duringthe winter and autumn months.
Hourly daytime and nighttime values of the evaporation equivalent of net radiation ðRn=LÞ inmmday�1 over the short grass surface of the considered area were calculated from the data ofhourly measurements of net radiation, where L is the latent heat of vapourization. It is note-worthy that the evaporation equivalent of 1 cal cm�2 min is 24.4 mmday�1. Fig. 13 shows the 24 hdistribution in the different seasons of the evaporation equivalent of net radiation. In all seasons,the maximum values are observed almost exactly at noon, and the minimum values are usuallyobserved in early morning and late afternoon. It appears that values of the order of 8.0, 12.1, 17.5and 20.8 mmday�1 are to be considered as the highest maxima for winter, autumn, spring andsummer, respectively. The diurnal maximum value of evaporation equivalent was about two andone-half as much in summer as in winter.
Fig. 14 shows the results of comparison between measured and estimated daytime net radiationusing Eq. (7). This comparison was adopted for random samples of clear skies data only, in whichcase the term for cloud cover N in the numerator of Eq. (7) is small compared with 1.0 and shouldbe neglected. Eq. (7), with a ¼ 0:21 and C3 ¼ 0:12, produced the root mean square error
Fig. 6. Correlation between monthly mean of daily net radiation and monthly mean of daily global radiation in
Baghdad.
518 M. Al-Riahi et al. / Energy Conversion and Management 44 (2003) 509–525

Fig. 7. Correlation between monthly mean of hourly daytime net radiation and monthly mean of hourly global
radiation for winter in Baghdad.
Fig. 8. Correlation between monthly mean of hourly daytime net radiation and monthly mean of hourly global
radiation for spring in Baghdad.
M. Al-Riahi et al. / Energy Conversion and Management 44 (2003) 509–525 519
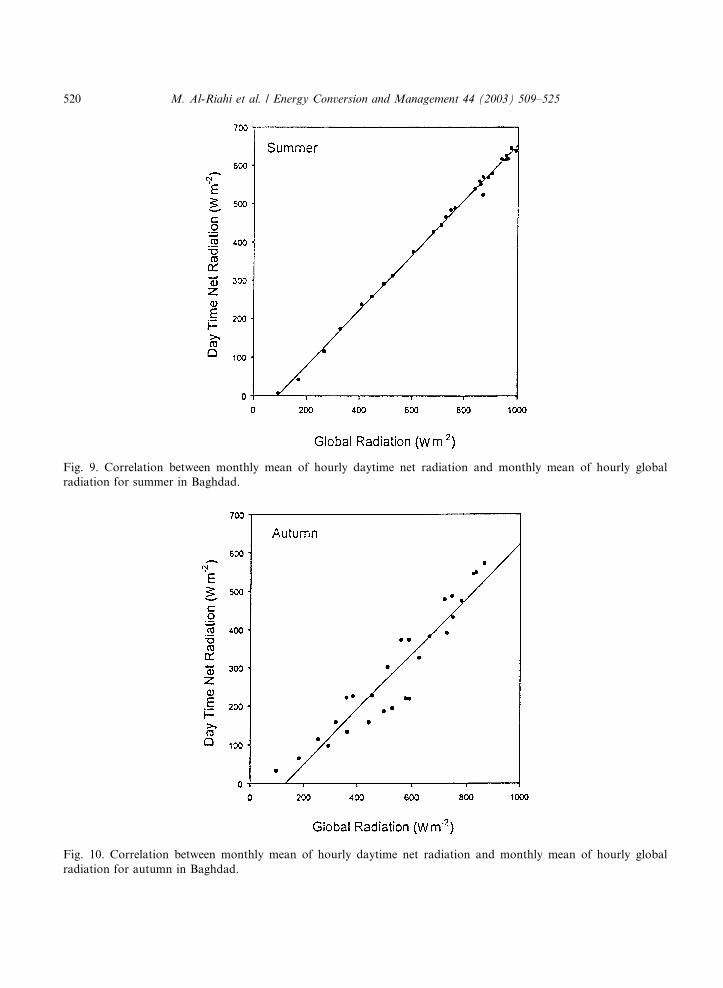
Fig. 9. Correlation between monthly mean of hourly daytime net radiation and monthly mean of hourly global
radiation for summer in Baghdad.
Fig. 10. Correlation between monthly mean of hourly daytime net radiation and monthly mean of hourly global
radiation for autumn in Baghdad.
520 M. Al-Riahi et al. / Energy Conversion and Management 44 (2003) 509–525
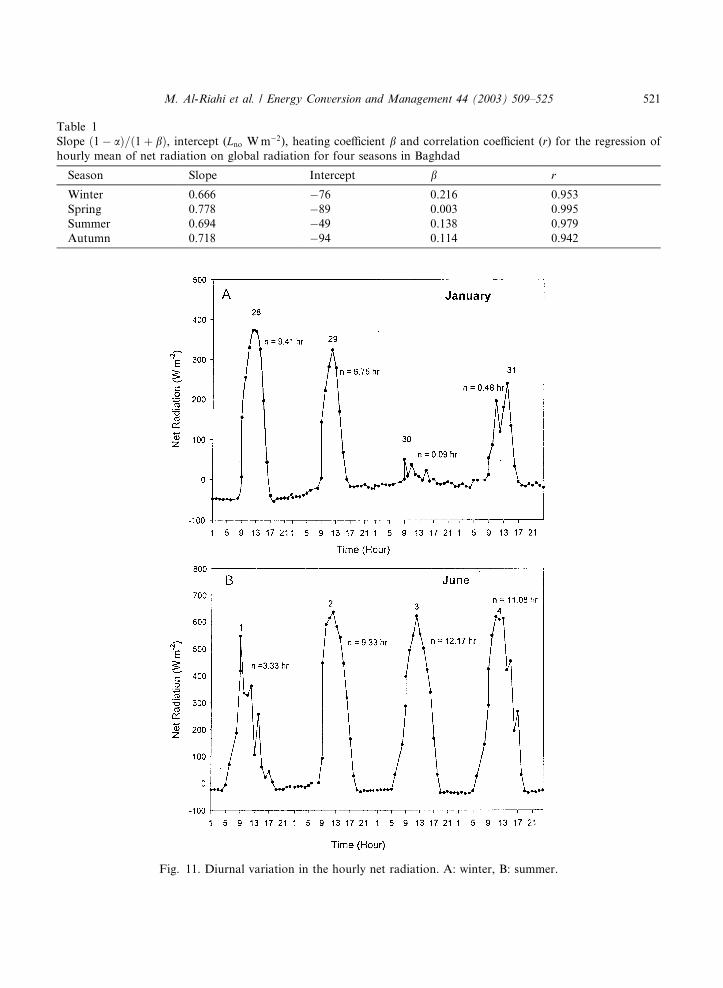
Table 1
Slope ð1� aÞ=ð1þ bÞ, intercept (Lno Wm�2), heating coefficient b and correlation coefficient (r) for the regression of
hourly mean of net radiation on global radiation for four seasons in Baghdad
Season Slope Intercept b r
Winter 0.666 �76 0.216 0.953
Spring 0.778 �89 0.003 0.995
Summer 0.694 �49 0.138 0.979
Autumn 0.718 �94 0.114 0.942
Fig. 11. Diurnal variation in the hourly net radiation. A: winter, B: summer.
M. Al-Riahi et al. / Energy Conversion and Management 44 (2003) 509–525 521

r ¼ 28 Wm�2 for net radiation, which is 7% of the observed average hourly values, and thecorrelation coefficient was excellent (r ¼ 0:992).
4.4. Sky temperature
Absorption of solar radiation by water vapour is the major source of solar radiative heatingwithin the atmosphere itself. Radiative heat exchange in the atmosphere is connected with changesin air temperature. Several relations have been proposed to relate sky temperature for clear skiesto other measured meteorological variables. Swinbank [21] relates sky temperature Ts to the localair temperature Ta in the simple relationship:
Ts ¼ 0:0552T 1:5a ð11Þ
where Ts and Ta are both in degrees Kelvin. Brunt [4] and Bliss [3] relate the effective sky tem-perature to water vapour content of the air and/or air temperature.
Fig. 12. Diurnal variation of net radiation components during winter, spring, summer and autumn (means of clear
days).
522 M. Al-Riahi et al. / Energy Conversion and Management 44 (2003) 509–525

Fig. 13. Mean hourly distribution of the evaporation equivalent of net radiation in different seasons.
Fig. 14. Comparison of observed hourly net radiation with estimated values of Eq. (7) for clear skies at Baghdad.
M. Al-Riahi et al. / Energy Conversion and Management 44 (2003) 509–525 523

Using Eq. (11) and the data of monthly average of daily air temperature in Baghdad duringclear days, the sky temperatures were deduced. Fig. 15 shows the annual variations of Ts and Ta.One of the main features of this plot is that the maximal differences between air temperature andsky temperature were observed in the winter months, being 20 �C. The corresponding differenceswill be 10 �C in the summer months. The appearance of the summer minima is brought about bythe increase of the precipitable water vapour at this time of the year, while in winter, the reverse isthe case. The mean values of precipitable water vapour were 2.3 cm in the summer months, whilefor winter, it equaled 1.5 cm.
5. Conclusions
The mean monthly distribution of hourly total net radiation shows basically the same patternas the distributions of global and net short wave radiation, both of which are major componentsof the radiation balance equation. Some similarities, as well as some differences, occur in thepattern of the temperature and relative humidity distributions. The relationship between globaland net radiation has been found to be strongly correlated, and the correlation coefficient exceeds
Fig. 15. Annual distribution of air temperature Ta and sky temperature Ts for clear days in Baghdad.
524 M. Al-Riahi et al. / Energy Conversion and Management 44 (2003) 509–525

0.95. However, that correlation coefficient lends support to estimating net radiation successfullywhen only data on global radiation are available for this area. When the albedo of the underlyingsurface is held constant, the slope relating hourly net radiation to global radiation may be wellapproximated by ð1� aÞ=ð1þ bÞ. Four values of b, corresponding to the four seasons winter,spring, summer and autumn, are reported. The b values show an inverse variation with the slopeof the regression line, the greater the slope, the smaller the b values. The Holtslag and Van Ulden[10] equation was used in this study to calculate net radiation. To get an impression of the totalerror that can be expected, a comparison between measured and calculated net radiation for clearskies was performed. For the comparison at Baghdad, we obtain r ¼ 28 Wm�2, which is 7% ofthe observed average. The maximal differences between air temperature and sky temperature wereobserved in the winter months, being 20 �C. The corresponding differences will be 10 �C in thesummer months.
References
[1] Angstrom A. Solar and terrestrial radiation. QJR Meteorol Soc 1924;50:121–5.
[2] Arnfield AJ. Evaluation of empirical expressions for the estimation of hourly and daily total of atmospheric
longwave emissions under all sky conditions. QJR Meteorol Soc 1979;105:1041–52.
[3] Bliss RW. Atmospheric radiation near the surface of the ground. Sol Energy 1961;5:103.
[4] Brunt D. Notes on radiation in the atmosphere. QJR Meteorol Soc 1932;58:389–420.
[5] Davies AJ, Buttimor PH. Reflection coefficients� heating coefficients and net radiation at Simcoe, Southern
Ontario. Agric Meteorol 1969;6:373–86.
[6] Fleischer R. Der Jahrgang der Strahlungsbilanz und ihrer Komponenten. Ann Meteorol Ser B 1953;6:357–64.
[7] Fritschen LJ. Construction and evaluation of a miniature net radiation. J Appl Meteorol 1963;2:165–72.
[8] Fritschen LJ. Miniature net radiometer improvements. J Appl Meteorol 1965;4:528–32.
[9] Gay LW. The regression of net radiation upon solar radiation. Arch Meteorol Geophys Bioclimatol Ser B
1971;19:1–14.
[10] Holtslag AAM, Van Ulden AP. A simple scheme for daytime estimates of the surface fluxes from routine weather
data. J Climate Appl Meteorol 1983;22:517–29.
[11] Idso SB. An analysis of the heating coefficient concept. J Appl Meteorol 1968;7:716–7.
[12] Idso SB, Baker DG, Blad BL. Relations of radiation fluxes over natural surfaces. QJR Meteorol Soc 1969;95:
244–57.
[13] Linacre ET. Estimating the net radiation flux. Agric Meteorol 1968;5:49–63.
[14] Lind KJ, Katsaroes KD. A model of longwave radiation for use with surface observations. J Appl Meteorol
1982;21:1015–23.
[15] Monteith SL, Szeicz G. The radiation balance of a bare soil and vegetation. QJR Meteorol Soc 1961;87:159–70.
[16] Moore GT. A comparative study of radiation balance above forest and grassland. QJRMeteorol Soc 1976;102:889.
[17] Nkemdirim LC. Relations of radiation fluxes over prairie grass. Arch Meteorol Geophys Bioclimatol Ser B
1972;20:23–40.
[18] Paltridge GW, Platt CMR. Radiative processes in meteorology and climatology. Development in atmospheric
science, vol. 5. 1976. Amsterdam: Elsevier; p. 318.
[19] Sellers WD. In: Physical climatology. Chicago: The University of Chicago press; 1974. p. 61.
[20] Stanhill G, Hofstede GH, Kalma JD. Radiation balance of natural and agricultural vegetation. QJR Meteorol Soc
1966;92:129–40.
[21] Swinbank WC. Longwave radiation from clear skies. QJR Meteorol Soc 1963;89:339–48.
M. Al-Riahi et al. / Energy Conversion and Management 44 (2003) 509–525 525