Embed Size (px)
Citation preview
MEASUREMENTS OF FREQUENCIES OF SOLAROSCILLATIONS FROM THE MDI MEDIUM�l PROGRAM
E�J� RHODES� JR�Department of Physics and Astronomy� University of Southern California� Los Angeles� CA
������ and Space Physics Research Element� Jet Propulsion Laboratory� Pasadena� CA ������USA
A�G� KOSOVICHEV� J� SCHOU and P�H� SCHERRERW�W� Hansen Experimental Physics Laboratory�Stanford University� Stanford� CA ������ USA
J� REITERMathematisches Institut� Technische Universitat Munchen� D����� Munich� Germany
Abstract� Inversions of solar internal structure employ both the frequencies and the associateduncertainties of the solar oscillation modes as input parameters� In this paper we investigatehow systematic errors in these input parameters may a�ect the resulting inferences of the sun�sinternal structure� Such systematic errors are likely to arise from inaccuracies in the theoreticalmodels which are used to represent the spectral lines in the observational power spectra� fromline blending� from asymmetries in the pro�les of these lines� and from other factors� In order tostudy such systematic e�ects we have employed two di�erent duration observing runs �one of ��days and the second of � days obtained with the Medium�l Program of the Michelson DopplerImager experiment onboard the SOHO spacecraft� This observing program provides continuousobservations of solar oscillation modes having angular degrees� l� ranging from � to � ���� Forthis study intermediate� and high�degree p�mode oscillations having degrees less than �� wereemployed�
In the �rst of our tests we employed two di�erent methods of estimating the modal frequenciesand their associated uncertainties from the ��day observational power spectra� In our secondtest we also repeated both methods of frequency estimation on the ���day time series in orderto assess the in�uence of the duration of the observed time series on the computed frequenciesand uncertainties� In a third test we investigated the sensitivity of the computed frequencies tothe choice of initial�guess� or �seed� frequencies that are used in the frequency estimation codes�In a fourth test we attempted to investigate the possible systematic frequency errors which areintroduced when the observational asymmetry in the p�mode peaks is ignored� We carried out thisparticular test by �tting simple models of asymmetric line pro�les to the peaks in the observationalpower spectra� We were then able to compute the di�erences between those frequencies and ourprevious frequencies which had been obtained using the assumption that all of the observationalpeaks were symmetric in shape�
In order to study the possible in�uence of the two di�erent frequency estimation methods uponthe radial pro�le of the internal sound speed� we carried out four parallel structural inversionsusing the di�erent sets and subsets of frequency estimates and uncertainties as computed from the��day observing run as inputs� The results of these four inversions con�rm the previous �ndingby the GONG project �Gough et al�� ���� and by the MDI Medium�l Program �Kosovichevet al�� ���� that� in a thin layer just beneath the convection zone� helium appears to be lessabundant than predicted by theory� However� di�erences in our four inverted radial sound speedpro�les demonstrate that the currently�available techniques for determining the frequencies ofthe Medium�l oscillation peaks introduce systematic errors which are large enough to a�ect theresults of the structural inversions� Moreover� based upon the di�erences in these four invertedsound speed pro�les� it appears that the choice of which subset of modes is included in a particularinversion and which modes are not included may also be introducing systematic errors into our
� E�J� RHODES� JR�� ET AL�
current understanding of solar internal structure� Hence� it appears to be very important thatconsistent sets of modal selection criteria be employed�
Finally� at least one of the two frequency estimation codes which we used was not sensitive tochanges in the input �seed� frequencies which were employed as initial guesses for that code� Thisresult allays fears that the di�erence in the helium abundance between the sun and the referencesolar model in the thin layer beneath the convection zone which was mentioned above might havebeen due to the particular seed frequencies which were employed in the earlier inversions� Sincethis thin layer may likely be the place where the solar dynamo operates� it will be extremelyimportant to observe any possible evolution of this transition layer throughout the upcoming���year activity cycle�
�� Introduction
The two principal goals of helioseismology are� �� the inference of the thermody�namic structure and �� the inference of the dynamical motions of the solar interioras functions of both position within the Sun and of time� The principal means bywhich both of these goals are now being sought is the inversion of the observedproperties of the solar normal modes of oscillation� In the case of the thermo�dynamic structure it is the oscillation frequencies themselves �weighted by theiruncertainties� which are the input data for the inversions� while in the case of thedynamical motions it is the frequency splittings �again properly weighted� whichare inverted� As is described elsewhere �Kosovichev et al�� ����� it is only thefrequencies and splittings of the solar f � and p�mode oscillations have been invert�ed until now� Because of the stochastic nature of solar oscillations �illustrated inthe solar sounds les on the CD�ROM�� one of the most important and di�cultproblems in the frequency measurements is how to account for the stochastic com�ponent in the oscillation spectra� In this paper� we discuss two di�erent spectraltting procedures� the so�called mean�multiplet and averaged�spectra techniques�
Our main goal in this paper is to demonstrate how these two di�erent ttingtechniques� which we have employed to estimate the frequencies of the normalmodes from the MDI Medium�l data� may in uence the inferred radial proleof the solar internal sound speed� Our additional goals are� ��to learn how thefrequencies and uncertainties depend upon the duration of the observing run fromwhich they are computed� ��to learn how the asymmetry which is present in theobservational power spectra will alter the frequencies which are obtained underthe assumption of symmetric shapes for those peaks� ��to learn whether or not thefrequencies which have been computed might be sensitive to changes in the initialguesses which are employed in the frequency estimation programs� and �� to studythe e�ects of modal selection critera upon the inverted results�
For all of these tests we have employed observations which were obtained by theSolar Oscillation Investigation� Michelson Doppler Imager �SOI�MDI� experimenton board the Solar and Heliospheric Observatory �SOHO� spacecraft� In particular�we have employed time series of oscillation observations which were made with the
ed���tex� ���������� ��� no v�� p��
MEASUREMENTS OF FREQUENCIES OF SOLAR OSCILLATIONS FROM MDI �
MDI Medium�l Program� This program has been described in detail by Scherreret al� �������
In Section � we will describe the di�erent MDI observing runs which we employedin our study� In Section � we will describe the two di�erent methods which weemployed in the estimation of the intermediate�l frequencies from these observ�ing runs� We will also describe in this section how we evaluated the e�ects of theobservational asymmetry in the observed power spectral peaks upon the frequencyestimates� Next we will describe how two di�erent sets of �seed� frequencies wereemployed as input parameters for one of the two di�erent frequency estimationprograms�
The inferred radial proles of the solar internal sound speed which resultedfrom the di�erent inversions we carried out will be presented in Section �� whilein Section � we will discuss the relative importance of all of these di�erent e�ectsupon the resulting sound speed proles�
�� The MDI Medium�l Observations
As described by Scherrer et al� ������ the Medium�l Program of the SOI�MDIexperiment is dedicated to the nearly�continuous monitoring of the Doppler veloc�ity eld of the visible solar hemisphere� The Medium�l data are transmitted thoughthe low�rate �� kbps� telemetry channel of SOHO� It is this relatively low bit ratewhich limits the spatial resolution of the Medium�l observations� This low data ratealso requires that some initial processing of the original ����������pixel CCD full�disk Dopplergrams be carried out on board the MDI instrument� Specically� forboth Medium�l observing runs which we employed in this study� the Dopplergramswere binned with Gaussian weights on a square ����pixel grid� The binned imageswhich resulted from this procedure were then generated on board the spacecraftonce per minute� With the exception of rare instrumental problems and occasionaltelemetry drop outs these binned Doppler maps were then transmitted to the earthon a minute�by�minute basis�
The rst of the two Medium�l observing runs which we employed was obtainedon �� consecutive days running from May ��� ����� through July ��� ����� Theoverall duty cycle of this run was ������� The second of the two runs we usedcovered a span of ��� days which ran from May �� ����� through September �������� The overall duty cycle of this run was ����� �see a ��hour movie of the timeseries on the CD�ROM�� A autoregressive gap�lling technique� Brown������� wasemployed to ll�in relatively short gaps in the time series generated from the secondrun and its overall duty cycle was raised to ������� As can be noted from the datesgiven above these two data sets were not independent of each other� Rather� theshorter�duration run is a sub�set of the longer run� This choice of time intervalswas made in order to minimize the possible in uence of any solar�cycle dependentfrequency shifts on our study�
ed���tex� ���������� ��� no v�� p��
� E�J� RHODES� JR�� ET AL�
�� Analysis of the Medium�l Data
���� Power Spectra
The procedures which we employed to convert the time series of Medium�l obser�vations into power spectra are described in Kosovichev et al� ����� in this volume�For both the ���day and ����day observing runs we computed power spectra forall �l� � individual m�values at every degree ranging from l � � through l � ����Hence� for every non�zero degree greater than two� each set of power spectra con�sisted of one zonal �i�e� l � ��� two sectoral �i�e�� m � �l and m � �l�� and �l� �tesseral �i�e�� l not equal to m for non�zero m� power spectra� The spectra whichwere computed from the ���day observing run contained ������ points each� Thespectra computed from the ����day run contained ������� points each� The formalfrequency resolution of the �������point power spectra was �������� �Hz� whilethe resolution of the ��������point spectra was �������� �Hz�
In addition to these two complete sets of power spectra� we also computed twosets of m�averaged power spectra� In the procedure� which collapsed each set ofspectra into a single averaged spectrum� we approximated the frequency splittingwhich is introduced into each multiplet of modes by the solar internal rotation andasphericity with a polynomial expansion similar to that of Duvall� Harvey� andPomerantz �������
�nlm � �nl ���X
k��
a�k�nl P
�l�k �m�� ���
where �nl is the mean frequency of a mode multiplet� and P�l�k �m� are orthogonal
polynomials of degree k dened by
P�l�k�l� � l� and
lX
m��l
P�l�i �m�P�l�
j �m� � � for i �� j� ���
The polynomials� P�l�k �m�� can be expressed in terms of the Clebsch�Gordan coef�
cients �Ritzwoller and Lavely� ������ At l �� k� P�l�i �m� � LPk�m�L�� where
L � l � ���� and Pk are the Legendre polynomials� In this limit� coe�cients� a�k�nl
are equivalent to the coe�cients introduced by Duvall� Harvey� and Pomerantz������� Since
lX
m��l
P�l�k �m� � � for k � �� ���
the mean frequencies� �nl� depend only on the spherically symmetric component of
the solar structure� Frequency splitting coe�cients� a�k�nl � for even k depend on the
aspherical component of the structure� while the coe�cients for odd k measure therotation rate �e�g� Gough� ������ Therefore� in the method in which we collapsed
ed���tex� ���������� ��� no v�� p�
MEASUREMENTS OF FREQUENCIES OF SOLAR OSCILLATIONS FROM MDI �
the individual power spectra into m�averaged spectra we wanted to remove thee�ects of solar rotation from the individual spectra and to accomplish this goal we
used non�zero values for the three odd�k splitting coe�cients �i�e�� a���nl � a
���nl � and
a���nl �� In particular� the three even�k splitting coe�cients �i�e�� a
��nl � a
��nl � and a
���nl �
were each set equal to zero because they were each extremely small in comparisonwith the three odd�k coe�cients� Also� no higher�k coe�cients were included in theexpansion because they were all very small in magnitude in comparison with thethree coe�cients which were employed�� Finally� in the procedure which averagedtogether the shifted tesseral power spectra� we used a single frequency shift for eachseparate tesseral or sectoral spectrum� We did not apply a separate frequency shiftfor each multiplet within that spectrum� The �l shifted spectra were then averagedtogether with the unshifted zonal spectrum� In this procedure each of the separatespectra was included with equal weight� No attempt was made to weight eachseparate spectrum according to its m�value� The ��� m�averaged power spectraare shown as a two�dimensional l�� diagram on the CD�ROM �Fig��b��
���� Frequency Estimation Techniques
������ Mean�Multiplet Technique
The rst of our two di�erent frequency estimation techniques was the so�called�mean�multiplet� technique of Schou������� In this technique the power spectralpeaks are assumed to have a symmetric Lorentzian shape and a maximum like�lihood method is employed to determine the parameters of Lorentzian proles�Furthermore� in this method the peaks are t simultaneously in all of the �l � �individual power spectra for each multiplet so that the e�ects of overlapping peakscan be included in the ts� These �l � � frequencies are then averaged to yielda single frequency� �nl� for that multiplet� In addition� an associated frequency
uncertainty� �nl� and a set of frequency splitting coe�cients� a�k�nl � for which k runs
from � to ��� are obtained for the same multiplet� The mean frequencies whichresulted from the use of this technique on the power spectra from the ����dayMDI Medium�l observing run were illustrated in Figure �� of Kosovichev et al�������
������ Averaged�Spectrum Technique
The second frequency estimation technique which we employed has recently beendescribed by Reiter and Rhodes������ This technique is an elaboration and rene�ment of the least�squares tting technique employed earlier by Korzennik ������in the analysis of data obtained with the Mt� Wilson Observatory�s ���Foot SolarTower� This technique is becoming known as the �averaged�spectrum� methodbecause it employs the m�averaged power spectra rather than the �l�� individualpower spectra which the mean�multiplet method employs�
The application of this second technique results in a single frequency for eachmultiplet rather than a set of �l � � frequencies which must later be averaged
ed���tex� ���������� ��� no v�� p�
� E�J� RHODES� JR�� ET AL�
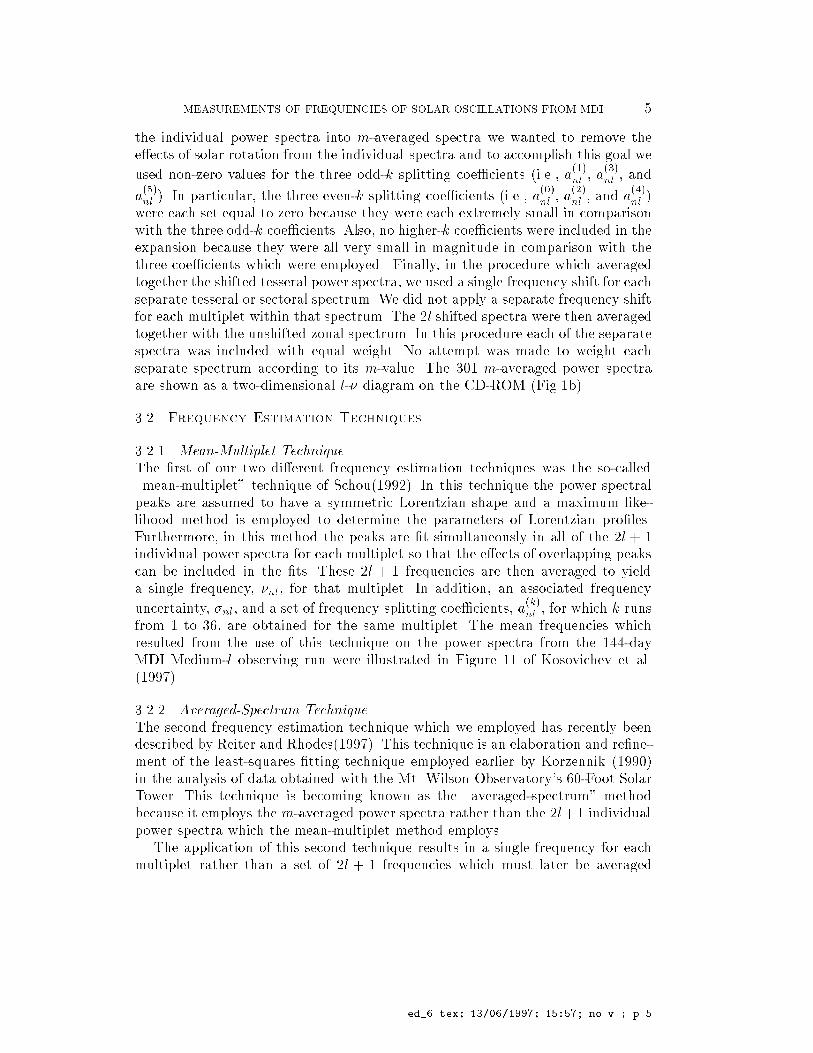
Figure �� Multiplet frequencies determined from m�averaged power spectra obtained from theMDI ��Day Observing Run using the averaged�spectrum method are shown as the small dots�Ridge��t frequencies determined with the averaged�spectrum method as applied to entire p�moderidges rather than individual modal peaks are shown as the larger dots along the extensions of theridges toward higher degrees and frequencies� The formal frequency uncertainties obtained fromthe averaged�spectrum method are superimposed upon both the modal and ridge��t frequencies ingray� For frequencies below ���� �Hz the frequency uncertainties of the modal �ts were multipliedby a factor of ���� before being plotted� For frequencies greater than ���� �Hz the uncertaintiesof the ridge �ts were divided by �� instead� The uncertainties of the ridge �ts below ���� �Hz werenot modi�ed� A color version of this �gure �Fig��a is on the CD�ROM� In Figure �a the modal��t frequencies are shown in blue� the ridge��ts are shown in red� and both sets of uncertaintiesare shown in yellow� Figure �a may be compared with the m�averaged spectrum �Fig��b on theCD�ROM� Samples of the MDI full�disk �Fig��c and medium�l Dopplergrams �Fig��d are alsoshown on the CD�ROM�
together to yield an estimate of the average multiplet frequency� �We note herethat the mean�multiplet technique includes includes ts to several of the spatialsidelobes which are located on both sides of each true peak within a given mul�tiplet� Hence� this technique ts many more peaks in its estimation of multipletfrequencies than does the averaged�spectrum technique��
ed���tex� ���������� ��� no v�� p��
MEASUREMENTS OF FREQUENCIES OF SOLAR OSCILLATIONS FROM MDI
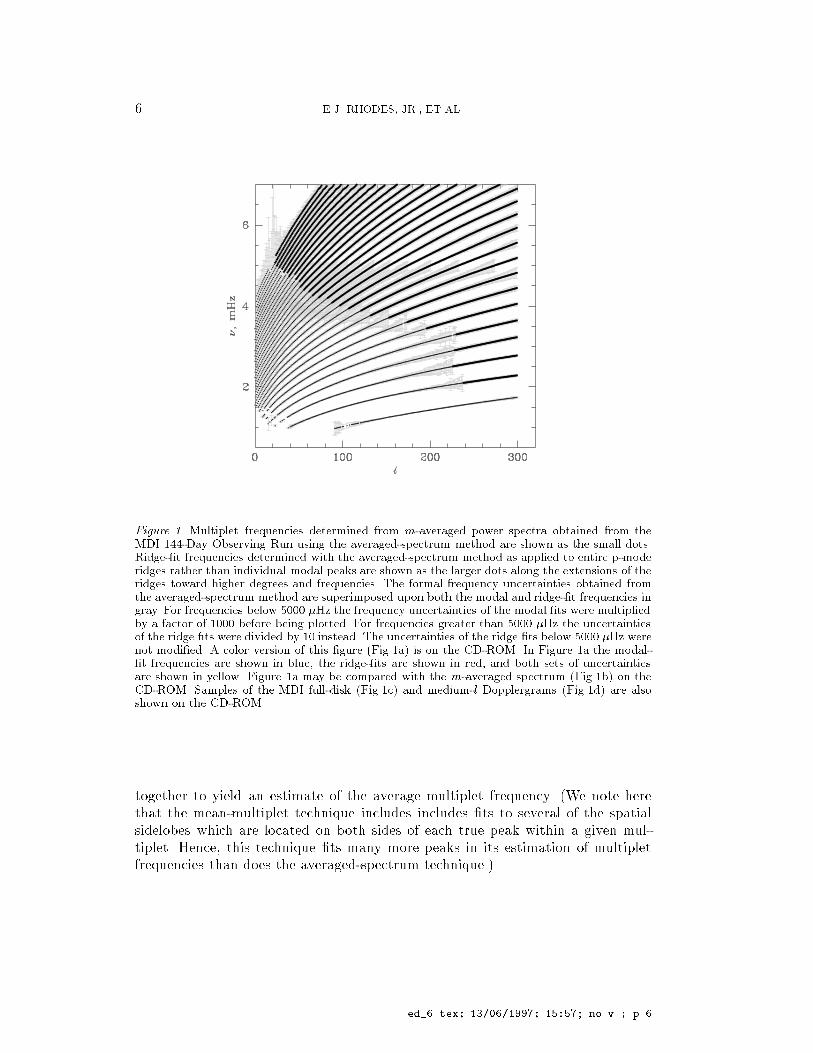
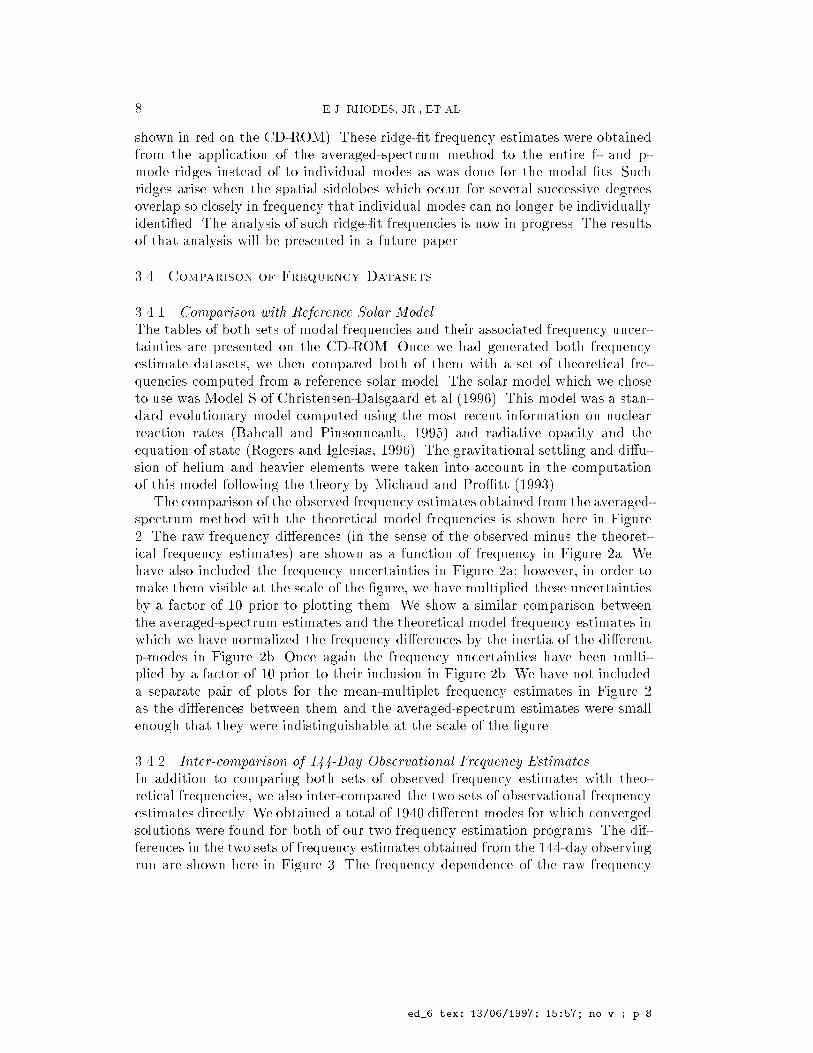
Figure �� a Frequency dependence of di�erences between averaged�spectrum frequency estimatesand reference solar model frequencies �the frequency uncertainties were multiplied by a factor of�� before being plotted in gray� b The same frequency di�erences scaled with mode inertia Q�
���� Averaged�Spectrum Results
The coverage in the l�� plane which resulted from the application of the averaged�spectrum tting technique to the set of m�averaged power spectra computed fromthe ����day observing run is shown here in Figure �� We note that there were onlya small number of spectral peaks for which we were able to obtain a converged tin the spectrum computed from the ����day run but for which we were unable toobtain a corresponding converged t in the ���day spectrum�
In addition to the ��� modal frequencies which are shown in Figure � as thesmall dots �and which are shown in blue in the color version of this Figure onthe CD�ROM�� we have also included in this gure an additional ���� so�called�ridge�t� frequency estimates which are shown as the larger dots � and which are
ed���tex� ���������� ��� no v�� p�
� E�J� RHODES� JR�� ET AL�
shown in red on the CD�ROM�� These ridge�t frequency estimates were obtainedfrom the application of the averaged�spectrum method to the entire f� and p�mode ridges instead of to individual modes as was done for the modal ts� Suchridges arise when the spatial sidelobes which occur for several successive degreesoverlap so closely in frequency that individual modes can no longer be individuallyidentied� The analysis of such ridge�t frequencies is now in progress� The resultsof that analysis will be presented in a future paper�
���� Comparison of Frequency Datasets
������ Comparison with Reference Solar Model
The tables of both sets of modal frequencies and their associated frequency uncer�tainties are presented on the CD�ROM� Once we had generated both frequencyestimate datasets� we then compared both of them with a set of theoretical fre�quencies computed from a reference solar model� The solar model which we choseto use was Model S of Christensen�Dalsgaard et al�������� This model was a stan�dard evolutionary model computed using the most recent information on nuclearreaction rates �Bahcall and Pinsonneault� ����� and radiative opacity and theequation of state �Rogers and Iglesias� ������ The gravitational settling and di�u�sion of helium and heavier elements were taken into account in the computationof this model following the theory by Michaud and Pro�tt �������
The comparison of the observed frequency estimates obtained from the averaged�spectrum method with the theoretical model frequencies is shown here in Figure�� The raw frequency di�erences �in the sense of the observed minus the theoret�ical frequency estimates� are shown as a function of frequency in Figure �a� Wehave also included the frequency uncertainties in Figure �a� however� in order tomake them visible at the scale of the gure� we have multiplied these uncertaintiesby a factor of �� prior to plotting them� We show a similar comparison betweenthe averaged�spectrum estimates and the theoretical model frequency estimates inwhich we have normalized the frequency di�erences by the inertia of the di�erentp�modes in Figure �b� Once again the frequency uncertainties have been multi�plied by a factor of �� prior to their inclusion in Figure �b� We have not includeda separate pair of plots for the mean�multiplet frequency estimates in Figure �as the di�erences between them and the averaged�spectrum estimates were smallenough that they were indistinguishable at the scale of the gure�
������ Inter�comparison of ����Day Observational Frequency Estimates
In addition to comparing both sets of observed frequency estimates with theo�retical frequencies� we also inter�compared the two sets of observational frequencyestimates directly� We obtained a total of ���� di�erent modes for which convergedsolutions were found for both of our two frequency estimation programs� The dif�ferences in the two sets of frequency estimates obtained from the ����day observingrun are shown here in Figure �� The frequency dependence of the raw frequency
ed���tex� ���������� ��� no v�� p��
MEASUREMENTS OF FREQUENCIES OF SOLAR OSCILLATIONS FROM MDI �
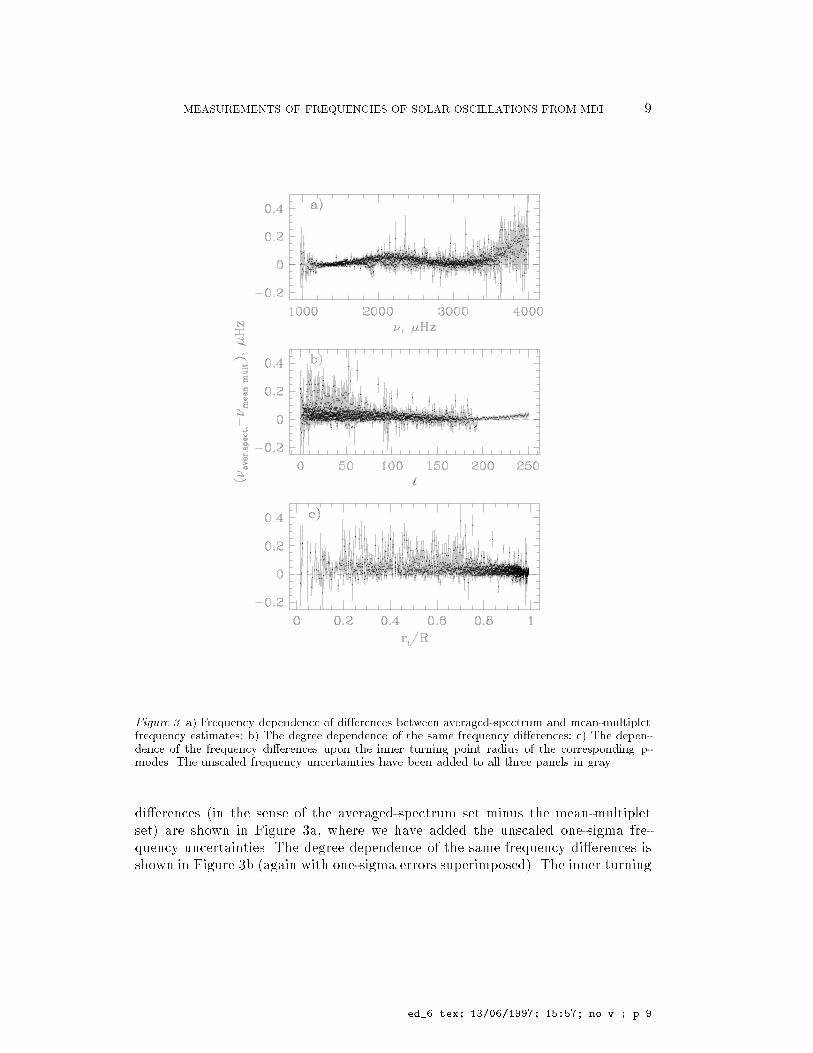
Figure �� a Frequency dependence of di�erences between averaged�spectrum and mean�multipletfrequency estimates� b The degree dependence of the same frequency di�erences� c The depen�dence of the frequency di�erences upon the inner turning point radius of the corresponding p�modes� The unscaled frequency uncertainties have been added to all three panels in gray�
di�erences �in the sense of the averaged�spectrum set minus the mean�multipletset� are shown in Figure �a� where we have added the unscaled one�sigma fre�quency uncertainties� The degree dependence of the same frequency di�erences isshown in Figure �b �again with one�sigma errors superimposed�� The inner turning
ed���tex� ���������� ��� no v�� p��
�� E�J� RHODES� JR�� ET AL�
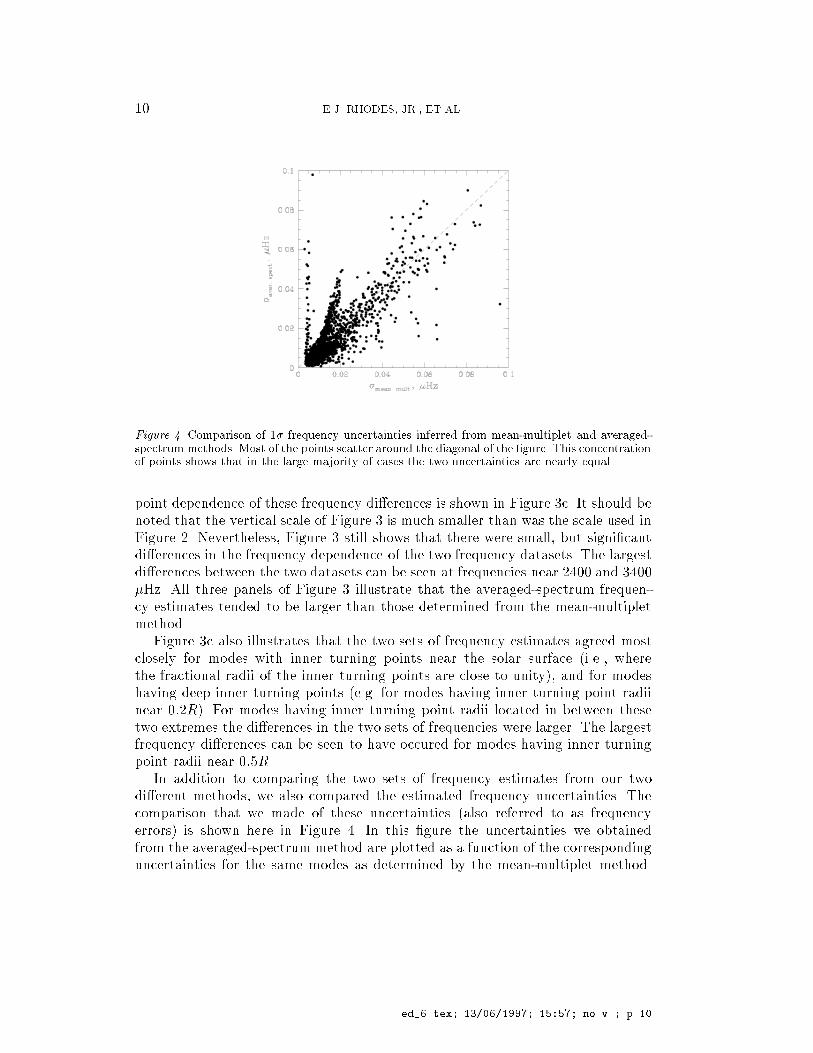
Figure �� Comparison of �� frequency uncertainties inferred from mean�multiplet and averaged�spectrum methods� Most of the points scatter around the diagonal of the �gure� This concentrationof points shows that in the large majority of cases the two uncertainties are nearly equal�
point dependence of these frequency di�erences is shown in Figure �c� It should benoted that the vertical scale of Figure � is much smaller than was the scale used inFigure �� Nevertheless� Figure � still shows that there were small� but signicantdi�erences in the frequency dependence of the two frequency datasets� The largestdi�erences between the two datasets can be seen at frequencies near ���� and �����Hz� All three panels of Figure � illustrate that the averaged�spectrum frequen�cy estimates tended to be larger than those determined from the mean�multipletmethod�
Figure �c also illustrates that the two sets of frequency estimates agreed mostclosely for modes with inner turning points near the solar surface �i�e�� wherethe fractional radii of the inner turning points are close to unity�� and for modeshaving deep inner turning points �e�g� for modes having inner turning point radiinear ���R�� For modes having inner turning point radii located in between thesetwo extremes the di�erences in the two sets of frequencies were larger� The largestfrequency di�erences can be seen to have occured for modes having inner turningpoint radii near ���R�
In addition to comparing the two sets of frequency estimates from our twodi�erent methods� we also compared the estimated frequency uncertainties� Thecomparison that we made of these uncertainties �also referred to as frequencyerrors� is shown here in Figure �� In this gure the uncertainties we obtainedfrom the averaged�spectrum method are plotted as a function of the correspondinguncertainties for the same modes as determined by the mean�multiplet method�
ed���tex� ���������� ��� no v�� p���
MEASUREMENTS OF FREQUENCIES OF SOLAR OSCILLATIONS FROM MDI ��
It is evident in Figure � that most of the uncertainties were very similar in size�however� there was one group of points which fell near the vertical axis of the gure�These points corresponded to cases in which the uncertainties were considerablylarger in the averaged�spectrum method than they were in the mean�multipletmethod� This may have been due to the wider peaks in some of the averagedspectra in comparison with the narrower peaks in the unaveraged tesseral powerspectra which were used in the mean�multiplet method� The larger uncertainties ofthese few averaged�spectrum frequency estimates meant that they were assignedless weight in the inversions than were the corresponding mean�multiplet estimates�Fortunately� there were relatively few such cases�
���� Comparison of ���Day and ����Day Frequency Estimates
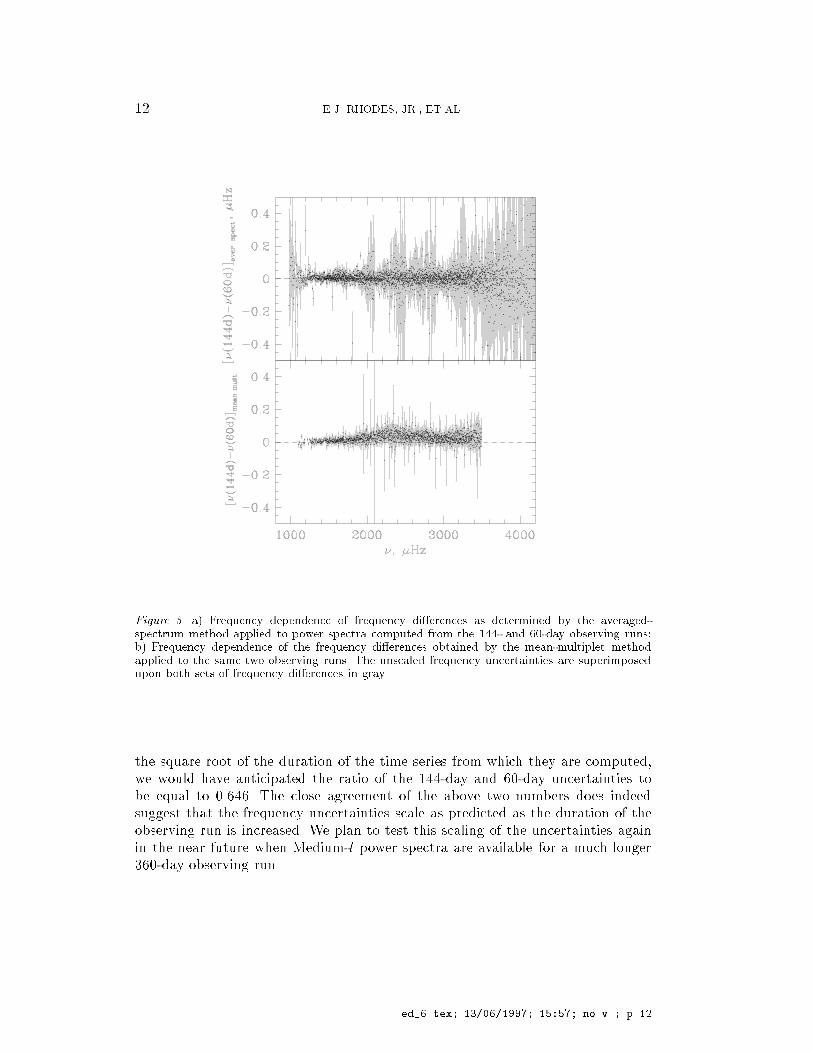
The e�ects of changes in the duration of the observing run from which the pow�er spectra are computed are illustrated here in Figures � and �� The frequencydependence of the di�erences in two sets of averaged�spectrum frequencies whichwere computed from the ����day and from the ���day MDI Medium�l observingruns is shown in Figure �a� while the frequency dependence of the di�erences inthe two sets of mean�multiplet frequencies is shown in Figure �b� Figure �a indi�cates that the frequency estimates computed from the averaged�spectrum methoddo not show any systematic shift between the ���� and ���day observing runs� Incontrast� Figure �b shows that there was a systematic frequency variation in thetwo sets of frequencies which were computed using the mean�multiplet method�We note that the frequency variation shown in Figure �b is very similar in shapeto that shown in Figure �a� It is not at all clear why the frequencies computedfrom one of our two methods would depend upon the duration of the observingrun when those computed from the other method show no such variation� We planto investigate this issue in the future�
An increase in the duration of the observing run from which the modal param�eters are estimated would be expected to result in a decrease in the measuredwidths of the power spectral peaks and also in a corresponding decrease in themagnitudes of the formal frequency uncertainties of the modes� In order to deter�mine whether or not such expectations were realized during the MDI Medium�lobserving program� we also computed the full�width at half maximum �FWHM�of the di�erent power spectral peaks in the two sets of averaged power spectra� Wethen computed the ratios of the FHWM values computed from the ����day and���day observing runs� When we examined these FWHM ratios� we found thatmost of these FWHM ratios were indeed less than unity� as was expected�
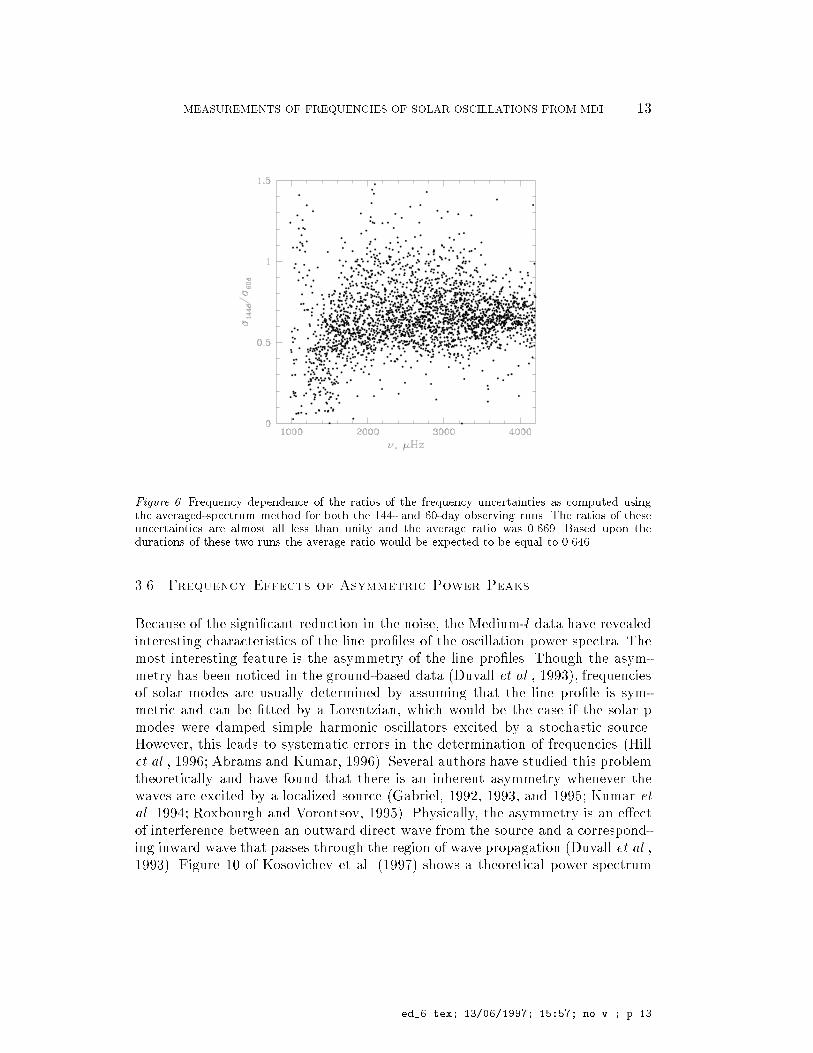
In a similar fashion we also computed the ratios of the formal frequency uncer�tainties which resulted from the ts to our two sets of averaged power spectra� Thefrequency dependence of the ratios in the frequency uncertainties is shown herein Figure �� The average ratio of the ����day and ���day frequency uncertaintieswas equal to ������ Since the frequency uncertainties are expected to scale with
ed���tex� ���������� ��� no v�� p���
�� E�J� RHODES� JR�� ET AL�
Figure �� a Frequency dependence of frequency di�erences as determined by the averaged�spectrum method applied to power spectra computed from the �� and ���day observing runs�b Frequency dependence of the frequency di�erences obtained by the mean�multiplet methodapplied to the same two observing runs� The unscaled frequency uncertainties are superimposedupon both sets of frequency di�erences in gray�
the square root of the duration of the time series from which they are computed�we would have anticipated the ratio of the ����day and ���day uncertainties tobe equal to ������ The close agreement of the above two numbers does indeedsuggest that the frequency uncertainties scale as predicted as the duration of theobserving run is increased� We plan to test this scaling of the uncertainties againin the near future when Medium�l power spectra are available for a much longer����day observing run�
ed���tex� ���������� ��� no v�� p���
MEASUREMENTS OF FREQUENCIES OF SOLAR OSCILLATIONS FROM MDI ��
Figure �� Frequency dependence of the ratios of the frequency uncertainties as computed usingthe averaged�spectrum method for both the �� and ���day observing runs� The ratios of theseuncertainties are almost all less than unity and the average ratio was ������ Based upon thedurations of these two runs the average ratio would be expected to be equal to �����
���� Frequency Effects of Asymmetric Power Peaks
Because of the signicant reduction in the noise� the Medium�l data have revealedinteresting characteristics of the line proles of the oscillation power spectra� Themost interesting feature is the asymmetry of the line proles� Though the asym�metry has been noticed in the ground�based data �Duvall et al�� ������ frequenciesof solar modes are usually determined by assuming that the line prole is sym�metric and can be tted by a Lorentzian� which would be the case if the solar pmodes were damped simple harmonic oscillators excited by a stochastic source�However� this leads to systematic errors in the determination of frequencies �Hillet al�� ����� Abrams and Kumar� ������ Several authors have studied this problemtheoretically and have found that there is an inherent asymmetry whenever thewaves are excited by a localized source �Gabriel� ����� ����� and ����� Kumar etal� ����� Roxbourgh and Vorontsov� ������ Physically� the asymmetry is an e�ectof interference between an outward direct wave from the source and a correspond�ing inward wave that passes through the region of wave propagation �Duvall et al�������� Figure �� of Kosovichev et al� ����� shows a theoretical power spectrum
ed���tex� ���������� ��� no v�� p���
�� E�J� RHODES� JR�� ET AL�
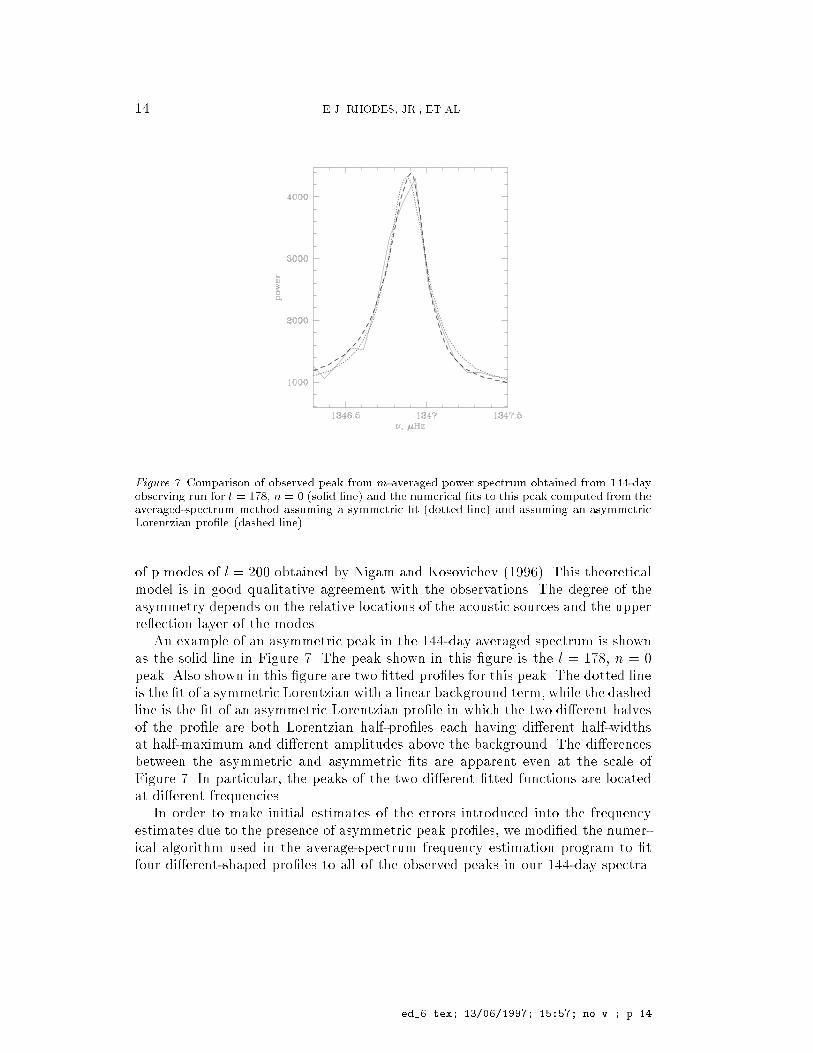
Figure � Comparison of observed peak from m�averaged power spectrum obtained from ��dayobserving run for l � ���� n � � �solid line and the numerical �ts to this peak computed from theaveraged�spectrum method assuming a symmetric �t �dotted line and assuming an asymmetricLorentzian pro�le �dashed line�
of p modes of l � ��� obtained by Nigam and Kosovichev ������� This theoreticalmodel is in good qualitative agreement with the observations� The degree of theasymmetry depends on the relative locations of the acoustic sources and the upperre ection layer of the modes�
An example of an asymmetric peak in the ����day averaged spectrum is shownas the solid line in Figure � The peak shown in this gure is the l � ��� n � �peak� Also shown in this gure are two tted proles for this peak� The dotted lineis the t of a symmetric Lorentzian with a linear background term� while the dashedline is the t of an asymmetric Lorentzian prole in which the two di�erent halvesof the prole are both Lorentzian half�proles each having di�erent half�widthsat half�maximum and di�erent amplitudes above the background� The di�erencesbetween the asymmetric and asymmetric ts are apparent even at the scale ofFigure � In particular� the peaks of the two di�erent tted functions are locatedat di�erent frequencies�
In order to make initial estimates of the errors introduced into the frequencyestimates due to the presence of asymmetric peak proles� we modied the numer�ical algorithm used in the average�spectrum frequency estimation program to tfour di�erent�shaped proles to all of the observed peaks in our ����day spectra�
ed���tex� ���������� ��� no v�� p��
MEASUREMENTS OF FREQUENCIES OF SOLAR OSCILLATIONS FROM MDI ��
We then ran this modied version of the program and for each observed peak weselected the model t which minimized the residuals about that t as the �best�model for that peak� The rst of these four di�erent models was our original sym�metric Lorentzian prole with a linearly�varying background� The second modelwas an asymmetric Lorentzian with linearly�varying background of the type shownin Figure � The third model was an asymmetric Lorentzian with a quadratically�varying background and the fourth model was an asymmetric Gaussian with aquadratic background�
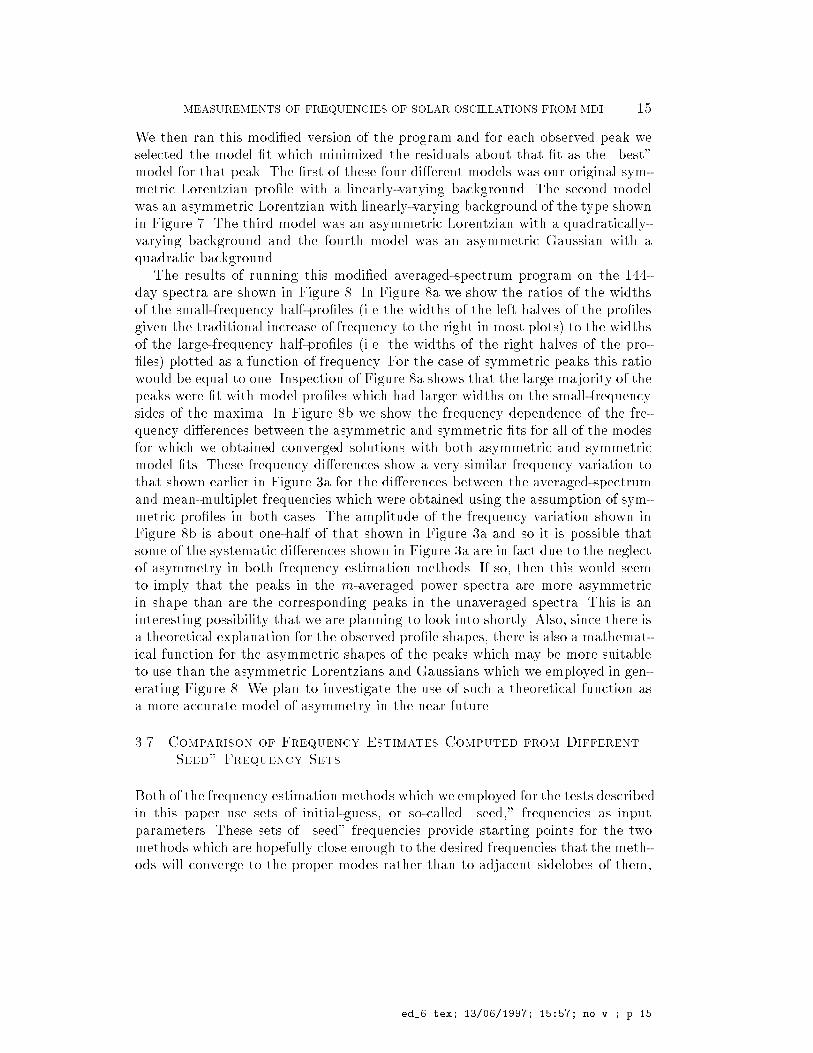
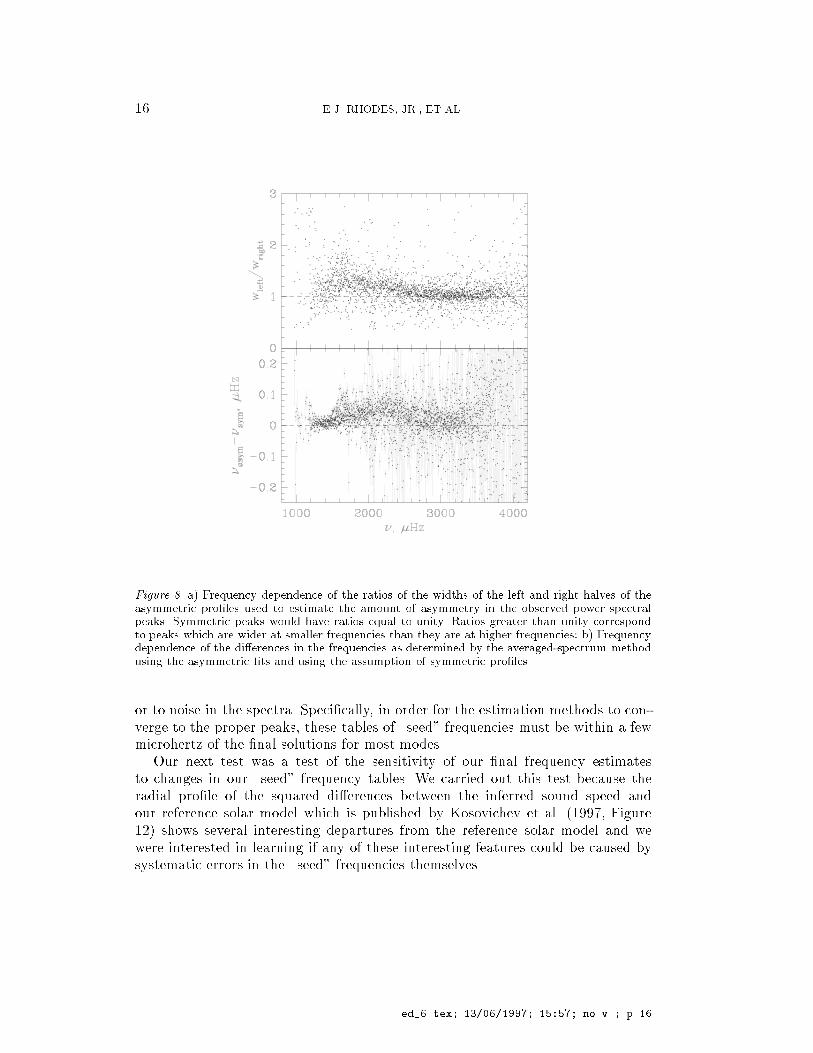
The results of running this modied averaged�spectrum program on the ����day spectra are shown in Figure �� In Figure �a we show the ratios of the widthsof the small�frequency half�proles �i�e the widths of the left halves of the prolesgiven the traditional increase of frequency to the right in most plots� to the widthsof the large�frequency half�proles �i�e� the widths of the right halves of the pro�les� plotted as a function of frequency� For the case of symmetric peaks this ratiowould be equal to one� Inspection of Figure �a shows that the large majority of thepeaks were t with model proles which had larger widths on the small�frequencysides of the maxima� In Figure �b we show the frequency dependence of the fre�quency di�erences between the asymmetric and symmetric ts for all of the modesfor which we obtained converged solutions with both asymmetric and symmetricmodel ts� These frequency di�erences show a very similar frequency variation tothat shown earlier in Figure �a for the di�erences between the averaged�spectrumand mean�multiplet frequencies which were obtained using the assumption of sym�metric proles in both cases� The amplitude of the frequency variation shown inFigure �b is about one�half of that shown in Figure �a and so it is possible thatsome of the systematic di�erences shown in Figure �a are in fact due to the neglectof asymmetry in both frequency estimation methods� If so� then this would seemto imply that the peaks in the m�averaged power spectra are more asymmetricin shape than are the corresponding peaks in the unaveraged spectra� This is aninteresting possibility that we are planning to look into shortly� Also� since there isa theoretical explanation for the observed prole shapes� there is also a mathemat�ical function for the asymmetric shapes of the peaks which may be more suitableto use than the asymmetric Lorentzians and Gaussians which we employed in gen�erating Figure �� We plan to investigate the use of such a theoretical function asa more accurate model of asymmetry in the near future�
��� Comparison of Frequency Estimates Computed from Different
�Seed� Frequency Sets
Both of the frequency estimation methods which we employed for the tests describedin this paper use sets of initial�guess� or so�called �seed�� frequencies as inputparameters� These sets of �seed� frequencies provide starting points for the twomethods which are hopefully close enough to the desired frequencies that the meth�ods will converge to the proper modes rather than to adjacent sidelobes of them�
ed���tex� ���������� ��� no v�� p��
�� E�J� RHODES� JR�� ET AL�
Figure �� a Frequency dependence of the ratios of the widths of the left and right halves of theasymmetric pro�les used to estimate the amount of asymmetry in the observed power spectralpeaks� Symmetric peaks would have ratios equal to unity� Ratios greater than unity correspondto peaks which are wider at smaller frequencies than they are at higher frequencies� b Frequencydependence of the di�erences in the frequencies as determined by the averaged�spectrum methodusing the asymmetric �ts and using the assumption of symmetric pro�les�
or to noise in the spectra� Specically� in order for the estimation methods to con�verge to the proper peaks� these tables of �seed� frequencies must be within a fewmicrohertz of the nal solutions for most modes�
Our next test was a test of the sensitivity of our nal frequency estimatesto changes in our �seed� frequency tables� We carried out this test because theradial prole of the squared di�erences between the inferred sound speed andour reference solar model which is published by Kosovichev et al� ����� Figure��� shows several interesting departures from the reference solar model and wewere interested in learning if any of these interesting features could be caused bysystematic errors in the �seed� frequencies themselves�
ed���tex� ���������� ��� no v�� p���
MEASUREMENTS OF FREQUENCIES OF SOLAR OSCILLATIONS FROM MDI �
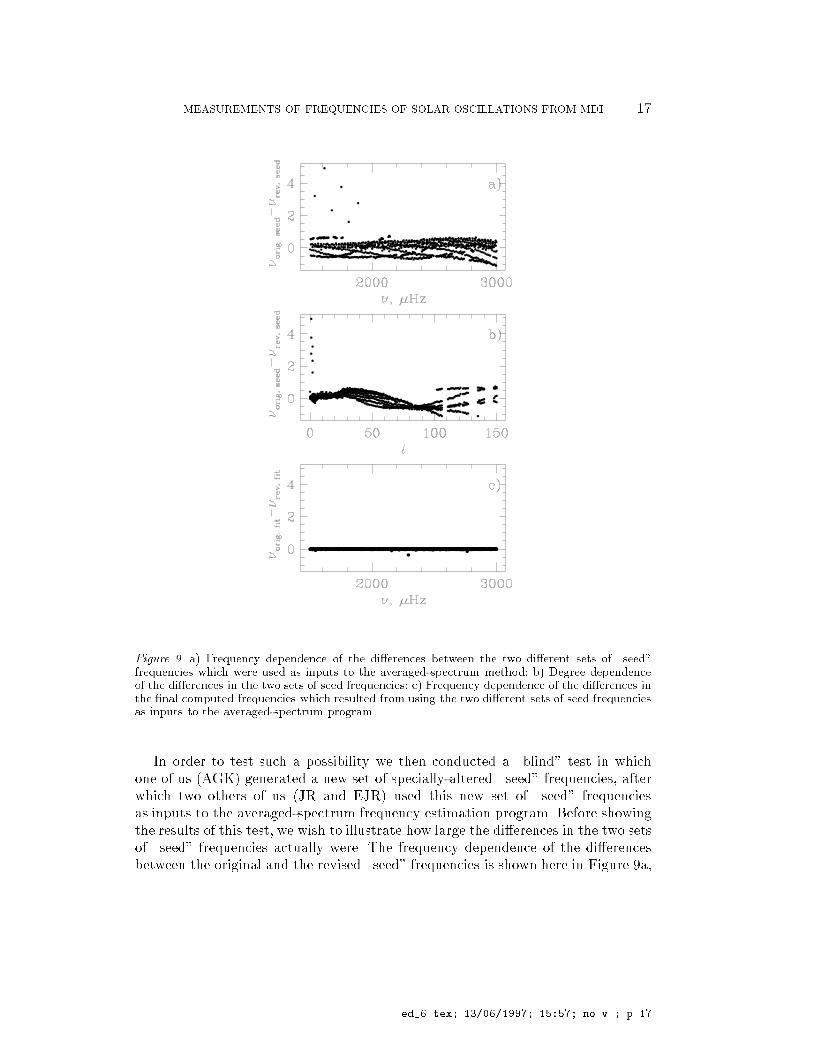
Figure �� a Frequency dependence of the di�erences between the two di�erent sets of �seed�frequencies which were used as inputs to the averaged�spectrum method� b Degree dependenceof the di�erences in the two sets of seed frequencies� c Frequency dependence of the di�erences inthe �nal computed frequencies which resulted from using the two di�erent sets of seed frequenciesas inputs to the averaged�spectrum program�
In order to test such a possibility we then conducted a �blind� test in whichone of us �AGK� generated a new set of specially�altered �seed� frequencies� afterwhich two others of us �JR and EJR� used this new set of �seed� frequenciesas inputs to the averaged�spectrum frequency estimation program� Before showingthe results of this test� we wish to illustrate how large the di�erences in the two setsof �seed� frequencies actually were� The frequency dependence of the di�erencesbetween the original and the revised �seed� frequencies is shown here in Figure �a�
ed���tex� ���������� ��� no v�� p��
�� E�J� RHODES� JR�� ET AL�
while the degree dependence of these same �seed� frequency di�erences is shownin Figure �b� Inspection of Figure �b shows that there was a pronounced degreedependence in the di�erences in the two sets of �seed� frequencies� with a peak�to�peak amplitude of three microhertz between l � �� and l � ����
Once we had computed the additional set of modal parameter estimates� wecompared them with the parameters obtained from the original set of �seed� fre�quencies� For the frequency estimates of the modes we simply matched up commonmodes in our two tables and then subtracted the two estimates� The results of thiscomparison are shown here in Figure �c� Figure �c shows the frequency depen�dence of the di�erences in the two sets of frequency estimates� A quick glanceat this gure shows that� with the exception of a very small number of modesfor which the frequency di�erences ranged between ����� and ���� microhertz� allof the remaining frequency di�erences were less than � �� nanohertz� Such tinyfrequency di�erences will have no measurable e�ects on the sound speed proleswhich will be shown in the next section�
�� Inversion Results
���� Radial Stratification from Mean�multiplet Frequencies
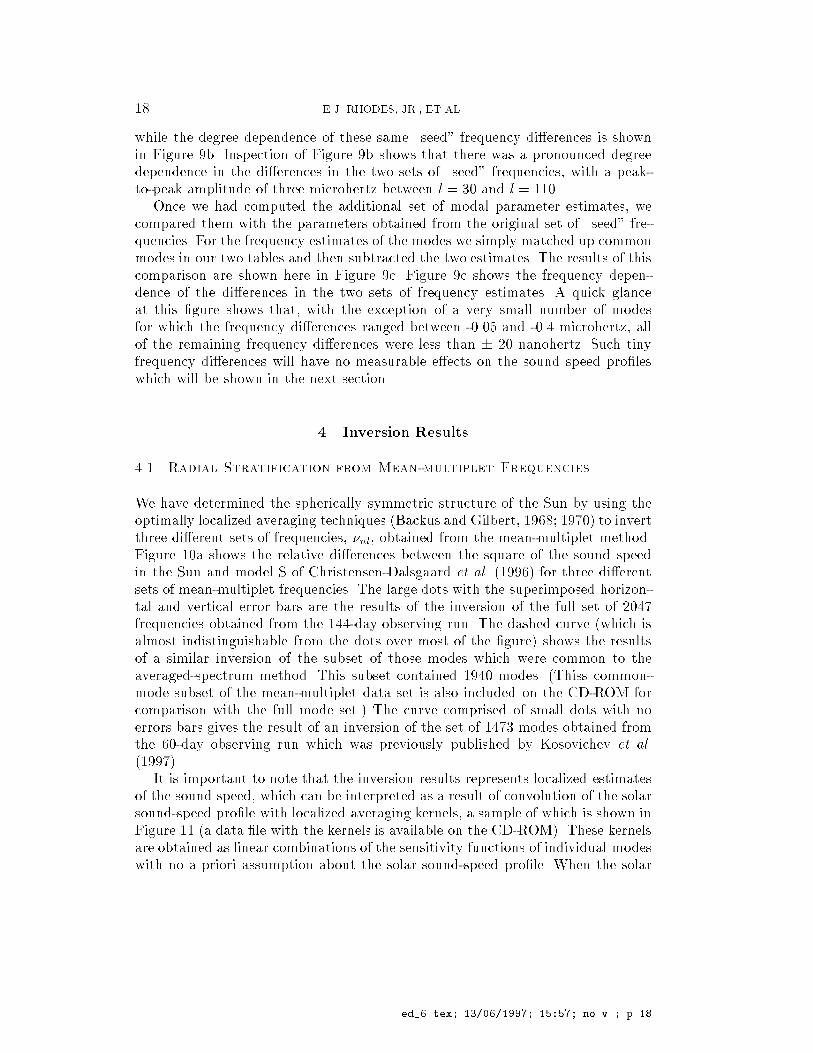
We have determined the spherically symmetric structure of the Sun by using theoptimally localized averaging techniques �Backus and Gilbert� ����� ���� to invertthree di�erent sets of frequencies� �nl� obtained from the mean�multiplet method�Figure ��a shows the relative di�erences between the square of the sound speedin the Sun and model S of Christensen�Dalsgaard et al� ������ for three di�erentsets of mean�multiplet frequencies� The large dots with the superimposed horizon�tal and vertical error bars are the results of the inversion of the full set of ���frequencies obtained from the ����day observing run� The dashed curve �which isalmost indistinguishable from the dots over most of the gure� shows the resultsof a similar inversion of the subset of those modes which were common to theaveraged�spectrum method� This subset contained ���� modes� �Thiss common�mode subset of the mean�multiplet data set is also included on the CD�ROM forcomparison with the full mode set�� The curve comprised of small dots with noerrors bars gives the result of an inversion of the set of ��� modes obtained fromthe ���day observing run which was previously published by Kosovichev et al�
������It is important to note that the inversion results represents localized estimates
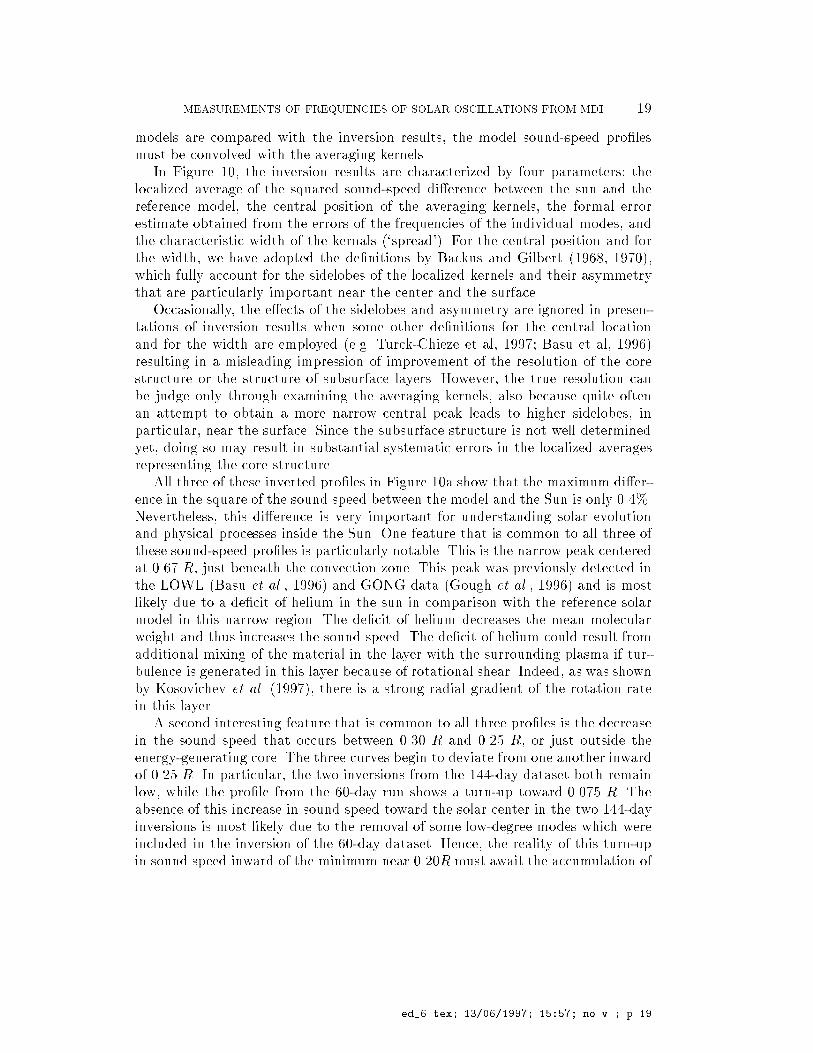
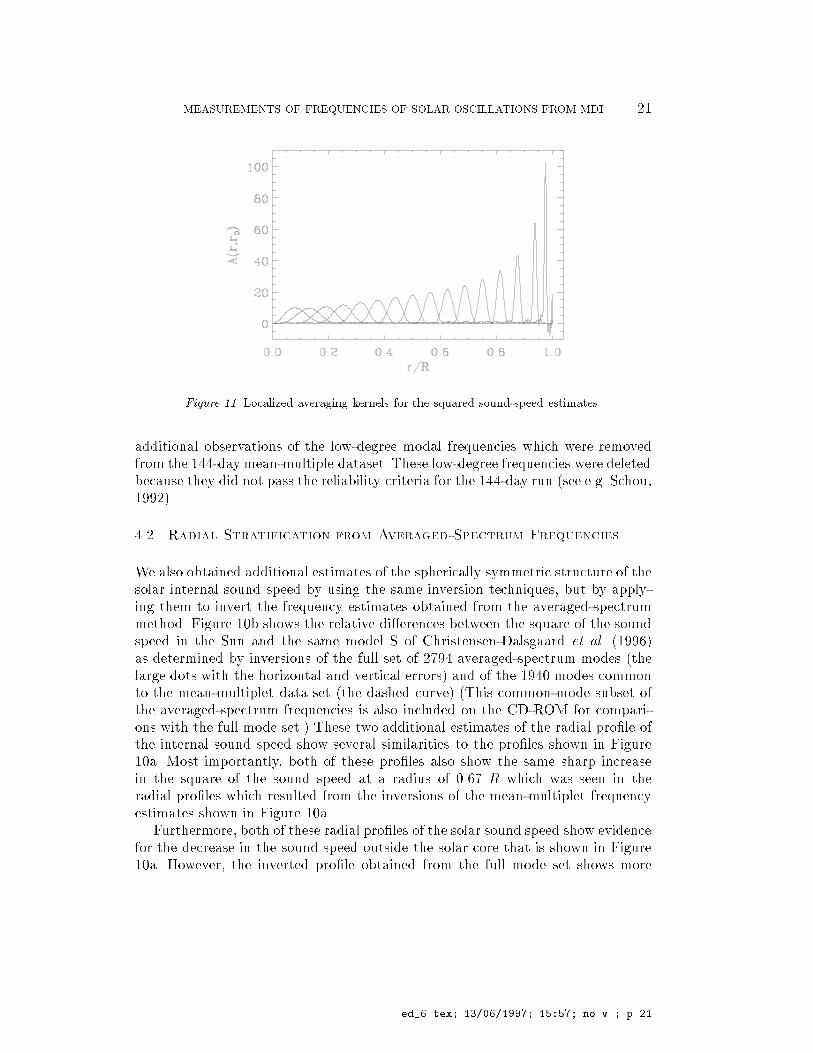
of the sound speed� which can be interpreted as a result of convolution of the solarsound�speed prole with localized averaging kernels� a sample of which is shown inFigure �� �a data le with the kernels is available on the CD�ROM�� These kernelsare obtained as linear combinations of the sensitivity functions of individual modeswith no a priori assumption about the solar sound�speed prole� When the solar
ed���tex� ���������� ��� no v�� p���
MEASUREMENTS OF FREQUENCIES OF SOLAR OSCILLATIONS FROM MDI ��
models are compared with the inversion results� the model sound�speed prolesmust be convolved with the averaging kernels�
In Figure ��� the inversion results are characterized by four parameters� thelocalized average of the squared sound�speed di�erence between the sun and thereference model� the central position of the averaging kernels� the formal errorestimate obtained from the errors of the frequencies of the individual modes� andthe characteristic width of the kernals ��spread��� For the central position and forthe width� we have adopted the denitions by Backus and Gilbert ������ �����which fully account for the sidelobes of the localized kernels and their asymmetrythat are particularly important near the center and the surface�
Occasionally� the e�ects of the sidelobes and asymmetry are ignored in presen�tations of inversion results when some other denitions for the central locationand for the width are employed �e�g� Turck�Chieze et al� ���� Basu et al� �����resulting in a misleading impression of improvement of the resolution of the corestructure or the structure of subsurface layers� However� the true resolution canbe judge only through examining the averaging kernels� also because quite oftenan attempt to obtain a more narrow central peak leads to higher sidelobes� inparticular� near the surface� Since the subsurface structure is not well determinedyet� doing so may result in substantial systematic errors in the localized averagesrepresenting the core structure�
All three of these inverted proles in Figure ��a show that the maximum di�er�ence in the square of the sound speed between the model and the Sun is only �����Nevertheless� this di�erence is very important for understanding solar evolutionand physical processes inside the Sun� One feature that is common to all three ofthese sound�speed proles is particularly notable� This is the narrow peak centeredat ��� R� just beneath the convection zone� This peak was previously detected inthe LOWL �Basu et al�� ����� and GONG data �Gough et al�� ����� and is mostlikely due to a decit of helium in the sun in comparison with the reference solarmodel in this narrow region� The decit of helium decreases the mean molecularweight and thus increases the sound speed� The decit of helium could result fromadditional mixing of the material in the layer with the surrounding plasma if tur�bulence is generated in this layer because of rotational shear� Indeed� as was shownby Kosovichev et al� ������ there is a strong radial gradient of the rotation ratein this layer�
A second interesting feature that is common to all three proles is the decreasein the sound speed that occurs between ���� R and ���� R� or just outside theenergy�generating core� The three curves begin to deviate from one another inwardof ���� R� In particular� the two inversions from the ����day dataset both remainlow� while the prole from the ���day run shows a turn�up toward ���� R� Theabsence of this increase in sound speed toward the solar center in the two ����dayinversions is most likely due to the removal of some low�degree modes which wereincluded in the inversion of the ���day dataset� Hence� the reality of this turn�upin sound speed inward of the minimum near ����Rmust await the accumulation of
ed���tex� ���������� ��� no v�� p���
�� E�J� RHODES� JR�� ET AL�
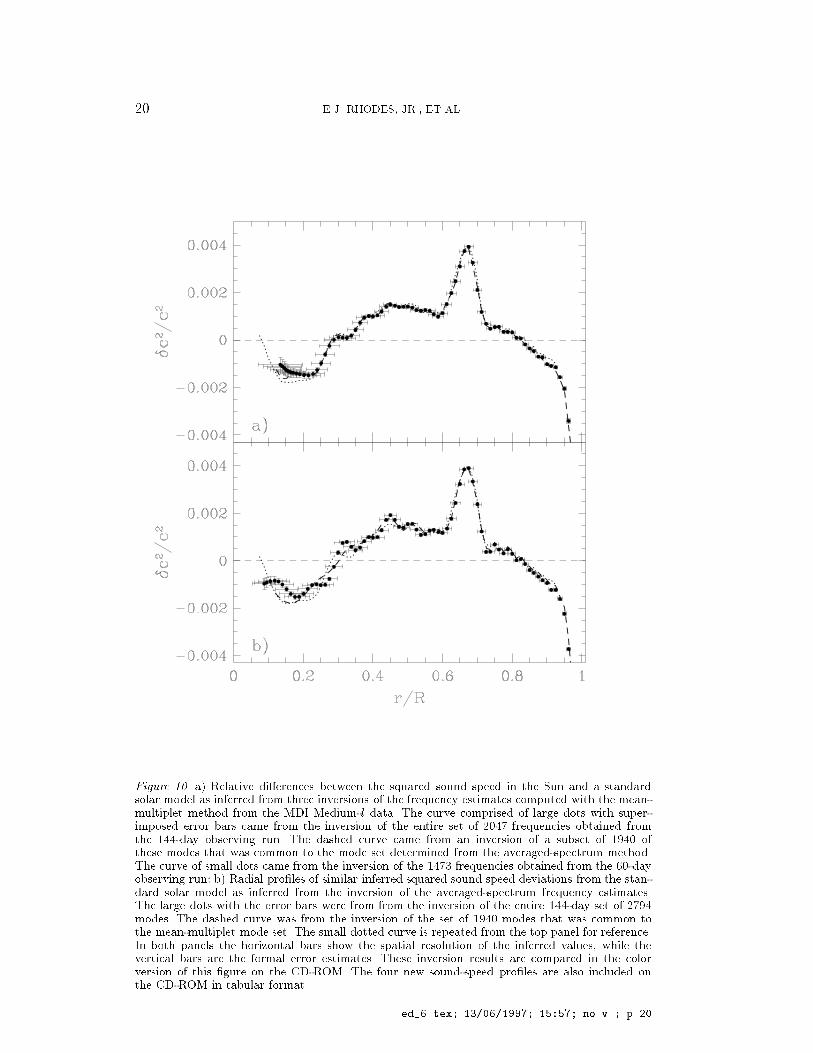
Figure ��� a Relative di�erences between the squared sound speed in the Sun and a standardsolar model as inferred from three inversions of the frequency estimates computed with the mean�multiplet method from the MDI Medium�l data� The curve comprised of large dots with super�imposed error bars came from the inversion of the entire set of �� frequencies obtained fromthe ��day observing run� The dashed curve came from an inversion of a subset of ��� ofthese modes that was common to the mode set determined from the averaged�spectrum method�The curve of small dots came from the inversion of the ��� frequencies obtained from the ���dayobserving run� b Radial pro�les of similar inferred squared sound speed deviations from the stan�dard solar model as inferred from the inversion of the averaged�spectrum frequency estimates�The large dots with the error bars were from from the inversion of the entire ��day set of ��modes� The dashed curve was from the inversion of the set of ��� modes that was common tothe mean�multiplet mode set� The small dotted curve is repeated from the top panel for reference�In both panels the horizontal bars show the spatial resolution of the inferred values� while thevertical bars are the formal error estimates� These inversion results are compared in the colorversion of this �gure on the CD�ROM� The four new sound�speed pro�les are also included onthe CD�ROM in tabular format�
ed���tex� ���������� ��� no v�� p���
MEASUREMENTS OF FREQUENCIES OF SOLAR OSCILLATIONS FROM MDI ��
Figure ��� Localized averaging kernels for the squared sound�speed estimates�
additional observations of the low�degree modal frequencies which were removedfrom the ����day mean�multiple dataset� These low�degree frequencies were deletedbecause they did not pass the reliability criteria for the ����day run �see e�g� Schou�������
���� Radial Stratification from Averaged�Spectrum Frequencies
We also obtained additional estimates of the spherically symmetric structure of thesolar internal sound speed by using the same inversion techniques� but by apply�ing them to invert the frequency estimates obtained from the averaged�spectrummethod� Figure ��b shows the relative di�erences between the square of the soundspeed in the Sun and the same model S of Christensen�Dalsgaard et al� ������as determined by inversions of the full set of ��� averaged�spectrum modes �thelarge dots with the horizontal and vertical errors� and of the ���� modes commonto the mean�multiplet data set �the dashed curve���This common�mode subset ofthe averaged�spectrum frequencies is also included on the CD�ROM for compari�ons with the full mode set�� These two additional estimates of the radial prole ofthe internal sound speed show several similarities to the proles shown in Figure��a� Most importantly� both of these proles also show the same sharp increasein the square of the sound speed at a radius of ��� R which was seen in theradial proles which resulted from the inversions of the mean�multiplet frequencyestimates shown in Figure ��a�
Furthermore� both of these radial proles of the solar sound speed show evidencefor the decrease in the sound speed outside the solar core that is shown in Figure��a� However� the inverted prole obtained from the full mode set shows more
ed���tex� ���������� ��� no v�� p���
�� E�J� RHODES� JR�� ET AL�
radial variation in this region than does the prole obtained from the commonmode set� Any verication of this extra variation will have to await the acquisitionand analysis of additional observations� Also� both averaged�spectrum proles showthat the sound speed reaches a similar minimum value to that found in the mean�multiplet proles inside of ���� R�
Finally� both of the averaged�spectrum proles show some evidence for the turn�up toward the center that is seen in the Kosovichev et al� ����� ���day inversion�However� this turn�up is less prominent in the new inversions� Since the inversionresults near the center depend only on a few low�degree modes �e�g� Gough� Koso�vichev� and Toutain� ����� that are particularly di�cult to measure� the turn�upmust be viewed with caution until we obtain more precise measurements of thelow�degree mode frequencies�
�� Conclusions
The results of the di�erent numerical tests which we have reported above suggestthat we must continue to work diligently in order to learn whether or not thesystematic di�erences in the frequency estimates which we have found are in factdue to the e�ects of the asymmetry of the observational peaks or whether they aredue to another� as yet undetermined� cause� In particular� we must do so before wewill be able to have condence in the entire radial range of the sound speed prolewhich we have obtained from our current inversion computations� The potentialimportance of every deviation of the solar sound speed prole from that in ourstandard reference solar models is so great that we must continue our attempts atnding and learning about all possible sources of systematic errors in the inputdatasets which will be used as inputs to future inversion investigations� We mustalso put great e�ort into determining the validity of the low�frequency and low�degree modal ts which have a large in uence on the sound speed in the solarcore�
On the other hand� we have also demonstrated that we can anticipate thatthe formal frequency uncertainties which are employed as additional inputs to theinversion programs will continue to decrease as additional days of observationsare included in the time series from which the observational power spectra arecomputed� This decrease in frequency uncertainties will increase our condencein the inverted proles once we have been able to eliminate the systematic errorswhich still exist�
We have also demonstrated that one of the more interesting features in theradial prole of the solar internal sound speed which has been found in the pastfew years from both GONG and MDI data� namely the rather narrow peak inthe deviation of the sound speed from that of the current reference solar modelbeneath the convection zone� is not due to either any peculiarity in the choice ofthe seed frequencies which were employed in the determination of the frequencies
ed���tex� ���������� ��� no v�� p���
MEASUREMENTS OF FREQUENCIES OF SOLAR OSCILLATIONS FROM MDI ��
which went into those inversions nor is it due to the particular method of frequencyestimation that is employed�
Finally� all ve of the inversions we have presented here also show evidence for asimilar minimum value in the sound speed relative to the standard solar model inthe solar core� The question of whether the sound speed remains low throughoutthe core or whether it once again increases toward the very center of the sun is amatter that must await the acquisition additional observations to be resolved�
Acknowledgments
The authors acknowledge many years of e�ort by the engineering and supportsta� of the MDI development team at the Lockheed Palo Alto Research Labo�ratory �now Lockheed�Martin� and the SOI development team at Stanford Uni�versity� SOHO is a project of international cooperation between ESA and NASA�This research is supported by the SOI�MDI NASA contract NAG���� at Stan�ford University� The portion of this research which was conducted at USC and atthe Technical University of Munich was supported by Stanford University Sub�Contract Number PR ���� to USC and by NASA Grant NAGW��� to USC� Por�tions of the computations for this research were carried out using the facilities ofUSC�s Campus Computing Center� J�R� is grateful to R� Bulirsch for his generoussupport and hospitality�
References
Abrams� D�� and Kumar� P�� ����� Astrophys� J�� ���� �� �Backus� G� and Gilbert� F� ����� Geophys� J� R� astr� Soc�� ��� ����Backus� G� and Gilbert� F� ����� Phil� Trans� R� Soc�� A���� � ��Bahcall� J�N�� and Pinsonneault� M�H�� ����� Rev� Mod� Phys�� ��� ����Basu� S�� Christensen�Dalsgaard� J�� Schou� J�� Thompson� M�J�� and Tomczyk� S�� ����� Bull�
Astr� Soc� India� ��� ���Brown� T�� private communication� �����Christensen�Dalsgaard� J�� D�appen� W�� and the GONG Team� ����� Science� ���� � ���Duvall� T�L�� Harvey� J�W�� and Pomerantz� M�A�� ����� Nature� ���� ����Duvall� T�L�� Jr�� Je�eries� S�M�� Harvey� J�W�� Osaki� Y�� and Pomerantz� M�A�� ����� Astrophys�
J�� ���� � ��Gabriel� M�� ��� � Astron� Astrophys�� ���� ����Gabriel� M�� ����� Astron� Astrophys�� ���� ����Gabriel� M�� ����� Astron� Astrophys�� �� ��Gough� D�O�� ����� in J�P� Zahn and J� Zinn�Justin �eds� Astrophysical Fluid Dynamics� Elsevier�
Amsterdam� p� ����Gough� D�O�� Kosovichev� A�G�� and Toutain� T�� ����� Solar Phys�� ���� ��Gough� D�O�� Kosovichev� A�G�� and the GONG Team� ����� Science� ���� � ���Hill� F�� Stark� P�B�� Stebbins� R�T�� and the GONG Team� ����� Science� ���� � � �Korzennik� S�G�� ����� Ph�D� Dissertation� Univ� Calif� Los Angeles�Kosovichev�A�G��Schou� J�� Scherrer� P�H�� Bogart� R�S�� Bush� R�I�� Hoeksema� J�T�� Aloise�
J�� Bacon� L�� Burnette� A�� De Forest� C�� Giles� P�M�� Nigam� R�� Rubin� R�� Basu� S��
ed���tex� ���������� ��� no v�� p���
�� E�J� RHODES� JR�� ET AL�
Christensen�Dalsgaard� J�� Dappen� W�� Rhodes� E�J�� Jr�� Duvall� T�L�� Jr�� Howe� R�� Thomp�son� M�J�� Gough� D�O�� Sekii� T�� Toomre� J�� Tarbell� T�D�� Title� A�M�� Mathur� D�� Morri�son� M�� Wolfson� C�J�� and Zayer� I������� Solar Phys�� in press�
Kumar� P�� Fardal� M�A�� Je�eries� S�M�� Duvall� T�L�� Jr�� Harvey� J�W�� and Pomerantz� M�A������ Astrophys� J�� ���� L ��
Nigam� R�� and Kosovichev� A�G�� ����� in J� Provost and F�X� Schmider �eds� Sounding Solarand Stellar Interiors� Proc� IAU Symp� ���� Nice� France� �� Sept�� � Oct�� ����� Kluwer Acad�Publ�� in press�
Reiter� J� and Rhodes� E�J��Jr������� SOI Technical Note� in preparation�Ritzwoller� M�H� and Lavely� E�M�� ����� Astrophys� J�� ��� ����Rogers� F�J�� and Iglesias� C�A�� ����� Astrophys� J�� ���� �� �Roxbourgh� I�W�� and Vorontsov� S�V�� ����� Monthly Notices Roy� Astron� Soc�� ���� ����Scherrer� P�H�� Bogart� R�S�� Bush� R�I�� Hoeksema� J�T�� Kosovichev� A�G�� Schou� J�� Rosenberg�
W�� Springer� L�� Tarbell� T�D�� Title� A�� Wolfson� C�J�� Zayer� I�� and the MDI EngineeringTeam� ����� Solar Phys�� ���� � ��
Schou� J�� ��� � On the Analysis of Helioseismic Data� Thesis� Aarhus University �Turck�Chieze� S�� Basu� S�� Brun� S�� Christensen�Dalsgaard� J�� E��Darwich� A�� Lopes� I�� Perez
Hernandes� F�� Berthomieu� G�� Provost� J�� Ulrich� R�K�� Baudin� F�� Boumier� P�� Charra�J�� Gabrial� A�H�� Garcia� R�A�� Grec� G�� Renaud� C�� Robillot� J�M�� and Roca Cortes� T������� Solar Phys�� submitted
ed���tex� ���������� ��� no v�� p��