Embed Size (px)
Citation preview

LUND UNIVERSITY
PO Box 117221 00 Lund+46 46-222 00 00
Measurements of 3D slip velocities and plasma column lengths of a gliding arcdischarge
Zhu, Jiajian; Gao, Jinlong; Ehn, Andreas; Aldén, Marcus; Li, Zhongshan; Moseev, Dmitry;Kusano, Yukihiro; Salewski, Mirko; Alpers, Andreas; Gritzmann, Peter; Schwenk, MartinPublished in:Applied Physics Letters
DOI:10.1063/1.4906928
Published: 2015-01-01
Link to publication
Citation for published version (APA):Zhu, J., Gao, J., Ehn, A., Aldén, M., Li, Z., Moseev, D., ... Schwenk, M. (2015). Measurements of 3D slipvelocities and plasma column lengths of a gliding arc discharge. Applied Physics Letters, 106(4), 044101. DOI:10.1063/1.4906928
General rightsCopyright and moral rights for the publications made accessible in the public portal are retained by the authorsand/or other copyright owners and it is a condition of accessing publications that users recognise and abide by thelegal requirements associated with these rights.
• Users may download and print one copy of any publication from the public portal for the purpose of privatestudy or research. • You may not further distribute the material or use it for any profit-making activity or commercial gain • You may freely distribute the URL identifying the publication in the public portal

Take down policyIf you believe that this document breaches copyright please contact us providing details, and we will removeaccess to the work immediately and investigate your claim.
Download date: 30. Aug. 2018
Measurements of 3D slip velocities and plasma column lengths of a gliding arcdischargeJiajian Zhu, Jinlong Gao, Andreas Ehn, Marcus Aldén, Zhongshan Li, Dmitry Moseev, Yukihiro Kusano, MirkoSalewski, Andreas Alpers, Peter Gritzmann, and Martin Schwenk Citation: Applied Physics Letters 106, 044101 (2015); doi: 10.1063/1.4906928 View online: http://dx.doi.org/10.1063/1.4906928 View Table of Contents: http://scitation.aip.org/content/aip/journal/apl/106/4?ver=pdfcov Published by the AIP Publishing Articles you may be interested in Sustained diffusive alternating current gliding arc discharge in atmospheric pressure air Appl. Phys. Lett. 105, 234102 (2014); 10.1063/1.4903781 Temporal evolution characteristics of an annular-mode gliding arc discharge in a vortex flow Phys. Plasmas 21, 053507 (2014); 10.1063/1.4876754 Dynamic contraction of the positive column of a self-sustained glow discharge in air flow Phys. Plasmas 21, 032122 (2014); 10.1063/1.4869332 Physical characteristics of gliding arc discharge plasma generated in a laval nozzle Phys. Plasmas 19, 072122 (2012); 10.1063/1.4739231 New technique deducing plasma potential by a capacitive coupling method in spraying dielectric barrierdischarge plasmas Rev. Sci. Instrum. 76, 013503 (2005); 10.1063/1.1832172
This article is copyrighted as indicated in the article. Reuse of AIP content is subject to the terms at: http://scitation.aip.org/termsconditions. Downloaded to IP:
130.235.184.47 On: Mon, 02 Feb 2015 08:24:20

Measurements of 3D slip velocities and plasma column lengths of a glidingarc discharge
Jiajian Zhu,1,a) Jinlong Gao,1,a) Andreas Ehn,1,a) Marcus Ald�en,1,a) Zhongshan Li,1,a),b)
Dmitry Moseev,2,3,a) Yukihiro Kusano,4,a) Mirko Salewski,5,a) Andreas Alpers,6,b),c)
Peter Gritzmann,6,c) and Martin Schwenk6,c)
1Division of Combustion Physics, Lund University, P.O. Box 118, S-221 00 Lund, Sweden2Max-Planck-Institut f€ur Plasmaphysik, D-85748 Garching bei M€unchen, Germany3FOM Institute DIFFER, 3430 BE Nieuwegein, Netherlands4Department of Wind Energy, Section for Composites and Materials Mechanics, Technical University ofDenmark, Risø Campus, Frederiksborgvej 399, DK-4000 Roskilde, Denmark5Department of Physics, Section for Plasma Physics and Fusion Energy, Technical University of Denmark,DK-2800 Kongens Lyngby, Denmark6Zentrum Mathematik, Technische Universit€at M€unchen, D-85747 Garching bei M€unchen, Germany
(Received 23 November 2014; accepted 18 January 2015; published online 28 January 2015)
A non-thermal gliding arc discharge was generated at atmospheric pressure in an air flow. The
dynamics of the plasma column and tracer particles were recorded using two synchronized high-
speed cameras. Whereas the data analysis for such systems has previously been performed in 2D
(analyzing the single camera image), we provide here a 3D data analysis that includes 3D recon-
structions of the plasma column and 3D particle tracking velocimetry based on discrete tomography
methods. The 3D analysis, in particular, the determination of the 3D slip velocity between the
plasma column and the gas flow, gives more realistic insight into the convection cooling process.
Additionally, with the determination of the 3D slip velocity and the 3D length of the plasma column,
we give more accurate estimates for the drag force, the electric field strength, the power per unit
length, and the radius of the conducting zone of the plasma column. VC 2015 AIP Publishing LLC.
[http://dx.doi.org/10.1063/1.4906928]
Much attention has recently been paid to generate and
diagnose low-temperature plasmas at atmospheric pres-
sure.1–4 A gliding arc discharge is a typical low-temperature
plasma source. The string-like plasma column of the gliding
arc discharge is extended by a gas flow in three-dimensional
(3D) space.5,6 Such gliding arc discharges have been widely
applied to pollution control,7–11 surface treatment,1,12 sterili-
zation,13 and combustion enhancement.14 Extensive studies
have been performed on the dynamics,15–18 physical charac-
teristics,19–28 and chemical mechanisms29–31 involved in
gliding arc discharges. Phenomenological models21,32–34
were developed to explain the discharge behavior based on
accurate measurements of several important parameters,
including the slip velocity ~VS (it stands for the relative ve-
locity between the plasma column ~VC and the gas flow ~VF ,
and its magnitude is j~VS j ¼ j~VC � ~VF j), and the length of the
plasma column. The slip velocity determines not only the
convection cooling efficiency33 and the drag force14,35 but
also the electric field strength, the power per unit length, and
the radius of the conducting zone of the plasma column.33
The length of the plasma column is used for calculating the
electric field strength.6,32 Therefore, accurate measurements
of the slip velocity and the length of the plasma column are
essential to provide a better understanding of the gliding arc
discharge.
In previous studies, measurements of the slip velocity
and the length of the plasma column were performed in 2D,
i.e., by analyzing a single 2D camera image.21,33 The main
limitation of this method is the lack of information about the
3D nature of the gliding arc discharge and the turbulent flow.
In the present work, two high-speed cameras were synchron-
ized to record images of the gliding arc in orthogonal imag-
ing planes. Employing a dynamic discrete tomography
approach,36 we reconstructed the instantaneous 3D velocities
of tracer particles illuminated by the plasma column. As the
tracers particles are tiny (�3 lm), they follow the motion of
the gas flow at the present moderated turbulent conditions.
Since the particles are neutral and their concentration is kept
low, their influence on the motion of the alternatively
charged plasma columns can be negligible. Therefore, the
tracers are suitable indicators for the local gas flow velocity.
The plasma column and its velocity were also reconstructed
in 3D. In particular, we determine here the 3D slip velocities
and 3D plasma column lengths for a gliding arc discharge.
A schematic of the experimental setup is shown in
Fig. 1. A gliding arc discharge at atmospheric pressure was
generated between two diverging stainless steel electrodes
using a 35 kHz AC power generator (9030E, SOFTAL
Electronic GmbH, Germany). The peak voltage of the glid-
ing arc discharge mostly varies from 3 to 12 kV.15 The hol-
low electrodes with 3-mm outer diameter were internally
water-cooled. Detailed descriptions of a similar gliding arc
discharge system are available in previous works.12,15–17 A
total air flow of 17.5 Standard Liters per Minute (SLM) con-
trolled by a mass flow controller (MFC) was divided into
a)Physics groupb)Authors to whom correspondence should be addressed. Electronic
addresses: [email protected] and [email protected])Mathematics group, in alphabetic order
0003-6951/2015/106(4)/044101/4/$30.00 VC 2015 AIP Publishing LLC106, 044101-1
APPLIED PHYSICS LETTERS 106, 044101 (2015)
This article is copyrighted as indicated in the article. Reuse of AIP content is subject to the terms at: http://scitation.aip.org/termsconditions. Downloaded to IP:
130.235.184.47 On: Mon, 02 Feb 2015 08:24:20
two channels: one was controlled by an MFC at 16 SLM
while the other ran through a particle seeder filled with TiO2
particles. The air flows from the two channels were com-
bined and sent into a 3-mm diameter hole to form a jet with
exit velocity of 41 m/s; the air jet extended the plasma col-
umn in an upward direction.
The two high-speed cameras (Fastcam SA-X2 and
Fastcam SA5, Photron) with 10-kHz frame rate and 99–ls ex-
posure time were synchronized by a pulse generator (BNC
575) for simultaneously tracking the movement of the plasma
column and the tracer particles, using two Nikon camera lenses
(f¼ 50 mm and 100 mm). The arrangement of the two cameras
and the gliding arc system is shown in Fig. 1, which also pro-
vides the coordinate system with the center of the jet nozzle
representing the coordinate origin. Fig. 2 shows a typical
camera image pair of the gliding arc. The tracer particles
near the plasma column are illuminated by the plasma emis-
sion, and therefore can be simultaneously tracked by the two
high-speed cameras as indicated in Fig. 2.37
For the 3D reconstruction of particle positions, we fol-
lowed the recently introduced dynamic discrete tomography
paradigm.36 In this approach, the reconstruction task is for-
mulated as a discrete optimization problem, which allows, in
particular, for a detection of the time steps, for which the
particle positions are uniquely determined by the data. The
reported particle positions in this letter are mainly based on
these time steps.
Prior to the reconstruction, we aligned the camera
images and derived the viewing directions based on a set of
calibration images. The camera pixel coordinates of the
particles were obtained by iteratively/repeatedly applying a
Gaussian blur filter followed by threshold filtering, which
removed the plasma column data and resulted in single-pixel
sized particles. For the reconstruction of the plasma
column, we adapted an approach based on the deformation
of the so-called snake model; for a similar approach, see
Cai et al.38
For validation purposes, we compared the projections of
the reconstructions with the experimental data. From this, we
concluded that for the present data, an average uncertainty of
0.13 mm can be achieved.
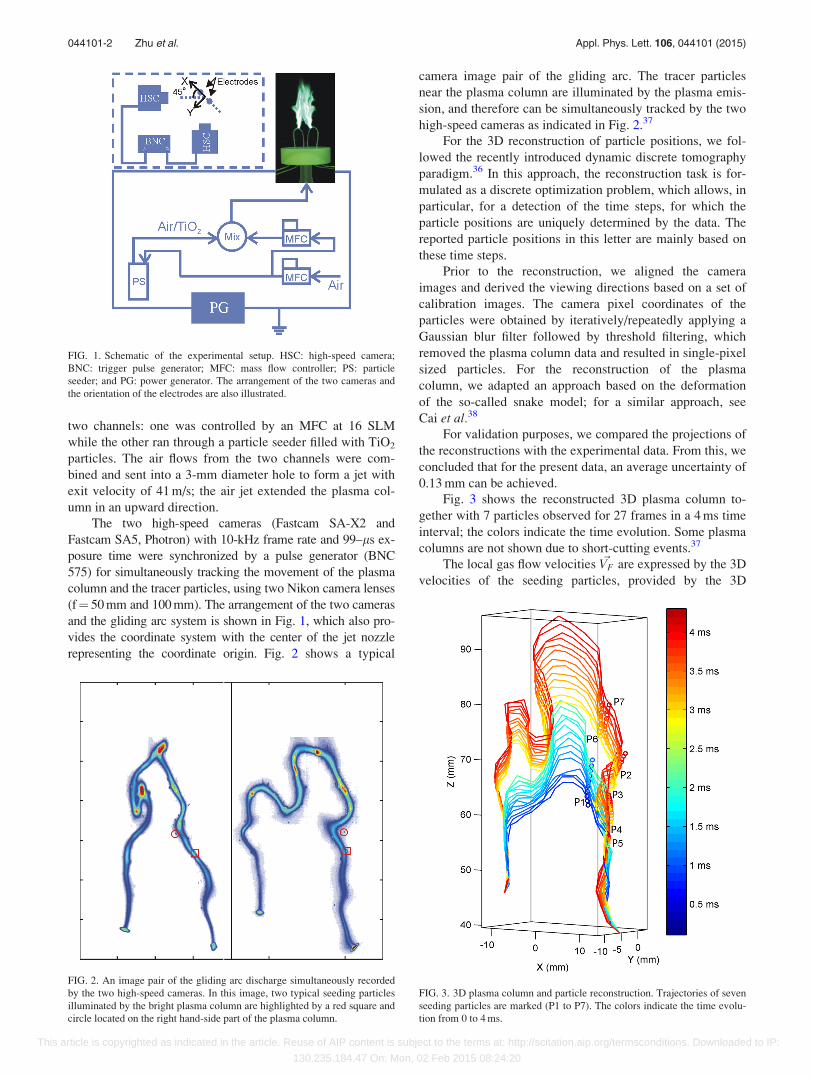
Fig. 3 shows the reconstructed 3D plasma column to-
gether with 7 particles observed for 27 frames in a 4 ms time
interval; the colors indicate the time evolution. Some plasma
columns are not shown due to short-cutting events.37
The local gas flow velocities ~VF are expressed by the 3D
velocities of the seeding particles, provided by the 3D
FIG. 1. Schematic of the experimental setup. HSC: high-speed camera;
BNC: trigger pulse generator; MFC: mass flow controller; PS: particle
seeder; and PG: power generator. The arrangement of the two cameras and
the orientation of the electrodes are also illustrated.
FIG. 2. An image pair of the gliding arc discharge simultaneously recorded
by the two high-speed cameras. In this image, two typical seeding particles
illuminated by the bright plasma column are highlighted by a red square and
circle located on the right hand-side part of the plasma column.
FIG. 3. 3D plasma column and particle reconstruction. Trajectories of seven
seeding particles are marked (P1 to P7). The colors indicate the time evolu-
tion from 0 to 4 ms.
044101-2 Zhu et al. Appl. Phys. Lett. 106, 044101 (2015)
This article is copyrighted as indicated in the article. Reuse of AIP content is subject to the terms at: http://scitation.aip.org/termsconditions. Downloaded to IP:
130.235.184.47 On: Mon, 02 Feb 2015 08:24:20

reconstruction of the particles. The determination of the 3D
plasma column velocity ~VC poses an additional challenge.21
Here, the following strategy is adopted to determine the
plasma column velocity:
(1) Each reconstructed plasma column is discretized by
using 1500 equidistant nodes placed between the column
endpoints.
(2) For each particle Pk in frame n, we determine the closest
point Qk on the discretized plasma column.
(3) For each Qk, we determine the closest point Rk on the
discretized plasma column in frame nþ 1.
(4) We determine the local plasma column velocity in frame
n for particle Pk as ~VC ¼ (Rk–Qk)/Dt, where Rk–Qk
denotes the distance between the two points and
Dt¼ 0.1 ms denotes the time step between successive
frames.
Figs. 4(a) and 4(b) show XZ and YZ components of the
velocities of the seeding particles and plasma columns, indi-
cating the horizontal (X-axis), lateral (Y-axis), and vertical
(Z-axis) motion of the particles and the plasma columns. The
thicker arrows represent the velocities of the particles while
the thinner ones indicate the velocity of the plasma column
with both the colors and the arrow length indicating the speed.
Fig. 4(c) shows the magnitude of the slip velocity, ~VS
(j~VS j ¼ j ~VC � ~VF j), between the plasma column and the gas
flow. This magnitude was 2–8 m/s with an average of
4.5 m/s. The largest values were observed for Particles P6
and P7; the smallest value was observed for P5. It is gener-
ally believed that a larger magnitude of the slip velocity
introduces a more efficient convection cooling.33 In other
words, here the convection cooling near P6 and P7 was more
efficient than that near P5. This is reasonable since P6 and
P7 were closer to the jet axis while P5 was located near the
anchor point of the gliding arc. Previous results from 2D
measurements showed that the speed difference was
1–10 m/s for a similar gliding arc discharge system (about 50
SLM flow rate and 2-mm diameter jet).21,33 Note that in
some measurement points, the plasma column speed was
larger than the flow speed, which is not observed in previous
results.21,33
Figs. 4(d) and 4(e) show the absolute difference between
the slip speed obtained by 3D and 2D methods. For 3D
method, all the motions in X, Y, Z directions are taken into
consideration while 2D method just analyzes the motions in
X, Z directions or Y, Z directions. The figures indicate that
in some cases the slip speed can be underestimated by about
80% with the 2D method. This suggests that 3D visualization
of the plasma column and the gas flow is essential to accu-
rately determine the magnitude of the slip velocity.
The slip velocity enables the calculation of several pa-
rameters of the gliding arc discharge. The drag force F on
the plasma column exerted by the turbulent flow is often
modelled in the form14,35
F ¼ 1
2CDAqV2
S ; (1)
where CD is the drag coefficient, A the reference area, q the
gas density, and VS the magnitude of slip velocity. With the
determination of drag force, the equilibrium velocity of the
gliding arc discharge in hyper-gravity,35 and the magnetic
field strength of magnetically stabilized gliding arc discharge
under steady state14 can be calculated. This shows that
knowledge of the 3D slip velocity is essential for predicting
accurate parameters of the gliding arc discharge.
Furthermore, with the determination of the slip velocity,
the electric field strength E, the power per unit length x, and
the radius of the plasma column conducting zone r can be
calculated using the heat string model.33 The model was
developed for gliding arc discharges in atmospheric air. It
was found from this model that E and x are proportional to
V0:48S while r is proportional to V�0:48
S . Here, VS is the magni-
tude of the slip velocity. An underestimate of the slip speed
by 80% introduced by 2D methods at the worst case can
result in a 46% underestimate of E and x, and an overesti-
mate of r by a factor 2.
FIG. 4. Particle and plasma column velocity components in the (a) XZ and
(b) YZ plane; (c) slip speed j~VS j; (d) and (e) absolute difference between
the slip speed obtained by the 3D and the 2D method (the 2D method is
performed for the (d) XZ and (e) YZ components). Relative differences
(given in %) are inserted as insets. Particles P1-P7 are labeled in (a), (b),
and (c).
044101-3 Zhu et al. Appl. Phys. Lett. 106, 044101 (2015)
This article is copyrighted as indicated in the article. Reuse of AIP content is subject to the terms at: http://scitation.aip.org/termsconditions. Downloaded to IP:
130.235.184.47 On: Mon, 02 Feb 2015 08:24:20

Fig. 5 shows the length of the plasma column obtained
from the 3D reconstruction and, respectively, from the 2D
projections (measured on the two cameras C1 and C2,
respectively). The plasma column estimated from the 3D
reconstruction can be up to 25% longer than the correspond-
ing 2D counterpart. This indicates that the traditional meth-
ods based on single 2D projections may overestimate the
electrical field strength by about 25%. We remark that the
short-cutting events are not included in the data processing,
which cause the missing data points in Fig. 5.
In conclusion, 3D particle tracking velocimetry (PTV)
and 3D reconstructions of the plasma column of a gliding arc
discharge were performed, providing 3D measurements of
the gas flow motion and the column movement. This 3D
technique, in comparison to 2D methods, allowed a more
accurate 3D determination of the slip velocity and the length
of the plasma column. The magnitude of the 3D slip velocity
is 2–8 m/s, while 2D methods may underestimate by up to
80%. The 3D length of the plasma column can likewise be
25% larger than the 2D length. Moreover, the 3D measure-
ments of the slip velocity and the length of the plasma col-
umn yield more accurate estimates of the drag force, the
electrical field strength, the power per unit length and the ra-
dius of the plasma column conducting zone, and provide a
better understanding for the convection cooling.
The work at Lund was financially supported by the
Swedish Energy Agency, the Knut and Alice Wallenberg
Foundation, Swedish Research Council and the European
Research Council. J. Zhu and J. Gao thank the Chinese
Scholarship Council for financial support. A. Alpers, P.
Gritzmann, and M. Schwenk were partly supported by DFG
Grants AL 1431/1-1, GR 993/10-1, and GR 993/10-2. COST
Action MP1207 is acknowledged for networking support.
1Z. B. Feng, N. Saeki, T. Kuroki, M. Tahara, and M. Okubo, Appl. Phys.
Lett. 101, 041602 (2012).2X. Lu, Z. Xiong, F. Zhao, Y. Xian, Q. Xiong, W. Gong, C. Zou, Z. Jiang,
and Y. Pan, Appl. Phys. Lett. 95, 181501 (2009).
3S. Y. Moon, W. Choe, and B. K. Kang, Appl. Phys. Lett. 84, 188 (2004).4A. Shashurin, M. N. Shneider, A. Dogariu, R. B. Miles, and M. Keidar,
Appl. Phys. Lett. 94, 231504 (2009).5A. Czernichowski, Pure Appl. Chem. 66, 1301 (1994).6A. Fridman, S. Nester, L. A. Kennedy, A. Saveliev, and O. Mutaf-
Yardimci, Prog. Energy Combust. Sci. 25, 211 (1999).7J. H. Yan, C. M. Du, X. D. Li, X. D. Sun, M. J. Ni, K. F. Cen, and B.
Cheron, Plasma Sources Sci. Technol. 14, 637 (2005).8X. Tu and J. C. Whitehead, Int. J. Hydrogen Energy 39, 9658 (2014).9V. Dalaine, J. M. Cormier, S. Pellerin, and P. Lefaucheux, J. Appl. Phys.
84, 1215 (1998).10V. Dalaine, J. M. Cormier, and P. Lefaucheux, J. Appl. Phys. 83, 2435
(1998).11Z. Bo, E. K. Wu, J. H. Yan, Y. Chi, and K. F. Cen, Rev. Sci. Instrum. 84,
016105 (2013).12Y. Kusano, B. F. Sorensen, T. L. Andersen, H. L. Toftegaard, F. Leipold,
M. Salewski, Z. W. Sun, J. J. Zhu, Z. S. Li, and M. Ald�en, J. Phys. D:
Appl. Phys. 46, 135203 (2013).13C. M. Du, J. Wang, L. Zhang, H. X. Li, H. Liu, and Y. Xiong, New J.
Phys. 14, 013010 (2012).14A. Fridman, A. Gutsol, S. Gangoli, Y. G. Ju, and T. Ombrellol, J. Propul.
Power 24, 1216 (2008).15J. Zhu, J. Gao, Z. Li, A. Ehn, M. Ald�en, A. Larsson, and Y. Kusano, Appl.
Phys. Lett. 105, 234102 (2014).16J. Zhu, Z. Sun, Z. Li, A. Ehn, M. Ald�en, M. Salewski, F. Leipold, and Y.
Kusano, J. Phys. D: Appl. Phys. 47, 295203 (2014).17Z. W. Sun, J. J. Zhu, Z. S. Li, M. Ald�en, F. Leipold, M. Salewski, and Y.
Kusano, Opt. Express 21, 6028 (2013).18X. Tu, L. Yu, J. H. Yan, K. F. Cen, and B. G. Cheron, Phys. Plasmas 16,
113506 (2009).19T. L. Zhao, J. L. Liu, X. S. Li, J. B. Liu, Y. H. Song, Y. Xu, and A. M.
Zhu, Phys. Plasmas 21, 053507 (2014).20C. Zhang, T. Shao, P. Yan, and Y. X. Zhou, Plasma Sources Sci. Technol.
23, 035004 (2014).21F. Richard, J. M. Cormier, S. Pellerin, and J. Chapelle, J. Appl. Phys. 79,
2245 (1996).22O. Mutaf-Yardimci, A. V. Saveliev, A. A. Fridman, and L. A. Kennedy,
J. Appl. Phys. 87, 1632 (2000).23S. Y. Lu, X. M. Sun, X. D. Li, J. H. Yan, and C. M. Du, Phys. Plasmas 19,
072122 (2012).24I. V. Kuznetsova, N. Y. Kalashnikov, A. F. Gutsol, A. A. Fridman, and L.
A. Kennedy, J. Appl. Phys. 92, 4231 (2002).25Y. D. Korolev, O. B. Frants, N. V. Landl, A. V. Bolotov, and V. O.
Nekhoroshev, Plasma Sources Sci. Technol. 23, 054016 (2014).26Y. D. Korolev, O. B. Frants, V. G. Geyman, N. V. Landl, and V. S.
Kasyanov, IEEE Trans. Plasma Sci. 39, 3319 (2011).27C. S. Kalra, Y. I. Cho, A. Gutsol, A. Fridman, and T. S. Rufael, Rev. Sci.
Instrum. 76, 025110 (2005).28S. P. Gangoli, A. F. Gutsol, and A. A. Fridman, Plasma Sources Sci.
Technol. 19, 065004 (2010).29R. Burlica, M. J. Kirkpatrick, and B. R. Locke, J. Electrost. 64, 35
(2006).30J. L. Brisset, D. Moussa, A. Doubla, E. Hnatiuc, B. Hnatiuc, G. K. Youbi,
J. M. Herry, M. Naitali, and M. N. Bellon-Fontaine, Ind. Eng. Chem. Res.
47, 5761 (2008).31B. Benstaali, P. Boubert, B. G. Cheron, A. Addou, and J. L. Brisset,
Plasma Chem. Plasma Process. 22, 553 (2002).32S. Pellerin, J. M. Cormier, F. Richard, K. Musiol, and J. Chapelle, J. Phys.
D: Appl. Phys. 32, 891 (1999).33S. Pellerin, F. Richard, J. Chapelle, J. M. Cormier, and K. Musiol, J. Phys.
D: Appl. Phys. 33, 2407 (2000).34Y. Kusano, M. Salewski, F. Leipold, J. Zhu, A. Ehn, Z. Li, and M. Ald�en,
Eur. Phys. J. D 68, 319 (2014).35J. �Sperka, P. Soucek, J. W. A. Loon, A. Dowson, C. Schwarz, J. Krause,
G. Kroesen, and V. Kudrle, Eur. Phys. J. D 67, 261 (2013).36A. Alpers, P. Gritzmann, D. Moseev, and M. Salewski, Comput. Phys.
Commun. 187, 130 (2015).37See supplementary material at http://dx.doi.org/10.1063/1.4906928 for
showing the synchronized images of the plasma column and tracer par-
ticles (video 1.avi) and 3D details of the plasma column (video 2.avi).38Y. Cai, Z. Su, Z. Li, R. Sun, X. Liu, and Y. Zhao, J. Comput. Appl. Math.
236, 631 (2011).
FIG. 5. Length of the plasma column based on the 3D reconstruction and,
respectively, the 2D camera images.
044101-4 Zhu et al. Appl. Phys. Lett. 106, 044101 (2015)
This article is copyrighted as indicated in the article. Reuse of AIP content is subject to the terms at: http://scitation.aip.org/termsconditions. Downloaded to IP:
130.235.184.47 On: Mon, 02 Feb 2015 08:24:20