Embed Size (px)
Citation preview

MTVA Indoor Antenna Measurement Study
Meintel, Sgrignoli, & Wallace 1 01/23/2007
Prepared By:
Mr. Gary Sgrignoli Meintel, Sgrignoli, & Wallace, LLC
1282 Smallwood Drive Suite 372
Waldorf, Maryland 20603 (202) 251-7589
A Report to
The Metropolitan Television Alliance Regarding
Measurements and Assessments Of
Consumer Indoor Antennas for DTV Reception
January 23, 2007
MTVA Indoor Antenna Measurement Study
Meintel, Sgrignoli, & Wallace 2 01/23/2007
INDOOR ANTENNA MEASUREMENTS STUDY REPORT
INTRODUCTION
The Metropolitan Television Alliance (MTVA) has undertaken a project to deploy a Distributed Transmission System (DTS) for Digital Television (DTV) in the New York City metropolitan area. This project will enable MTVA to determine the practicality and feasibility for implementing a large-scale DTS system prior to the February 2009 cessation of analog television transmissions. As part of this project, MTVA desires a study of commonly available indoor antennas utilized by consumers for DTV reception to determine the performance of these antennas. This study will allow MTVA to develop appropriate data and planning factors to be used in coverage and service analysis of the New York DTS system.
MTVA requested a proposal from the firm of Meintel, Sgrignoli, & Wallace (MSW) to provide consulting services for this indoor antenna evaluation project. This project has been broken up into two phases. Phase 1 of the project has generated a separate engineering report (dated January 23, 2007) detailing a survey of the available consumer indoor antennas and the published performance specifications of those antennas to the extent that they were publicly available. Phase 2 of the project, which is described in this document, has generated a report describing performance measurements conducted on a sub-set of the consumer indoor DTV antennas listed in the antenna survey report.
The antenna survey report conducted a survey of available consumer indoor antennas likely to be used for indoor reception in the New York City area. Over one-hundred antennas of various designs from a multitude of manufacturers were uncovered. However, many antennas shared a common design or even a common 3rd-party manufacturer that were then re -branded.
As part of the antenna survey report, performance data was gathered for each antenna model to the extent that the data is published by the manufacturer or available publicly. This data included the following:
a. General Description including approximate size, connector type, and antenna type. b. Gain of the antenna for Low-VHF, High-VHF, and UHF TV channels. c. Available azimuth or elevation patterns for Low-VHF, High-VHF, and UHF TV channels. d. Output Impedance for Low-VHF, High-VHF, and UHF TV channels. e. Output VSWR for Low-VHF, High-VHF, and UHF TV channels. f. Preamplifier Gain, noise figure, and overload (IP3) performance for active antennas.
The antenna survey report also summarized the status of the CEA/EIA 909 “Smart Antenna” standard and the current status of changes to the Smart Antenna Interface that are being proposed, as well as any further observations and status reports of various antenna activities in the Consumer Electronics area.
While there is often very little antenna technical data provided by consumer antenna manufacturers, what little information that is provided is often only “typical” or “expected” performance values and sometimes suspect. Phase 2 of the project involved conducting Anechoic Chamber Measurements on December 19-21, 2006 at the Electronics Research Inc. (ERI) facility in Chandler, Indiana on a sub-set of at least six antennas selected from the survey list developed by MSW and subsequently reviewed and accepted by MTVA . This anechoic chamber is certified and calibrated for use for High-VHF and UHF television channels . No Low-VHF Measurements (which would have required use of their outdoor far-field range) were made at MTVA’s request since these channels do not play a part in their end of transition DTS project plans (as well as the fact that there are currently only 40 stations in the entire country that will be using low-VHF for their DTV channels after the DTV transition is complete). For each indoor receive antenna, measurements on High-VHF Channels 7 and 12 were desired well as on UHF Channels 18, 33, and 65. These five frequencies cover a large portion of the high-VHF and UHF frequency bands, some of these currently being planned for use in the near-term DTS prototype project. Therefore, these channels were utilized in the antenna performance evaluation. On some of the tests (antenna gain measurements), CH 14 (lowest end of UHF band) and CH 51 (end of UHF band after the DTV transition is completed) were added for additional information.
Measured (and calculated) data taken during Phase 2 of this project included the following:
a. Azimuth and elevation patterns data for each of the five test frequencies. b. Antenna gain compared to a reference a dipole for each of the five frequencies. c. Output return loss of each antenna over the entire high-VHF and UHF bands. e. For active antennas , amplifier gain at each of the five test frequencies. f. For active antennas, noise figure at each of the five test frequencies. g. For active antennas, IP3at each of the five test frequencies. h. General observations and comments relative to antenna ease of use, design, and performance.
The data has been analyzed, and the results summarized in this report.
MTVA Indoor Antenna Measurement Study
Meintel, Sgrignoli, & Wallace 3 01/23/2007
Figure 2 RCA ANT585
ANTENNA DESCRIPTIONS The following factors were taken into account in making the antenna selections:
Potential availability for consumer purchase Identification of a range of expected performance from low to high Identification of a range of cost from low to high Different manufacturers Range of antenna size – up to a maximum that consumers would likely deploy indoors Inclusion of amplified and non-amplified antennas Any experience or anecdotal information related to specific antennas
Note that the survey has indicated that for most of the available indoor antennas , there are very little published technical specifications. Table 1 below summarizes 10 antennas that were selected by MSW as possible units desirable for lab testing. Of these 10, six were selected by MTVA as the minimum number for evaluation in the ERI anechoic chamber.
Antenna
Manufacturer Model
# Approx Price
Active / Passive
TV Band Coverage
Special User Adjustments
RCA ANT115 $10 Passive Lo-VHF, Hi-VHF, UHF Rabbit Ears RCA ANT585 $40 Active Lo-VHF, Hi-VHF, UHF Rabbit Ears
Philips Silver Sensor $25 Passive UHF Only None Philips MANT940 $40 Active UHF Only Vertical/Horizontal
Winegard SS1000 Square Shooter $90 Passive Hi-VHF, UHF 15° Tilt for High-VHF Winegard SS2000 Square Shooter $110 Active Hi-VHF, UHF 15° Tilt for High VHF
Terk TV25 $40 Active Lo-VHF, Hi-VHF, UHF Gain setting, local/distant switch Antennas Direct DB2 $50 Passive UHF Only None Winegard or Terk SS3000 Sharpshooter $80 Active Lo-VHF, Hi-VHF, UHF Removable reflector Terrestrial Digital 303F $20 Passive UHF Only None
Table 1 Indoor antenna selection summary
The following paragraphs provide some further background information on the antennas , as provided by the manufacturer. Some of this information came from manufacturer websites while some came directly from the antenna packaging (outside of the cardboard box) or manuals that were included with the antennas.
RCA ANT115
This all-band model, shown in Figure 1, has a telescoping dipole “rabbit ears” antenna for VHF reception (which can be removed by unscrewing them from the base) and a loop for reception of UHF TV channels (which can also be easily removed from the base). The assumption is that the user will make adjustments to this antenna by moving the rabbit ears or moving the entire base until an acceptable picture is obtained. It represents what should be considered as the low end of the price and performance range, and has been identified as being available from Sears at a cost of $11.99 or on line directly from RCA for $9.95.
The available specifications indicate that the dipole antenna extends to 36 inches and that it connects to the receiver with an F connector and a 3-foot 75 ohm coaxial cable. The physical dimensions are listed a 7.8"L x 4.4"W x 1.7"H (these dimensions appear to be with the dipole antenna collapsed). This is a passive antenna. There are no other published specifications.
RCA ANT585
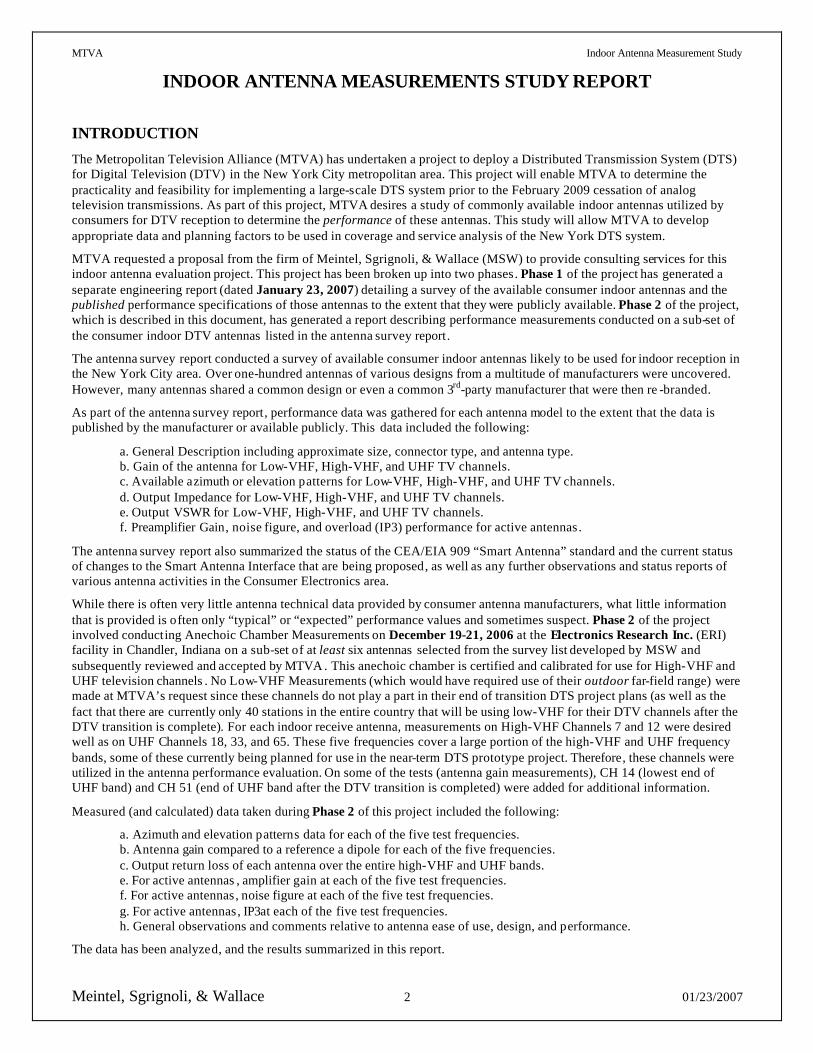
This all-band model, shown in Figure 2 , also has a telescoping dipole “rabbit ears” antenna for VHF reception and a unique flat panel “synchronized to HDTV frequencies” for optimal reception of UHF TV channels. The assumption is that the user will make adjustments to this antenna by moving the rabbit ears or moving the entire base until an acceptable picture is obtained. It represents what should be considered as the middle -of-the-price range. It has been identified as being available from Sears at a cost of about $40 or on line directly from RCA for the same price.
The available specifications indicate that the dipole antenna extends to 39 inches and that the antenna connects to the receiver with an F connector and a 6-foot 75 ohm coaxial cable. This is an amplified antenna with a published fixed VHF gain of 25 dB (2.7 dB noise figure)
Figure 1 RCA
ANT115
MTVA Indoor Antenna Measurement Study
Meintel, Sgrignoli, & Wallace 4 01/23/2007
Figure 3 Philips
Silver Sensor
Figure 4 Philips
MANT940
Figure 5 Winegard SS1000 or SS2000
Figure 6 Terk TV25
and a fixed UHF gain of 22 dB (3.2 dB noise figure). An external wall-mounted power supply is used (DC inserter is internal to the amplifier).
PHILIPS SILVER SENSOR PHDTV1
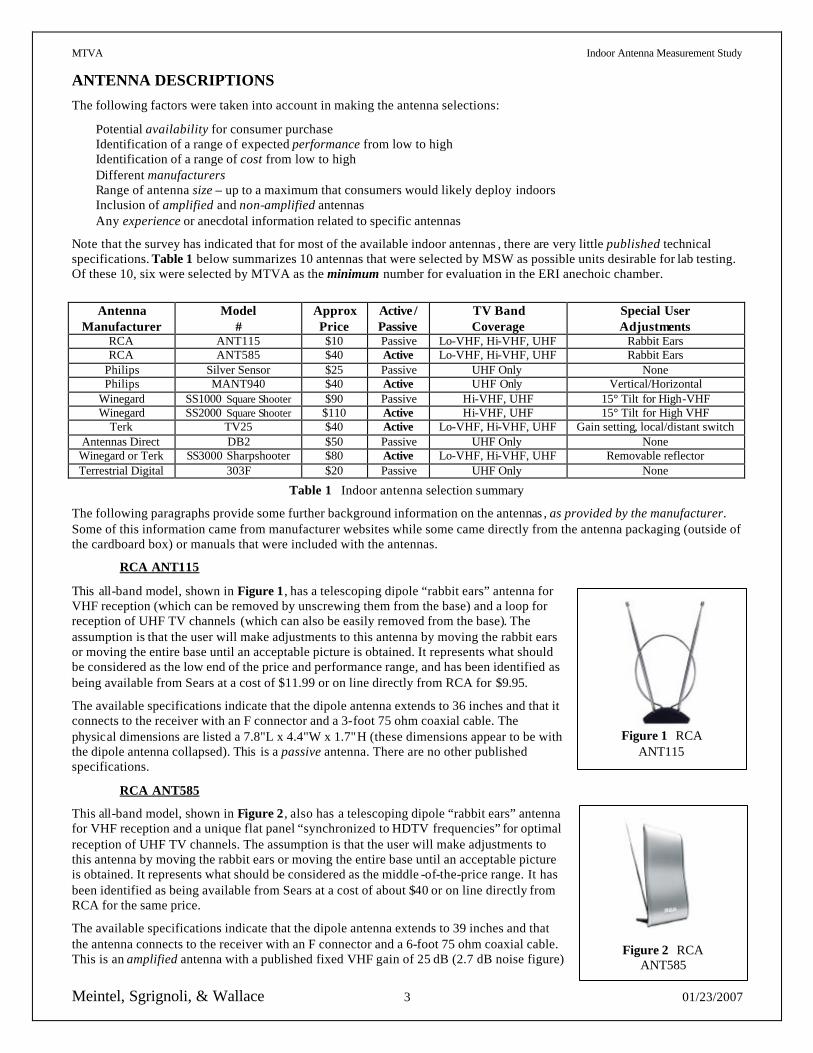
This model, shown in Figure 3, is a log periodic antenna for reception of UHF TV channels only. It is also is sold under the Zenith name (ZHDTV1Z). Although this antenna could probably be used for high VHF reception, its performance would likely be poor (unless used in a strong signal environment). This antenna represents a modestly priced antenna with reasonable performance. It has been identified as being available on line from Amazon.com for $29.99 and from Deeply Discounted Electronics for $19.79. It is also likely to be available from a number of other sources since it has been a very popular antenna in recent years.
The available specifications indicate that it has a gain in the range of 6 to 7 dB, good front-to-back ratio, and flat forward gain shape that delivers balanced reception throughout the UHF band. It comes equipped with a 75-Ohm F connector. The unit has a small footprint, with physical dimensions listed as 9.5"H x 13"W x 13.5"D and weighs 1.6 pounds. There are no other published specifications; however, MSW has experience with this antenna and believes that it performs well. It is a passive antenna.
PHILIPS MANT940
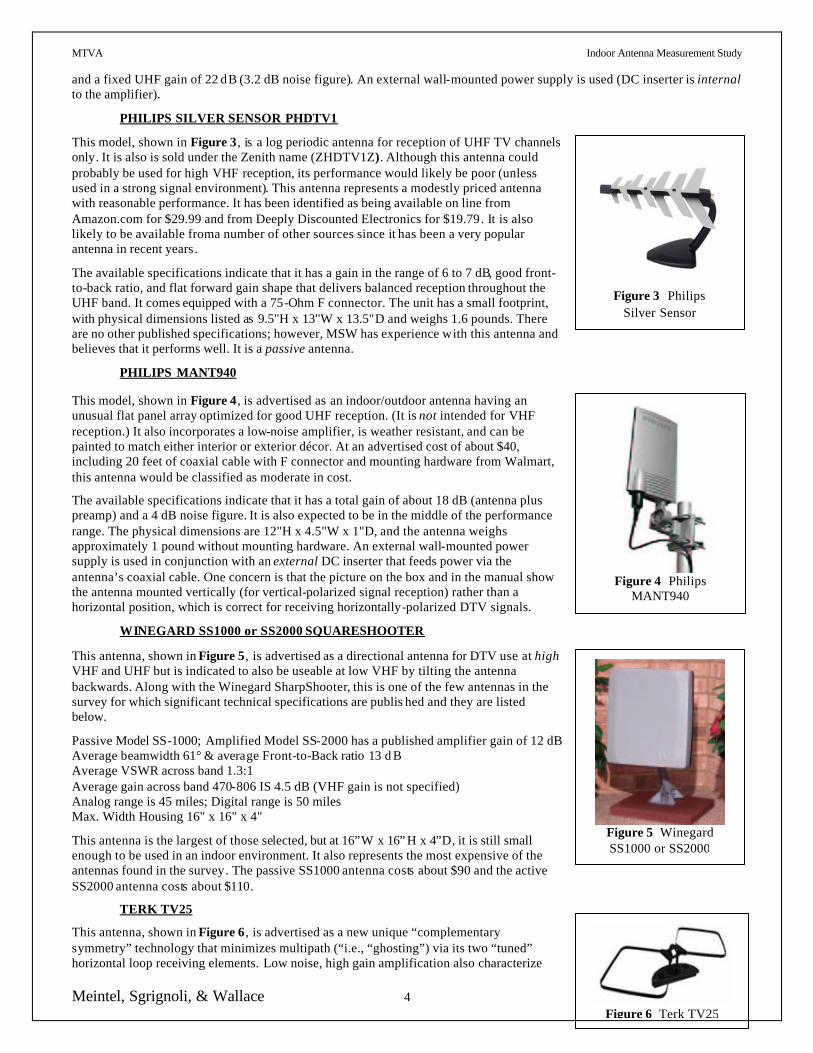
This model, shown in Figure 4, is advertised as an indoor/outdoor antenna having an unusual flat panel array optimized for good UHF reception. (It is not intended for VHF reception.) It also incorporates a low-noise amplifier, is weather resistant, and can be painted to match either interior or exterior décor. At an advertised cost of about $40, including 20 feet of coaxial cable with F connector and mounting hardware from Walmart, this antenna would be classified as moderate in cost.
The available specifications indicate that it has a total gain of about 18 dB (antenna plus preamp) and a 4 dB noise figure. It is also expected to be in the middle of the performance range. The physical dimensions are 12"H x 4.5"W x 1"D, and the antenna weighs approximately 1 pound without mounting hardware. An external wall-mounted power supply is used in conjunction with an external DC inserter that feeds power via the antenna’s coaxial cable. One concern is that the picture on the box and in the manual show the antenna mounted vertically (for vertical-polarized signal reception) rather than a horizontal position, which is correct for receiving horizontally-polarized DTV signals.
WINEGARD SS1000 or SS2000 SQUARESHOOTER
This antenna, shown in Figure 5, is advertised as a directional antenna for DTV use at high VHF and UHF but is indicated to also be useable at low VHF by tilting the antenna backwards. Along with the Winegard SharpShooter, this is one of the few antennas in the survey for which significant technical specifications are publis hed and they are listed below.
Passive Model SS-1000; Amplified Model SS-2000 has a published amplifier gain of 12 dB Average beamwidth 61° & average Front-to-Back ratio 13 d B Average VSWR across band 1.3:1 Average gain across band 470-806 IS 4.5 dB (VHF gain is not specified) Analog range is 45 miles; Digital range is 50 miles Max. Width Housing 16" x 16" x 4"
This antenna is the largest of those selected, but at 16”W x 16” H x 4”D, it is still small enough to be used in an indoor environment. It also represents the most expensive of the antennas found in the survey. The passive SS1000 antenna costs about $90 and the active SS2000 antenna costs about $110.
TERK TV25
This antenna, shown in Figure 6, is advertised as a new unique “complementary symmetry” technology that minimizes multipath (“i.e., “ghosting”) via its two “tuned” horizontal loop receiving elements. Low noise, high gain amplification also characterize
MTVA Indoor Antenna Measurement Study
Meintel, Sgrignoli, & Wallace 5 01/23/2007
Figure 8 Winegard
SS3000 Sharpshooter
Figure 7 Antennas Direct
DB2
this antenna. At a cost of $40, it represents what should be considered as the middle -of-the-price range.
Available specs indicate that it is an active antenna with up to 40+ dB of variable gain (rotary knob on base) and an FM trap. There is the concern that an unsuspecting viewer might have the gain too high and experience interference, and then mistakenly increase the gain thinking that the problem was a weak signal. It is advertised as both a VHF and UHF antenna with an external wall-mounted power supply and internal DC inserter. The two horizontal loop antennas remove the need for long VHF rabbit ears and the associated space and adjustment. It has a local and distant switch for both urban and suburban locations when the received signal is either too strong or weak, respectively, and a separate F-connector input for a second source (e.g., cable or satellite) that allows convenient user switching between antenna and the 2nd source. Also included are LED indicators for power, media switch (antenna versus cable or satellite), and local/distant gain settings. The manufacturer claims that the small size of this antenna (5.25”H x 25”W x 11.5”D) allows easy placement and minimal adjustment.
ANTENNAS DIRECT DB2 (also Terrestrial Digital DB2)
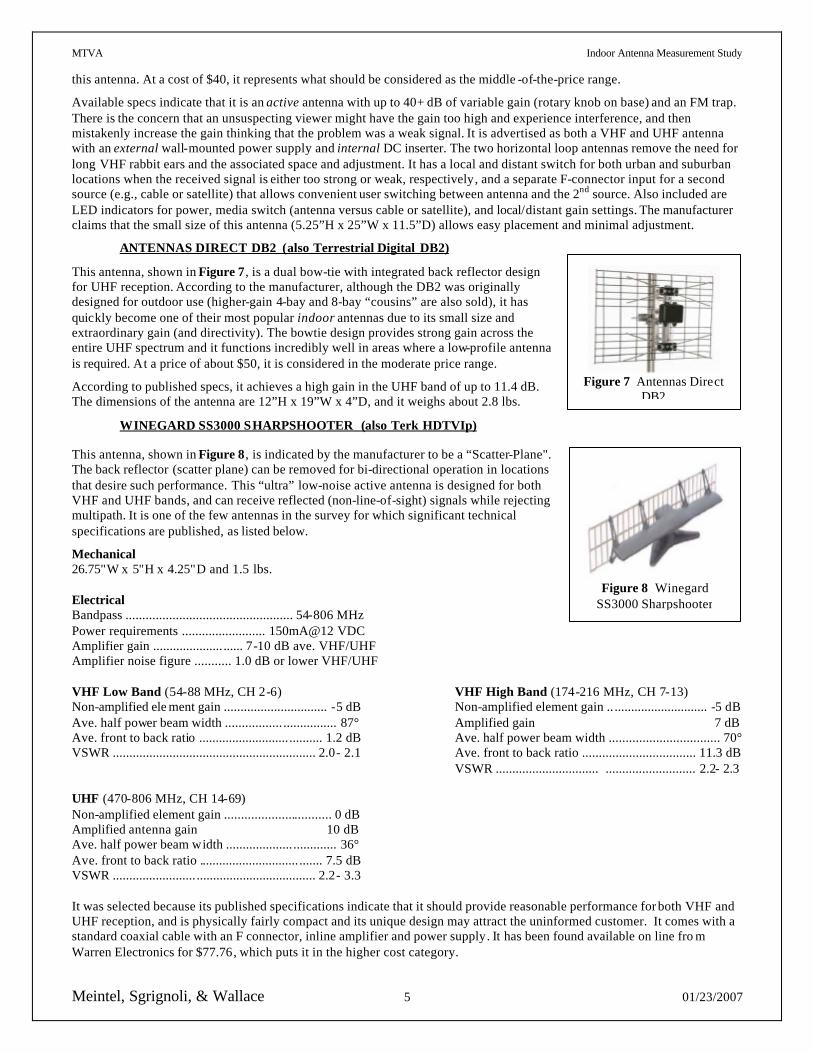
This antenna, shown in Figure 7, is a dual bow-tie with integrated back reflector design for UHF reception. According to the manufacturer, although the DB2 was originally designed for outdoor use (higher-gain 4-bay and 8-bay “cousins” are also sold), it has quickly become one of their most popular indoor antennas due to its small size and extraordinary gain (and directivity). The bowtie design provides strong gain across the entire UHF spectrum and it functions incredibly well in areas where a low-profile antenna is required. At a price of about $50, it is considered in the moderate price range.
According to published specs, it achieves a high gain in the UHF band of up to 11.4 dB. The dimensions of the antenna are 12”H x 19”W x 4”D, and it weighs about 2.8 lbs.
WINEGARD SS3000 SHARPSHOOTER (also Terk HDTVIp)
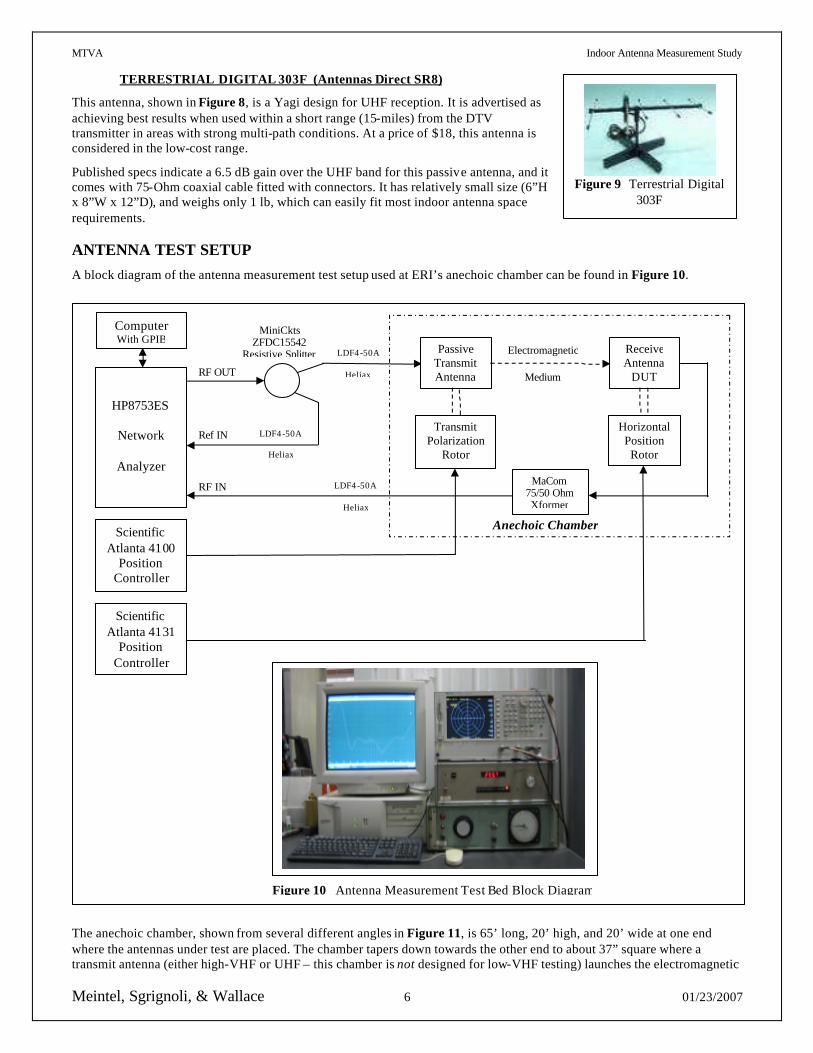
This antenna, shown in Figure 8, is indicated by the manufacturer to be a “Scatter-Plane". The back reflector (scatter plane) can be removed for bi-directional operation in locations that desire such performance. This “ultra” low-noise active antenna is designed for both VHF and UHF bands, and can receive reflected (non-line-of-sight) signals while rejecting multipath. It is one of the few antennas in the survey for which significant technical specifications are published, as listed below.
Mechanical 26.75"W x 5"H x 4.25"D and 1.5 lbs. Electrical Bandpass .................................................. 54-806 MHz Power requirements ......................... 150mA@12 VDC Amplifier gain ..................... ...... 7-10 dB ave. VHF/UHF Amplifier noise figure ........... 1.0 dB or lower VHF/UHF VHF Low Band (54-88 MHz, CH 2-6) VHF High Band (174-216 MHz, CH 7-13) Non-amplified ele ment gain ............................... -5 dB Non-amplified element gain .. ............................ -5 dB Ave. half power beam width ................. ................ 87° Amplified gain 7 dB Ave. front to back ratio ........................... .......... 1.2 dB Ave. half power beam width ................................. 70° VSWR ............................................................. 2.0- 2.1 Ave. front to back ratio .................................. 11.3 dB VSWR ............................... ........................... 2.2- 2.3 UHF (470-806 MHz, CH 14-69) Non-amplified element gain ................................ 0 dB Amplified antenna gain 10 dB Ave. half power beam width .................... ............. 36° Ave. front to back ratio .............................. ....... 7.5 dB VSWR ......................... .................................... 2.2- 3.3 It was selected because its published specifications indicate that it should provide reasonable performance for both VHF and UHF reception, and is physically fairly compact and its unique design may attract the uninformed customer. It comes with a standard coaxial cable with an F connector, inline amplifier and power supply. It has been found available on line fro m Warren Electronics for $77.76, which puts it in the higher cost category.
MTVA Indoor Antenna Measurement Study
Meintel, Sgrignoli, & Wallace 6 01/23/2007
Figure 9 Terrestrial Digital
303F
TERRESTRIAL DIGITAL 303F (Antennas Direct SR8)
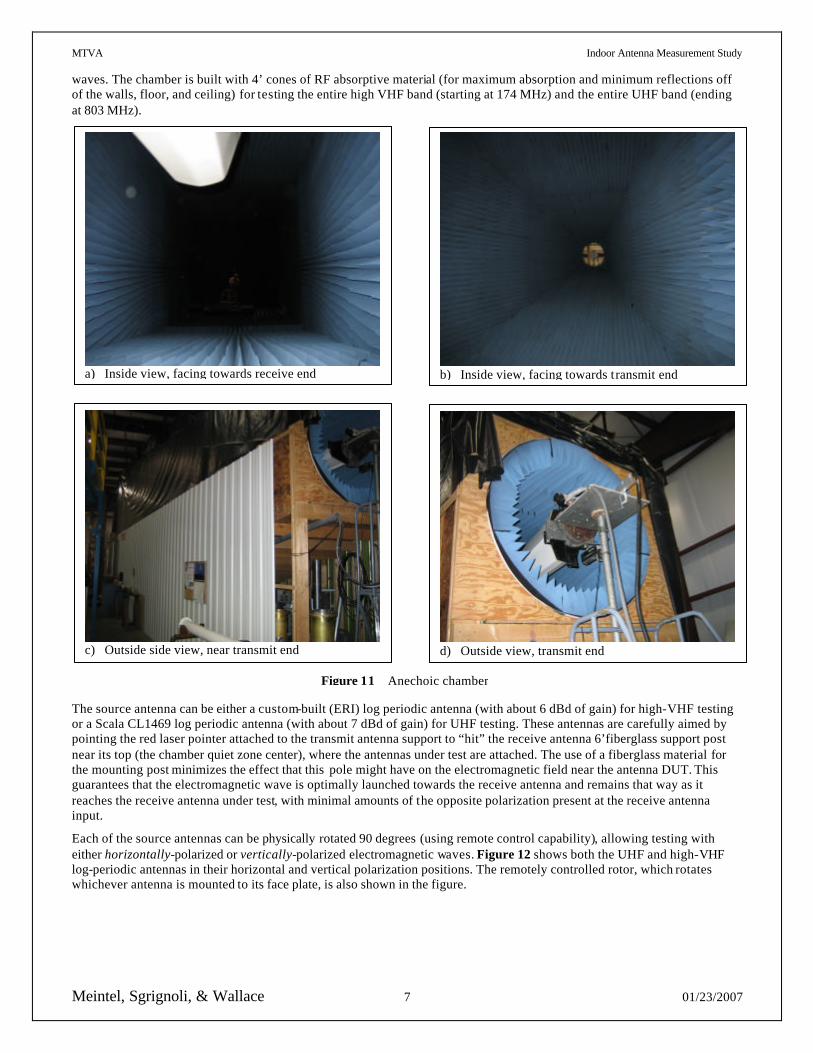
This antenna, shown in Figure 8, is a Yagi design for UHF reception. It is advertised as achieving best results when used within a short range (15-miles) from the DTV transmitter in areas with strong multi-path conditions. At a price of $18, this antenna is considered in the low-cost range.
Published specs indicate a 6.5 dB gain over the UHF band for this passive antenna, and it comes with 75-Ohm coaxial cable fitted with connectors. It has relatively small size (6”H x 8”W x 12”D), and weighs only 1 lb, which can easily fit most indoor antenna space requirements.
ANTENNA TEST SETUP A block diagram of the antenna measurement test setup used at ERI’s anechoic chamber can be found in Figure 10.
The anechoic chamber, shown from several different angles in Figure 11, is 65’ long, 20’ high, and 20’ wide at one end where the antennas under test are placed. The chamber tapers down towards the other end to about 37” square where a transmit antenna (either high-VHF or UHF – this chamber is not designed for low-VHF testing) launches the electromagnetic
HP8753ES
Network
Analyzer
MiniCkts ZFDC15542
Resistive Splitter Passive Transmit Antenna
Receive Antenna
DUT
Horizontal Position Rotor
Transmit Polarization
Rotor
Electromagnetic
Medium
Scientific Atlanta 4131
Position Controller
Scientific Atlanta 4100
Position Controller
RF OUT
Ref IN
RF IN
Anechoic Chamber
Computer With GPIB
LDF4-50A
Heliax
LDF4-50A
Heliax
LDF4-50A
Heliax
MaCom 75/50 Ohm Xformer
Figure 10 Antenna Measurement Test Bed Block Diagram
MTVA Indoor Antenna Measurement Study
Meintel, Sgrignoli, & Wallace 7 01/23/2007
waves. The chamber is built with 4’ cones of RF absorptive material (for maximum absorption and minimum reflections off of the walls, floor, and ceiling) for testing the entire high VHF band (starting at 174 MHz) and the entire UHF band (ending at 803 MHz).
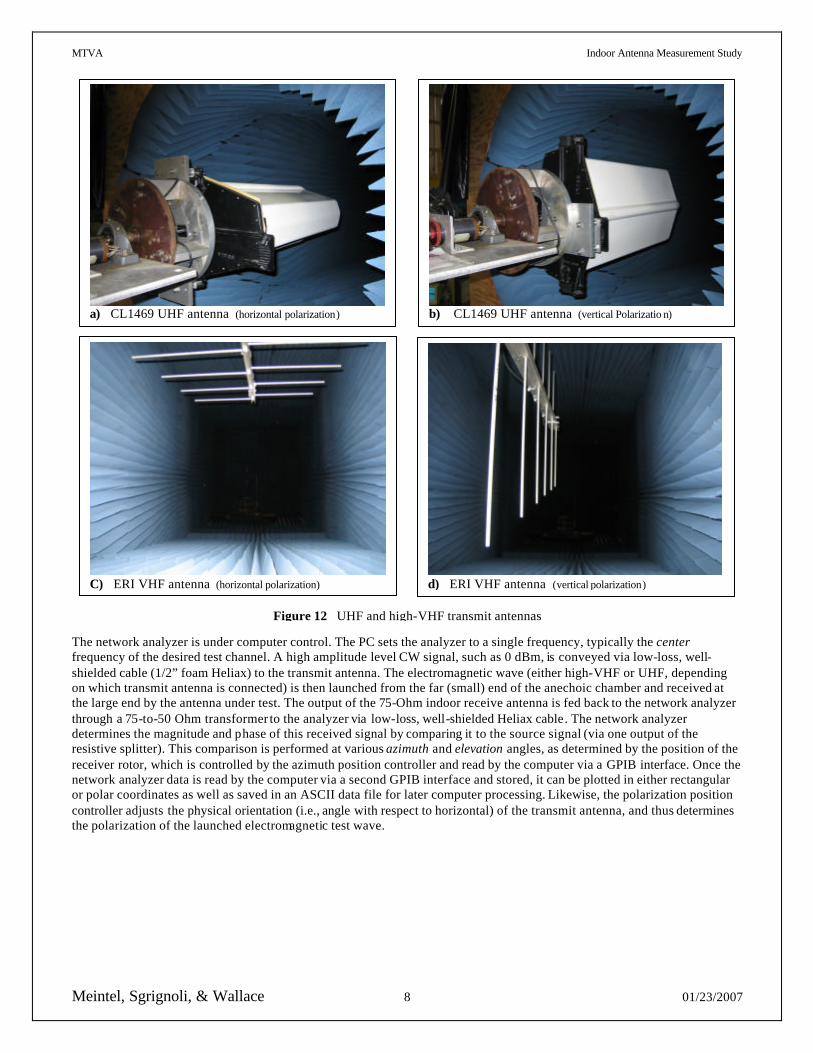
The source antenna can be either a custom-built (ERI) log periodic antenna (with about 6 dBd of gain) for high-VHF testing or a Scala CL1469 log periodic antenna (with about 7 dBd of gain) for UHF testing. These antennas are carefully aimed by pointing the red laser pointer attached to the transmit antenna support to “hit” the receive antenna 6’fiberglass support post near its top (the chamber quiet zone center), where the antennas under test are attached. The use of a fiberglass material for the mounting post minimizes the effect that this pole might have on the electromagnetic field near the antenna DUT. This guarantees that the electromagnetic wave is optimally launched towards the receive antenna and remains that way as it reaches the receive antenna under test, with minimal amounts of the opposite polarization present at the receive antenna input.
Each of the source antennas can be physically rotated 90 degrees (using remote control capability), allowing testing with either horizontally-polarized or vertically-polarized electromagnetic waves. Figure 12 shows both the UHF and high-VHF log-periodic antennas in their horizontal and vertical polarization positions. The remotely controlled rotor, which rotates whichever antenna is mounted to its face plate, is also shown in the figure.
a) Inside view, facing towards receive end
b) Inside view, facing towards transmit end
c) Outside side view, near transmit end
d) Outside view, transmit end
Figure 11 Anechoic chamber
MTVA Indoor Antenna Measurement Study
Meintel, Sgrignoli, & Wallace 8 01/23/2007
The network analyzer is under computer control. The PC sets the analyzer to a single frequency, typically the center frequency of the desired test channel. A high amplitude level CW signal, such as 0 dBm, is conveyed via low-loss, well-shielded cable (1/2” foam Heliax) to the transmit antenna. The electromagnetic wave (either high-VHF or UHF, depending on which transmit antenna is connected) is then launched from the far (small) end of the anechoic chamber and received at the large end by the antenna under test. The output of the 75-Ohm indoor receive antenna is fed back to the network analyzer through a 75-to-50 Ohm transformer to the analyzer via low-loss, well-shielded Heliax cable. The network analyzer determines the magnitude and phase of this received signal by comparing it to the source signal (via one output of the resistive splitter). This comparison is performed at various azimuth and elevation angles, as determined by the position of the receiver rotor, which is controlled by the azimuth position controller and read by the computer via a GPIB interface. Once the network analyzer data is read by the computer via a second GPIB interface and stored, it can be plotted in either rectangular or polar coordinates as well as saved in an ASCII data file for later computer processing. Likewise, the polarization position controller adjusts the physical orientation (i.e., angle with respect to horizontal) of the transmit antenna, and thus determines the polarization of the launched electromagnetic test wave.
a) CL1469 UHF antenna (horizontal polarization)
b) CL1469 UHF antenna (vertical Polarizatio n)
C) ERI VHF antenna (horizontal polarization)
d) ERI VHF antenna (vertical polarization)
Figure 12 UHF and high-VHF transmit antennas

MTVA Indoor Antenna Measurement Study
Meintel, Sgrignoli, & Wallace 9 01/23/2007
ANTENNA TEST METHODOLOGY The methodology used during the testing of the indoor receive antennas will now be described. This will include the logistical steps in determining the antenna’s maximum gain (at a given azimuth angle), the co-polarization and cross-polarization patterns for 360 degrees of the azimuth pattern as well as the co-polarization and cross-polarization patterns for 360 degrees of the elevation pattern. Additionally, the methodology of determining antenna return loss and active antennas’ preamplifier parameters (gain, noise figure, and 3rd order intercept (IP3)) will be described.
MAXIMUM ANTENNA GAIN
The absolute maximum antenna gain measurements are made by comparing the antenna output signal level to that of a calibrated reference half-wave dipole antenna that was properly adjusted for each test channel center frequency. This “substitution method” provides the traditional antenna gain parameter of dBd (i.e., dB over the gain of a ½-wave dipole).
A calibrated dipole antenna is attached (typically with duct tape) to the 6’ fiberglass support pole at the receive end of the anechoic chamber in the proper position (dipole elements perpendicular to the incoming electromagnetic wave front) that produces the maximum gain (i.e., peak of lobe). The two elements of the dipole are each extended an equal amount such that the total distance end-to-end is approximately equal to ½ the wavelength of the test channel center frequency. The output signal level and phase are then measured on the network analyzer, and sent to the computer for recording and plotting.
The antenna gain (in dBd) of the DUT is then calculated by subtracting the maximum output signal level (in dBm) of the dipole reference antenna (in dBm) from the test antenna output signal level at the azimuth position (angle of incidence, in degrees) that provides its maximum value (i.e., “peak lobe” value). However, the test antenna position for maximum gain is sometimes not where intuition might indicate. Also, due to the unbalanced design of some of the antennas, the azimuth and elevation patterns were affected by the positioning of the coaxial output cable. This means that the maximum antenna gain that is measured in this test might not line up exactly with the antenna patterns that were measured at a separate time (i.e., exact reproducibility is not possible).
AZIMUTH PATTERN (Co-Polarization and Cross-Polarization)
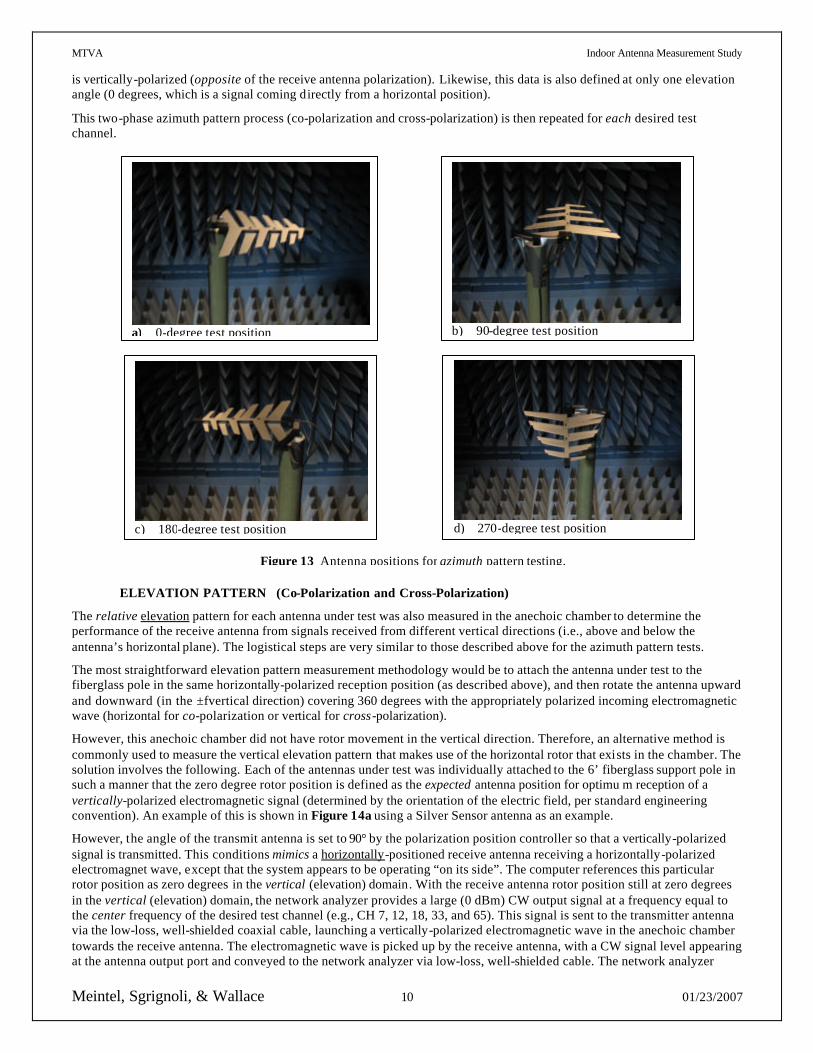
The relative azimuth pattern for each antenna under test was measured in the anechoic chamber to determine the performance of the receive antenna from signals received from different horizontal directions (i.e., from the front, back, and sides of the antenna). Each of the antennas was individually attached to the 6’ fiberglass pole in such a manner that the zero degree rotor position was defined as the expected antenna orientation for optimum reception of a horizontally-polarized electromagnetic signal (which is determined by the orientation of the electric field, per standard engineering convention). The computer references this particular rotor position as zero degrees in the horizontal (azimuth) domain. An example of this is shown in Figure 13a using a Silver Sensor log periodic antenna.
The physical angle of the transmit (source) antenna is set to 0° degrees by the polarization position controller so that a horizontally-polarized signal is transmitted. With the receive antenna rotor position still at zero degrees in the horizontal (azimuth) domain, the network analyzer provides a large (0 dBm) CW output signal at a frequency equal to the center frequency of the desired test channel (e.g., CH 7, 12, 18, 33, and 65). This signal is sent to the transmitter antenna via the low-loss, well-shielded coaxial cable, launching a horizontally-polarized electromagnetic wave in the anechoic chamber towards the receive antenna. The electromagnetic wave is picked up by the receive antenna, with a CW signal level appearing at the antenna output port and conveyed to the network analyzer via low-loss, well-shielded cable. The network analyzer compares this received signal to the one that was sent to the transmit antenna. The computer then reads the received signal’s magnitude and phase from the network analyzer, both storing data (in relative linear magnitude) from this one azimuth angle as well as plotting this level as one azimuth point (either polar or rectangular) on the computer screen.
With the source still transmitting a horizontally-polarized CW signal, rotation is initiated so that the computer collects horizontal angular position in 0.1 degree increments (in the ±? horizontal direction) over the entire 360 degrees (total of 3601 data points). Figure 13a-d illustrates this concept for four (0, 90, 180, and 270 degrees) of the 3600 different azimuth positions. After one complete revolution, the co-polarization azimuth pattern has been measured, stored, and plotted. It is defined as the azimuth co-polarization pattern since the receive antenna is set up in its expected horizontally -polarized (azimuth) position and the transmitted electromagnetic signal is horizontally-polarized (same as the receive antenna polarization). This data, however, is defined at only one elevation angle (0 degrees, which is a signal coming directly from a horizontal position).
The transmit (source) antenna is then rotated by 90° so that a vertically-polarized CW signal is launched into the anechoic chamber. The antenna, still in its horizontally-polarized receive position, is rotated once again in 0.1 degree increments over 360 degrees, taking data as described above for each desired azimuth angle. After completing one complete revolution, the cross-polarization azimuth patter has been measured, stored, and plotted. It is defined as the azimuth cross-polarization pattern since the receive antenna is set up in its expected horizontally-polarized (azimuth) position but the transmitted signal
MTVA Indoor Antenna Measurement Study
Meintel, Sgrignoli, & Wallace 10 01/23/2007
is vertically-polarized (opposite of the receive antenna polarization). Likewise, this data is also defined at only one elevation angle (0 degrees, which is a signal coming directly from a horizontal position).
This two-phase azimuth pattern process (co-polarization and cross-polarization) is then repeated for each desired test channel.
ELEVATION PATTERN (Co-Polarization and Cross-Polarization)
The relative elevation pattern for each antenna under test was also measured in the anechoic chamber to determine the performance of the receive antenna from signals received from different vertical directions (i.e., above and below the antenna’s horizontal plane). The logistical steps are very similar to those described above for the azimuth pattern tests.
The most straightforward elevation pattern measurement methodology would be to attach the antenna under test to the fiberglass pole in the same horizontally-polarized reception position (as described above), and then rotate the antenna upward and downward (in the ±f vertical direction) covering 360 degrees with the appropriately polarized incoming electromagnetic wave (horizontal for co-polarization or vertical for cross-polarization).
However, this anechoic chamber did not have rotor movement in the vertical direction. Therefore, an alternative method is commonly used to measure the vertical elevation pattern that makes use of the horizontal rotor that exists in the chamber. The solution involves the following. Each of the antennas under test was individually attached to the 6’ fiberglass support pole in such a manner that the zero degree rotor position is defined as the expected antenna position for optimu m reception of a vertically-polarized electromagnetic signal (determined by the orientation of the electric field, per standard engineering convention). An example of this is shown in Figure 14a using a Silver Sensor antenna as an example.
However, the angle of the transmit antenna is set to 90° by the polarization position controller so that a vertically-polarized signal is transmitted. This conditions mimics a horizontally-positioned receive antenna receiving a horizontally-polarized electromagnet wave, except that the system appears to be operating “on its side”. The computer references this particular rotor position as zero degrees in the vertical (elevation) domain. With the receive antenna rotor position still at zero degrees in the vertical (elevation) domain, the network analyzer provides a large (0 dBm) CW output signal at a frequency equal to the center frequency of the desired test channel (e.g., CH 7, 12, 18, 33, and 65). This signal is sent to the transmitter antenna via the low-loss, well-shielded coaxial cable, launching a vertically-polarized electromagnetic wave in the anechoic chamber towards the receive antenna. The electromagnetic wave is picked up by the receive antenna, with a CW signal level appearing at the antenna output port and conveyed to the network analyzer via low-loss, well-shielded cable. The network analyzer
a) 0-degree test position
b) 90-degree test position
c) 180-degree test position
d) 270-degree test position
Figure 13 Antenna positions for azimuth pattern testing.

MTVA Indoor Antenna Measurement Study
Meintel, Sgrignoli, & Wallace 11 01/23/2007
compares this signal to the one that was sent to the transmit antenna. The computer then reads the received signal’s magnitude and phase from the network analyzer, both storing data (in relative linear magnitude) from this one elevation angle as well as plotting this level as one elevation point (either polar or rectangular) on the computer screen.
With the source still transmitting a vertically-polarized CW signal, the comp uter then directs the azimuth rotor to move its horizontal angular position in 0.1 degree increments (in the ±? horizontal direction) over the entire 360 degrees (total of 3601 data points), and the process is repeated. However, since the antenna is mounted for vertical polarization and the source is vertically-polarized, this is the same as measuring the response of one particular azimuth angle. Figure 14a-d illustrates this for four (0, 90, 180, and 270 degrees) of the 3600 different elevation positions. After one complete revolution, the co-polarization elevation pattern has been stored and plotted. It is defined as the elevation co-polarization pattern since the receive antenna is set up in its expected simulated (“on its side”) horizontally-polarized (elevation) position and the transmitted signal is a simulated (i.e., “on its side”) horizontally-polarized (same as the antenna polarization). This data, however, is defined in only one azimuth angle (0 degrees, which is a signal coming directly from a frontal position).
The transmit (source) antenna is then rotated by 90° so that a horizontally-polarized CW signal is launched into the anechoic chamber. The receive antenna, still in its simulated horizontally-polarized receive position (i.e., “on its side”), is rotated once again over 360 degrees in 0.1 degree steps, taking data as described above for each desired elevation angle. After completing one complete revolution, the cross-polarization azimuth patter has been store and plotted. It is defined as the azimuth cross-polarization pattern since the receive antenna is set up in its expected horizontally-polarized (azimuth) position but the transmitted signal is vertically -polarized (opposite of the receive antenna polarization). However, this data is defined in only one azimuth angle (0 degrees, which is a signal coming directly from a frontal position).
This two-phase elevation pattern process (co-polarization and cross-polarization) is then repeated for each desired test channel.
A rough idea of the anechoic chamber performance can be determined by observing the co-polarization and cross-polarization azimuth and elevation patterns of a reference dipole. At the peak azimuth locations for UHF channels, the cross-pole is more than 20 dB below these values. Appendix D contains these azimuth and elevation dipole antenna pattern plots for channel 33.
a) 0-degree position
b) 90-degree position
c) 180-degree position
d) 270-degree position
Figure 14 Antenna positions for elevation pattern testing
MTVA Indoor Antenna Measurement Study
Meintel, Sgrignoli, & Wallace 12 01/23/2007
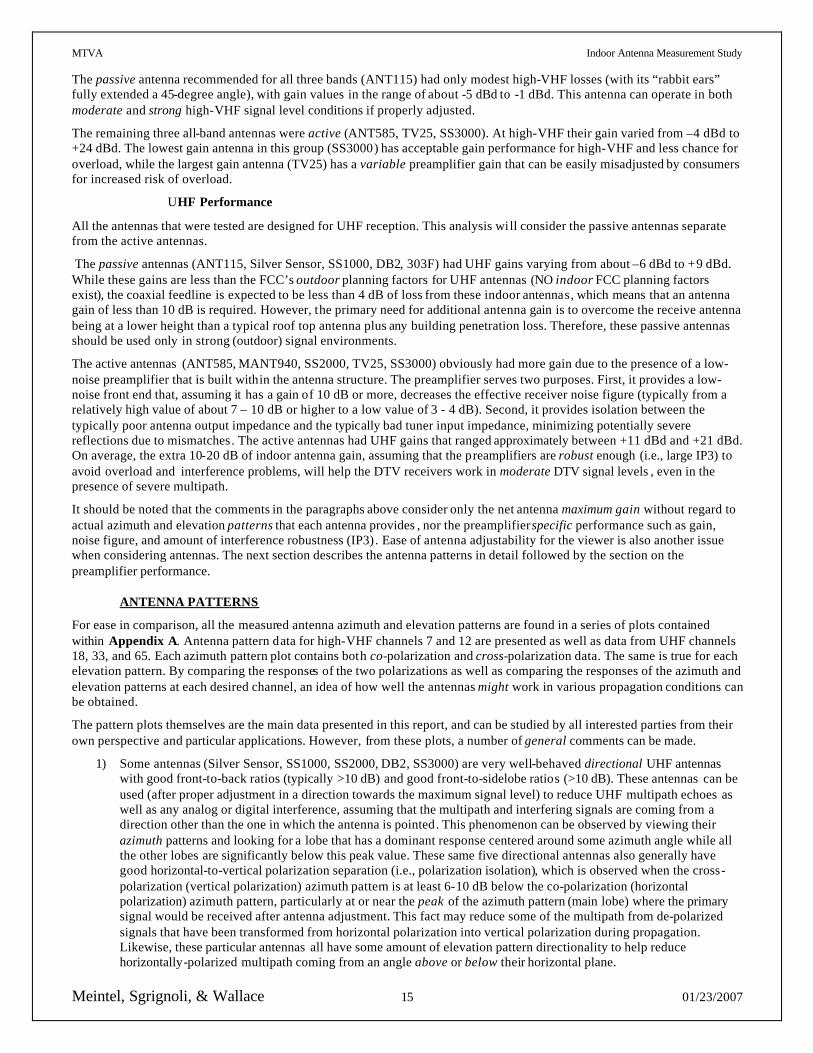
OUTPUT RETURN LOSS
Antenna return loss is a measurement that determines the difference between the actual antenna output impedance and some nominal impedance (typically 50 or 75 Ohms), and is an indication of how much signal power is reflected back to the source due to the mismatch at the load. A complete mismatch (either a short or open) will reflect all of the signal power back to the source, and register a 0 dB return loss, while a very good match (one where most of the signal power is absorbed by the load and little of it is reflected back towards the source) has a very low logarithmic value (i.e., large negative number in dB). Antenna output return loss indicates how well the consumer receive antenna is matched to a 75 Ohm load such as the input to an external preamplifier or a DTV tuner.
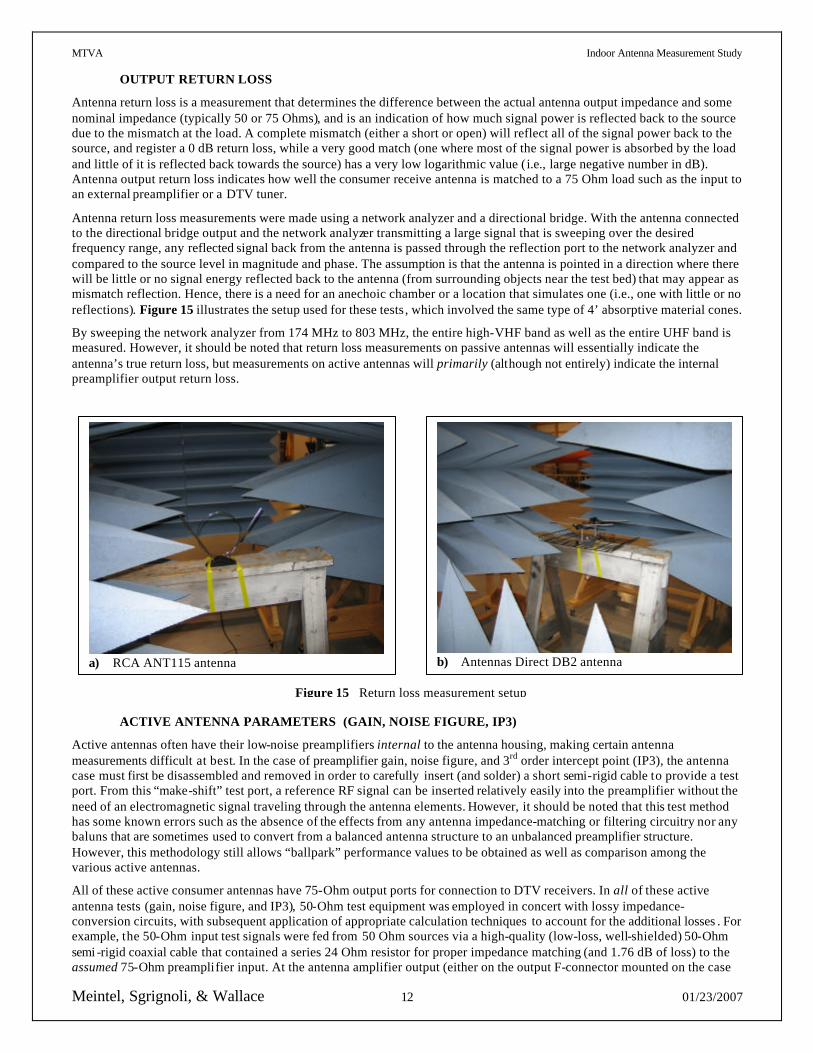
Antenna return loss measurements were made using a network analyzer and a directional bridge. With the antenna connected to the directional bridge output and the network analyzer transmitting a large signal that is sweeping over the desired frequency range, any reflected signal back from the antenna is passed through the reflection port to the network analyzer and compared to the source level in magnitude and phase. The assumption is that the antenna is pointed in a direction where there will be little or no signal energy reflected back to the antenna (from surrounding objects near the test bed) that may appear as mismatch reflection. Hence, there is a need for an anechoic chamber or a location that simulates one (i.e., one with little or no reflections). Figure 15 illustrates the setup used for these tests , which involved the same type of 4’ absorptive material cones.
By sweeping the network analyzer from 174 MHz to 803 MHz, the entire high-VHF band as well as the entire UHF band is measured. However, it should be noted that return loss measurements on passive antennas will essentially indicate the antenna’s true return loss, but measurements on active antennas will primarily (although not entirely) indicate the internal preamplifier output return loss.
ACTIVE ANTENNA PARAMETERS (GAIN, NOISE FIGURE, IP3)
Active antennas often have their low-noise preamplifiers internal to the antenna housing, making certain antenna measurements difficult at best. In the case of preamplifier gain, noise figure, and 3rd order intercept point (IP3), the antenna case must first be disassembled and removed in order to carefully insert (and solder) a short semi-rigid cable to provide a test port. From this “make-shift” test port, a reference RF signal can be inserted relatively easily into the preamplifier without the need of an electromagnetic signal traveling through the antenna elements. However, it should be noted that this test method has some known errors such as the absence of the effects from any antenna impedance-matching or filtering circuitry nor any baluns that are sometimes used to convert from a balanced antenna structure to an unbalanced preamplifier structure. However, this methodology still allows “ballpark” performance values to be obtained as well as comparison among the various active antennas.
All of these active consumer antennas have 75-Ohm output ports for connection to DTV receivers. In all of these active antenna tests (gain, noise figure, and IP3), 50-Ohm test equipment was employed in concert with lossy impedance-conversion circuits, with subsequent application of appropriate calculation techniques to account for the additional losses . For example, the 50-Ohm input test signals were fed from 50 Ohm sources via a high-quality (low-loss, well-shielded) 50-Ohm semi -rigid coaxial cable that contained a series 24 Ohm resistor for proper impedance matching (and 1.76 dB of loss) to the assumed 75-Ohm preamplifier input. At the antenna amplifier output (either on the output F-connector mounted on the case
a) RCA ANT115 antenna
b) Antennas Direct DB2 antenna
Figure 15 Return loss measurement setup

MTVA Indoor Antenna Measurement Study
Meintel, Sgrignoli, & Wallace 13 01/23/2007
or at the end of an integrally -attached cable with F-connector), a 75-to-50-Ohm minimum loss (5.7 dB) matching pad was employed to properly match to the 50-Ohm test equipment inputs. However, the additional losses associated with these two impedance conversions were accounted for in subsequent calculations (e.g., losses algebraically applied to gain and IP3 values and losses properly inserted into the Friis formula for noise figure determination).
Preamplifier gain and noise figure were measured together using an HP 8970A noise figure meter (along with noise source Model # HP346A with about 5 dB excess noise). Measurements were made on the desired DTV channels (7, 12, 18, 33, and 65).
In the process of measuring noise figure, the test equipment must also determine the broadband amplifier gain at the center of the test channel, displaying its value on the front panel. This gain includes any losses from attached output coaxial cables integral to the antenna as well as any external power inserters (that supply power remotely via the coaxial cable). A large gain value (in dB) means a large signal gain. A typical value of antenna preamplifier gain, which allows for the minimization of coaxial feedline losses as well as white noise effects from a DTV receiver, is generally between 10 – 20 dB, depending on the expected amount of output cable loss and any extraneous splitters.
Noise figure is a measure of how much the amplifier noise output level is beyond the ideal case where only kTB exists at its input (i.e., noise from a matched resistive system at a given temperature). A small value (in dB) is desired for low-noise amplifier performance, meaning there is only a small amount of excess noise being added by the active amplifier. Noise figure values in the range of 3 – 4 dB are considered good for consumer amplifier devices.
However, it should be noted that these gain and noise figure measurements represent the values when the preamplifier is connected to an equivalent 75-Ohm resistive source (as was the case during these particular laboratory measurements). When the preamplifiers are re -connected to their respective antennas for normal use, whose impedances can be significantly different from a resistive 75 Ohms, the gain and noise figure can possibly be degraded anywhere from minimal amounts up to several dB. In addition to this, any baluns or filters that are present in the antenna input circuitry but not utilized during this laboratory preamplifier testing, may also degrade the gain and noise figure values. Therefore, these noise figure measurements provide only “ballpark” absolute figures yet allow for antenna comparisons.
IP3 measurements, which indicate amplifier robustness to overload and interference conditions, were conducted by using the 2-tone test method. This method inserts into the input of each amplifier two closely-spaced, equal-level CW carriers (separated by 1 MHz) that are centered in each DTV channel under test (CH 7, 12, 18, 33, and 65). An HP435B power meter with HP8484A power sensor was used for accurately measuring the absolute values of the CW tones inserted into the amplifiers (with appropriate calculations to correct the 24 Ohm impedance-matching series resistor). The two 3rd order components, which occur on each side of the pair of CW signals due to 3rd order non-linearities, are then measured relative to the signal level of the two equal-power CW tones. Appropriate calculations are made that account for the fact that the 3rd order components increase 3 dB for every 1 dB of fundamental signal pair increase (i.e., both fundamental CW tones increasing equally). These calculations then provide the theoretical 3rd order intercept point (a fictitious situation where the 3rd order component levels equal the fundamental signal levels ). A larger IP3 value (in dBm) means a more robust amplifier. The IP3 levels were referenced to both the amplifier input (IIP3) and the output (OIP3), related by the gain of the preamplifier at the frequency under test. A typical value for a robust consumer amplifier is an OIP3 of +25 dBm or greater.
TEST RESULTS
The test results can be broken down into several categories. For all antennas, the following data was obtained: (1) the peak antenna gain compared to that of a ½-wave dipole for channels 7, 12, 14, 18, 33, 51, and 65, (2) the antenna azimuth and elevation patterns (for channels 7, 12, 18, 33, and 65), (3) the antenna output return loss over the high-VHF and UHF bands, and (4) the active antennas’ preamplifier performance parameters (gain, noise figure, and IP3).
The main focus of this report is to summarize the details of each antenna’s performance, and this is done in the following tables and figures. However, additional comments and observations on the antenna test results are included below as well.
ANTENNA GAIN
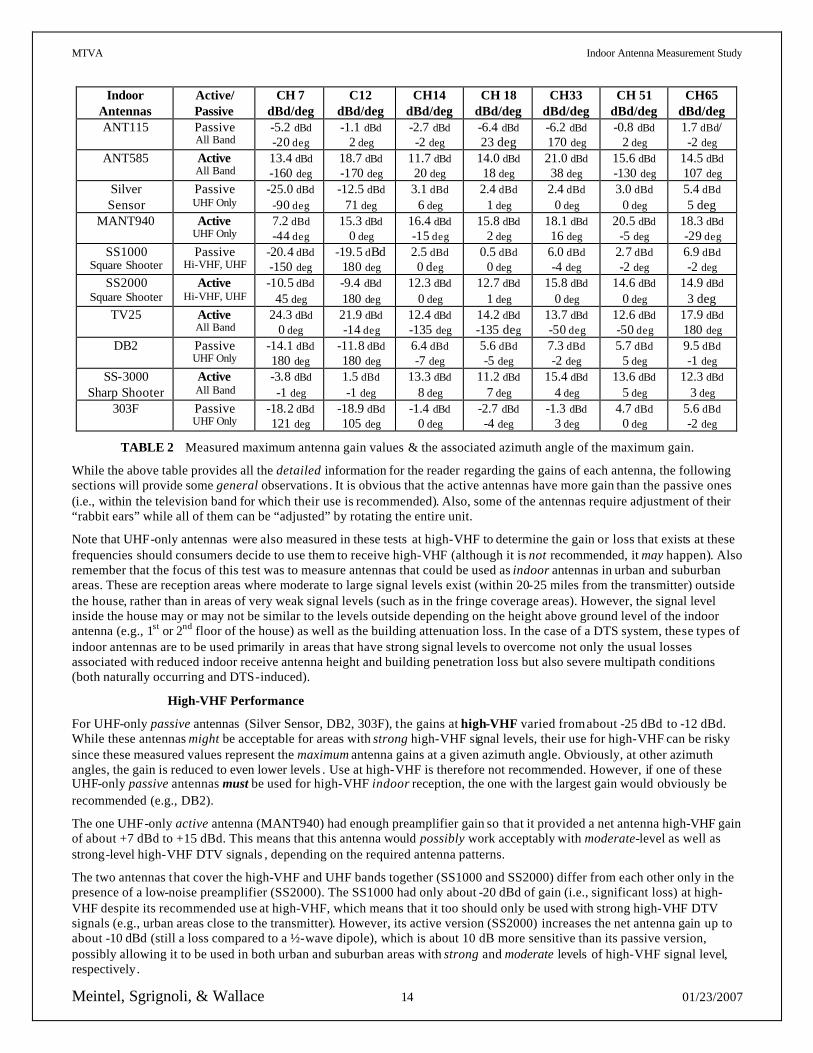
The maximum antenna gain of each antenna, along with its corresponding “peak lobe” azimuth angle, is shown in Table 2 below, and allows easy comparison of all the antennas . A further summary of these gain results can also be found in Table 6. As described above, the gains are described in terms relative to a ½-wave dipole antenna at the desired test frequencies, and are therefore in units of dBd (gain over dipole). The angle describes the antenna azimuth angle where the maximum gain occurred (i.e., its “peak lobe” angle), which was not always in the expected 0 degrees position. When multiple significant lobes existed, the one with the largest value was selected. However, if more than one significant lobe existed that had equal gains, then the one closest to 0 degrees was selected.
MTVA Indoor Antenna Measurement Study
Meintel, Sgrignoli, & Wallace 14 01/23/2007
Indoor
Antennas Active/ Passive
CH 7 dBd/deg
C12 dBd/deg
CH14 dBd/deg
CH 18 dBd/deg
CH33 dBd/deg
CH 51 dBd/deg
CH65 dBd/deg
ANT115 Passive All Band
-5.2 dBd -20 deg
-1.1 dBd 2 deg
-2.7 dBd -2 deg
-6.4 dBd 23 deg
-6.2 dBd 170 deg
-0.8 dBd 2 deg
1.7 dBd/ -2 deg
ANT585 Active All Band
13.4 dBd -160 deg
18.7 dBd -170 deg
11.7 dBd 20 deg
14.0 dBd 18 deg
21.0 dBd 38 deg
15.6 dBd -130 deg
14.5 dBd 107 deg
Silver Sensor
Passive UHF Only
-25.0 dBd -90 deg
-12.5 dBd 71 deg
3.1 dBd 6 deg
2.4 dBd 1 deg
2.4 dBd 0 deg
3.0 dBd 0 deg
5.4 dBd 5 deg
MANT940 Active UHF Only
7.2 dBd -44 deg
15.3 dBd 0 deg
16.4 dBd -15 deg
15.8 dBd 2 deg
18.1 dBd 16 deg
20.5 dBd -5 deg
18.3 dBd -29 deg
SS1000 Square Shooter
Passive Hi-VHF, UHF
-20.4 dBd -150 deg
-19.5 dBd 180 deg
2.5 dBd 0 deg
0.5 dBd 0 deg
6.0 dBd -4 deg
2.7 dBd -2 deg
6.9 dBd -2 deg
SS2000 Square Shooter
Active Hi-VHF, UHF
-10.5 dBd 45 deg
-9.4 dBd 180 deg
12.3 dBd 0 deg
12.7 dBd 1 deg
15.8 dBd 0 deg
14.6 dBd 0 deg
14.9 dBd 3 deg
TV25 Active All Band
24.3 dBd 0 deg
21.9 dBd -14 deg
12.4 dBd -135 deg
14.2 dBd -135 deg
13.7 dBd -50 deg
12.6 dBd -50 deg
17.9 dBd 180 deg
DB2 Passive UHF Only
-14.1 dBd 180 deg
-11.8 dBd 180 deg
6.4 dBd -7 deg
5.6 dBd -5 deg
7.3 dBd -2 deg
5.7 dBd 5 deg
9.5 dBd -1 deg
SS-3000 Sharp Shooter
Active All Band
-3.8 dBd -1 deg
1.5 dBd -1 deg
13.3 dBd 8 deg
11.2 dBd 7 deg
15.4 dBd 4 deg
13.6 dBd 5 deg
12.3 dBd 3 deg
303F Passive UHF Only
-18.2 dBd 121 deg
-18.9 dBd 105 deg
-1.4 dBd 0 deg
-2.7 dBd -4 deg
-1.3 dBd 3 deg
4.7 dBd 0 deg
5.6 dBd -2 deg
TABLE 2 Measured maximum antenna gain values & the associated azimuth angle of the maximum gain.
While the above table provides all the detailed information for the reader regarding the gains of each antenna, the following sections will provide some general observations. It is obvious that the active antennas have more gain than the passive ones (i.e., within the television band for which their use is recommended). Also, some of the antennas require adjustment of their “rabbit ears” while all of them can be “adjusted” by rotating the entire unit.
Note that UHF-only antennas were also measured in these tests at high-VHF to determine the gain or loss that exists at these frequencies should consumers decide to use them to receive high-VHF (although it is not recommended, it may happen). Also remember that the focus of this test was to measure antennas that could be used as indoor antennas in urban and suburban areas. These are reception areas where moderate to large signal levels exist (within 20-25 miles from the transmitter) outside the house, rather than in areas of very weak signal levels (such as in the fringe coverage areas). However, the signal level inside the house may or may not be similar to the levels outside depending on the height above ground level of the indoor antenna (e.g., 1st or 2nd floor of the house) as well as the building attenuation loss. In the case of a DTS system, these types of indoor antennas are to be used primarily in areas that have strong signal levels to overcome not only the usual losses associated with reduced indoor receive antenna height and building penetration loss but also severe multipath conditions (both naturally occurring and DTS-induced).
High-VHF Performance
For UHF-only passive antennas (Silver Sensor, DB2, 303F), the gains at high-VHF varied from about -25 dBd to -12 dBd. While these antennas might be acceptable for areas with strong high-VHF signal levels, their use for high-VHF can be risky since these measured values represent the maximum antenna gains at a given azimuth angle. Obviously, at other azimuth angles, the gain is reduced to even lower levels . Use at high-VHF is therefore not recommended. However, if one of these UHF-only passive antennas must be used for high-VHF indoor reception, the one with the largest gain would obviously be recommended (e.g., DB2).
The one UHF-only active antenna (MANT940) had enough preamplifier gain so that it provided a net antenna high-VHF gain of about +7 dBd to +15 dBd. This means that this antenna would possibly work acceptably with moderate-level as well as strong-level high-VHF DTV signals , depending on the required antenna patterns.
The two antennas that cover the high-VHF and UHF bands together (SS1000 and SS2000) differ from each other only in the presence of a low-noise preamplifier (SS2000). The SS1000 had only about -20 dBd of gain (i.e., significant loss) at high-VHF despite its recommended use at high-VHF, which means that it too should only be used with strong high-VHF DTV signals (e.g., urban areas close to the transmitter). However, its active version (SS2000) increases the net antenna gain up to about -10 dBd (still a loss compared to a ½-wave dipole), which is about 10 dB more sensitive than its passive version, possibly allowing it to be used in both urban and suburban areas with strong and moderate levels of high-VHF signal level, respectively.
MTVA Indoor Antenna Measurement Study
Meintel, Sgrignoli, & Wallace 15 01/23/2007
The passive antenna recommended for all three bands (ANT115) had only modest high-VHF losses (with its “rabbit ears” fully extended a 45-degree angle), with gain values in the range of about -5 dBd to -1 dBd. This antenna can operate in both moderate and strong high-VHF signal level conditions if properly adjusted.
The remaining three all-band antennas were active (ANT585, TV25, SS3000). At high-VHF their gain varied from –4 dBd to +24 dBd. The lowest gain antenna in this group (SS3000) has acceptable gain performance for high-VHF and less chance for overload, while the largest gain antenna (TV25) has a variable preamplifier gain that can be easily misadjusted by consumers for increased risk of overload.
UHF Performance
All the antennas that were tested are designed for UHF reception. This analysis will consider the passive antennas separate from the active antennas.
The passive antennas (ANT115, Silver Sensor, SS1000, DB2, 303F) had UHF gains varying from about –6 dBd to +9 dBd. While these gains are less than the FCC’s outdoor planning factors for UHF antennas (NO indoor FCC planning factors exist), the coaxial feedline is expected to be less than 4 dB of loss from these indoor antennas, which means that an antenna gain of less than 10 dB is required. However, the primary need for additional antenna gain is to overcome the receive antenna being at a lower height than a typical roof top antenna plus any building penetration loss. Therefore, these passive antennas should be used only in strong (outdoor) signal environments.
The active antennas (ANT585, MANT940, SS2000, TV25, SS3000) obviously had more gain due to the presence of a low-noise preamplifier that is built within the antenna structure. The preamplifier serves two purposes. First, it provides a low-noise front end that, assuming it has a gain of 10 dB or more, decreases the effective receiver noise figure (typically from a relatively high value of about 7 – 10 dB or higher to a low value of 3 - 4 dB). Second, it provides isolation between the typically poor antenna output impedance and the typically bad tuner input impedance, minimizing potentially severe reflections due to mismatches. The active antennas had UHF gains that ranged approximately between +11 dBd and +21 dBd. On average, the extra 10-20 dB of indoor antenna gain, assuming that the preamplifiers are robust enough (i.e., large IP3) to avoid overload and interference problems, will help the DTV receivers work in moderate DTV signal levels , even in the presence of severe multipath.
It should be noted that the comments in the paragraphs above consider only the net antenna maximum gain without regard to actual azimuth and elevation patterns that each antenna provides , nor the preamplifier specific performance such as gain, noise figure, and amount of interference robustness (IP3). Ease of antenna adjustability for the viewer is also another issue when considering antennas. The next section describes the antenna patterns in detail followed by the section on the preamplifier performance.
ANTENNA PATTERNS
For ease in comparison, all the measured antenna azimuth and elevation patterns are found in a series of plots contained within Appendix A. Antenna pattern data for high-VHF channels 7 and 12 are presented as well as data from UHF channels 18, 33, and 65. Each azimuth pattern plot contains both co-polarization and cross-polarization data. The same is true for each elevation pattern. By comparing the responses of the two polarizations as well as comparing the responses of the azimuth and elevation patterns at each desired channel, an idea of how well the antennas might work in various propagation conditions can be obtained.
The pattern plots themselves are the main data presented in this report, and can be studied by all interested parties from their own perspective and particular applications. However, from these plots, a number of general comments can be made.
1) Some antennas (Silver Sensor, SS1000, SS2000, DB2, SS3000) are very well-behaved directional UHF antennas with good front-to-back ratios (typically >10 dB) and good front-to-sidelobe ratios (>10 dB). These antennas can be used (after proper adjustment in a direction towards the maximum signal level) to reduce UHF multipath echoes as well as any analog or digital interference, assuming that the multipath and interfering signals are coming from a direction other than the one in which the antenna is pointed. This phenomenon can be observed by viewing their azimuth patterns and looking for a lobe that has a dominant response centered around some azimuth angle while all the other lobes are significantly below this peak value. These same five directional antennas also generally have good horizontal-to-vertical polarization separation (i.e., polarization isolation), which is observed when the cross-polarization (vertical polarization) azimuth pattern is at least 6-10 dB below the co-polarization (horizontal polarization) azimuth pattern, particularly at or near the peak of the azimuth pattern (main lobe) where the primary signal would be received after antenna adjustment. This fact may reduce some of the multipath from de-polarized signals that have been transformed from horizontal polarization into vertical polarization during propagation. Likewise, these particular antennas all have some amount of elevation pattern directionality to help reduce horizontally-polarized multipath coming from an angle above or below their horizontal plane.
MTVA Indoor Antenna Measurement Study
Meintel, Sgrignoli, & Wallace 16 01/23/2007
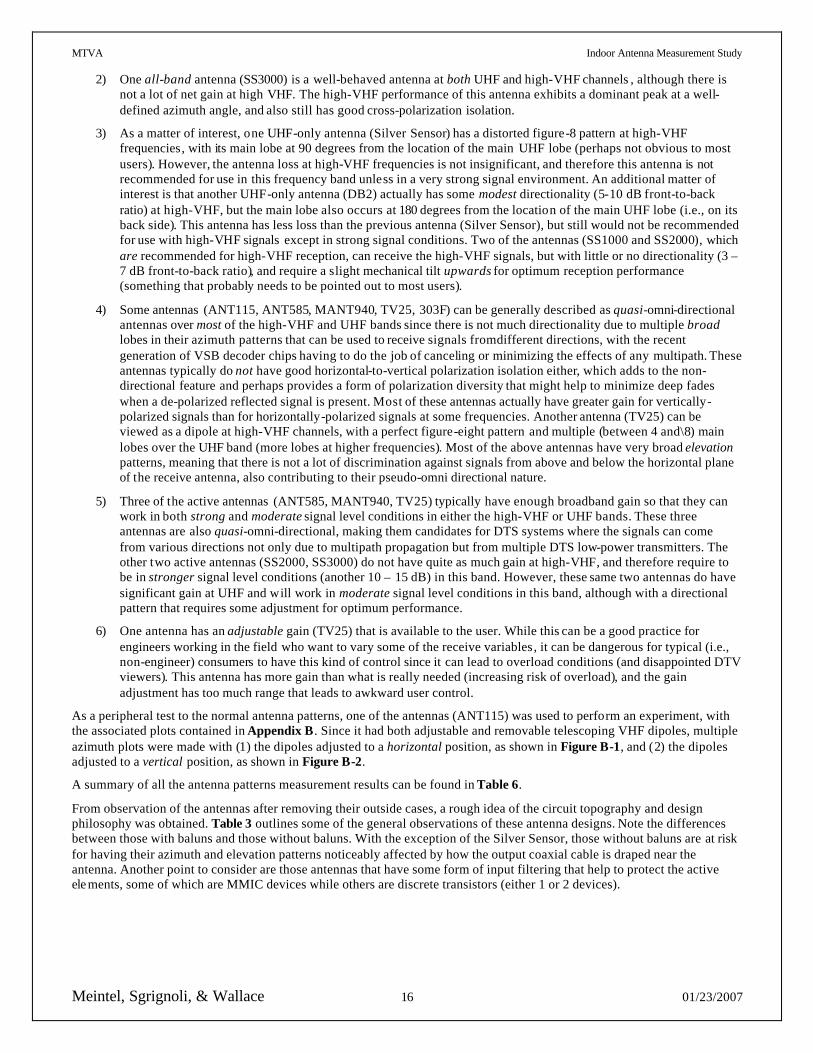
2) One all-band antenna (SS3000) is a well-behaved antenna at both UHF and high-VHF channels , although there is not a lot of net gain at high VHF. The high-VHF performance of this antenna exhibits a dominant peak at a well-defined azimuth angle, and also still has good cross-polarization isolation.
3) As a matter of interest, one UHF-only antenna (Silver Sensor) has a distorted figure-8 pattern at high-VHF frequencies, with its main lobe at 90 degrees from the location of the main UHF lobe (perhaps not obvious to most users). However, the antenna loss at high-VHF frequencies is not insignificant, and therefore this antenna is not recommended for use in this frequency band unless in a very strong signal environment. An additional matter of interest is that another UHF-only antenna (DB2) actually has some modest directionality (5-10 dB front-to-back ratio) at high-VHF, but the main lobe also occurs at 180 degrees from the location of the main UHF lobe (i.e., on its back side). This antenna has less loss than the previous antenna (Silver Sensor), but still would not be recommended for use with high-VHF signals except in strong signal conditions. Two of the antennas (SS1000 and SS2000), which are recommended for high-VHF reception, can receive the high-VHF signals, but with little or no directionality (3 – 7 dB front-to-back ratio), and require a slight mechanical tilt upwards for optimum reception performance (something that probably needs to be pointed out to most users).
4) Some antennas (ANT115, ANT585, MANT940, TV25, 303F) can be generally described as quasi-omni-directional antennas over most of the high-VHF and UHF bands since there is not much directionality due to multiple broad lobes in their azimuth patterns that can be used to receive signals from different directions, with the recent generation of VSB decoder chips having to do the job of canceling or minimizing the effects of any multipath. These antennas typically do not have good horizontal-to-vertical polarization isolation either, which adds to the non-directional feature and perhaps provides a form of polarization diversity that might help to minimize deep fades when a de-polarized reflected signal is present. Most of these antennas actually have greater gain for vertically-polarized signals than for horizontally-polarized signals at some frequencies. Another antenna (TV25) can be viewed as a dipole at high-VHF channels, with a perfect figure-eight pattern and multiple (between 4 and\8) main lobes over the UHF band (more lobes at higher frequencies). Most of the above antennas have very broad elevation patterns, meaning that there is not a lot of discrimination against signals from above and below the horizontal plane of the receive antenna, also contributing to their pseudo-omni directional nature.
5) Three of the active antennas (ANT585, MANT940, TV25) typically have enough broadband gain so that they can work in both strong and moderate signal level conditions in either the high-VHF or UHF bands. These three antennas are also quasi-omni-directional, making them candidates for DTS systems where the signals can come from various directions not only due to multipath propagation but from multiple DTS low-power transmitters. The other two active antennas (SS2000, SS3000) do not have quite as much gain at high-VHF, and therefore require to be in stronger signal level conditions (another 10 – 15 dB) in this band. However, these same two antennas do have significant gain at UHF and will work in moderate signal level conditions in this band, although with a directional pattern that requires some adjustment for optimum performance.
6) One antenna has an adjustable gain (TV25) that is available to the user. While this can be a good practice for engineers working in the field who want to vary some of the receive variables, it can be dangerous for typical (i.e., non-engineer) consumers to have this kind of control since it can lead to overload conditions (and disappointed DTV viewers). This antenna has more gain than what is really needed (increasing risk of overload), and the gain adjustment has too much range that leads to awkward user control.
As a peripheral test to the normal antenna patterns, one of the antennas (ANT115) was used to perform an experiment, with the associated plots contained in Appendix B . Since it had both adjustable and removable telescoping VHF dipoles, multiple azimuth plots were made with (1) the dipoles adjusted to a horizontal position, as shown in Figure B-1, and (2) the dipoles adjusted to a vertical position, as shown in Figure B-2.
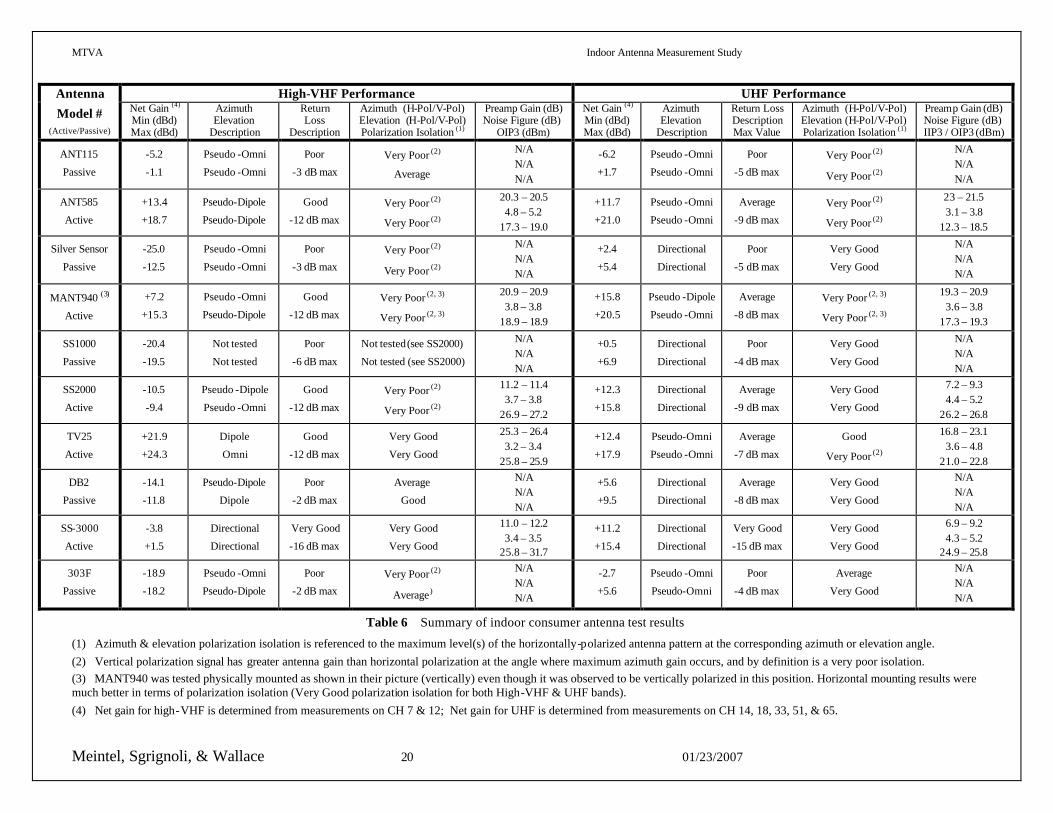
A summary of all the antenna patterns measurement results can be found in Table 6.
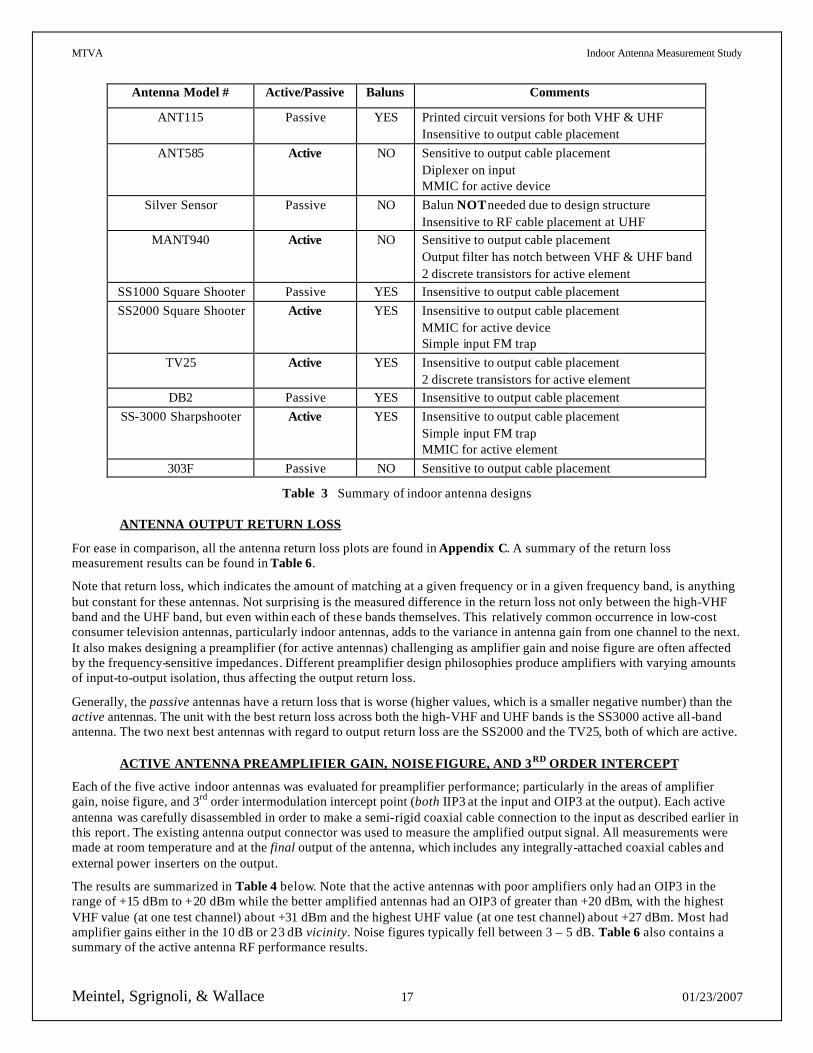
From observation of the antennas after removing their outside cases, a rough idea of the circuit topography and design philosophy was obtained. Table 3 outlines some of the general observations of these antenna designs. Note the differences between those with baluns and those without baluns. With the exception of the Silver Sensor, those without baluns are at risk for having their azimuth and elevation patterns noticeably affected by how the output coaxial cable is draped near the antenna. Another point to consider are those antennas that have some form of input filtering that help to protect the active elements, some of which are MMIC devices while others are discrete transistors (either 1 or 2 devices).
MTVA Indoor Antenna Measurement Study
Meintel, Sgrignoli, & Wallace 17 01/23/2007
Antenna Model # Active/Passive Baluns Comments
ANT115 Passive YES Printed circuit versions for both VHF & UHF Insensitive to output cable placement
ANT585 Active NO Sensitive to output cable placement Diplexer on input MMIC for active device
Silver Sensor Passive NO Balun NOT needed due to design structure Insensitive to RF cable placement at UHF
MANT940 Active NO Sensitive to output cable placement Output filter has notch between VHF & UHF band 2 discrete transistors for active element
SS1000 Square Shooter Passive YES Insensitive to output cable placement SS2000 Square Shooter Active YES Insensitive to output cable placement
MMIC for active device Simple input FM trap
TV25 Active YES Insensitive to output cable placement 2 discrete transistors for active element
DB2 Passive YES Insensitive to output cable placement SS-3000 Sharpshooter Active YES Insensitive to output cable placement
Simple input FM trap MMIC for active element
303F Passive NO Sensitive to output cable placement
Table 3 Summary of indoor antenna designs
ANTENNA OUTPUT RETURN LOSS
For ease in comparison, all the antenna return loss plots are found in Appendix C. A summary of the return loss measurement results can be found in Table 6.
Note that return loss, which indicates the amount of matching at a given frequency or in a given frequency band, is anything but constant for these antennas. Not surprising is the measured difference in the return loss not only between the high-VHF band and the UHF band, but even within each of these bands themselves. This relatively common occurrence in low-cost consumer television antennas, particularly indoor antennas, adds to the variance in antenna gain from one channel to the next. It also makes designing a preamplifier (for active antennas) challenging as amplifier gain and noise figure are often affected by the frequency-sensitive impedances. Different preamplifier design philosophies produce amplifiers with varying amounts of input-to-output isolation, thus affecting the output return loss.
Generally, the passive antennas have a return loss that is worse (higher values, which is a smaller negative number) than the active antennas. The unit with the best return loss across both the high-VHF and UHF bands is the SS3000 active all-band antenna. The two next best antennas with regard to output return loss are the SS2000 and the TV25, both of which are active.
ACTIVE ANTENNA PREAMPLIFIER GAIN, NOISE FIGURE, AND 3RD ORDER INTERCEPT
Each of the five active indoor antennas was evaluated for preamplifier performance; particularly in the areas of amplifier gain, noise figure, and 3rd order intermodulation intercept point (both IIP3 at the input and OIP3 at the output). Each active antenna was carefully disassembled in order to make a semi-rigid coaxial cable connection to the input as described earlier in this report. The existing antenna output connector was used to measure the amplified output signal. All measurements were made at room temperature and at the final output of the antenna, which includes any integrally-attached coaxial cables and external power inserters on the output.
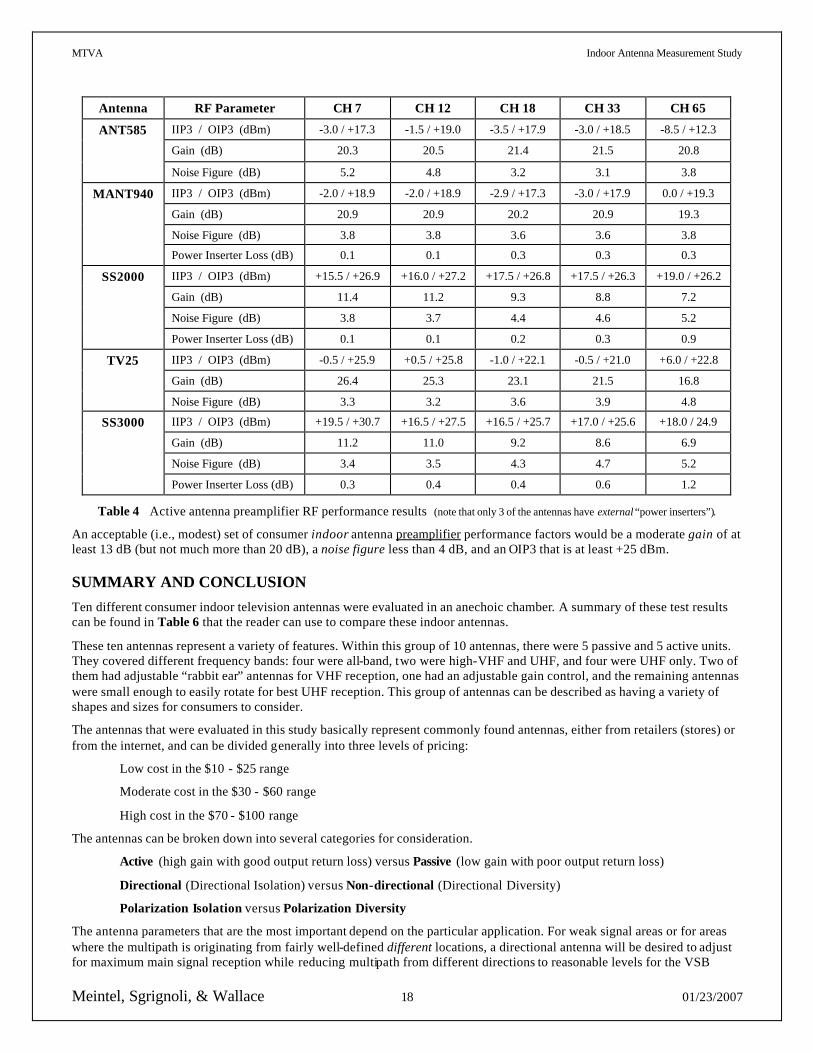
The results are summarized in Table 4 below. Note that the active antennas with poor amplifiers only had an OIP3 in the range of +15 dBm to +20 dBm while the better amplified antennas had an OIP3 of greater than +20 dBm, with the highest VHF value (at one test channel) about +31 dBm and the highest UHF value (at one test channel) about +27 dBm. Most had amplifier gains either in the 10 dB or 23 dB vicinity. Noise figures typically fell between 3 – 5 dB. Table 6 also contains a summary of the active antenna RF performance results.
MTVA Indoor Antenna Measurement Study
Meintel, Sgrignoli, & Wallace 18 01/23/2007
Antenna RF Parameter CH 7 CH 12 CH 18 CH 33 CH 65
IIP3 / OIP3 (dBm) -3.0 / +17.3 -1.5 / +19.0 -3.5 / +17.9 -3.0 / +18.5 -8.5 / +12.3
Gain (dB) 20.3 20.5 21.4 21.5 20.8
ANT585
Noise Figure (dB) 5.2 4.8 3.2 3.1 3.8
IIP3 / OIP3 (dBm) -2.0 / +18.9 -2.0 / +18.9 -2.9 / +17.3 -3.0 / +17.9 0.0 / +19.3
Gain (dB) 20.9 20.9 20.2 20.9 19.3
Noise Figure (dB) 3.8 3.8 3.6 3.6 3.8
MANT940
Power Inserter Loss (dB) 0.1 0.1 0.3 0.3 0.3
IIP3 / OIP3 (dBm) +15.5 / +26.9 +16.0 / +27.2 +17.5 / +26.8 +17.5 / +26.3 +19.0 / +26.2
Gain (dB) 11.4 11.2 9.3 8.8 7.2
Noise Figure (dB) 3.8 3.7 4.4 4.6 5.2
SS2000
Power Inserter Loss (dB) 0.1 0.1 0.2 0.3 0.9
IIP3 / OIP3 (dBm) -0.5 / +25.9 +0.5 / +25.8 -1.0 / +22.1 -0.5 / +21.0 +6.0 / +22.8
Gain (dB) 26.4 25.3 23.1 21.5 16.8
TV25
Noise Figure (dB) 3.3 3.2 3.6 3.9 4.8
IIP3 / OIP3 (dBm) +19.5 / +30.7 +16.5 / +27.5 +16.5 / +25.7 +17.0 / +25.6 +18.0 / 24.9
Gain (dB) 11.2 11.0 9.2 8.6 6.9
Noise Figure (dB) 3.4 3.5 4.3 4.7 5.2
SS3000
Power Inserter Loss (dB) 0.3 0.4 0.4 0.6 1.2
Table 4 Active antenna preamplifier RF performance results (note that only 3 of the antennas have external “power inserters”).
An acceptable (i.e., modest) set of consumer indoor antenna preamplifier performance factors would be a moderate gain of at least 13 dB (but not much more than 20 dB), a noise figure less than 4 dB, and an OIP3 that is at least +25 dBm.
SUMMARY AND CONCLUSION Ten different consumer indoor television antennas were evaluated in an anechoic chamber. A summary of these test results can be found in Table 6 that the reader can use to compare these indoor antennas.
These ten antennas represent a variety of features. Within this group of 10 antennas, there were 5 passive and 5 active units. They covered different frequency bands: four were all-band, two were high-VHF and UHF, and four were UHF only. Two of them had adjustable “rabbit ear” antennas for VHF reception, one had an adjustable gain control, and the remaining antennas were small enough to easily rotate for best UHF reception. This group of antennas can be described as having a variety of shapes and sizes for consumers to consider.
The antennas that were evaluated in this study basically represent commonly found antennas, either from retailers (stores) or from the internet, and can be divided generally into three levels of pricing:
Low cost in the $10 - $25 range
Moderate cost in the $30 - $60 range
High cost in the $70 - $100 range
The antennas can be broken down into several categories for consideration.
Active (high gain with good output return loss) versus Passive (low gain with poor output return loss)
Directional (Directional Isolation) versus Non-directional (Directional Diversity)
Polarization Isolation versus Polarization Diversity
The antenna parameters that are the most important depend on the particular application. For weak signal areas or for areas where the multipath is originating from fairly well-defined different locations, a directional antenna will be desired to adjust for maximum main signal reception while reducing multipath from different directions to reasonable levels for the VSB
MTVA Indoor Antenna Measurement Study
Meintel, Sgrignoli, & Wallace 19 01/23/2007
decoder to handle. Of course, under these conditions, it would be desirable to have all the desired DTV transmitters to be located in one general direction.
On the other hand, if the multipath is strong and generally coming from similar directions, even causing deep fades, then a non-directional antenna or one with polarization diversity might be a better choice. This may even be desirable in DTS situations where the distributed transmitters may be sending signals to potential receivers from greatly different direction than the main transmitter.
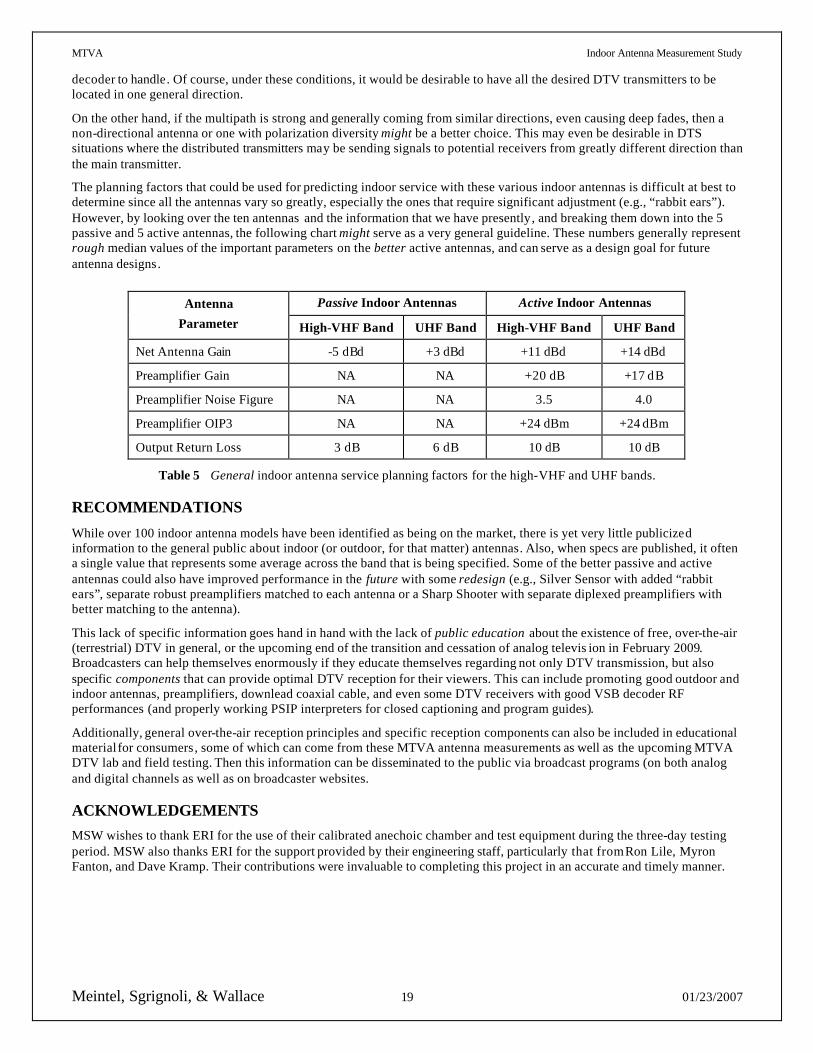
The planning factors that could be used for predicting indoor service with these various indoor antennas is difficult at best to determine since all the antennas vary so greatly, especially the ones that require significant adjustment (e.g., “rabbit ears”). However, by looking over the ten antennas and the information that we have presently, and breaking them down into the 5 passive and 5 active antennas, the following chart might serve as a very general guideline. These numbers generally represent rough median values of the important parameters on the better active antennas, and can serve as a design goal for future antenna designs.
Passive Indoor Antennas Active Indoor Antennas Antenna
Parameter High-VHF Band UHF Band High-VHF Band UHF Band
Net Antenna Gain -5 dBd +3 dBd +11 dBd +14 dBd
Preamplifier Gain NA NA +20 dB +17 dB
Preamplifier Noise Figure NA NA 3.5 4.0
Preamplifier OIP3 NA NA +24 dBm +24 dBm
Output Return Loss 3 dB 6 dB 10 dB 10 dB
Table 5 General indoor antenna service planning factors for the high-VHF and UHF bands.
RECOMMENDATIONS
While over 100 indoor antenna models have been identified as being on the market, there is yet very little publicized information to the general public about indoor (or outdoor, for that matter) antennas. Also, when specs are published, it often a single value that represents some average across the band that is being specified. Some of the better passive and active antennas could also have improved performance in the future with some redesign (e.g., Silver Sensor with added “rabbit ears”, separate robust preamplifiers matched to each antenna or a Sharp Shooter with separate diplexed preamplifiers with better matching to the antenna).
This lack of specific information goes hand in hand with the lack of public education about the existence of free, over-the-air (terrestrial) DTV in general, or the upcoming end of the transition and cessation of analog televis ion in February 2009. Broadcasters can help themselves enormously if they educate themselves regarding not only DTV transmission, but also specific components that can provide optimal DTV reception for their viewers. This can include promoting good outdoor and indoor antennas, preamplifiers, downlead coaxial cable, and even some DTV receivers with good VSB decoder RF performances (and properly working PSIP interpreters for closed captioning and program guides).
Additionally, general over-the-air reception principles and specific reception components can also be included in educational material for consumers, some of which can come from these MTVA antenna measurements as well as the upcoming MTVA DTV lab and field testing. Then this information can be disseminated to the public via broadcast programs (on both analog and digital channels as well as on broadcaster websites.
ACKNOWLEDGEMENTS MSW wishes to thank ERI for the use of their calibrated anechoic chamber and test equipment during the three-day testing period. MSW also thanks ERI for the support provided by their engineering staff, particularly that from Ron Lile, Myron Fanton, and Dave Kramp. Their contributions were invaluable to completing this project in an accurate and timely manner.
MTVA Indoor Antenna Measurement Study
Meintel, Sgrignoli, & Wallace 20 01/23/2007
High-VHF Performance UHF Performance Antenna
Model # (Active/Passive)
Net Gain (4) Min (dBd) Max (dBd)
Azimuth Elevation
Description
Return Loss
Description
Azimuth (H-Pol/V-Pol) Elevation (H-Pol/V-Pol) Polarization Isolation (1)
Preamp Gain (dB) Noise Figure (dB)
OIP3 (dBm)
Net Gain (4) Min (dBd) Max (dBd)
Azimuth Elevation
Description
Return Loss Description Max Value
Azimuth (H-Pol/V-Pol) Elevation (H-Pol/V-Pol) Polarization Isolation (1)
Preamp Gain (dB) Noise Figure (dB) IIP3 / OIP3 (dBm)
ANT115
Passive
-5.2
-1.1
Pseudo -Omni
Pseudo -Omni
Poor
-3 dB max
Very Poor (2)
Average
N/A N/A N/A
-6.2
+1.7
Pseudo -Omni
Pseudo -Omni
Poor
-5 dB max
Very Poor (2)
Very Poor (2)
N/A N/A N/A
ANT585
Active
+13.4
+18.7
Pseudo-Dipole
Pseudo-Dipole
Good
-12 dB max
Very Poor (2)
Very Poor (2)
20.3 – 20.5 4.8 – 5.2
17.3 – 19.0
+11.7
+21.0
Pseudo -Omni
Pseudo -Omni
Average
-9 dB max
Very Poor (2)
Very Poor (2)
23 – 21.5 3.1 – 3.8
12.3 – 18.5
Silver Sensor
Passive
-25.0
-12.5
Pseudo -Omni
Pseudo -Omni
Poor
-3 dB max
Very Poor (2)
Very Poor (2)
N/A N/A N/A
+2.4
+5.4
Directional
Directional
Poor
-5 dB max
Very Good
Very Good
N/A N/A N/A
MANT940 (3)
Active
+7.2
+15.3
Pseudo -Omni
Pseudo-Dipole
Good
-12 dB max
Very Poor (2, 3)
Very Poor (2, 3)
20.9 – 20.9 3.8 – 3.8
18.9 – 18.9
+15.8
+20.5
Pseudo -Dipole
Pseudo -Omni
Average
-8 dB max
Very Poor (2, 3)
Very Poor (2, 3)
19.3 – 20.9 3.6 – 3.8
17.3 – 19.3
SS1000
Passive
-20.4
-19.5
Not tested
Not tested
Poor
-6 dB max
Not tested (see SS2000)
Not tested (see SS2000)
N/A N/A N/A
+0.5
+6.9
Directional
Directional
Poor
-4 dB max
Very Good
Very Good
N/A N/A N/A
SS2000
Active
-10.5
-9.4
Pseudo -Dipole
Pseudo -Omni
Good
-12 dB max
Very Poor (2)
Very Poor (2)
11.2 – 11.4 3.7 – 3.8
26.9 – 27.2
+12.3
+15.8
Directional
Directional
Average
-9 dB max
Very Good
Very Good
7.2 – 9.3 4.4 – 5.2
26.2 – 26.8
TV25
Active
+21.9
+24.3
Dipole
Omni
Good
-12 dB max
Very Good
Very Good
25.3 – 26.4 3.2 – 3.4
25.8 – 25.9
+12.4
+17.9
Pseudo-Omni
Pseudo -Omni
Average
-7 dB max
Good
Very Poor (2)
16.8 – 23.1 3.6 – 4.8
21.0 – 22.8
DB2
Passive
-14.1
-11.8
Pseudo-Dipole
Dipole
Poor
-2 dB max
Average
Good
N/A N/A N/A
+5.6
+9.5
Directional
Directional
Average
-8 dB max
Very Good
Very Good
N/A N/A N/A
SS-3000
Active
-3.8
+1.5
Directional
Directional
Very Good
-16 dB max
Very Good
Very Good
11.0 – 12.2 3.4 – 3.5
25.8 – 31.7
+11.2
+15.4
Directional
Directional
Very Good
-15 dB max
Very Good
Very Good
6.9 – 9.2 4.3 – 5.2
24.9 – 25.8
303F
Passive
-18.9
-18.2
Pseudo -Omni
Pseudo-Dipole
Poor
-2 dB max
Very Poor (2)
Average )
N/A N/A N/A
-2.7
+5.6
Pseudo -Omni
Pseudo-Omni
Poor
-4 dB max
Average
Very Good
N/A N/A N/A
Table 6 Summary of indoor consumer antenna test results
(1) Azimuth & elevation polarization isolation is referenced to the maximum level(s) of the horizontally-polarized antenna pattern at the corresponding azimuth or elevation angle. (2) Vertical polarization signal has greater antenna gain than horizontal polarization at the angle where maximum azimuth gain occurs, and by definition is a very poor isolation. (3) MANT940 was tested physically mounted as shown in their picture (vertically) even though it was observed to be vertically polarized in this position. Horizontal mounting results were much better in terms of polarization isolation (Very Good polarization isolation for both High-VHF & UHF bands). (4) Net gain for high-VHF is determined from measurements on CH 7 & 12; Net gain for UHF is determined from measurements on CH 14, 18, 33, 51, & 65.

MTVA Indoor Antenna Measurement Study
Meintel, Sgrignoli, & Wallace 21 01/23/2007
APPENDIX A Azimuth and Elevation Antenna Patterns
The following plots contain the azimuth and elevation patterns for the ten indoor antennas tested in an anechoic chamber. Pattern testing was performed at 5 different channel frequencies: CH 7 (177 MHz), CH 12 (207 MHz), CH 18 (497 MHz), CH 33 (587 MHz), and CH 65 (779 MHz).
Both the azimuth pattern and the elevation pattern were measured and recorded for these ten antennas . All plots are in rectangular format, each one plotted from -180 degrees to +180 degrees. Zero degrees is defined as the antenna pointed straight into the on-coming electromagnetic wave with the antenna placed in its expected horizontally-polarized receive position. Each of the azimuth and elevation plots has two curves: co-polarization (horizontally-polarized electromagnetic source) and cross-polarization (vertically-polarized electromagnetic source).
Table 6 contains summary comments on these pattern plots.
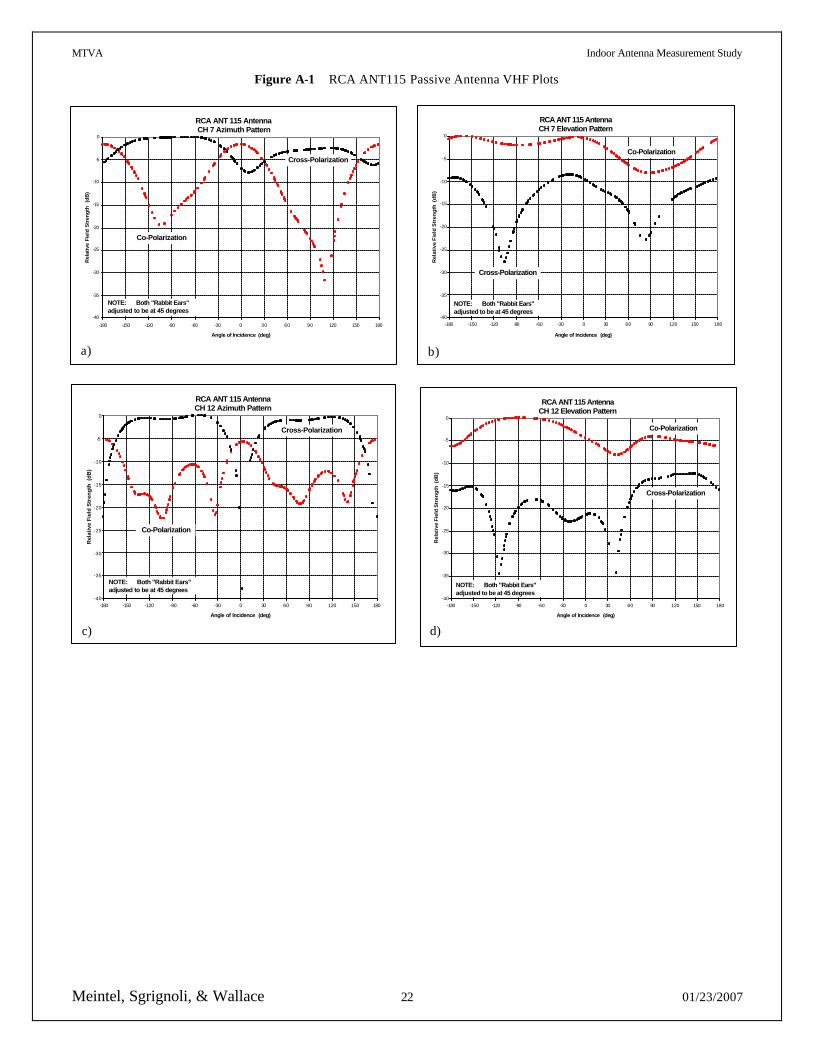
MTVA Indoor Antenna Measurement Study
Meintel, Sgrignoli, & Wallace 22 01/23/2007
Figure A-1 RCA ANT115 Passive Antenna VHF Plots
RCA ANT 115 Antenna CH 7 Elevation Pattern
-40
-35
-30
-25
-20
-15
-10
-5
0
-180 -150 -120 -90 -60 -30 0 30 60 90 120 150 180
Angle of Incidence (deg)
Rel
ativ
e F
ield
Str
eng
th (
dB
)
Co-Polarization
Cross-Polarization
NOTE: Both "Rabbit Ears" adjusted to be at 45 degrees
b)
RCA ANT 115 Antenna CH 12 Elevation Pattern
-40
-35
-30
-25
-20
-15
-10
-5
0
-180 -150 -120 -90 -60 -30 0 30 60 90 120 150 180
Angle of Incidence (deg)
Rel
ativ
e F
ield
Str
eng
th (
dB
)Co-Polarization
Cross-Polarization
NOTE: Both "Rabbit Ears" adjusted to be at 45 degrees
d)
RCA ANT 115 Antenna CH 7 Azimuth Pattern
-40
-35
-30
-25
-20
-15
-10
-5
0
-180 -150 -120 -90 -60 -30 0 30 60 90 120 150 180
Angle of Incidence (deg)
Rel
ativ
e Fi
eld
Str
engt
h (
dB)
Cross-Polarization
Co-Polarization
NOTE: Both "Rabbit Ears" adjusted to be at 45 degrees
a)
RCA ANT 115 Antenna CH 12 Azimuth Pattern
-40
-35
-30
-25
-20
-15
-10
-5
0
-180 -150 -120 -90 -60 -30 0 30 60 90 120 150 180
Angle of Incidence (deg)
Rel
ativ
e F
ield
Str
eng
th (
dB
)
Cross-Polarization
Co-Polarization
NOTE: Both "Rabbit Ears" adjusted to be at 45 degrees
c)
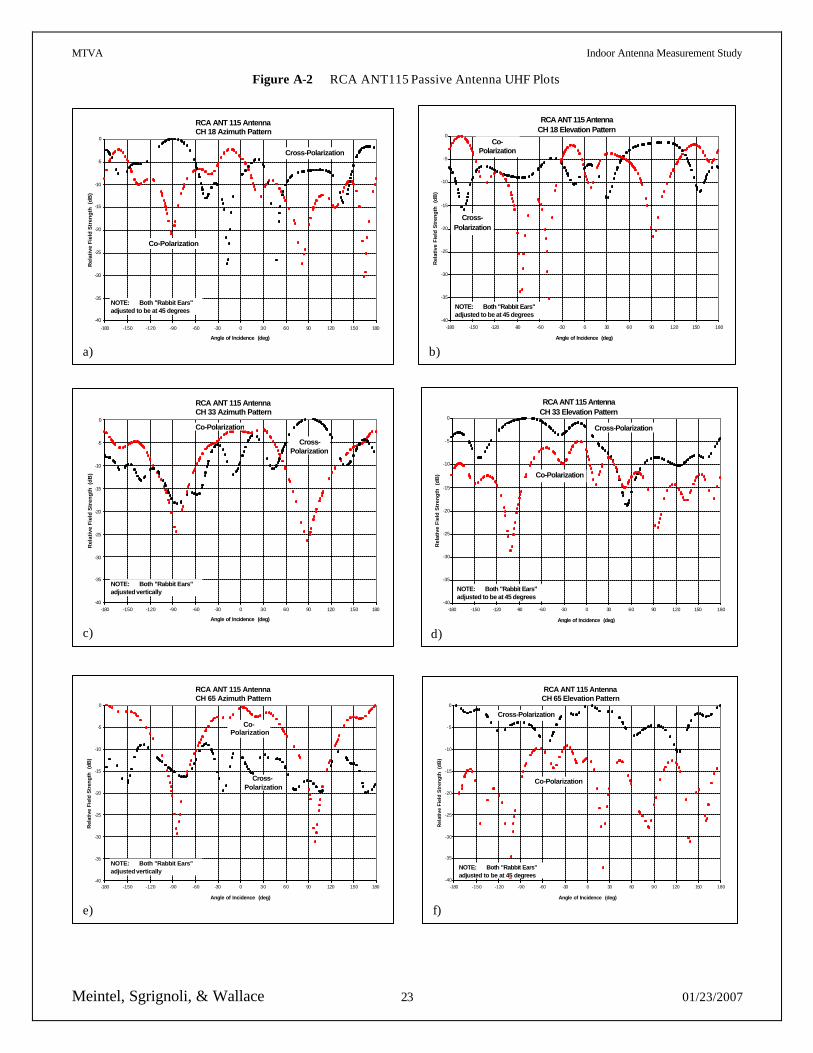
MTVA Indoor Antenna Measurement Study
Meintel, Sgrignoli, & Wallace 23 01/23/2007
Figure A-2 RCA ANT115 Passive Antenna UHF Plots
RCA ANT 115 Antenna CH 18 Elevation Pattern
-40
-35
-30
-25
-20
-15
-10
-5
0
-180 -150 -120 -90 -60 -30 0 30 60 90 120 150 180
Angle of Incidence (deg)
Rel
ativ
e F
ield
Str
eng
th
(dB
)
Cross-Polarization
Co-Polarization
NOTE: Both "Rabbit Ears" adjusted to be at 45 degrees
b)
RCA ANT 115 Antenna CH 65 Azimuth Pattern
-40
-35
-30
-25
-20
-15
-10
-5
0
-180 -150 -120 -90 -60 -30 0 30 60 90 120 150 180
Angle of Incidence (deg)
Rel
ativ
e Fi
eld
Str
engt
h (
dB)
Cross-Polarization
Co-Polarization
NOTE: Both "Rabbit Ears" adjusted vertically
e)
RCA ANT 115 Antenna CH 33 Elevation Pattern
-40
-35
-30
-25
-20
-15
-10
-5
0
-180 -150 -120 -90 -60 -30 0 30 60 90 120 150 180
Angle of Incidence (deg)
Rel
ativ
e F
ield
Str
eng
th
(dB
)Cross-Polarization
Co-Polarization
NOTE: Both "Rabbit Ears" adjusted to be at 45 degrees
d)
RCA ANT 115 Antenna CH 65 Elevation Pattern
-40
-35
-30
-25
-20
-15
-10
-5
0
-180 -150 -120 -90 -60 -30 0 30 60 90 120 150 180
Angle of Incidence (deg)
Rel
ativ
e F
ield
Str
eng
th (
dB
)
Cross-Polarization
Co-Polarization
NOTE: Both "Rabbit Ears" adjusted to be at 45 degrees
f)
RCA ANT 115 Antenna CH 33 Azimuth Pattern
-40
-35
-30
-25
-20
-15
-10
-5
0
-180 -150 -120 -90 -60 -30 0 30 60 90 120 150 180
Angle of Incidence (deg)
Rel
ativ
e F
ield
Str
eng
th (
dB
)
Cross-Polarization
Co-Polarization
NOTE: Both "Rabbit Ears" adjusted vertically
c)
RCA ANT 115 Antenna CH 18 Azimuth Pattern
-40
-35
-30
-25
-20
-15
-10
-5
0
-180 -150 -120 -90 -60 -30 0 30 60 90 120 150 180
Angle of Incidence (deg)
Rel
ativ
e F
ield
Str
eng
th (
dB
)
Cross-Polarization
Co-Polarization
NOTE: Both "Rabbit Ears" adjusted to be at 45 degrees
a)
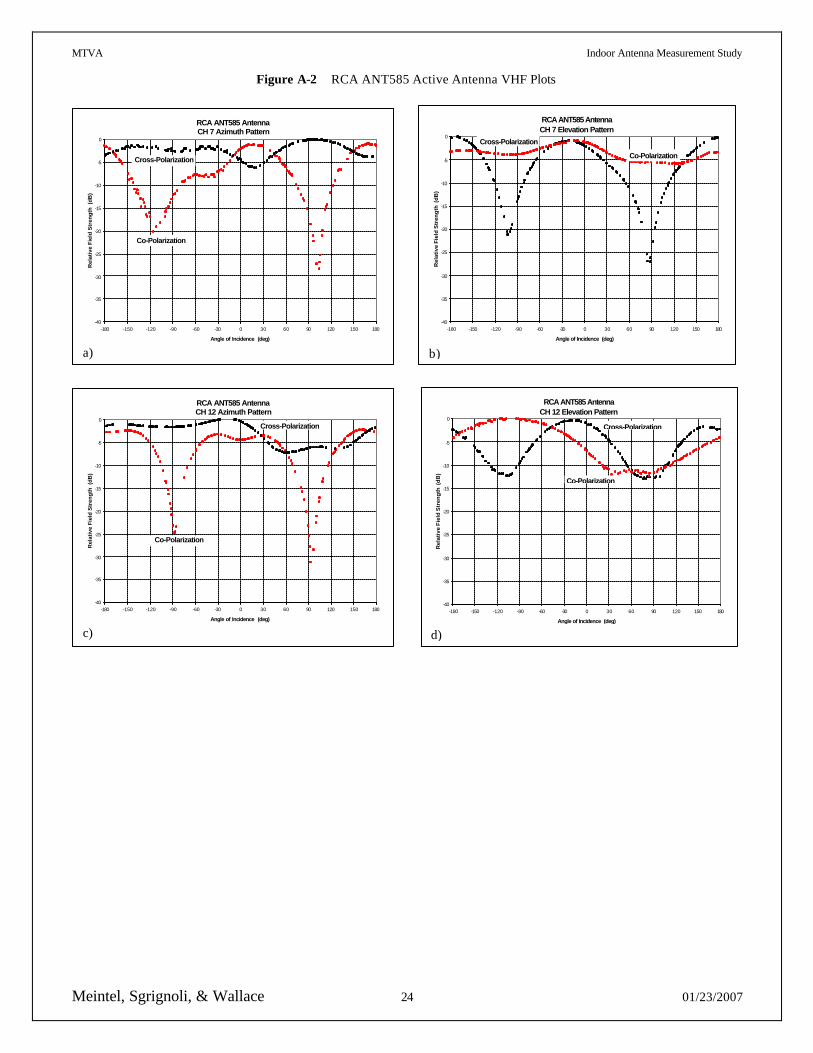
MTVA Indoor Antenna Measurement Study
Meintel, Sgrignoli, & Wallace 24 01/23/2007
Figure A-2 RCA ANT585 Active Antenna VHF Plots
RCA ANT585 Antenna CH 7 Elevation Pattern
-40
-35
-30
-25
-20
-15
-10
-5
0
-180 -150 -120 -90 -60 -30 0 30 60 90 120 150 180
Angle of Incidence (deg)
Rel
ativ
e F
ield
Str
eng
th (
dB
)
Co-Polarization
Cross-Polarization
b)
RCA ANT585 Antenna CH 12 Elevation Pattern
-40
-35
-30
-25
-20
-15
-10
-5
0
-180 -150 -120 -90 -60 -30 0 30 60 90 120 150 180
Angle of Incidence (deg)
Rel
ativ
e F
ield
Str
eng
th (
dB
)
Co-Polarization
Cross-Polarization
d)
RCA ANT585 Antenna CH 12 Azimuth Pattern
-40
-35
-30
-25
-20
-15
-10
-5
0
-180 -150 -120 -90 -60 -30 0 30 60 90 120 150 180
Angle of Incidence (deg)
Rel
ativ
e F
ield
Str
eng
th (
dB
)
Cross-Polarization
Co-Polarization
c)
RCA ANT585 Antenna CH 7 Azimuth Pattern
-40
-35
-30
-25
-20
-15
-10
-5
0
-180 -150 -120 -90 -60 -30 0 30 60 90 120 150 180
Angle of Incidence (deg)
Rel
ativ
e F
ield
Str
eng
th (
dB
)
Cross-Polarization
Co-Polarization
a)
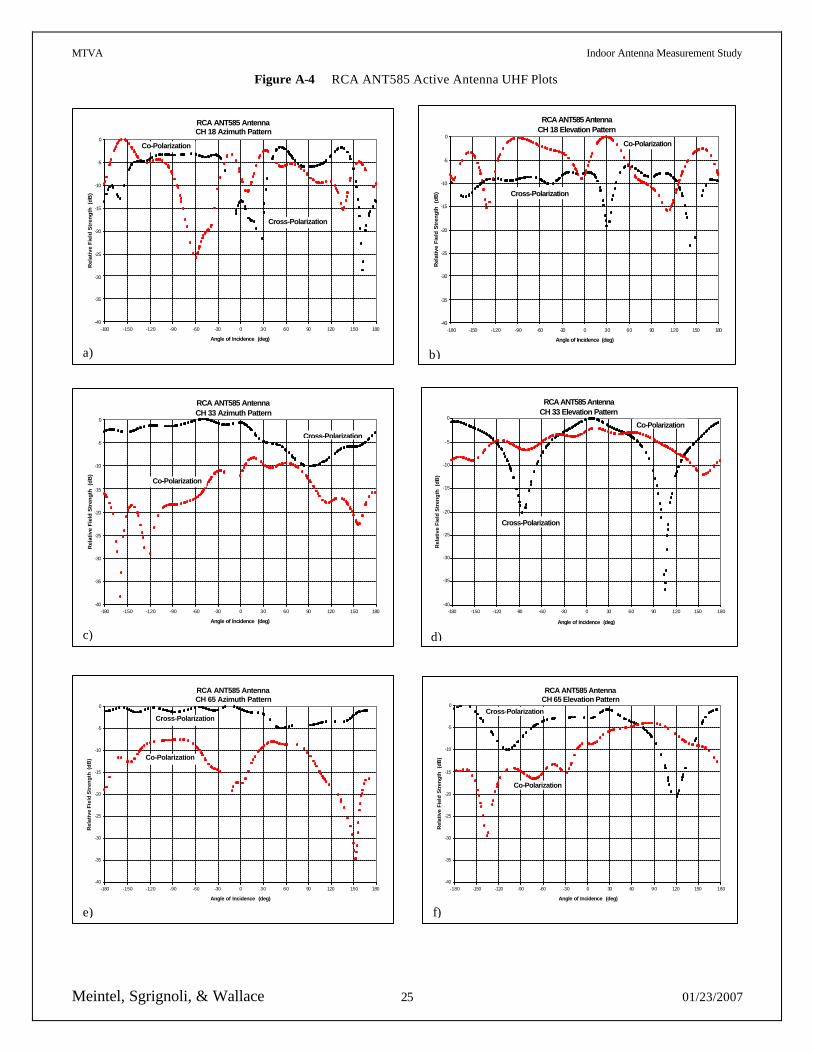
MTVA Indoor Antenna Measurement Study
Meintel, Sgrignoli, & Wallace 25 01/23/2007
Figure A-4 RCA ANT585 Active Antenna UHF Plots
RCA ANT585 Antenna CH 18 Elevation Pattern
-40
-35
-30
-25
-20
-15
-10
-5
0
-180 -150 -120 -90 -60 -30 0 30 60 90 120 150 180
Angle of Incidence (deg)
Rel
ativ
e Fi
eld
Str
engt
h (
dB)
Co-Polarization
Cross-Polarization
b)
RCA ANT585 Antenna CH 65 Azimuth Pattern
-40
-35
-30
-25
-20
-15
-10
-5
0
-180 -150 -120 -90 -60 -30 0 30 60 90 120 150 180
Angle of Incidence (deg)
Rel
ativ
e F
ield
Str
eng
th (
dB
)
Cross-Polarization
Co-Polarization
e)
RCA ANT585 Antenna CH 33 Elevation Pattern
-40
-35
-30
-25
-20
-15
-10
-5
0
-180 -150 -120 -90 -60 -30 0 30 60 90 120 150 180
Angle of Incidence (deg)
Rel
ativ
e F
ield
Str
eng
th (
dB
)
Co-Polarization
Cross-Polarization
d)
RCA ANT585 Antenna CH 65 Elevation Pattern
-40
-35
-30
-25
-20
-15
-10
-5
0
-180 -150 -120 -90 -60 -30 0 30 60 90 120 150 180
Angle of Incidence (deg)
Rel
ativ
e Fi
eld
Str
engt
h (
dB)
Co-Polarization
Cross-Polarization
f)
RCA ANT585 Antenna CH 33 Azimuth Pattern
-40
-35
-30
-25
-20
-15
-10
-5
0
-180 -150 -120 -90 -60 -30 0 30 60 90 120 150 180
Angle of Incidence (deg)
Rel
ativ
e Fi
eld
Str
engt
h (
dB)
Cross-Polarization
Co-Polarization
c)
RCA ANT585 Antenna CH 18 Azimuth Pattern
-40
-35
-30
-25
-20
-15
-10
-5
0
-180 -150 -120 -90 -60 -30 0 30 60 90 120 150 180
Angle of Incidence (deg)
Rel
ativ
e F
ield
Str
eng
th (
dB
)
Cross-Polarization
Co-Polarization
a)
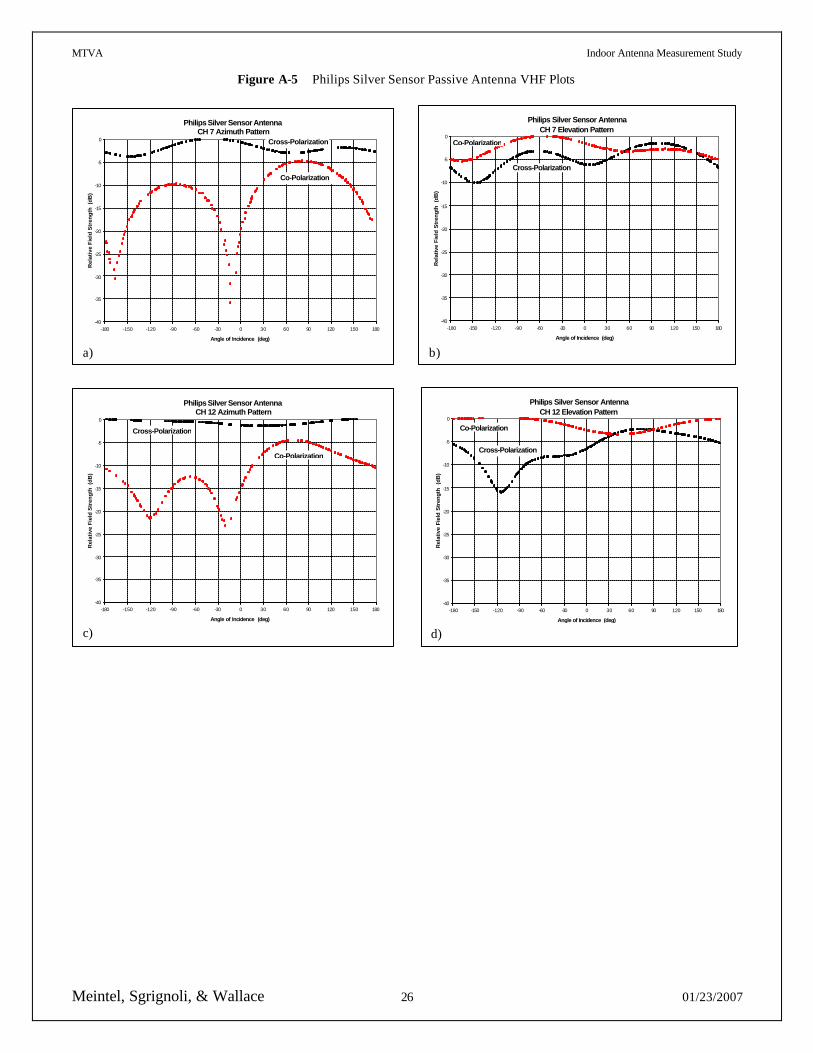
MTVA Indoor Antenna Measurement Study
Meintel, Sgrignoli, & Wallace 26 01/23/2007
Figure A-5 Philips Silver Sensor Passive Antenna VHF Plots
Philips Silver Sensor Antenna CH 7 Elevation Pattern
-40
-35
-30
-25
-20
-15
-10
-5
0
-180 -150 -120 -90 -60 -30 0 30 60 90 120 150 180
Angle of Incidence (deg)
Rel
ativ
e Fi
eld
Str
engt
h (
dB)
Co-Polarization
Cross-Polarization
b)
Philips Silver Sensor Antenna CH 12 Elevation Pattern
-40
-35
-30
-25
-20
-15
-10
-5
0
-180 -150 -120 -90 -60 -30 0 30 60 90 120 150 180
Angle of Incidence (deg)
Rel
ativ
e Fi
eld
Str
engt
h (
dB)
Co-Polarization
Cross-Polarization
d)
Philips Silver Sensor Antenna CH 12 Azimuth Pattern
-40
-35
-30
-25
-20
-15
-10
-5
0
-180 -150 -120 -90 -60 -30 0 30 60 90 120 150 180
Angle of Incidence (deg)
Rel
ativ
e F
ield
Str
eng
th (
dB
)
Cross-Polarization
Co-Polarization
c)
Philips Silver Sensor Antenna CH 7 Azimuth Pattern
-40
-35
-30
-25
-20
-15
-10
-5
0
-180 -150 -120 -90 -60 -30 0 30 60 90 120 150 180
Angle of Incidence (deg)
Rel
ativ
e F
ield
Str
eng
th (
dB
)
Cross-Polarization
Co-Polarization
a)
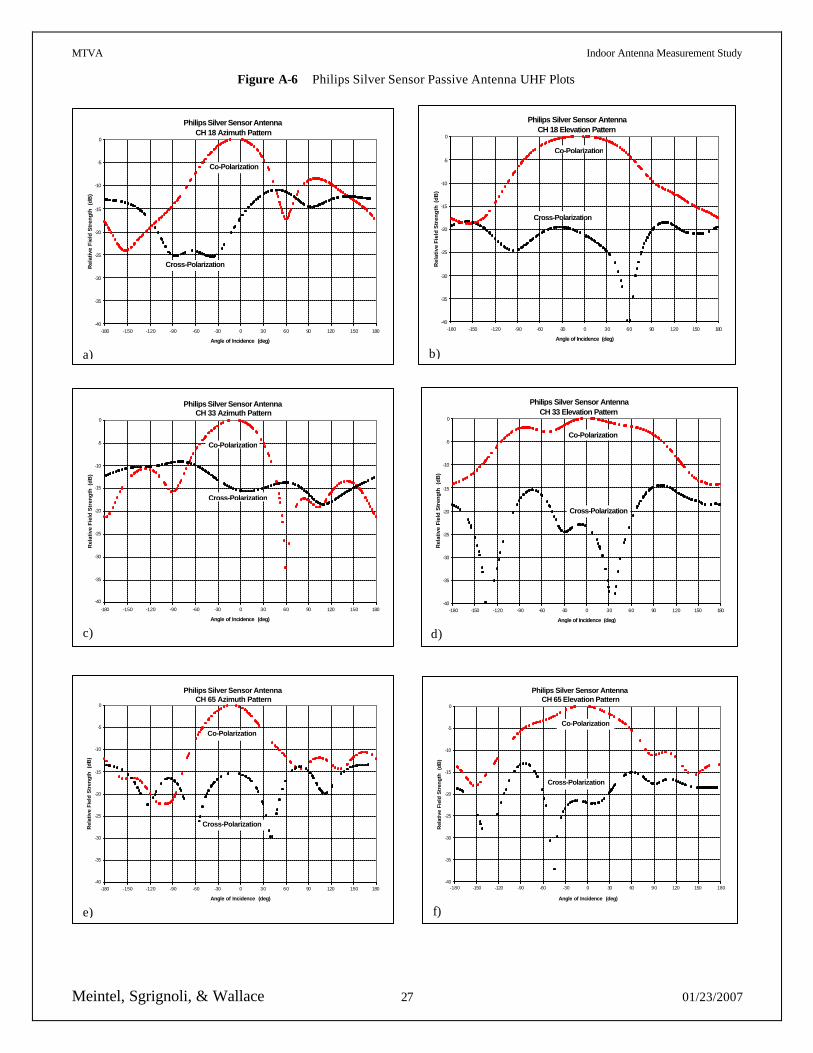
MTVA Indoor Antenna Measurement Study
Meintel, Sgrignoli, & Wallace 27 01/23/2007
Figure A-6 Philips Silver Sensor Passive Antenna UHF Plots
Philips Silver Sensor Antenna CH 18 Elevation Pattern
-40
-35
-30
-25
-20
-15
-10
-5
0
-180 -150 -120 -90 -60 -30 0 30 60 90 120 150 180
Angle of Incidence (deg)
Rel
ativ
e F
ield
Str
eng
th (
dB
)
Cross-Polarization
Co-Polarization
b)
Philips Silver Sensor Antenna CH 65 Azimuth Pattern
-40
-35
-30
-25
-20
-15
-10
-5
0
-180 -150 -120 -90 -60 -30 0 30 60 90 120 150 180
Angle of Incidence (deg)
Rel
ativ
e Fi
eld
Str
engt
h (
dB)
Cross-Polarization
Co-Polarization
e)
Philips Silver Sensor Antenna CH 33 Elevation Pattern
-40
-35
-30
-25
-20
-15
-10
-5
0
-180 -150 -120 -90 -60 -30 0 30 60 90 120 150 180
Angle of Incidence (deg)
Rel
ativ
e Fi
eld
Str
engt
h (
dB)
Cross-Polarization
Co-Polarization
d)
Philips Silver Sensor Antenna CH 65 Elevation Pattern
-40
-35
-30
-25
-20
-15
-10
-5
0
-180 -150 -120 -90 -60 -30 0 30 60 90 120 150 180
Angle of Incidence (deg)
Rel
ativ
e Fi
eld
Str
engt
h (
dB)
Cross-Polarization
Co-Polarization
f)
Philips Silver Sensor Antenna CH 33 Azimuth Pattern
-40
-35
-30
-25
-20
-15
-10
-5
0
-180 -150 -120 -90 -60 -30 0 30 60 90 120 150 180
Angle of Incidence (deg)
Rel
ativ
e F
ield
Str
eng
th (
dB
)
Cross-Polarization
Co-Polarization
c)
Philips Silver Sensor Antenna CH 18 Azimuth Pattern
-40
-35
-30
-25
-20
-15
-10
-5
0
-180 -150 -120 -90 -60 -30 0 30 60 90 120 150 180
Angle of Incidence (deg)
Rel
ativ
e Fi
eld
Str
engt
h (
dB)
Cross-Polarization
Co-Polarization
a)
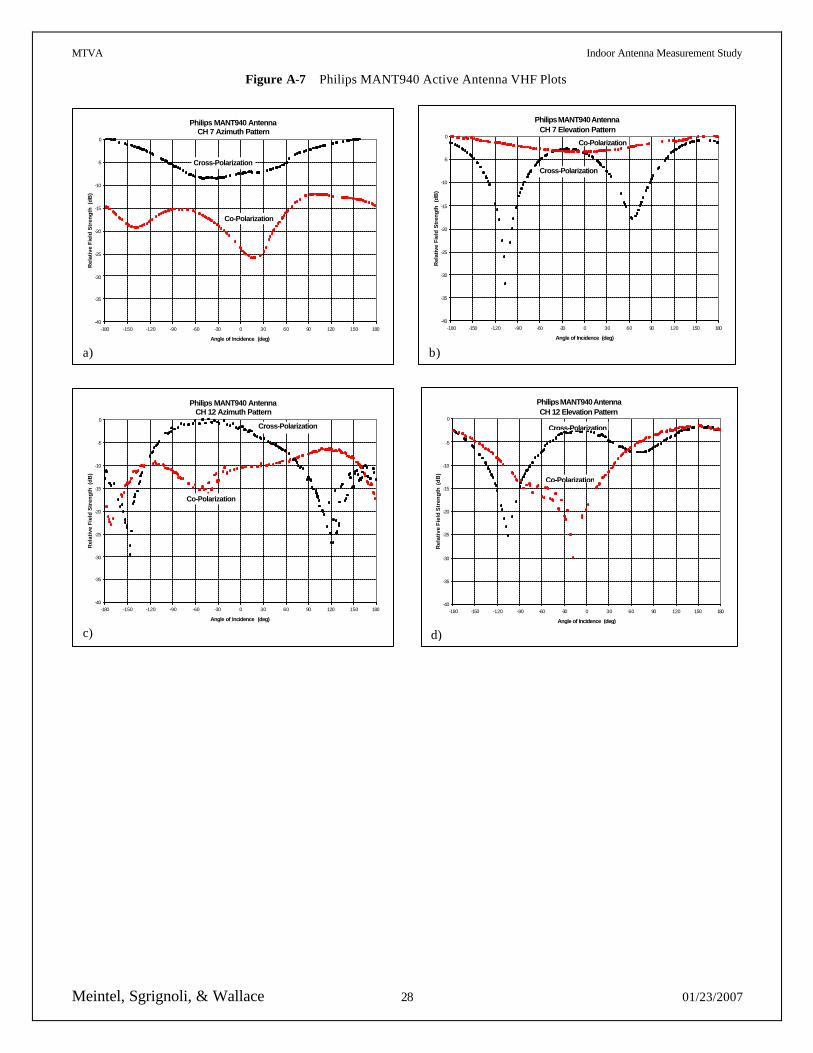
MTVA Indoor Antenna Measurement Study
Meintel, Sgrignoli, & Wallace 28 01/23/2007
Figure A-7 Philips MANT940 Active Antenna VHF Plots
Philips MANT940 Antenna CH 7 Elevation Pattern
-40
-35
-30
-25
-20
-15
-10
-5
0
-180 -150 -120 -90 -60 -30 0 30 60 90 120 150 180
Angle of Incidence (deg)
Rel
ativ
e Fi
eld
Str
engt
h (
dB)
Co-Polarization
Cross-Polarization
b)
Philips MANT940 Antenna CH 12 Elevation Pattern
-40
-35
-30
-25
-20
-15
-10
-5
0
-180 -150 -120 -90 -60 -30 0 30 60 90 120 150 180
Angle of Incidence (deg)
Rel
ativ
e F
ield
Str
eng
th (
dB
)
Co-Polarization
Cross-Polarization
d)
Philips MANT940 Antenna CH 12 Azimuth Pattern
-40
-35
-30
-25
-20
-15
-10
-5
0
-180 -150 -120 -90 -60 -30 0 30 60 90 120 150 180
Angle of Incidence (deg)
Rel
ativ
e F
ield
Str
eng
th (
dB
)
Cross-Polarization
Co-Polarization
c)
Philips MANT940 Antenna CH 7 Azimuth Pattern
-40
-35
-30
-25
-20
-15
-10
-5
0
-180 -150 -120 -90 -60 -30 0 30 60 90 120 150 180
Angle of Incidence (deg)
Rel
ativ
e F
ield
Str
eng
th (
dB
)
Cross-Polarization
Co-Polarization
a)
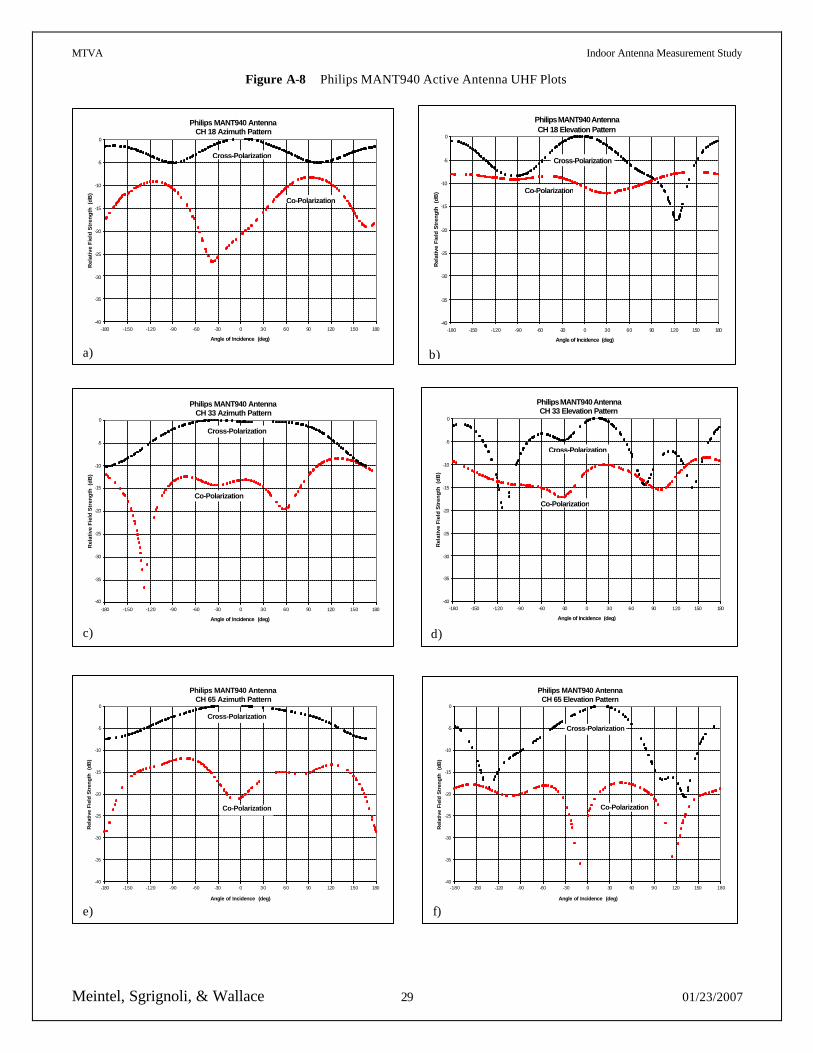
MTVA Indoor Antenna Measurement Study
Meintel, Sgrignoli, & Wallace 29 01/23/2007
Figure A-8 Philips MANT940 Active Antenna UHF Plots
Philips MANT940 Antenna CH 18 Elevation Pattern
-40
-35
-30
-25
-20
-15
-10
-5
0
-180 -150 -120 -90 -60 -30 0 30 60 90 120 150 180
Angle of Incidence (deg)
Rel
ativ
e Fi
eld
Str
engt
h (
dB) Co-Polarization
Cross-Polarization
b)
Philips MANT940 Antenna CH 65 Azimuth Pattern
-40
-35
-30
-25
-20
-15
-10
-5
0
-180 -150 -120 -90 -60 -30 0 30 60 90 120 150 180
Angle of Incidence (deg)
Rel
ativ
e Fi
eld
Str
engt
h (
dB)
Cross-Polarization
Co-Polarization
e)
Philips MANT940 Antenna CH 33 Elevation Pattern
-40
-35
-30
-25
-20
-15
-10
-5
0
-180 -150 -120 -90 -60 -30 0 30 60 90 120 150 180
Angle of Incidence (deg)
Rel
ativ
e F
ield
Str
eng
th (
dB
)
Co-Polarization
Cross-Polarization
d)
Philips MANT940 Antenna CH 65 Elevation Pattern
-40
-35
-30
-25
-20
-15
-10
-5
0
-180 -150 -120 -90 -60 -30 0 30 60 90 120 150 180
Angle of Incidence (deg)
Rel
ativ
e Fi
eld
Str
engt
h (
dB)
Co-Polarization
Cross-Polarization
f)
Philips MANT940 Antenna CH 33 Azimuth Pattern
-40
-35
-30
-25
-20
-15
-10
-5
0
-180 -150 -120 -90 -60 -30 0 30 60 90 120 150 180
Angle of Incidence (deg)
Rel
ativ
e F
ield
Str
eng
th (
dB
)
Cross-Polarization
Co-Polarization
c)
Philips MANT940 Antenna CH 18 Azimuth Pattern
-40
-35
-30
-25
-20
-15
-10
-5
0
-180 -150 -120 -90 -60 -30 0 30 60 90 120 150 180
Angle of Incidence (deg)
Rel
ativ
e F
ield
Str
eng
th (
dB
)
Cross-Polarization
Co-Polarization
a)

MTVA Indoor Antenna Measurement Study
Meintel, Sgrignoli, & Wallace 30 01/23/2007
Figure A-9 Winegard SS1000 Passive Antenna VHF Plots
b) Not Measured – See SS2000 High-VHF Plots
d) Not Measured – See SS2000 High-VHF Plots c) Not Measured – See SS2000 High-VHF Plots
a) Not Measured – See SS2000 High-VHF Plots
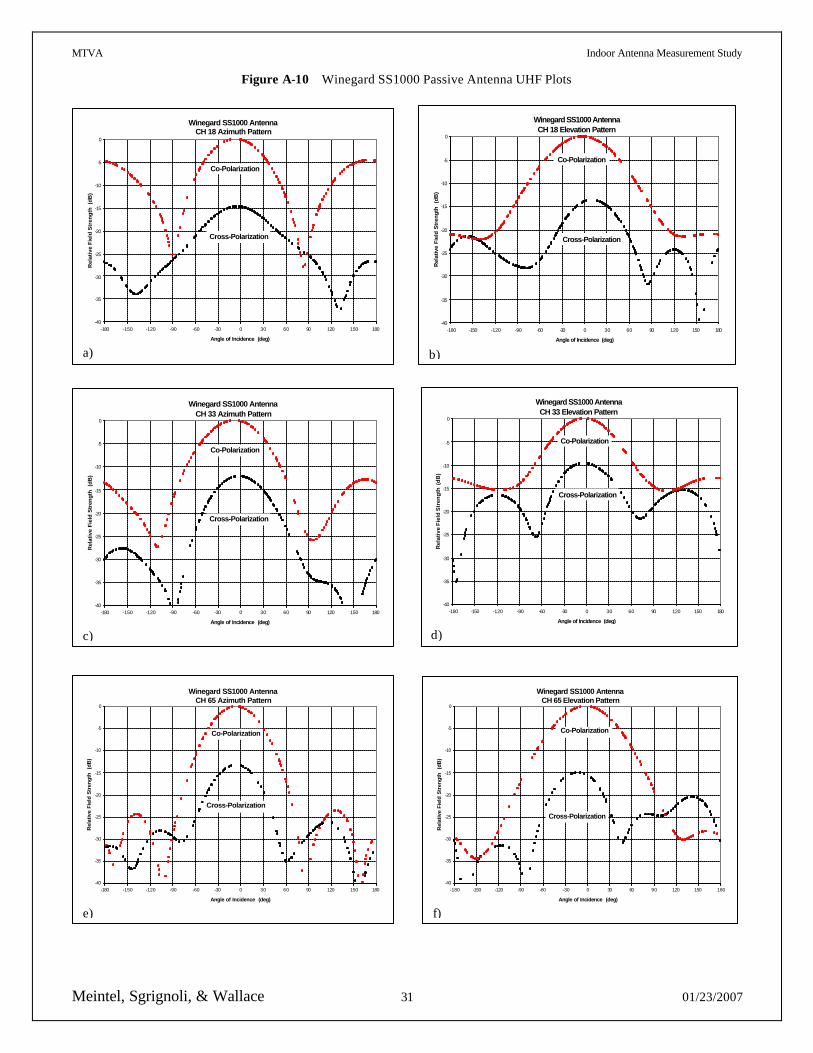
MTVA Indoor Antenna Measurement Study
Meintel, Sgrignoli, & Wallace 31 01/23/2007
Figure A-10 Winegard SS1000 Passive Antenna UHF Plots
Winegard SS1000 Antenna CH 18 Elevation Pattern
-40
-35
-30
-25
-20
-15
-10
-5
0
-180 -150 -120 -90 -60 -30 0 30 60 90 120 150 180
Angle of Incidence (deg)
Rel
ativ
e Fi
eld
Str
engt
h (
dB)
Cross-Polarization
Co-Polarization
b)
Winegard SS1000 Antenna CH 65 Azimuth Pattern
-40
-35
-30
-25
-20
-15
-10
-5
0
-180 -150 -120 -90 -60 -30 0 30 60 90 120 150 180
Angle of Incidence (deg)
Rel
ativ
e Fi
eld
Str
engt
h (
dB)
Cross-Polarization
Co-Polarization
e)
Winegard SS1000 Antenna CH 33 Elevation Pattern
-40
-35
-30
-25
-20
-15
-10
-5
0
-180 -150 -120 -90 -60 -30 0 30 60 90 120 150 180
Angle of Incidence (deg)
Rel
ativ
e F
ield
Str
eng
th (
dB
)
Cross-Polarization
Co-Polarization
d)
Winegard SS1000 Antenna CH 65 Elevation Pattern
-40
-35
-30
-25
-20
-15
-10
-5
0
-180 -150 -120 -90 -60 -30 0 30 60 90 120 150 180
Angle of Incidence (deg)
Rel
ativ
e Fi
eld
Str
engt
h (
dB)
Cross-Polarization
Co-Polarization
f)
Winegard SS1000 Antenna CH 33 Azimuth Pattern
-40
-35
-30
-25
-20
-15
-10
-5
0
-180 -150 -120 -90 -60 -30 0 30 60 90 120 150 180
Angle of Incidence (deg)
Rel
ativ
e Fi
eld
Str
engt
h (
dB)
Cross-Polarization
Co-Polarization
c)
Winegard SS1000 Antenna CH 18 Azimuth Pattern
-40
-35
-30
-25
-20
-15
-10
-5
0
-180 -150 -120 -90 -60 -30 0 30 60 90 120 150 180
Angle of Incidence (deg)
Rel
ativ
e F
ield
Str
eng
th (
dB
)
Cross-Polarization
Co-Polarization
a)
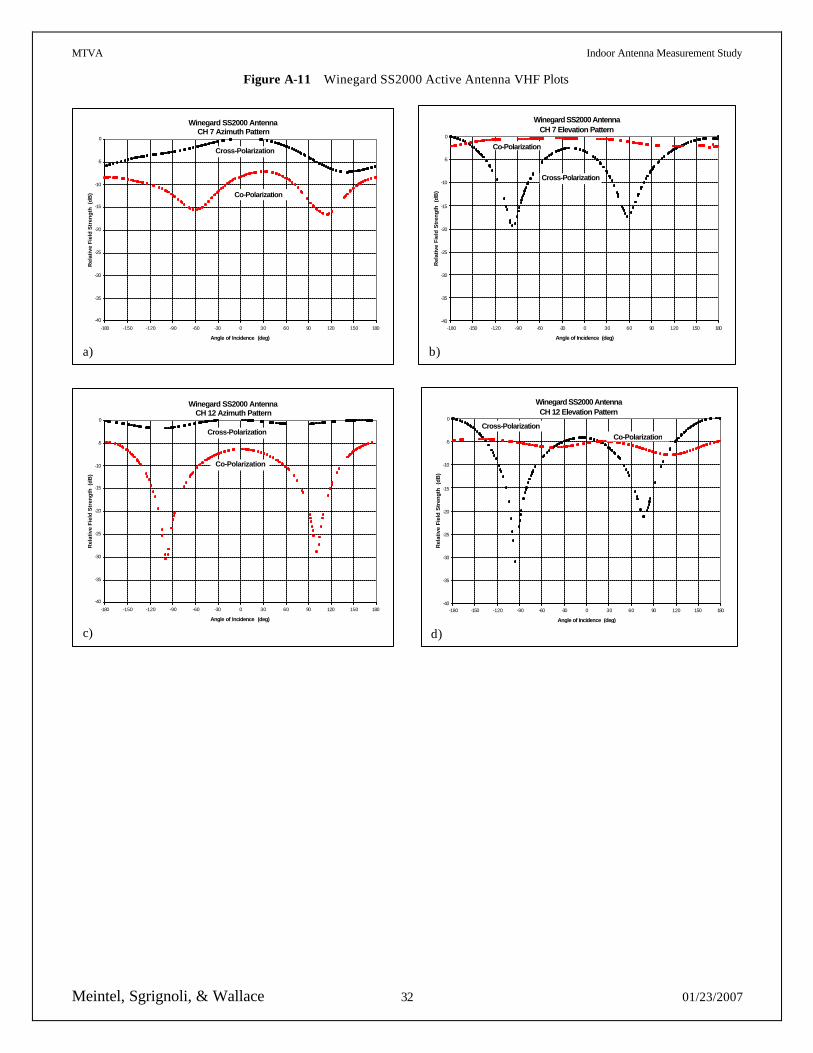
MTVA Indoor Antenna Measurement Study
Meintel, Sgrignoli, & Wallace 32 01/23/2007
Figure A-11 Winegard SS2000 Active Antenna VHF Plots
Winegard SS2000 Antenna CH 7 Elevation Pattern
-40
-35
-30
-25
-20
-15
-10
-5
0
-180 -150 -120 -90 -60 -30 0 30 60 90 120 150 180
Angle of Incidence (deg)
Rel
ativ
e Fi
eld
Str
engt
h (
dB)
Co-Polarization
Cross-Polarization
b)
Winegard SS2000 Antenna CH 12 Elevation Pattern
-40
-35
-30
-25
-20
-15
-10
-5
0
-180 -150 -120 -90 -60 -30 0 30 60 90 120 150 180
Angle of Incidence (deg)
Rel
ativ
e Fi
eld
Str
engt
h (
dB)
Co-PolarizationCross-Polarization
d)
Winegard SS2000 Antenna CH 12 Azimuth Pattern
-40
-35
-30
-25
-20
-15
-10
-5
0
-180 -150 -120 -90 -60 -30 0 30 60 90 120 150 180
Angle of Incidence (deg)
Rel
ativ
e F
ield
Str
eng
th (
dB
)
Cross-Polarization
Co-Polarization
c)
Winegard SS2000 Antenna CH 7 Azimuth Pattern
-40
-35
-30
-25
-20
-15
-10
-5
0
-180 -150 -120 -90 -60 -30 0 30 60 90 120 150 180
Angle of Incidence (deg)
Rel
ativ
e F
ield
Str
eng
th (
dB
)
Cross-Polarization
Co-Polarization
a)
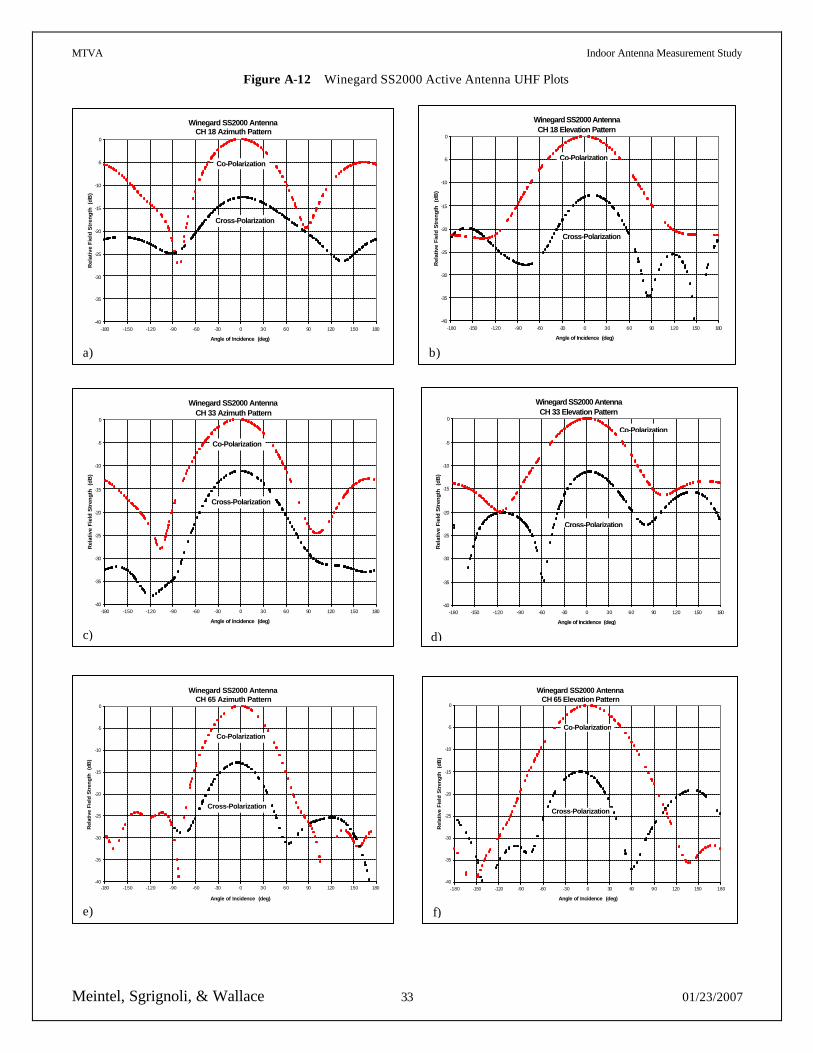
MTVA Indoor Antenna Measurement Study
Meintel, Sgrignoli, & Wallace 33 01/23/2007
Figure A-12 Winegard SS2000 Active Antenna UHF Plots
Winegard SS2000 Antenna CH 18 Elevation Pattern
-40
-35
-30
-25
-20
-15
-10
-5
0
-180 -150 -120 -90 -60 -30 0 30 60 90 120 150 180
Angle of Incidence (deg)
Rel
ativ
e Fi
eld
Str
engt
h (
dB)
Cross-Polarization
Co-Polarization
b)
Winegard SS2000 Antenna CH 65 Azimuth Pattern
-40
-35
-30
-25
-20
-15
-10
-5
0
-180 -150 -120 -90 -60 -30 0 30 60 90 120 150 180
Angle of Incidence (deg)
Rel
ativ
e Fi
eld
Str
engt
h (
dB)
Cross-Polarization
Co-Polarization
e)
Winegard SS2000 Antenna CH 33 Elevation Pattern
-40
-35
-30
-25
-20
-15
-10
-5
0
-180 -150 -120 -90 -60 -30 0 30 60 90 120 150 180
Angle of Incidence (deg)
Rel
ativ
e Fi
eld
Str
engt
h (
dB)
Cross-Polarization
Co-Polarization
d)
Winegard SS2000 Antenna CH 65 Elevation Pattern
-40
-35
-30
-25
-20
-15
-10
-5
0
-180 -150 -120 -90 -60 -30 0 30 60 90 120 150 180
Angle of Incidence (deg)
Rel
ativ
e Fi
eld
Str
engt
h (
dB)
Cross-Polarization
Co-Polarization
f)
Winegard SS2000 Antenna CH 33 Azimuth Pattern
-40
-35
-30
-25
-20
-15
-10
-5
0
-180 -150 -120 -90 -60 -30 0 30 60 90 120 150 180
Angle of Incidence (deg)
Rel
ativ
e Fi
eld
Str
engt
h (
dB)
Cross-Polarization
Co-Polarization
c)
Winegard SS2000 Antenna CH 18 Azimuth Pattern
-40
-35
-30
-25
-20
-15
-10
-5
0
-180 -150 -120 -90 -60 -30 0 30 60 90 120 150 180
Angle of Incidence (deg)
Rel
ativ
e F
ield
Str
eng
th (
dB
)
Cross-Polarization
Co-Polarization
a)
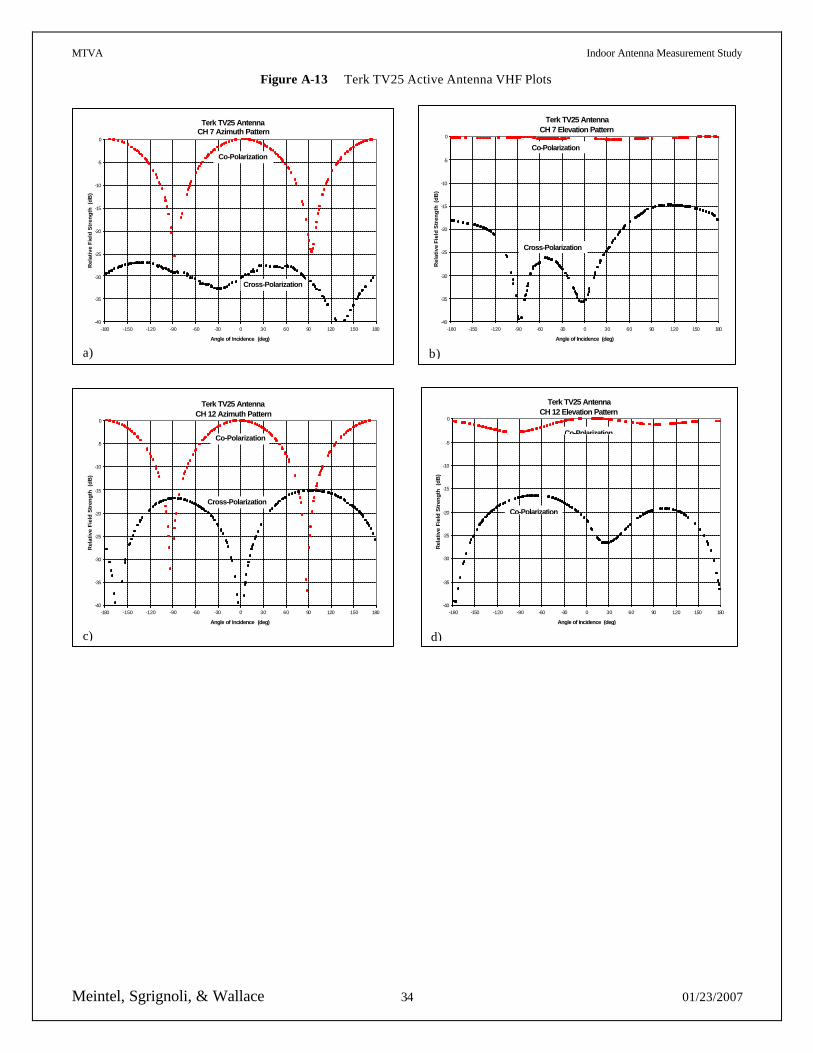
MTVA Indoor Antenna Measurement Study
Meintel, Sgrignoli, & Wallace 34 01/23/2007
Figure A-13 Terk TV25 Active Antenna VHF Plots
Terk TV25 Antenna CH 7 Elevation Pattern
-40
-35
-30
-25
-20
-15
-10
-5
0
-180 -150 -120 -90 -60 -30 0 30 60 90 120 150 180
Angle of Incidence (deg)
Rel
ativ
e F
ield
Str
eng
th (
dB
)
Co-Polarization
Cross-Polarization
b)
Terk TV25 Antenna CH 12 Elevation Pattern
-40
-35
-30
-25
-20
-15
-10
-5
0
-180 -150 -120 -90 -60 -30 0 30 60 90 120 150 180
Angle of Incidence (deg)
Rel
ativ
e Fi
eld
Str
engt
h (
dB)
Co-Polarization
Co-Polarization
d)
Terk TV25 Antenna CH 12 Azimuth Pattern
-40
-35
-30
-25
-20
-15
-10
-5
0
-180 -150 -120 -90 -60 -30 0 30 60 90 120 150 180
Angle of Incidence (deg)
Rel
ativ
e Fi
eld
Str
engt
h (
dB)
Cross-Polarization
Co-Polarization
c)
Terk TV25 Antenna CH 7 Azimuth Pattern
-40
-35
-30
-25
-20
-15
-10
-5
0
-180 -150 -120 -90 -60 -30 0 30 60 90 120 150 180
Angle of Incidence (deg)
Rel
ativ
e F
ield
Str
eng
th (
dB
)
Cross-Polarization
Co-Polarization
a)
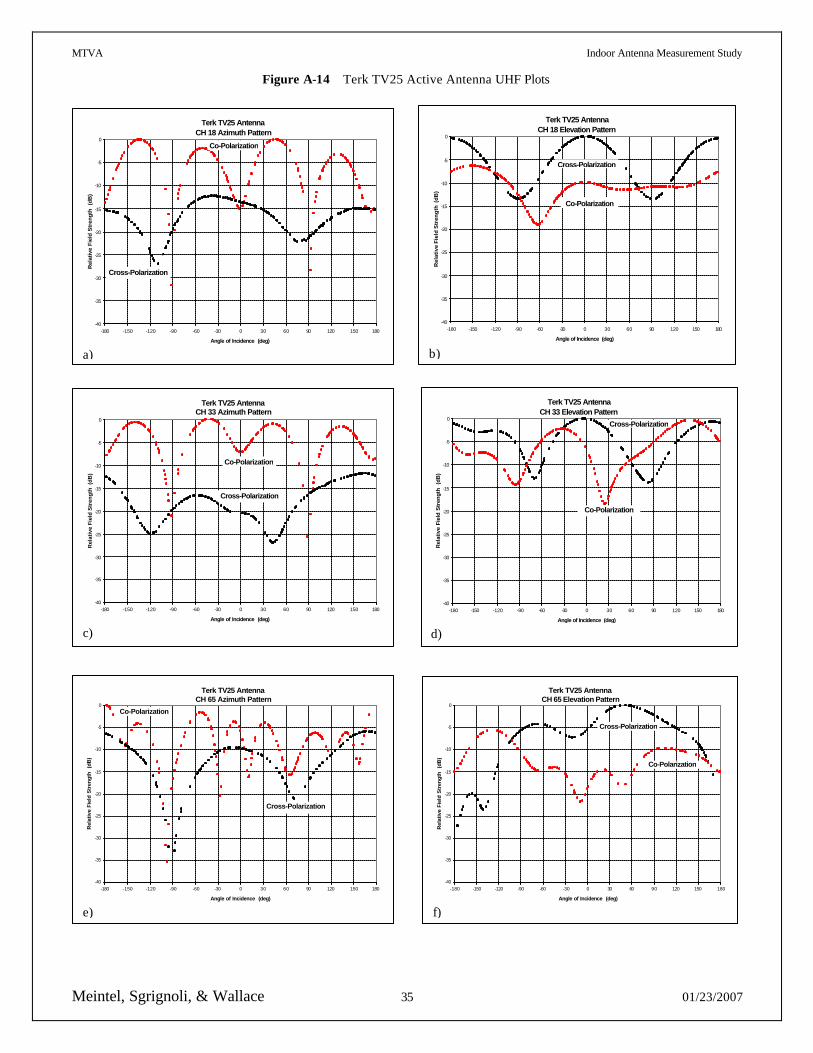
MTVA Indoor Antenna Measurement Study
Meintel, Sgrignoli, & Wallace 35 01/23/2007
Figure A-14 Terk TV25 Active Antenna UHF Plots
Terk TV25 Antenna CH 18 Elevation Pattern
-40
-35
-30
-25
-20
-15
-10
-5
0
-180 -150 -120 -90 -60 -30 0 30 60 90 120 150 180
Angle of Incidence (deg)
Rel
ativ
e F
ield
Str
eng
th (
dB
)
Cross-Polarization
Co-Polarization
b)
Terk TV25 Antenna CH 65 Azimuth Pattern
-40
-35
-30
-25
-20
-15
-10
-5
0
-180 -150 -120 -90 -60 -30 0 30 60 90 120 150 180
Angle of Incidence (deg)
Rel
ativ
e Fi
eld
Str
engt
h (
dB)
Cross-Polarization
Co-Polarization
e)
Terk TV25 Antenna CH 33 Elevation Pattern
-40
-35
-30
-25
-20
-15
-10
-5
0
-180 -150 -120 -90 -60 -30 0 30 60 90 120 150 180
Angle of Incidence (deg)
Rel
ativ
e Fi
eld
Str
engt
h (
dB)
Co-Polarization
Cross-Polarization
d)
Terk TV25 Antenna CH 65 Elevation Pattern
-40
-35
-30
-25
-20
-15
-10
-5
0
-180 -150 -120 -90 -60 -30 0 30 60 90 120 150 180
Angle of Incidence (deg)
Rel
ativ
e Fi
eld
Str
engt
h (
dB)
Co-Polarization
Cross-Polarization
f)
Terk TV25 Antenna CH 33 Azimuth Pattern
-40
-35
-30
-25
-20
-15
-10
-5
0
-180 -150 -120 -90 -60 -30 0 30 60 90 120 150 180
Angle of Incidence (deg)
Rel
ativ
e F
ield
Str
eng
th (
dB
)
Cross-Polarization
Co-Polarization
c)
Terk TV25 Antenna CH 18 Azimuth Pattern
-40
-35
-30
-25
-20
-15
-10
-5
0
-180 -150 -120 -90 -60 -30 0 30 60 90 120 150 180
Angle of Incidence (deg)
Rel
ativ
e Fi
eld
Str
engt
h (
dB)
Cross-Polarization
Co-Polarization
a)
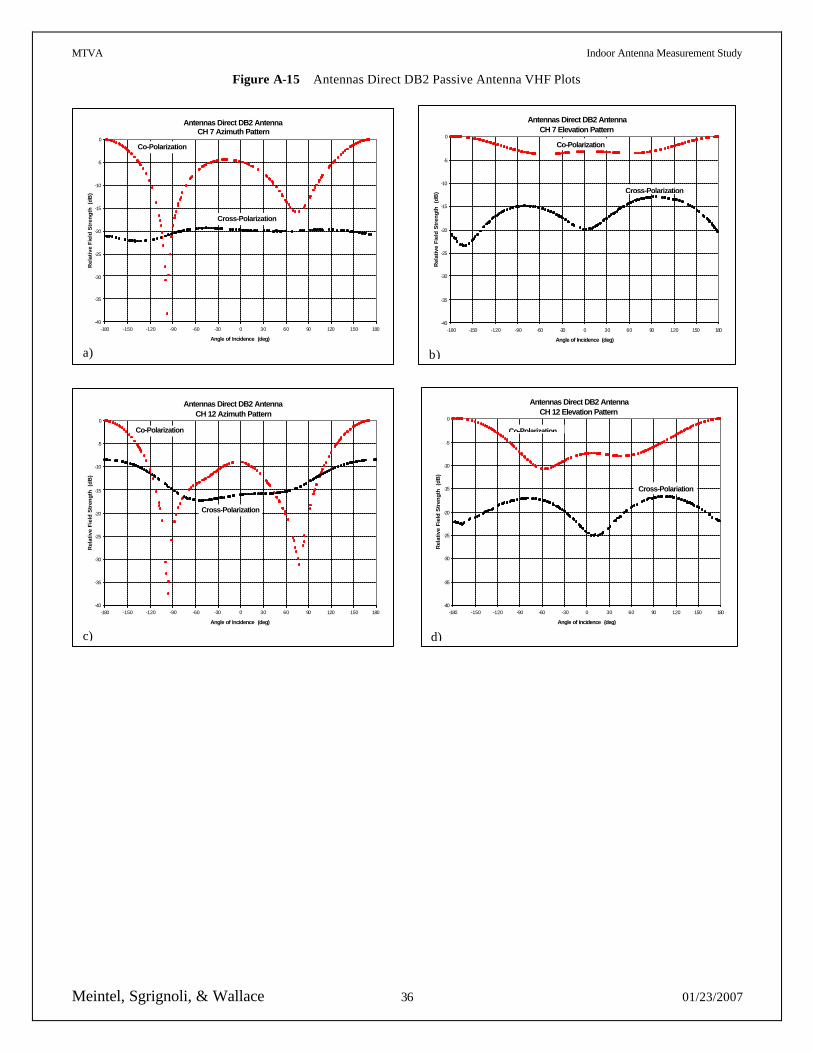
MTVA Indoor Antenna Measurement Study
Meintel, Sgrignoli, & Wallace 36 01/23/2007
Figure A-15 Antennas Direct DB2 Passive Antenna VHF Plots
Antennas Direct DB2 Antenna CH 7 Elevation Pattern
-40
-35
-30
-25
-20
-15
-10
-5
0
-180 -150 -120 -90 -60 -30 0 30 60 90 120 150 180
Angle of Incidence (deg)
Rel
ativ
e Fi
eld
Str
engt
h (
dB)
Co-Polarization
Cross-Polarization
b)
Antennas Direct DB2 Antenna CH 12 Elevation Pattern
-40
-35
-30
-25
-20
-15
-10
-5
0
-180 -150 -120 -90 -60 -30 0 30 60 90 120 150 180
Angle of Incidence (deg)
Rel
ativ
e Fi
eld
Str
engt
h (
dB)
Co-Polarization
Cross-Polariation
d)
Antennas Direct DB2 Antenna CH 12 Azimuth Pattern
-40
-35
-30
-25
-20
-15
-10
-5
0
-180 -150 -120 -90 -60 -30 0 30 60 90 120 150 180
Angle of Incidence (deg)
Rel
ativ
e Fi
eld
Str
engt
h (
dB)
Cross-Polarization
Co-Polarization
c)
Antennas Direct DB2 Antenna CH 7 Azimuth Pattern
-40
-35
-30
-25
-20
-15
-10
-5
0
-180 -150 -120 -90 -60 -30 0 30 60 90 120 150 180
Angle of Incidence (deg)
Rel
ativ
e F
ield
Str
eng
th (
dB
)
Cross-Polarization
Co-Polarization
a)
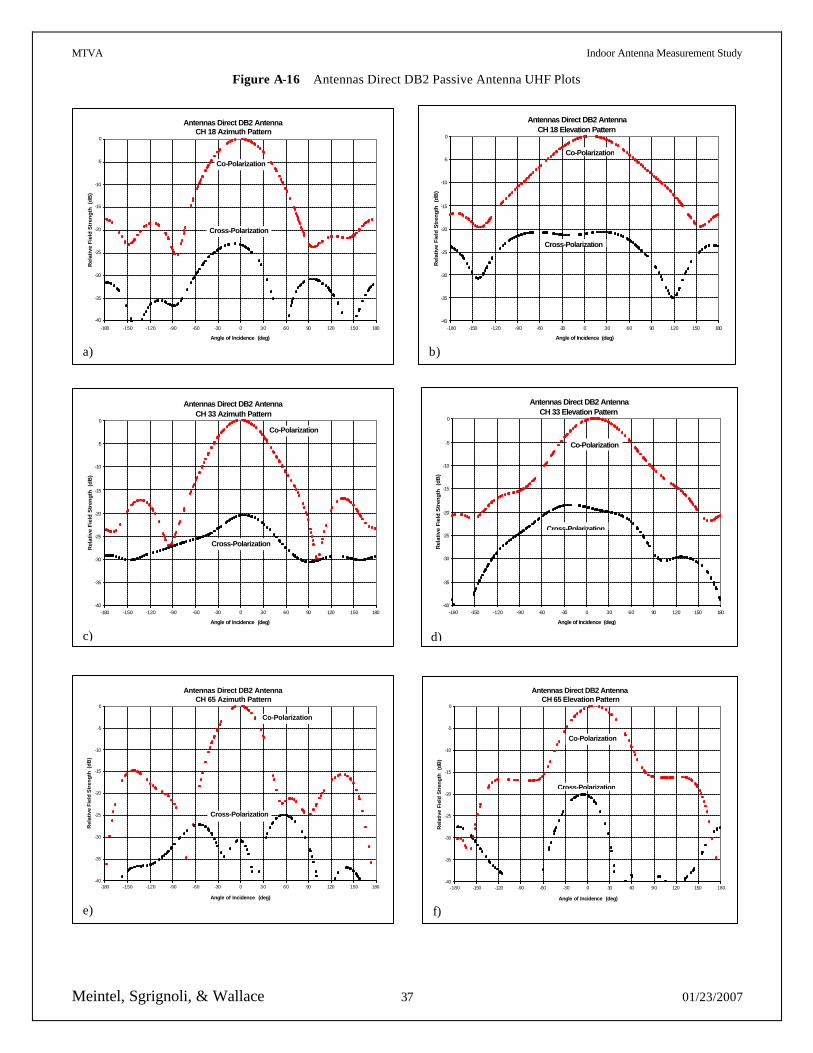
MTVA Indoor Antenna Measurement Study
Meintel, Sgrignoli, & Wallace 37 01/23/2007
Figure A-16 Antennas Direct DB2 Passive Antenna UHF Plots
Antennas Direct DB2 Antenna CH 18 Elevation Pattern
-40
-35
-30
-25
-20
-15
-10
-5
0
-180 -150 -120 -90 -60 -30 0 30 60 90 120 150 180
Angle of Incidence (deg)
Rel
ativ
e Fi
eld
Str
engt
h (
dB)
Cross-Polarization
Co-Polarization
b)
Antennas Direct DB2 Antenna CH 65 Azimuth Pattern
-40
-35
-30
-25
-20
-15
-10
-5
0
-180 -150 -120 -90 -60 -30 0 30 60 90 120 150 180
Angle of Incidence (deg)
Rel
ativ
e F
ield
Str
eng
th (
dB
)
Cross-Polarization
Co-Polarization
e)
Antennas Direct DB2 Antenna CH 33 Elevation Pattern
-40
-35
-30
-25
-20
-15
-10
-5
0
-180 -150 -120 -90 -60 -30 0 30 60 90 120 150 180
Angle of Incidence (deg)
Rel
ativ
e Fi
eld
Str
engt
h (
dB)
Cross-Polarization
Co-Polarization
d)
Antennas Direct DB2 Antenna CH 65 Elevation Pattern
-40
-35
-30
-25
-20
-15
-10
-5
0
-180 -150 -120 -90 -60 -30 0 30 60 90 120 150 180
Angle of Incidence (deg)
Rel
ativ
e Fi
eld
Str
engt
h (
dB)
Cross-Polarization
Co-Polarization
f)
Antennas Direct DB2 Antenna CH 33 Azimuth Pattern
-40
-35
-30
-25
-20
-15
-10
-5
0
-180 -150 -120 -90 -60 -30 0 30 60 90 120 150 180
Angle of Incidence (deg)
Rel
ativ
e Fi
eld
Str
engt
h (
dB)
Cross-Polarization
Co-Polarization
c)
Antennas Direct DB2 Antenna CH 18 Azimuth Pattern
-40
-35
-30
-25
-20
-15
-10
-5
0
-180 -150 -120 -90 -60 -30 0 30 60 90 120 150 180
Angle of Incidence (deg)
Rel
ativ
e F
ield
Str
eng
th (
dB
)
Cross-Polarization
Co-Polarization
a)
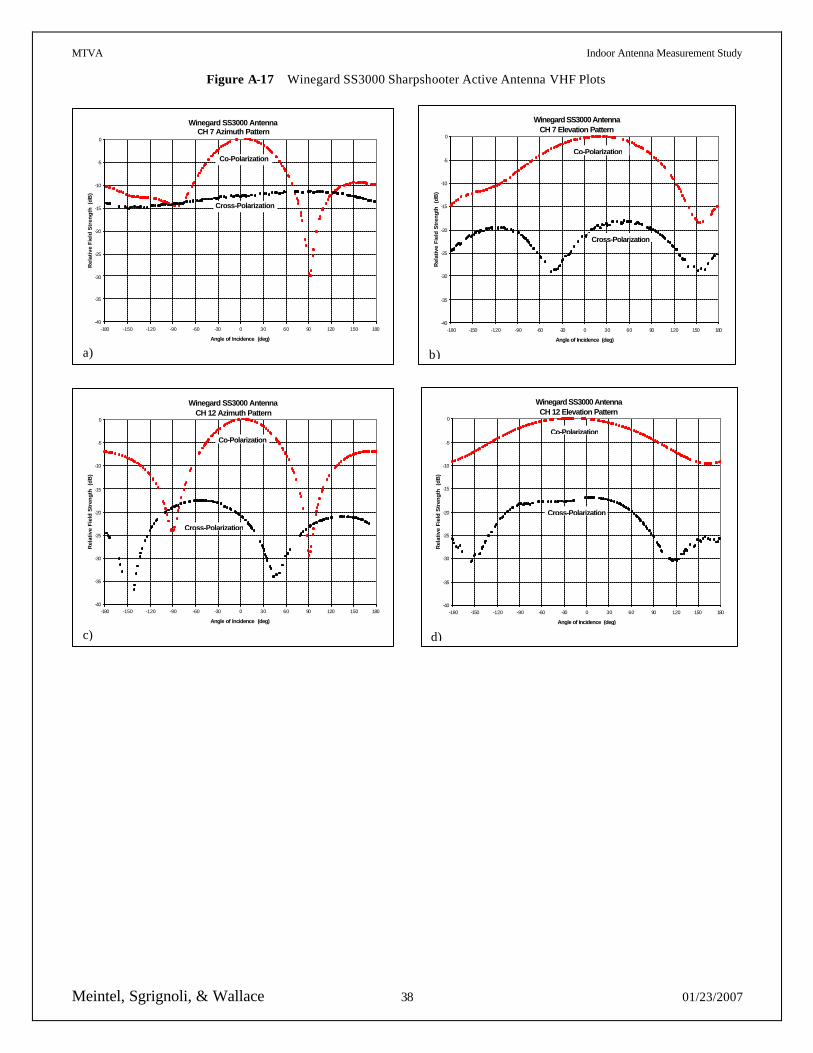
MTVA Indoor Antenna Measurement Study
Meintel, Sgrignoli, & Wallace 38 01/23/2007
Figure A-17 Winegard SS3000 Sharpshooter Active Antenna VHF Plots
Winegard SS3000 Antenna CH 7 Elevation Pattern
-40
-35
-30
-25
-20
-15
-10
-5
0
-180 -150 -120 -90 -60 -30 0 30 60 90 120 150 180
Angle of Incidence (deg)
Rel
ativ
e Fi
eld
Str
engt
h (
dB)
Co-Polarization
Cross-Polarization
b)
Winegard SS3000 Antenna CH 12 Elevation Pattern
-40
-35
-30
-25
-20
-15
-10
-5
0
-180 -150 -120 -90 -60 -30 0 30 60 90 120 150 180
Angle of Incidence (deg)
Rel
ativ
e Fi
eld
Str
engt
h (
dB)
Co-Polarization
Cross-Polarization
d)
Winegard SS3000 Antenna CH 12 Azimuth Pattern
-40
-35
-30
-25
-20
-15
-10
-5
0
-180 -150 -120 -90 -60 -30 0 30 60 90 120 150 180
Angle of Incidence (deg)
Rel
ativ
e Fi
eld
Str
engt
h (
dB)
Cross-Polarization
Co-Polarization
c)
Winegard SS3000 Antenna CH 7 Azimuth Pattern
-40
-35
-30
-25
-20
-15
-10
-5
0
-180 -150 -120 -90 -60 -30 0 30 60 90 120 150 180
Angle of Incidence (deg)
Rel
ativ
e F
ield
Str
eng
th (
dB
)
Cross-Polarization
Co-Polarization
a)
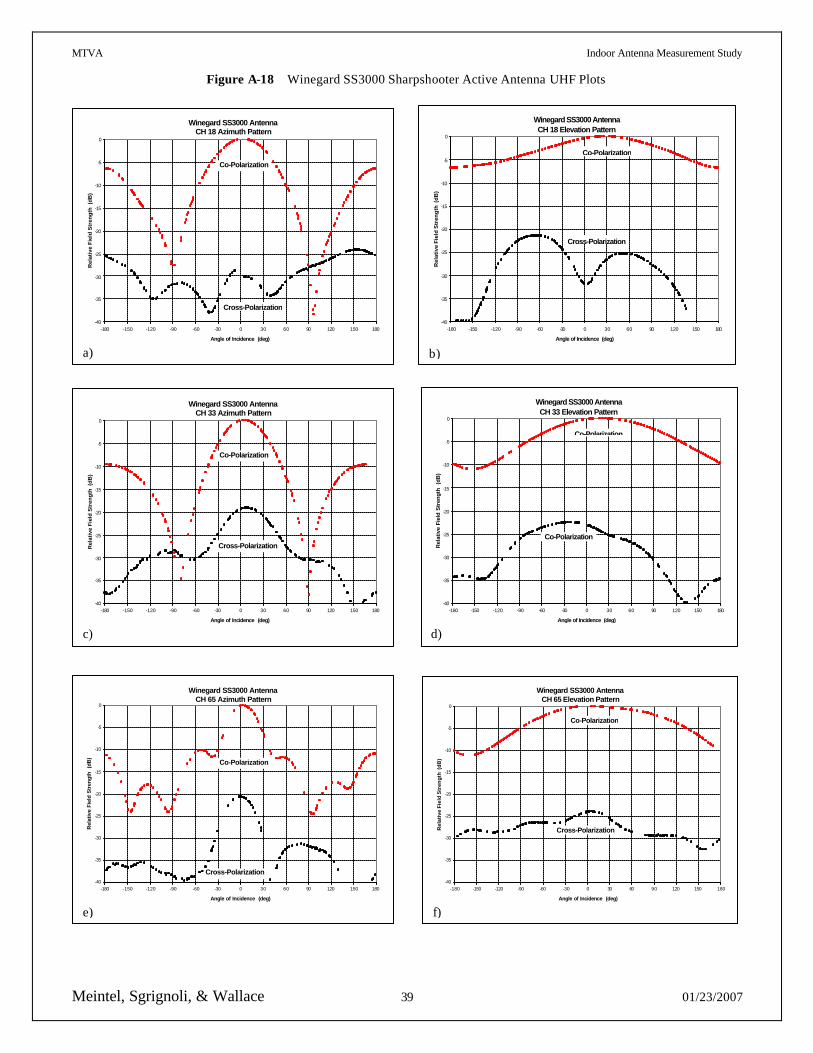
MTVA Indoor Antenna Measurement Study
Meintel, Sgrignoli, & Wallace 39 01/23/2007
Figure A-18 Winegard SS3000 Sharpshooter Active Antenna UHF Plots
Winegard SS3000 Antenna CH 18 Elevation Pattern
-40
-35
-30
-25
-20
-15
-10
-5
0
-180 -150 -120 -90 -60 -30 0 30 60 90 120 150 180
Angle of Incidence (deg)
Rel
ativ
e F
ield
Str
eng
th (
dB
)
Co-Polarization
Cross-Polarization
b)
Winegard SS3000 Antenna CH 65 Azimuth Pattern
-40
-35
-30
-25
-20
-15
-10
-5
0
-180 -150 -120 -90 -60 -30 0 30 60 90 120 150 180
Angle of Incidence (deg)
Rel
ativ
e Fi
eld
Str
engt
h (
dB)
Cross-Polarization
Co-Polarization
e)
Winegard SS3000 Antenna CH 33 Elevation Pattern
-40
-35
-30
-25
-20
-15
-10
-5
0
-180 -150 -120 -90 -60 -30 0 30 60 90 120 150 180
Angle of Incidence (deg)
Rel
ativ
e Fi
eld
Str
engt
h (
dB)
Co-Polarization
Co-Polarization
d)
Winegard SS3000 Antenna CH 65 Elevation Pattern
-40
-35
-30
-25
-20
-15
-10
-5
0
-180 -150 -120 -90 -60 -30 0 30 60 90 120 150 180
Angle of Incidence (deg)
Rel
ativ
e F
ield
Str
eng
th (
dB
)
Co-Polarization
Cross-Polarization
f)
Winegard SS3000 Antenna CH 33 Azimuth Pattern
-40
-35
-30
-25
-20
-15
-10
-5
0
-180 -150 -120 -90 -60 -30 0 30 60 90 120 150 180
Angle of Incidence (deg)
Rel
ativ
e F
ield
Str
eng
th (
dB
)
Cross-Polarization
Co-Polarization
c)
Winegard SS3000 Antenna CH 18 Azimuth Pattern
-40
-35
-30
-25
-20
-15
-10
-5
0
-180 -150 -120 -90 -60 -30 0 30 60 90 120 150 180
Angle of Incidence (deg)
Rel
ativ
e F
ield
Str
eng
th (
dB
)
Cross-Polarization
Co-Polarization
a)
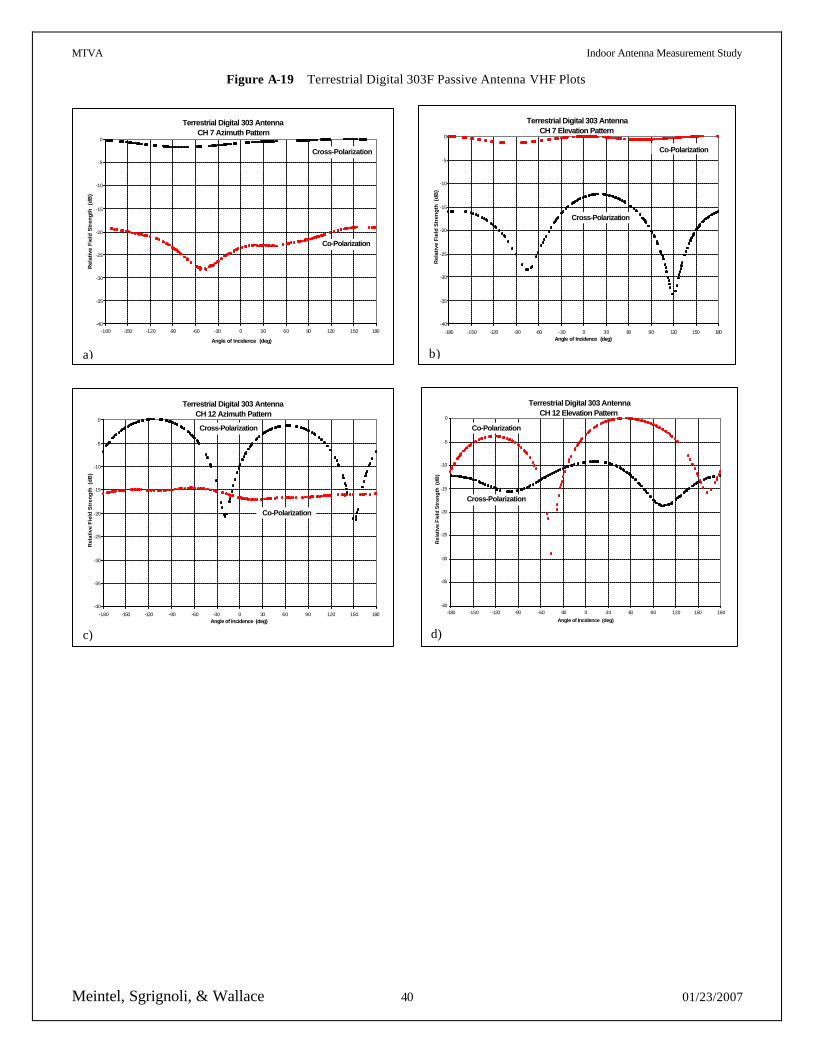
MTVA Indoor Antenna Measurement Study
Meintel, Sgrignoli, & Wallace 40 01/23/2007
Figure A-19 Terrestrial Digital 303F Passive Antenna VHF Plots
Terrestrial Digital 303 Antenna CH 7 Elevation Pattern
-40
-35
-30
-25
-20
-15
-10
-5
0
-180 -150 -120 -90 -60 -30 0 30 60 90 120 150 180Angle of Incidence (deg)
Rel
ativ
e F
ield
Str
eng
th (
dB
)
Co-Polarization
Cross-Polarization
b)
Terrestrial Digital 303 AntennaCH 12 Elevation Pattern
-40
-35
-30
-25
-20
-15
-10
-5
0
-180 -150 -120 -90 -60 -30 0 30 60 90 120 150 180
Angle of Incidence (deg)
Rel
ativ
e F
ield
Str
eng
th (
dB
)
Co-Polarization
Cross-Polarization
d)
Terrestrial Digital 303 AntennaCH 12 Azimuth Pattern
-40
-35
-30
-25
-20
-15
-10
-5
0
-180 -150 -120 -90 -60 -30 0 30 60 90 120 150 180Angle of Incidence (deg)
Rel
ativ
e F
ield
Str
eng
th (
dB
)
Cross-Polarization
Co-Polarization
c)
Terrestrial Digital 303 Antenna CH 7 Azimuth Pattern
-40
-35
-30
-25
-20
-15
-10
-5
0
-180 -150 -120 -90 -60 -30 0 30 60 90 120 150 180
Angle of Incidence (deg)
Rel
ativ
e Fi
eld
Str
engt
h (
dB)
Cross-Polarization
Co-Polarization
a)
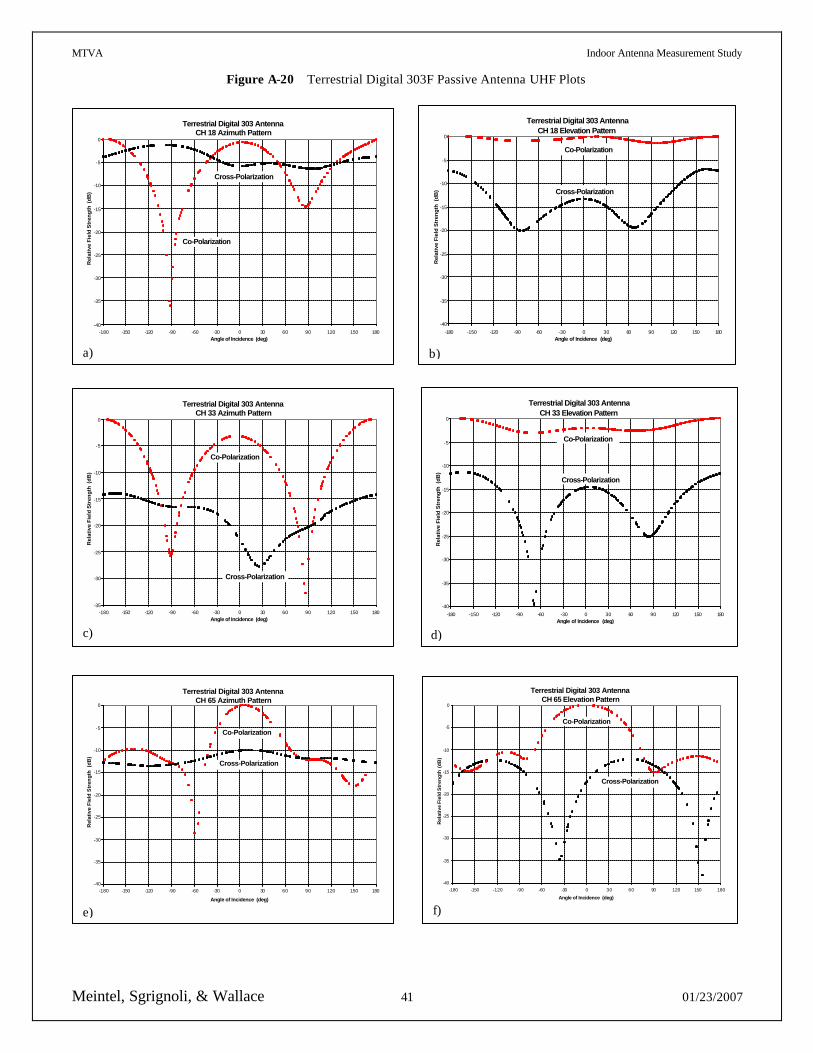
MTVA Indoor Antenna Measurement Study
Meintel, Sgrignoli, & Wallace 41 01/23/2007
Figure A-20 Terrestrial Digital 303F Passive Antenna UHF Plots
Terrestrial Digital 303 AntennaCH 18 Elevation Pattern
-40
-35
-30
-25
-20
-15
-10
-5
0
-180 -150 -120 -90 -60 -30 0 30 60 90 120 150 180Angle of Incidence (deg)
Rel
ativ
e F
ield
Str
eng
th (
dB
)
Co-Polarization
Cross-Polarization
b)
Terrestrial Digital 303 AntennaCH 65 Azimuth Pattern
-40
-35
-30
-25
-20
-15
-10
-5
0
-180 -150 -120 -90 -60 -30 0 30 60 90 120 150 180
Angle of Incidence (deg)
Rel
ativ
e F
ield
Str
eng
th (
dB
)
Cross-Polarization
Co-Polarization
e)
Terrestrial Digital 303 Antenna CH 33 Elevation Pattern
-40
-35
-30
-25
-20
-15
-10
-5
0
-180 -150 -120 -90 -60 -30 0 30 60 90 120 150 180Angle of Incidence (deg)
Rel
ativ
e F
ield
Str
eng
th (
dB
)Co-Polarization
Cross-Polarization
d)
Terrestrial Digital 303 Antenna CH 65 Elevation Pattern
-40
-35
-30
-25
-20
-15
-10
-5
0
-180 -150 -120 -90 -60 -30 0 30 60 90 120 150 180
Angle of Incidence (deg)
Rel
ativ
e F
ield
Str
eng
th (
dB
)
Co-Polarization
Cross-Polarization
f)
Terrestrial Digital 303 AntennaCH 33 Azimuth Pattern
-35
-30
-25
-20
-15
-10
-5
0
-180 -150 -120 -90 -60 -30 0 30 60 90 120 150 180Angle of Incidence (deg)
Rel
ativ
e F
ield
Str
eng
th (
dB
)
Cross-Polarization
Co-Polarization
c)
Terrestrial Digital 303 AntennaCH 18 Azimuth Pattern
-40
-35
-30
-25
-20
-15
-10
-5
0
-180 -150 -120 -90 -60 -30 0 30 60 90 120 150 180Angle of Incidence (deg)
Rel
ativ
e F
ield
Str
eng
th (
dB
)
Cross-Polarization
Co-Polarization
a)
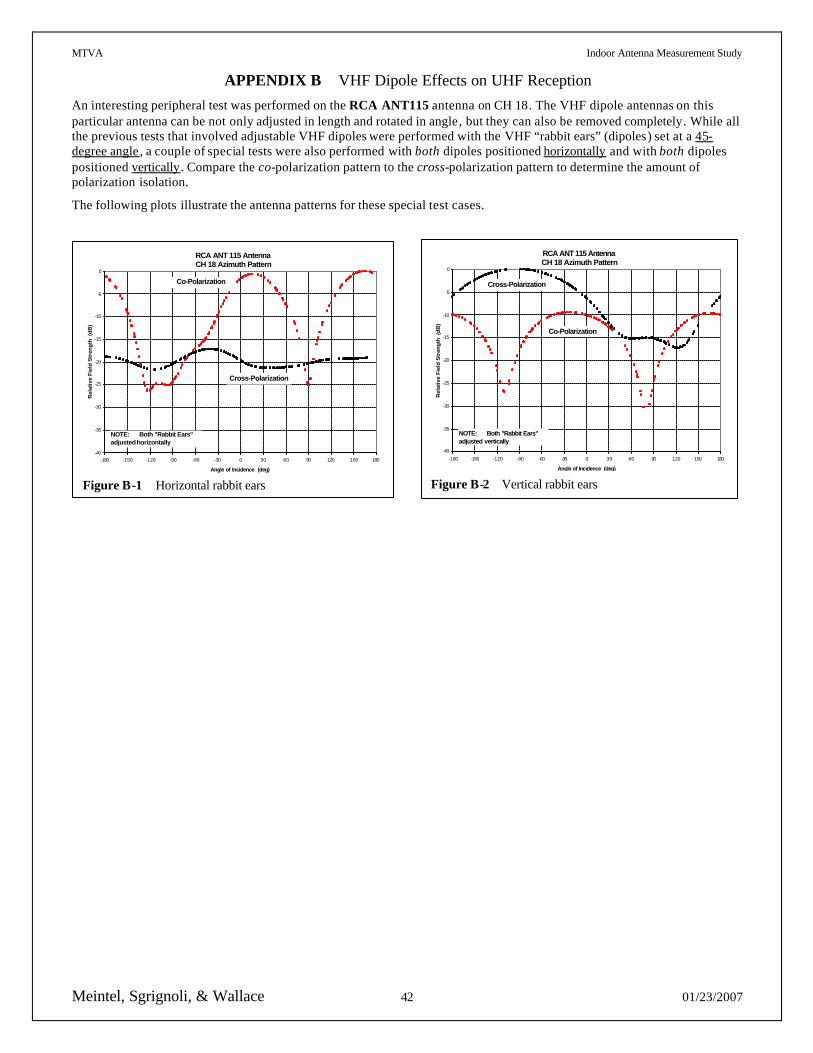
MTVA Indoor Antenna Measurement Study
Meintel, Sgrignoli, & Wallace 42 01/23/2007
APPENDIX B VHF Dipole Effects on UHF Reception An interesting peripheral test was performed on the RCA ANT115 antenna on CH 18. The VHF dipole antennas on this particular antenna can be not only adjusted in length and rotated in angle, but they can also be removed completely. While all the previous tests that involved adjustable VHF dipoles were performed with the VHF “rabbit ears” (dipoles) set at a 45-degree angle, a couple of special tests were also performed with both dipoles positioned horizontally and with both dipoles positioned vertically. Compare the co-polarization pattern to the cross-polarization pattern to determine the amount of polarization isolation.
The following plots illustrate the antenna patterns for these special test cases.
RCA ANT 115 Antenna CH 18 Azimuth Pattern
-40
-35
-30
-25
-20
-15
-10
-5
0
-180 -150 -120 -90 -60 -30 0 30 60 90 120 150 180
Angle of Incidence (deg)
Rel
ativ
e F
ield
Str
eng
th (
dB
)
Cross-Polarization
Co-Polarization
NOTE: Both "Rabbit Ears" adjusted vertically
Figure B-2 Vertical rabbit ears
RCA ANT 115 Antenna CH 18 Azimuth Pattern
-40
-35
-30
-25
-20
-15
-10
-5
0
-180 -150 -120 -90 -60 -30 0 30 60 90 120 150 180
Angle of Incidence (deg)
Rel
ativ
e F
ield
Str
eng
th (
dB
)
Cross-Polarization
Co-Polarization
NOTE: Both "Rabbit Ears" adjusted horizontally
Figure B-1 Horizontal rabbit ears
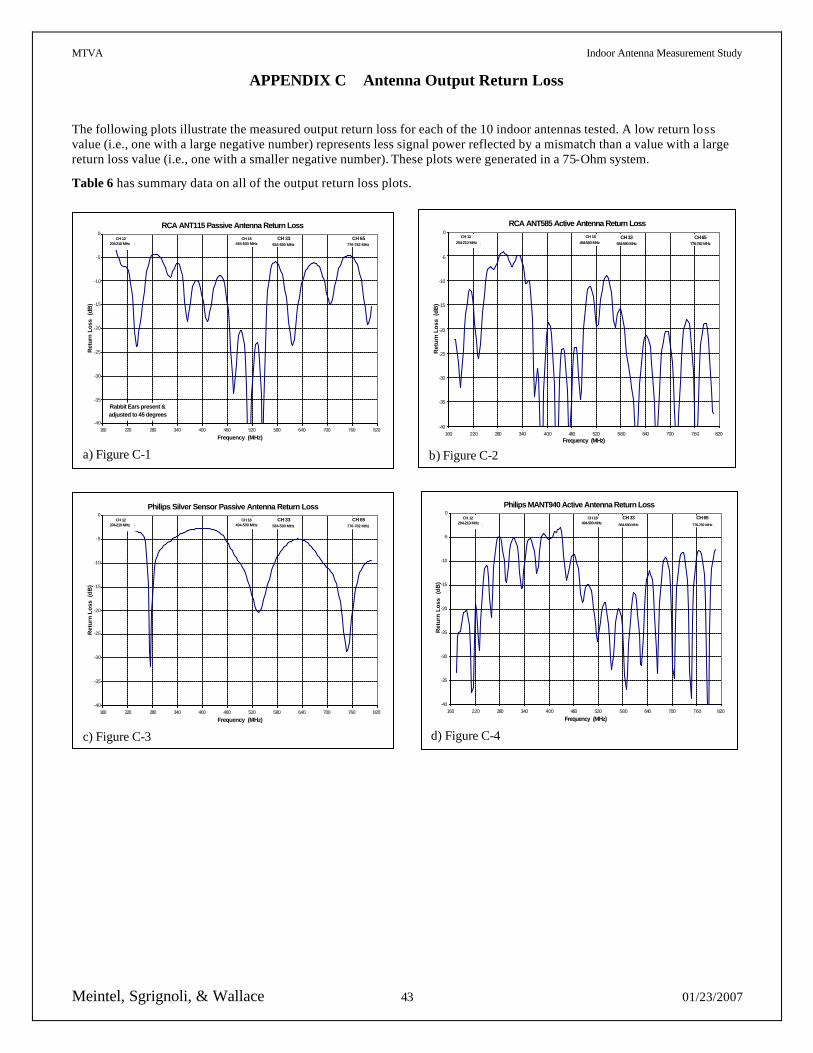
MTVA Indoor Antenna Measurement Study
Meintel, Sgrignoli, & Wallace 43 01/23/2007
APPENDIX C Antenna Output Return Loss
The following plots illustrate the measured output return loss for each of the 10 indoor antennas tested. A low return loss value (i.e., one with a large negative number) represents less signal power reflected by a mismatch than a value with a large return loss value (i.e., one with a smaller negative number). These plots were generated in a 75-Ohm system.
Table 6 has summary data on all of the output return loss plots.
RCA ANT585 Active Antenna Return Loss
-40
-35
-30
-25
-20
-15
-10
-5
0
160 220 280 340 400 460 520 580 640 700 760 820Frequency (MHz)
Ret
urn
Loss
(dB
)
CH 7174-180 MHz
CH 12204-210 MHz
CH 18494-500 MHz
CH 33584-590 MHz
CH 65776-782 MHz
b) Figure C-2
Philips MANT940 Active Antenna Return Loss
-40
-35
-30
-25
-20
-15
-10
-5
0
160 220 280 340 400 460 520 580 640 700 760 820
Frequency (MHz)
Ret
urn
Lo
ss
(dB
)
CH 7174-180 MHz
CH 12204-210 MHz
CH 18494-500 MHz
CH 33584-590 MHz
CH 65776-782 MHz
d) Figure C-4
Philips Silver Sensor Passive Antenna Return Loss
-40
-35
-30
-25
-20
-15
-10
-5
0
160 220 280 340 400 460 520 580 640 700 760 820
Frequency (MHz)
Ret
urn
Lo
ss (
dB
)
CH 7174-180 MHz
CH 12204-210 MHz
CH 18494-500 MHz
CH 33584-590 MHz
CH 65776-782 MHz
c) Figure C-3
RCA ANT115 Passive Antenna Return Loss
-40
-35
-30
-25
-20
-15
-10
-5
0
160 220 280 340 400 460 520 580 640 700 760 820
Frequency (MHz)
Ret
urn
Loss
(d
B)
CH 7174-180 MHz
CH 12204-210 MHz
CH 18494-500 MHz
CH 33584-590 MHz
CH 65776-782 MHz
Rabbit Ears present & adjusted to 45 degrees
a) Figure C-1
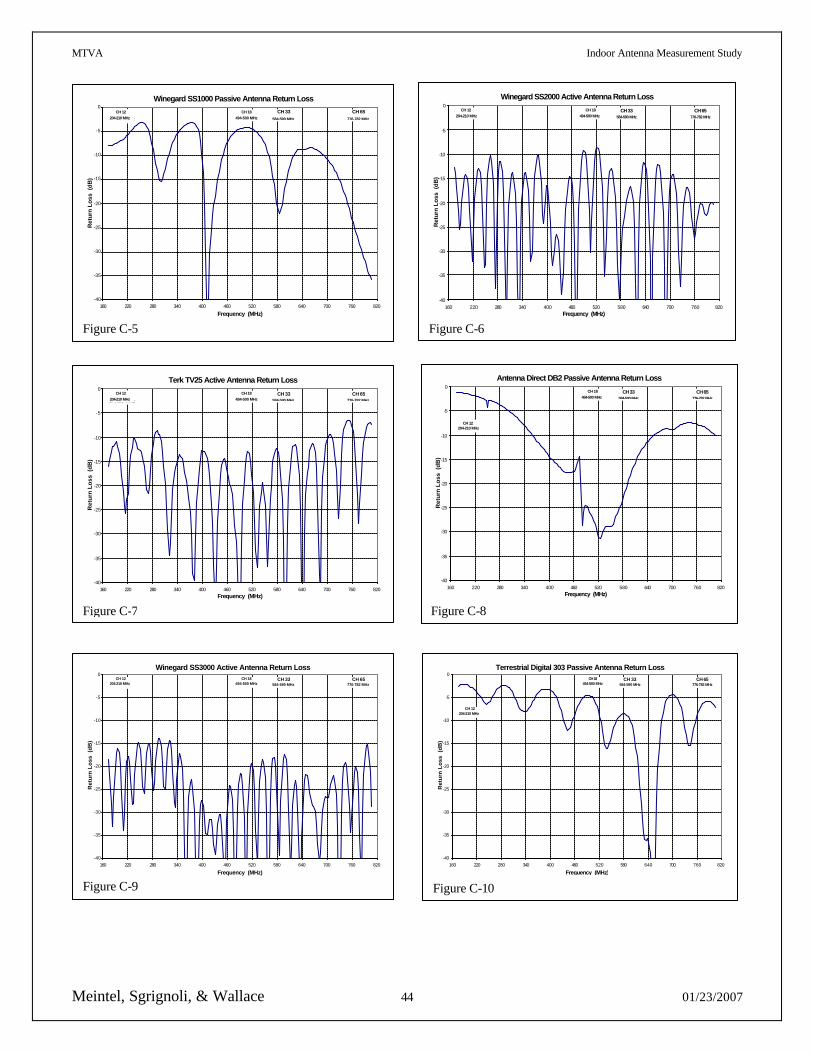
MTVA Indoor Antenna Measurement Study
Meintel, Sgrignoli, & Wallace 44 01/23/2007
Winegard SS2000 Active Antenna Return Loss
-40
-35
-30
-25
-20
-15
-10
-5
0
160 220 280 340 400 460 520 580 640 700 760 820Frequency (MHz)
Ret
urn
Loss
(dB
)
CH 12204-210 MHz
CH 18494-500 MHz
CH 33584-590 MHz
CH 65776-782 MHz
Figure C-6
Winegard SS3000 Active Antenna Return Loss
-40
-35
-30
-25
-20
-15
-10
-5
0
160 220 280 340 400 460 520 580 640 700 760 820
Frequency (MHz)
Ret
urn
Lo
ss (
dB
)
CH 12204-210 MHz
CH 18494-500 MHz
CH 33584-590 MHz
CH 65776-782 MHz
Figure C-9
Antenna Direct DB2 Passive Antenna Return Loss
-40
-35
-30
-25
-20
-15
-10
-5
0
160 220 280 340 400 460 520 580 640 700 760 820Frequency (MHz)
Ret
urn
Lo
ss (
dB
)
CH 12204-210 MHz
CH 18494-500 MHz
CH 33584-590 MHz
CH 65776-782 MHz
Figure C-8
Terrestrial Digital 303 Passive Antenna Return Loss
-40
-35
-30
-25
-20
-15
-10
-5
0
160 220 280 340 400 460 520 580 640 700 760 820
Frequency (MHz)
Ret
urn
Lo
ss (
dB
)
CH 12204-210 MHz
CH 18494-500 MHz
CH 33584-590 MHz
CH 65776-782 MHz
Figure C-10
Terk TV25 Active Antenna Return Loss
-40
-35
-30
-25
-20
-15
-10
-5
0
160 220 280 340 400 460 520 580 640 700 760 820Frequency (MHz)
Ret
urn
Lo
ss (
dB
)
CH 7174-180 MHz
CH 12204-210 MHz
CH 18494-500 MHz
CH 33584-590 MHz
CH 65776-782 MHz
Figure C-7
Winegard SS1000 Passive Antenna Return Loss
-40
-35
-30
-25
-20
-15
-10
-5
0
160 220 280 340 400 460 520 580 640 700 760 820
Frequency (MHz)
Ret
urn
Lo
ss (
dB
)
CH 7174-180 MHz
CH 12204-210 MHz
CH 18494-500 MHz
CH 33584-590 MHz
CH 65776-782 MHz
Figure C-5
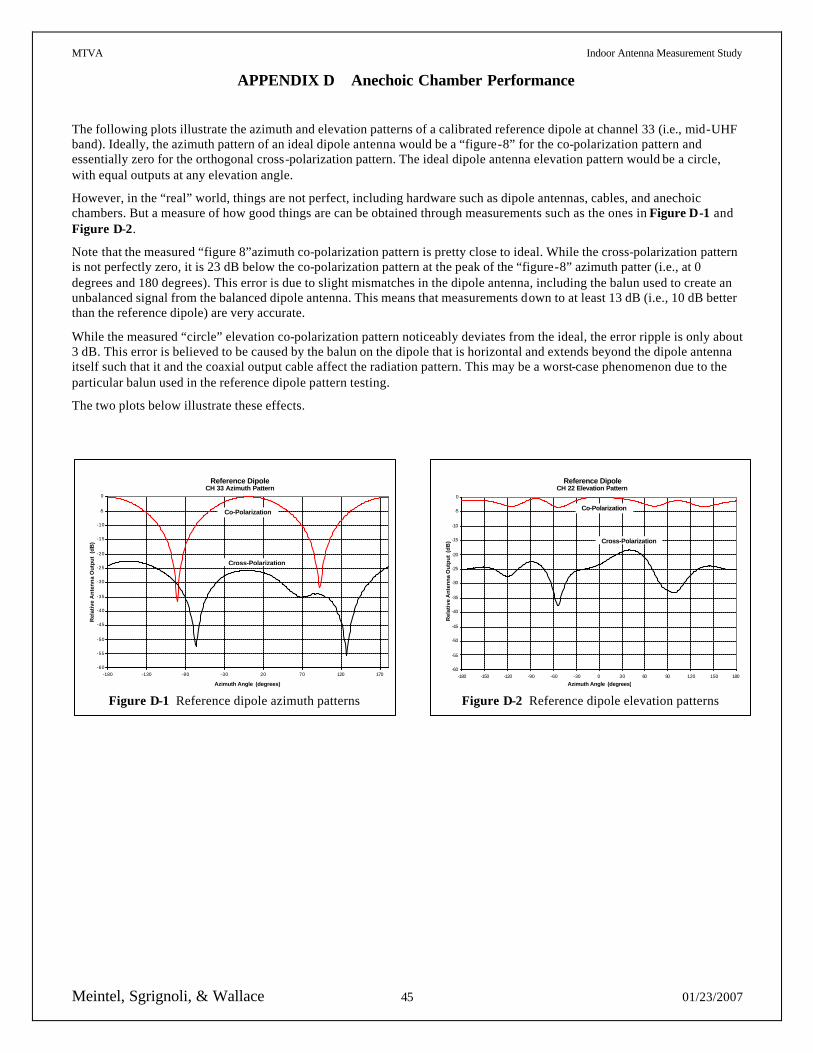
MTVA Indoor Antenna Measurement Study
Meintel, Sgrignoli, & Wallace 45 01/23/2007
APPENDIX D Anechoic Chamber Performance
The following plots illustrate the azimuth and elevation patterns of a calibrated reference dipole at channel 33 (i.e., mid-UHF band). Ideally, the azimuth pattern of an ideal dipole antenna would be a “figure-8” for the co-polarization pattern and essentially zero for the orthogonal cross-polarization pattern. The ideal dipole antenna elevation pattern would be a circle, with equal outputs at any elevation angle.
However, in the “real” world, things are not perfect, including hardware such as dipole antennas, cables, and anechoic chambers. But a measure of how good things are can be obtained through measurements such as the ones in Figure D-1 and Figure D-2.
Note that the measured “figure 8”azimuth co-polarization pattern is pretty close to ideal. While the cross-polarization pattern is not perfectly zero, it is 23 dB below the co-polarization pattern at the peak of the “figure-8” azimuth patter (i.e., at 0 degrees and 180 degrees). This error is due to slight mismatches in the dipole antenna, including the balun used to create an unbalanced signal from the balanced dipole antenna. This means that measurements down to at least 13 dB (i.e., 10 dB better than the reference dipole) are very accurate.
While the measured “circle” elevation co-polarization pattern noticeably deviates from the ideal, the error ripple is only about 3 dB. This error is believed to be caused by the balun on the dipole that is horizontal and extends beyond the dipole antenna itself such that it and the coaxial output cable affect the radiation pattern. This may be a worst-case phenomenon due to the particular balun used in the reference dipole pattern testing.
The two plots below illustrate these effects.
Reference DipoleCH 33 Azimuth Pattern
-60
-55
-50
-45
-40
-35
-30
-25
-20
-15
-10
-5
0
-180 -130 -80 -30 20 70 120 170
Azimuth Angle (degrees)
Rel
ativ
e A
nte
nn
a O
utp
ut
(dB
)
Cross-Polarization
Co-Polarization
Figure D-1 Reference dipole azimuth patterns
Reference DipoleCH 22 Elevation Pattern
-60
-55
-50
-45
-40
-35
-30
-25
-20
-15
-10
-5
0
-180 -150 -120 -90 -60 -30 0 30 60 90 120 150 180
Azimuth Angle (degrees)
Rel
ativ
e A
nte
nn
a O
utp
ut
(dB
) Cross-Polarization
Co-Polarization
Figure D-2 Reference dipole elevation patterns