Embed Size (px)
Citation preview
Measurement
IntroductionWith few exceptions the basis of physical inquiry is experiment. An experiment typi-cally involves collecting numerical data which may be used in testing the validity of aphysical theory. Usually, experimental data are corrupted by the occurrence of randomerrors which the experimenter is unable to eliminate. Thus, although there may be aunique value for some physical measurement, it may be impossible to determine itsvalue within the measuring accuracy of the apparatus used in the experiment. In suchcases, only a best estimate of the physical measurement can be given, along with somemeasure of confidence in its value. Two quantities used in this regard are the mean, x̄,and the standard deviation of the mean, σ, which can be estimated as follows:
x̄ =
∑Ni=1 xi
N, (1)
where N is the number of measurements, and xi is one of the measurements. Thequantity
σ =σN−1√
N, (2)
where an unbiased estimate of the the standard deviation of the population of measure-ments is given by
σN−1 =
√∑Ni=1(xi − x̄)2
N − 1. (3)
Qualitatively, x̄ represents the best estimate of the true value of the measurement, andσ represents the confidence in that value. The physical measurement is reported in theform
x̄± σ . (4)
In some experiments it may be hypothesized that a relationship exists among sev-eral different types of measurements. In the simplest case, there are two types whichare related linearly. If the measurements include random errors, it is not possible todetermine, definitively, whether or not a linear relationship exists between the differenttypes of measurements. Nonetheless, using a technique called regression analysis, itis possible to obtain a best linear fit to the data and a measure of confidence in the fit.Using a statistical technique which minimizes the deviation of the data from the regres-sion line, it is possible to estimate the parameters associated with the regression line,
1
i.e. slope and intercept. It is also possible to obtain a measure of confidence in the fit ,R2 ( 0 ≤ R2 ≤ 1). The quantity R is called the correlation coefficient. Values of R2
near zero suggest the least confidence in the fit. i.e. that the variation in values of oneof the data series is not adequately explained by the hypothesized linear relationshipbetween the different types of measurements, and values near one suggest the mostconfidence in the fit.
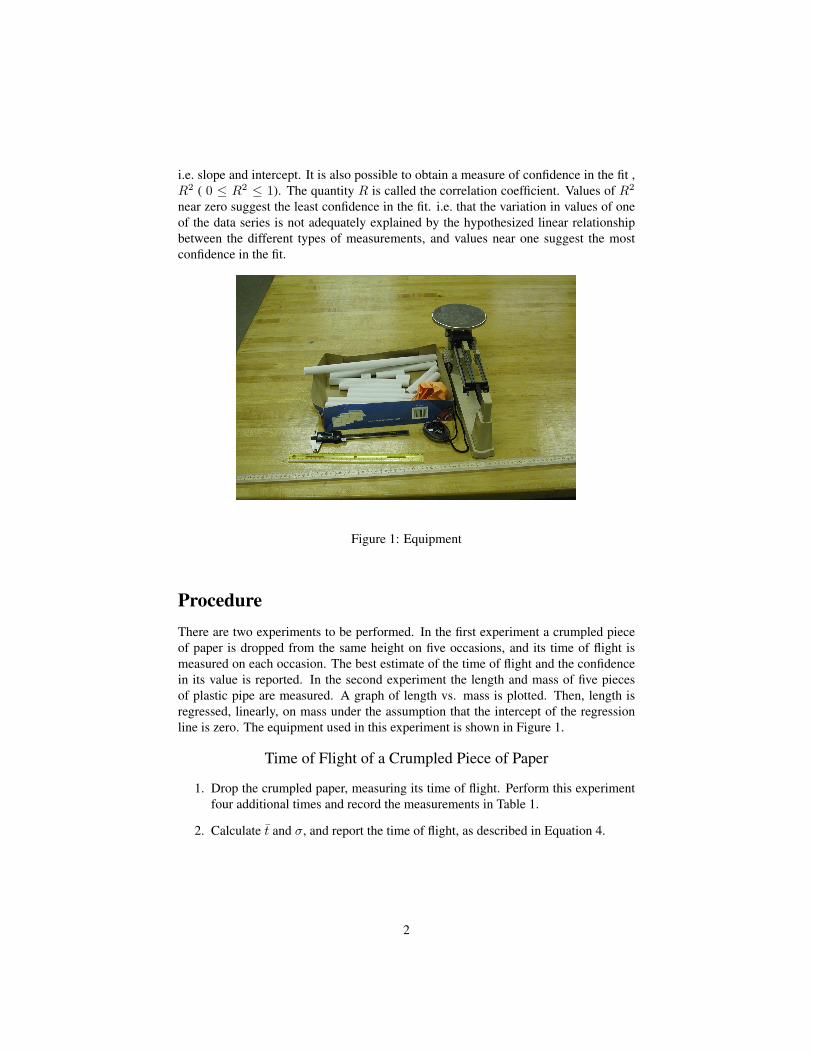
Figure 1: Equipment
ProcedureThere are two experiments to be performed. In the first experiment a crumpled pieceof paper is dropped from the same height on five occasions, and its time of flight ismeasured on each occasion. The best estimate of the time of flight and the confidencein its value is reported. In the second experiment the length and mass of five piecesof plastic pipe are measured. A graph of length vs. mass is plotted. Then, length isregressed, linearly, on mass under the assumption that the intercept of the regressionline is zero. The equipment used in this experiment is shown in Figure 1.
Time of Flight of a Crumpled Piece of Paper
1. Drop the crumpled paper, measuring its time of flight. Perform this experimentfour additional times and record the measurements in Table 1.
2. Calculate t̄ and σ, and report the time of flight, as described in Equation 4.
2

The Relationship between Mass and Length of Pieces of Plastic Pipe
1. Measure the mass and length of five pieces of plastic pipe. Choose pieces whoselengths are representative of the entire range of lengths. Record the data in Ta-ble 2.
2. By hand, plot a graph of length vs. mass, and estimate a linear fit to the data,whose y-intercept is zero (Length and mass are plotted as the ordinate and ab-scissa, respectively.). Calculate the slope of the regression line.
3. Using Microsoft Excel, plot a graph of the data, and perform a linear regression,forcing the intercept of the regression line to be zero. Report the slope and thevalue of R2 in Table 2.
4. Compare the slopes obtained from the two graphs. They should be approxi-mately equal.
5. Does the regression line provide an adequate fit to the data? If so, why wouldyou expect this to be the case?
3
Trial t (s)
1
2
3
4
5
Time (t̄± σ)
Table 1: Time of Flight Data and Calculations
Trial m (gm) l (cm)
1
2
3
4
5
Slope
R2
Table 2: Mass and Length Data and Calculations
4