Embed Size (px)
Citation preview

Measurement Uncertainty
Dr. G.M. Tewari, NABL Assessor, Mumbai
INTERNATIONAL WORKSHOP & TRAINING
PROGRAM ON GOOD
FOOD LABORATORY PRACTICES
15-19 November 2016
Conference Hall, Pilot Test House (PTH),
Export Inspection Agency, Mumbai

What is Measurement
Uncertainty?
“A parameter, associated with the result of a
measurement, that characterises the
dispersion of the values that could reasonably
be attributed to the measurand”
(ISO Guide) ( Measurand in other terms is referred as Analyte.)
The number after the ±

Expressing Uncertainty of Measurement
Photo
For example:
We might say that the length of a certain stick measures 20
centimetres plus or minus 1 centimetre, at the 95 percent confidence
level.
This result could be written:
20 cm ±1 cm, at a level of confidence of 95%.
The statement says that we are 95 percent sure that the stick is
between 19 centimetres and 21 centimetres long.
How to express uncertainty of measurement

What is NOT a measurement/ calculation?
Photo
• Mistakes made by operators are not measurement uncertainties.
They should not be counted as contributing to uncertainty. They
should be avoided by working carefully and by checking work.
• Tolerances are not uncertainties. They are acceptance limits which
are chosen for a process or a product.
• Specifications are not uncertainties. A specification tells you what
you can expect from a product.
• Accuracy (or rather inaccuracy) is not the same as uncertainty.
Unfortunately, usage of these words is often confused. Correctly
speaking, ‘accuracy’ is a qualitative term (e.g. you could say that ameasurement was ‘accurate’ or ‘not accurate’).
Concept

Why Uncertainty calculations? ----Requirement of
ISO/IEC 17025 Photo
Clause 5.4.6 on “Measurement Uncertainty” as per ISO/IEC-
17025:2005
5.4.6.1 A calibration laboratory, or a testing laboratory
performing its own calibrations, shall have and shall apply a
procedure to estimate the uncertainty of measurement for all
calibrations and types of calibrations.
Clause 5.4.6

Testing laboratories must document and implement
procedures for estimating uncertainty of measurement (refer
to NABL document No. 141 for application of this clause)
Clause 5.4.6.2
All uncertainty components which are of importance in
the given situation must be taken into account using
appropriate methods of analysis when estimating the
uncertainty of measurement
Clause 5.4.6. 3
ISO/IEC 17025

Every measurement has an uncertainty associated with
it, unless it is an exact, counted integer, such as the
number of trials performed
Every calculated result also has an uncertainty, related
to the uncertainty in the measured data used to calculate it.
This uncertainty should be reported either as an explicit ±
value or as an implicit uncertainty, by using the
appropriate number of significant figures
The numerical value of a ± uncertainty value tells you
the range of the result. For example a result reported as
1.23 ± 0.05 means that the experimenter has some degree
of confidence that the true value falls in between 1.18 and
1.28
UNCERTAINTY

Uncertainty of Measurement
• It is a parameter associated with the result of
a measurement, that characterizes the
dispersion of true values, which could
reasonably be attributed to the measurand.
• UNCERTAINTY IS ALWAYS WITH US
• ERRORS MAY BE CORRECTED
• UNCERTAINTY IS VITAL IN INTERPRETATING RESULTS OR DECIDING IFTHEY ARE FIT FOR THE PURPOSE
• HOW CAN WE QUANTIFY UNCERTAINTY?

The relationship of accuracy and precision may be illustrated by the familiar example of
firing a rifle at a target where the black dots below represent hits on the target
Good precision does not necessarily imply good accuracy. However, if an instrument is well
calibrated, the precision or reproducibility of the result is a good measure of its accuracy
PRECISION & ACCURACY

The error of an observation is the difference between the observation and the
actual or true value of the quantity observed. Returning to our target analogy,
error is how far away a given shot is from the bull's eye. Since the true value,
or bull's eye position, is not generally known, the exact error is also
unknowable
Types of Errors
Errors are often classified into two types: systematic and random
Systematic errors may be caused by fundamental flaws in either the
equipment, the observer, or the use of the equipment. For example, a balance
may always read 0.001 g too light because it was zeroed incorrectly. In a
similar vein, an experimenter may consistently overshoot the endpoint of a
titration because he/she is wearing tinted glasses and cannot see the first color
change of the indicator
ERROR & TYPES of ERRORS

Errors
• Random errors arise from unpredictable variations, for example:
-Uncontrolled environmental conditions
-Inherent instability of the measuring equipment
-Personal judgment of the operator or observer
• Systematic errors are:
-Reported in calibration certificate of instrument and of reference standards, purity and COA values.
These can be isolated and minimized
Quantification of both are possible.

DEFINITION: VARIATION
The spread or scatter of data around the average.
X
X
X XX
X
XX
X
X
X
X
X
X
X
X
XAverage
Time
X

13
Analytical Measurement Signal
Time
Accuracy, Precision &
BiasP
reci
sion
Standard
value
Met
hod
Bia
s
Accuracy= Measured value – Standard value
Measured values
at fixed timesMean
value

TWO TYPES OF VARIATION
1. Random (Common Causes)
• Inherent in all processes
• Unpredictable
• To reduce must change the process
• Vary in a completely non reproducible way from measurement to measurement
• Can be treated statistically
2. Non-random (Special Causes)
• Due to special or assignable causes
• Predictable
• Simpler to eliminate
• Frequently difficult to discover
• Can result in high precision, but poor accuracy
Understanding Variability

Related Terms and Phrases in MU calculations
• Accepted Reference Value- A value that serves as an
agreed upon reference for comparison
• Accuracy of Measurement- The closeness of
agreement between a test result and accepted
reference value
• Arithmetic Mean- The sum of values divided by
number of values
• Measurand- A quantity subject to measurement
(analyte)
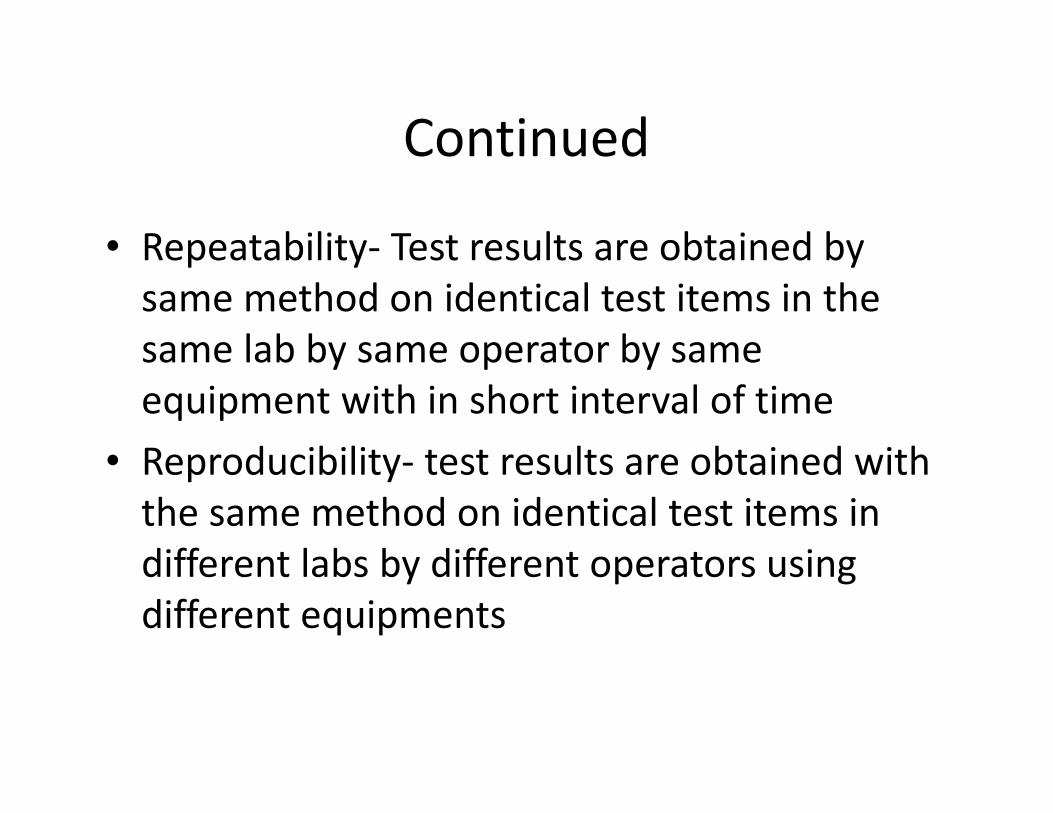
Continued
• Repeatability- Test results are obtained by
same method on identical test items in the
same lab by same operator by same
equipment with in short interval of time
• Reproducibility- test results are obtained with
the same method on identical test items in
different labs by different operators using
different equipments

Repeatability
• Closeness of the agreement between the results of successive measurements of the same measurand carried out under the same conditions of measurement (Test
results are obtained by same method on identical
test items in the same lab by same operator by
same equipment with in short interval of time)

Reproducibility
• Closeness of the agreement between the
results of measurements of the same
measurand carried out under changed conditions of measurement (test results are
obtained with the same method on identical
test items in different labs by different
operators using different equipments)

ISO Guide approach on MU calculations
• Specify the measurand
– including complete equation
• Quantify significant uncertainties in all parameters
– A: from statistics of repeated experiment
– B: by any other means (theory, certificates, judgement...)
• Express as standard deviation
• Combine according to stated principles

Continued
• Standard uncertainty- Uncertainty of the result of a
measurement expressed as a standard deviation
• Type A Uncertainty- Uncertainty evaluated by the
statistical analysis of series of observations
• Type B Uncertainty- Uncertainty evaluated by means
other than statistical analysis of series of
observations

Standard deviations: Square root of
Variance V = S2
1
2
−
−
=
∑
n
xxs2
i
Histogram

Standard Uncertainty
• Standard uncertainty is defined as one standard deviation.
Type A Uncertainty = From repeated results : Uniform distribution
Normal distribution also standard uncertainty
Type B Uncertainty = From certificates and literature.
Rectangular : Divisor: √ 3
Triangular : Divisor: √ 6
Coverage factor: 95 % : Factor = 2
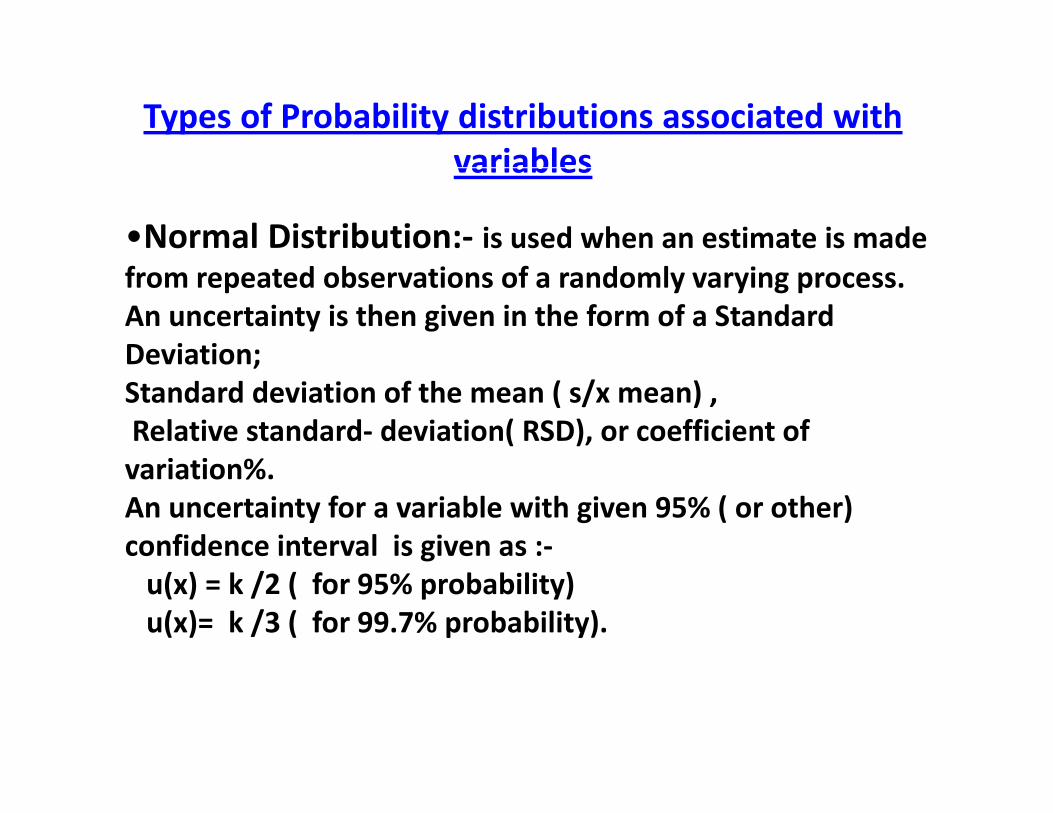
Types of Probability distributions associated with
variables
•Normal Distribution:- is used when an estimate is made
from repeated observations of a randomly varying process.
An uncertainty is then given in the form of a Standard
Deviation;
Standard deviation of the mean ( s/x mean) ,
Relative standard- deviation( RSD), or coefficient of
variation%.
An uncertainty for a variable with given 95% ( or other)
confidence interval is given as :-
u(x) = k /2 ( for 95% probability)
u(x)= k /3 ( for 99.7% probability).

Types of Probability distributions associated
with variables• ( B) Rectangular Distribution:- is used when the information is taken
from a certificate or specifications, which gives associated
uncertainty without specifying the level of confidence.
Example 1:- Concentration of the calibration standard is quoted in the
certificate as = 1000±2 mg /l.
Example 2:- purity of cadmium is quoted as 99.99 ± 0.1 %.
These are cases of uniform or rectangular distribution. Here the
distributions are such that individual units ( purity) probability are
more likely to be near extremes.
Therefore , an estimate is made by applying rectangular distribution.
Hence , assumed standard uncertainty = half width/ Sq . root of 3.

Types of Probability distributions associated
with variables
• ( C) Triangular Distribution:- is used , when the distribution is such that
occurrence of mean value from range is most probable.
Therefore , an estimate is made by applying triangular distribution.
Example :- Manufacturer quoted volume of Volumetric flask of 100ml
As 100 ± 0.1 ml ( Tolerance of o.1ml)
In this case a nominal value is most probable.
Therefore, an estimate is made by applying triangular
Distribution.
Hence , assumed standard uncertainty = half width/ Sq . root of 6.

Combined Uncertainty
• The component uncertainties are combined to produce an overall uncertainty.
• Some of the uncertainties may cancel each other out.
• Some may be interdependent.• Type A and Type B Uncertainty factors.• When combining all factors need to be
converted into similar unit of measurement eg. , %; gm; ml; 0C; unit less.
Uc=√UA2+UB
2
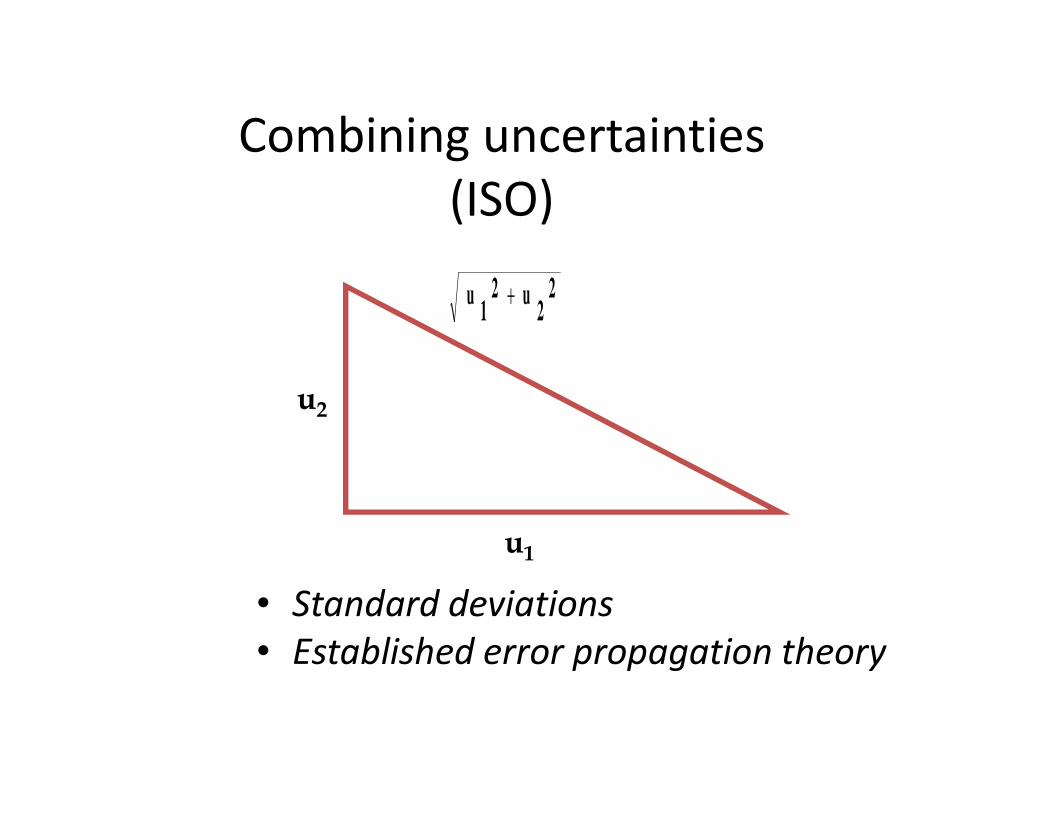
Combining uncertainties
(ISO)
• Standard deviations
• Established error propagation theory
u1
2 u2
2+
u2
u1

Expanded Uncertainty
• In some cases, the combined standard uncertainty needs to be multiplied by the appropriate coverage factor.
Expanded Uncertainty
UE=k * Uc
Where , k is normally 1.96 or 2 for
95 % confidence level

Sources of Uncertainty in Chemical testing
• Sampling: the sample measured may not represent the defined measurand
• Incomplete extraction and/or pre-concentration of the measurand, contamination of the measurement
sample, interferences and matrix effects
• Inadequate knowledge of the effects of environmental conditions on the measurement procedure or imperfect measurement of environmental conditions
• Cross-contamination or contamination of reagents or blanks
• Type B factors: Inadequate information

Continued
• Personal bias in reading analogue instruments
• Uncertainty of weights and volumetric equipment
• Instrument resolution or discrimination threshold
• Values assigned to measurement standards and reference materials
• Values of constants and other parameters obtained from external sources and used in the data-reduction algorithm
• Approximations and assumptions incorporated in the measurement method an procedure
• Variations in repeated observations of the measurand under apparently identical conditions.
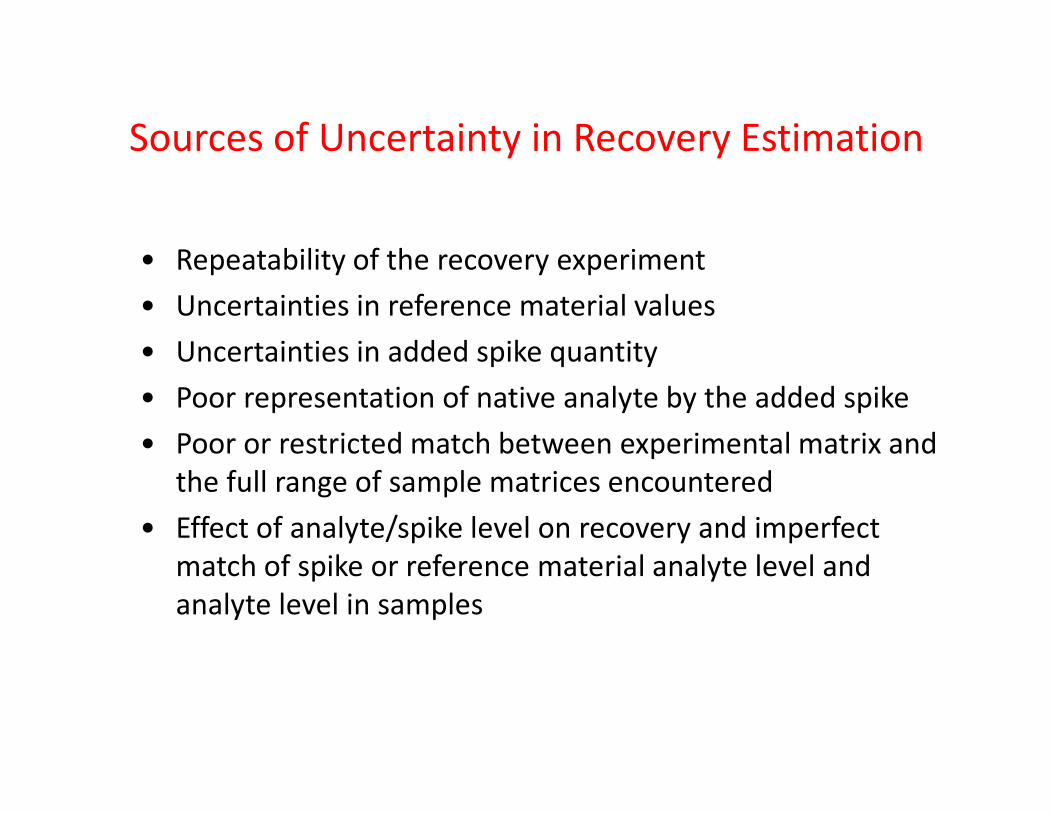
Sources of Uncertainty in Recovery Estimation
• Repeatability of the recovery experiment
• Uncertainties in reference material values
• Uncertainties in added spike quantity
• Poor representation of native analyte by the added spike
• Poor or restricted match between experimental matrix and
the full range of sample matrices encountered
• Effect of analyte/spike level on recovery and imperfect
match of spike or reference material analyte level and
analyte level in samples

Uncertainty ComponentsDetermination of Acesulfam-K
0 0.01 0.02 0.03 0.04 0.05 0.06 0.07 0.08
Contribution to Uncertainty (RSD)
TOTAL
Final volume
Sample volume
Stock concentration
Calibration
Precision
Sample recovery
Method recovery

Method of Stating Test Results
• When reporting the test results and its uncertainty, the use of excessive number of digits should be avoided
• Unless otherwise specified, the test result should be reported together with the expanded uncertainty at 95% level of confidence in the following manner
Measured value 100.1 (Units)
Uncertainty of measurement +/- 0.1 (Units)

Step by step Process of MU calculations
• 1. Define the analyte which is being calculated with the formula for calculation.
• Look for all probable causes of MU sources.• Repeat/ Reproduce analysis data: Type A
• Data From other sources involved: Type B
• Create a Fish Bone diagram to understand the probable sources and sub sources for MU.
• Generate Data on both Type A and Type B.

Uncertainty of
Pesticides
Standard CalibrationPrecision
Stock PurityStandards/ CRM Volumetric flasks
Pipettes
Volumetrics
Weighment
Sample
preparation
FISH BONE DIAGRAM

Type A calculations
• Perform repeat/ reproducible analysis on parameter
being evaluated.
– S1; S2; S3; S4; S5; S6; S7: S8; S9; S10 --------
– Calculate Average of above, Av = Σ ( S1 + S2+……. S10/n )
– Calculate Standard deviation, SD = STDV(S1 + S2+……. S10 )
– Calculate Standard uncertainty, SU = SD/ SQRT (n)
– Calculate Relative standard uncertainty,
RSU ( repeatability); UA1 = SU/ Av ; This is a unit less
entity. Why ????
Also called as relative Type A uncertainty.

Calculation of Type B uncertainties
Example Electronic Balance• From calibration certificate: External agencies
Value for specific range( weights) M, @95 % CL = x units.
UB = x/ 2 , or 1.96 units
UB1 =RSD = x/2*M unitless.
• From balance accuracy : say 0.12 % ( Supplier manual)
Error = 0.12/ 100 = 0.0012 unitless.
UB2: Assuming rectangular distribution : 0.0012/ SQRT (3)
• From Resolution factor: Say 0.1 mg
Assuming rectangular distribution : 0.1/ SQRT (3).
UB3 : Relative Uncertainty = 0.1/SQRT(3)* M9 in mg). unitless.
• Balance Uncertainty U Bal = SQRT { (UB1)2 + (UB2)2+ (UB3)2 }

Type B continued
Example Volumetric Pipette , say 10 ml
From calibration certificates or repeat analysis
For Repeat analysis follow Type A calculations. UBP1
From calibration certificates say @ 95 %, follow process for Balance UB1
= UB UBP1 ( unitless)
Uncertainty due to tolerance or readability say 0.1 ml.
Assuming triangular distribution , RSU, UBP2 = 0.1/SQRT(6)* 10 unitless
Uncertainty due to temperature, coef. of expansion: 2.1 *10 -4
@ 20C. Working temp say 25C ; factor = 5* 2.1 *10 -4
Assuming triangular distribution and 25C working temp. RSD;
UBP3= 5* 2.1 *10 -4 / 25* SQRT(6). Unitless
Pipette Uncertainty U Pip = SQRT { (UBP1)2 + (UBP2)2+ (UBP3)2 }

Type B uncertainty continued
Example preparation of standards
• Factors : balance uncertainty; volumetric uncertainty,
purity of standard. May be temperature of prepn.
• Balance Uncertainty U Bal = SQRT { (UB1)2 + (UB2)2+ (UB3)2 }
• Flask ( 100 ml) Uncertainty U Pip = SQRT { (UBP1)2 + (UBP2)2+ (UBP3)2 }
• Standard purity uncertainty:
– From certificate say @ 95 % : 99.5 % purity
U Stand Us = 99.5/100*2 unit less
– From purity from COA = 99.5 %
U Stand Us = 99.5/100* SQRT (3).
• Standard Reag. Un = SQRT { (UBal )2 + (UVol)2+ (Us)2 }

Type B uncertainty continued
Example sample preparation & recovery
• Factors : balance uncertainty; volumetric uncertainty,
Repeat recovery data. May be temperature of prepn.
• Balance Uncertainty U Bal = SQRT { (UB1)2 + (UB2)2+ (UB3)2 }
• Flask ( 100 ml) Uncertainty U Pip = SQRT { (UBP1)2 + (UBP2)2+ (UBP3)2 }
• Recovery studies from Validation records ( repeat analysis):
– From recovery studies : 10 determinations say at 50 ppm;
average value say 48.5 ppm; Stand Dev. = 0.5 ppm
U Stand U = 0.5/SQRT (10)
RSD Uncertainty , Urec = 0.5/ SQRT (10)* 0.5
• Standard recovery Un = SQRT { (UBal )2 + (UVol)2+ (Urec)2 }

Combined ( CU) & Expanded (Exp U)
Uncertainty
CU = SQRT {(All type A Uns.)2+ (All type B Uns.)2}
Expanded Uncertainty = CU * Factor of 2 for 95% confidence level
These are all unit less.
Expanded Un. with unit= Exp Un * Average
Result = Average ± Ex Un in units.

Measurement of Uncertainty
Microbiological Parameters

References & Guides
• US FDA BAM
• ISO Guide 108: Guidelines for Estimating Uncertainty for
Microbiological Counting Methods
• ISO 19036
• Appendix J – STWG –Part 3; AOAC 9-30-05. Uncertainty associated
with micro biological analysis.
Presumption : Type B , which is also considered as Bias, is
insignificant as compared to repeat/ reproduced data ( Type A
values). Hence this factor is ignored during MU calculations for
biological system.

Step 1 – Transform the raw data by taking the log base 10 value (log10) of the
data (column 2, 4).
Step 2 – Calculate the overall mean of 40 results in columns 2 and 4, this is
2.2626
Step 3 – Calculate the difference between the transformed replicates (column 5).
Step 4 – Square the differences between the transformed replicates (column 6).
Step 5 – Add the differences together (column 6) and divide by 2n, where n =
the total number of pairs of duplicates (for this example n = 20) to get 0.010103.
Step 6 – Take the square root of the result in step 5; this equals the pooled
reproducibility standard deviation, which is 0.100514.
Step 7 – Convert this standard deviation into a relative standard deviation by
dividing by the mean from Step 2, which produces an RSD of 0.044425.

Step 8 – To provide a higher range of values that cover what is likely to be
observed in other samples, apply the coverage factor (k=2 for 95% coverage) to the
RSD to get the estimate of the expanded uncertainty, 0.08885 (Note this is a log10
value).
Step 9 – To calculate the uncertainty for any subsequent laboratory result, the result
is first converted to the log base 10 value (log10), multiplied by 0.08885 and then
this expanded uncertainty is added and subtracted from the log value.
Step 10 – To estimate the MU of a sample, convert the log value for the sample
measurement back to CFU for the reported result. This is accomplished by taking
the anti-log of each of the
endpoints of the interval (anti-log of x = 10x).
NOTE: By convention the results are always rounded down” for the value at the
lower end of the range and always “rounded up” for the value at the upper end.
In this way the minimal 95% coverage is preserved.For example, for a result of 150 CFU: 150 in log10 = 2.1761 and the expanded uncertainty
in log counts is 2.1761 times 0.0998 = 0.2172. Adding and subtracting from 2.1761 gives an
interval from 1.9589 to 2.3933; transforming back to counts: 10 1.9589 =90.97, and 10
2.3933 = 247.33. Therefore the uncertainty interval is 90 to 248 CFU. Results can also be
just mentioned as log values.

Replicates generated under reproducibility conditions
Raw Data
(actual CFU
recovered) –
First
Replicate
Log10
Value
Raw Data
(actual CFU
recovered) –
Second
Replicate
Log10
Value
Difference
between
Replicates
(Log10
Value)
Difference
between
Replicates
Squared
131 2.1173 142 2.1523 -0.0350 0.00123
69 1.8388 90 1.9542 -0.1154 0.01332
65 1.6532 76 1.8808 -0.2276 0.05180
45 1.6021 55 1.7404 -0.1383 0.01913

Uncertainty for Micro results
S No Counts in
replicate
Data in log 10 Counts in
replicate
Data in log 10 Difference
between
replicate
Square the
difference
1 230 2.3617 242 2.3838 -0.0221 0.00049
2 169 2.2279 190 2.2788 -0.0509 0.00259
3 145 2.1614 176 2.2455 -0.0841 0.00708
4 140 2.1461 155 2.1903 -0.0442 0.00195
5 131 2.1173 120 2.0792 0.0381 0.00145
6 133 2.1239 140 2.1461 -0.0223 0.00050
7 137 2.1367 162 2.2095 -0.0728 0.00530
8 186 2.2695 150 2.1761 0.0934 0.00873
9 218 2.3385 58 1.7634 0.5750 0.33066
10 200 2.3010 243 2.3856 -0.0846 0.00715
11 139 2.1430 154 2.1875 -0.0445 0.00198
12 317 2.5011 280 2.4472 0.0539 0.00291
13 219 2.3404 233 2.3674 -0.0269 0.00072
14 128 2.1072 146 2.1644 -0.0571 0.00327
15 206 2.3139 212 2.3263 -0.0125 0.00016
16 207 2.3160 289 2.4609 -0.1449 0.02100
17 145 2.1614 162 2.2095
-0.0481
0.00232 2.1761- 0.2172 1.9589 90.77
18 198 2.2967 228 2.3579 -0.0613 0.00375
19 340 2.5315 320 2.5051 0.0263 0.00069 2.1761 + 0. 2172 2.3933 247.33
20 240 2.3802 220 2.3424 0.0378 0.00143
sum 0.40412
Ave 2.2638 2.2614
Sq root Pooled reproducible Std. deviation 2.2626 0.100514011
RSD 183.0443 150.00
2.1761
0.044424978
Expanded Factor 2 0.088849956 0.0998
Range of uncertainty 2.2626* 0.08884 0.201009 2.1761 *0.0998 0.2172
Average 183.5533 2.0525 2.4797
Result 183.0000 149 225

For example, for a result of 150
CFU: 150 in log10 = 2.1761 and
the expanded uncertainty in log
counts is 2.1761 times 0.0998 =
0.2172. Adding and subtracting
from 2.1761 gives an interval from
1.9589 to 2.3933; transforming
back to counts: 101.9589 =90.97,
and 102.3933 = 247.33. Therefore
the uncertainty interval is 90 to 248
CFU. Results can also be just
mentioned as log values.