Embed Size (px)
Citation preview

J. Sens. Sens. Syst., 9, 227–238, 2020https://doi.org/10.5194/jsss-9-227-2020© Author(s) 2020. This work is distributed underthe Creative Commons Attribution 4.0 License.
Measurement uncertainty analysis of field-programmablegate-array-based, real-time signal processing for
ultrasound flow imaging
Richard Nauber, Lars Büttner, and Jürgen CzarskeLaboratory of Measurement and Sensor System Technique (MST), Faculty of Electrical
and Computer Engineering, TU Dresden, 01062 Dresden, Germany
Correspondence: Richard Nauber ([email protected])
Received: 2 April 2020 – Revised: 9 June 2020 – Accepted: 20 June 2020 – Published: 31 July 2020
Abstract. Research in magnetohydrodynamics (MHD) aims to understand the complex interactions of electri-cally conductive fluids and magnetic fields. A promising approach for investigating complex instationary flowphenomena are lab-scale experiments with low-melting alloys. They require a noninvasive flow instrumentationfor opaque liquids with a high spatiotemporal resolution, a low velocity uncertainty and a long measurement du-ration. Ultrasound Doppler velocimetry can achieve multiplane, multicomponential flow imaging with multiplelinear ultrasound arrays. However the average raw data output amounts to 1.2GBs−1 at a frame rate of 33Hzin a typical configuration for 200 transducers. This usually prevents long-duration measurements when offlinesignal processing is used.
In this paper, we propose an online signal-processing chain for pulsed-wave Doppler velocimetry that is tai-lored to the specific requirements of flow imaging for lab-scale experiments. The trade-off between measure-ment uncertainty and computational complexity is evaluated for different algorithmic variants in relation tothe Cramér–Rao bound. By utilizing selected approximations and parameter choices, a prepossessing could beefficiently implemented on a field-programmable gate array (FPGA), enabling a typical reduction of the databandwidth of 6.5 : 1 and online flow visualization. We validated the performance of the signal processing ona test rig, yielding a velocity standard deviation that is a factor of 3 above the theoretical limit despite a lowcomputational complexity.
Potential applications for this signal processing include multihour flow measurements during a crystal-growthprocess and closed-loop velocity feedback for model experiments.
1 Introduction
Many important industrial processes, such as continuoussteel casting and photovoltaic wafer production, involvemetal or semiconductor melt flows. The quality of the prod-uct and the energy efficiency of the process strongly dependson the flow behavior of the liquid (Müller and Friedrich,2010; Gardin et al., 1995; Yasuda et al., 2007). A noncontactway of influencing the flow of electrically conductive meltsis the application of magnetic fields that introduce Lorentzforces to the fluid. Investigating the interaction of a magneticfield with the flow pattern and optimizing the spatiotempo-ral structure of the magnetic field for different applications
are subjects of ongoing research in magnetohydrodynam-ics (MHD). Besides numerical simulations, low-temperature,model-scale experiments are important tools for MHD inves-tigations (Eckert et al., 2007b). They often require advancedflow instrumentation for visualizing complex and instation-ary flows in opaque liquids. A typical set of requirements forMHD research are as follows:
– Noninvasiveness – the influence of the instrumentationto the flow should be negligible (Eckert et al., 2007a).
– Flow imaging capability – the fluid’s velocity should bevisualized in multiple planes (2D) with two or three ve-
Published by Copernicus Publications on behalf of the AMA Association for Sensor Technology.

228 R. Nauber et al.: Measurement uncertainty analysis of ultrasound flow imaging
locity components (2c or 3c) in order to adequately rep-resent complex flow patterns.
– Spatial resolution – the relevant flow structures have tobe resolved, typically in the range of 10mm (Timmelet al., 2011).
– Temporal resolution – fluctuations (typically at1 . . .5Hz) have to be resolved in order to captureinstationary flows (Timmel et al., 2011).
– Long measurement duration – flow phenomena on dif-ferent timescales should be adequately captured; for in-stance, rapid spontaneous changes of the flow regimein a rotating flow (Galindo et al., 2017) or in multihourmodel experiments of the semiconductor crystallizationprocess (Thieme et al., 2017).
– Capability of near-wall measurements – in typical MHDexperiments, the metal melt is contained in a vessel. Thevicinity of the wall is especially important because theLorentz force is often concentrated in this region. Con-trary to, for instance, medical applications, the walls canbe seen as completely stationary in most cases.
– Online capability – conducting long-running MHD ex-periments requires the ability to examine the data duringthe duration of the measurement. Some model experi-ments in the semiconductor crystallization process evenbenefit from an active control of parameters, like mag-netic field intensity and temperature gradient, based onthe feedback from online velocity data to stabilize theflow (Thieme et al., 2017).
A measurement system for flow mapping of opaque liq-uids, namely the ultrasound array Doppler velocimeter(UADV; Nauber et al., 2013a, b), was presented in previ-ous publications. It extends the pulsed-wave Doppler princi-ple (Takeda, 1986; Baker, 1970) by employing multiple lin-ear sensor arrays to achieve multiplane, two-componentialflow imaging. The sensors are designed to achieve a lateralresolution of ≈ 3mm in Galinstan (GaInSn). A combinationof spatial- and time-division multiplexing allows one to par-allelize the scanning process for a planar velocity map; henceincreasing the temporal resolution compared to a strict se-quential scan. However, online processing of the data for200 transducer elements simultaneously on 32 channels at atemporal resolution typically of 33Hz overburdens PC-basedhardware with 1.2GBs−1. Therefore, only discontinuous of-fline measurements could be performed with a limited dura-tion of a few seconds. This severely impedes the usability ofthe UADV in the context of MHD experiments and restrictsthe investigations into stationary or periodic flows.
Although several investigations on the measurement un-certainty of Doppler velocity estimation methods for laser-based instrumentation (Fischer et al., 2010), for flow-ratemeasurements in a pipe (Furuichi, 2013), and for blood-flow
measurements in the human body (Lovstakken et al., 2007)have been performed, no comprehensive measurement un-certainty budget in the context of instrumenting an MHD ex-periment has been presented to the knowledge of the authors.
This paper provides a signal-processing chain that is tai-lored to the specific requirements of MHD model experi-ments and shows a real-time implementation using a field-programmable gate array (FPGA). It enables the UADV sys-tem to perform long-duration measurements with high framerates and online flow visualization. Furthermore, we evalu-ate the measurement uncertainty of the whole UADV sys-tem in the context of MHD experiments and present an un-certainty budget according to the methodology proposed bythe “Guide to the expression of uncertainty in measurement”(GUM; JCGM, 2008) for a typical configuration.
2 Pulsed-wave ultrasound Doppler velocimetry
2.1 Measurement principle
In pulsed-wave ultrasound Doppler velocimetry (PW–UDV),short bursts are emitted periodically with a pulse repeti-tion frequency fPR (Baker, 1970). The emission times ts =nb/fPR span the so-called slow-time axis ts, with nb =
0. . .NEPP being the bursts number. The emitted bursts usu-ally consist of Nperiods periods of a sinusoidal wave, with thefrequency f0. As the bursts travel through the fluid, scatter-ing particles reflect a fraction of the signal back to the ul-trasound transceiver. The received echo signal z(tf, ts) is ac-quired, starting from the emission time along the fast-timeaxis tf. Figure 1 depicts an example of the echo signal for asingle moving scattering particle.
The movement of a scattering particle leads to a phase shiftof the echo signal between multiple burst emissions (Kasaiet al., 1985). The mean phase shift per time unit, expressedas mean frequency fd, is related to the velocity v for a givenspeed of sound c by the following:
v =−12fd
ftxc, (1)
with ftx denoting the mean frequency of the received signalburst and c� v. The mean phase shift per time unit fd canbe interpreted as a Doppler frequency shift fd (Kasai et al.,1985); hence the name Doppler velocimetry.
The time since the burst emission tf corresponds to the dis-tance d between the scattering particle and the transducer ac-cording to the following equation:
d =12tfc. (2)
This allows a spatially resolved flow measurement along theaxis of the transducer, given that the scattering particles fol-low the motion of the fluid with negligible slip. The axial res-olution can be estimated with the following (Jensen, 1996):
1d =12Nperiods
c
f0. (3)
J. Sens. Sens. Syst., 9, 227–238, 2020 https://doi.org/10.5194/jsss-9-227-2020

R. Nauber et al.: Measurement uncertainty analysis of ultrasound flow imaging 229
Figure 1. PW–Doppler principle: multiple bursts are emitted at ts =nb/fPR, with a repetition rate fPR. This constitutes the slow-timeaxis ts. After emission, the received echo signals are sampled with afrequency fs along the fast-time axis tf. The echo signal phase shiftcorresponds with the velocity of the scattering particles in the fluid.An example of a single particle moving away from the transducer isgiven.
The lateral resolution 1x is given by the width of the ultra-sound beam, which is a result of the transducer geometry,the frequency f0, and the speed of sound c in the fluid. Thetemporal resolution1t of the velocity measurement is deter-mined through the following:
1t =NEPP
fPR. (4)
2.2 Ultrasound array Doppler velocimeter
The ultrasound array Doppler velocimeter (UADV) is a mod-ular research platform developed at the Laboratory of Mea-surement and Sensor System Technique (MST) for flowimaging in opaque liquids with PW–UDV. It is flexible andespecially well suited for instrumenting a wide range of ex-periments in the field of MHD. The hardware of the UADVconsists of individually configurable modules driving 25 ul-trasound transducers each. It can be scaled to support upto 200 transducers in various configurations; for instance,in four linear arrays which can be individually parameter-ized regarding ultrasound frequency, pulse shape and length,and pulse-repetition frequency (Nauber et al., 2016; Büttneret al., 2013).
A module of the UADV consists of an arbitrary functiongenerator and a power amplifier for generating parameteriz-able burst signals which are routed through a programmableswitching matrix and a transmit/receive switch to the trans-ducers. The received echo signals are amplified with a para-
metric gain and routed to the digitization unit. A singlemicrocontroller-driven control unit provides the overall syn-chronization and the communication with the host PC. Usinga combined spatial- and time-division multiplexing scheme,an ultrasound transducer array can scan a measurement planeat higher rates than a strict sequential scan. The UADV sup-ports four independent digitization channels per module. Thedetailed description of the measurement system is given inNauber et al. (2016).
3 Signal processing for velocity estimation
3.1 Overview
The signal processing for PW–UDV can generally be classi-fied into wideband and narrowband techniques; a compre-hensive comparison is given by Torp et al. (1993). Whileparts of the signal processing in the radio frequency (RF)band can be realized in analog circuitry (Shung, 2015),fully digital implementations have found widespread use inthe last decades because of the availability of fast digitiz-ers and the increased flexibility and robustness of such ap-proaches. To simultaneously handle a high number (e.g.,32) of channels through a fully digital signal-processingchain, very large data bandwidths have to be processed. Thiscan be achieved by utilizing the parallel-processing capabil-ity of a field-programmable gate array (FPGA). Especiallynarrowband algorithms are very suitable for FPGA-basedimplementations, due to their low computational complex-ity (Alam and Parker, 2003; Loupas et al., 1995a). Therefore,this paper focuses on investigating the most common narrow-band method, the velocity estimator by Kasai et al. (1985)and the extensions proposed by Loupas et al. (1995b).
A typical narrowband signal-processing chain is shown inFig. 2. In this fully digital realization, the slow time ts is sam-pled for each burst nb at ts = nb
1fPR
and the fast time tf issampled with a frequency fs as follows:
z′raw(k, nb)= z(tf = k/fs, ts = nb/fpr),
k = 0, 1, . . .K, nb = 0, 1, . . .NEPP. (5)
The signals are then bandpass filtered to reduce noise con-tributions outside of the bandwidth of the transmitted ultra-sound signal. A quadrature demodulation is performed, con-sisting of a Hilbert transform and a subsequent down sam-pling. Static echoes are removed through a clutter reductionfilter (CRF) and the velocities are estimated by an autocorre-lation.
3.2 Quadrature demodulation
In order to meet the assumptions of the narrowband signalprocessing and to reduce the influence of noise, a bandpass
https://doi.org/10.5194/jsss-9-227-2020 J. Sens. Sens. Syst., 9, 227–238, 2020

230 R. Nauber et al.: Measurement uncertainty analysis of ultrasound flow imaging
Figure 2. Signal flow for a typical implementation of the Kasai algorithm: raw echo signals are bandpass filtered, quadrature demodulatedand down sampled. The subsequent operations are performed on the complex demodulated signals, namely clutter-reduction filtering andvelocity estimation.
filtering is performed as follows:
z′(k, nb)=Nperiods∑n=0
ci · z′raw(k− n, nb), (6)
with the filter coefficients ci . In order to maximize the SNRfor signals with additive white Gaussian noise, a matchedfilter is used (Turin, 1960) as follows:
ci = stx(Ntx− i), i ∈ [1, Ntx], (7)
with the transmitted signal stx with Ntx samples.The result of the quadrature demodulation is a complex
signal h′unfilt(k, nb) in the baseband, which can be sampledat a lower rate (reduction by a factor of nsub) than the rawsignal, as follows:
h′unfilt(k/nsub,nb)= z′(k, nb)+ j · z′(k, nb), (8)
with Nb = 0, 1, . . .Nepp, k = 0, 1, . . .K and the Hilberttransform signal z′(k, nb) (with 90 ◦ phase shift with respectto z′).
3.3 Clutter-reduction filtering
A common problem of ultrasound Doppler flow measure-ments is distinguishing between static echoes originatingfrom the walls (the so-called clutter) and echoes originat-ing from scattering particles. Multiple reflections from thetransmitted burst inside the wall superimpose the signal fromscatter particles in the vicinity of the wall. For this problem, amultitude of signal-processing methods were proposed, mostof them based on digital filters (finite impulse response (FIR)or infinite impulse response (IIR) filters) with various initial-ization techniques (Lee et al., 2009). With these methods, theclutter is distinguished from the particle echoes by a veloc-ity close to zero, respectively, by a Doppler frequency shift
close to zero. Because filtering will influence the spectrum ofthe signal, a bias may be introduced to the subsequent veloc-ity estimation, depending on the frequency cutoff. For typ-ical MHD experimental setups, the wall can be assumed tobe completely stationary (in contrast to, e.g., medical appli-cations where clutter is often constituted by slowly movingtissue; cf. Jensen, 1996); therefore, a steep cutoff at a fre-quency of zero is desirable. The simplest and computation-ally most efficient approach is to filter the constant compo-nent of the demodulated IQ signal by subtracting its meanvalue, which is the equivalent of applying a very narrow-band, high-pass filter (Thomas and Hall, 1994; Jensen, 1996;Torp, 1997; Bjaerum et al., 2002) as follows:
h′(k/nsub, nb)=h′unfilt(k/nsub, nb)
−1
NEPP
NEPP−1∑n′b=0
h′unfilt(k/nsub, n′
b). (9)
As the filter is noncausal, all NEPP samples have to be ac-quired before the result can be computed.
3.4 One-dimensional autocorrelation algorithm
A widely used approach for velocity estimation is the auto-correlation method proposed by Kasai et al. (1985), whichoperates solely in the domain of IQ-demodulated echo sig-nals and therefore can be implemented very efficiently (Alamand Parker, 2003). It uses the properties of the signals’ dis-crete autocorrelation function as follows:
R′(1k, 1nb)=K/nsub−1k−1∑
m=0
NEPP−1nb−1∑n=0
h′(m, n) ·h′∗(m+1k, n+1nb), (10)
where its values at a lag of 1 relate to the center ofmass of the signal’s power density spectrum through the
J. Sens. Sens. Syst., 9, 227–238, 2020 https://doi.org/10.5194/jsss-9-227-2020

R. Nauber et al.: Measurement uncertainty analysis of ultrasound flow imaging 231
Wiener–Khinchin theorem. As shown by Kasai et al. (1985)and Jensen (1996), the mean Doppler shift fd can be approx-imated through evaluating the autocorrelation function at alag of 1nb = 1 slow-time samples as follows:
fd ≈ 1/TPR arg(R(1k = 0, 1nb = 1)). (11)
This autocorrelation computation can be expressed solely byrepeatedly multiplying accumulate operations and thereforecan be implemented very efficiently. Kasai’s method approx-imates the center frequency fd of the received signal with thefrequency of the emitted signal as follows:
frx ≈ f0. (12)
Being based on a phase estimation, the Kasai algorithm is in-herently limited in the maximum measurable velocity. Giventhe 2π -phase ambiguity in Eq. (11), the measurable velocityrange resulting from Eq. (1) is (Jensen, 1996) as follows:
v ∈ [±vmax]; vmax =cfPR
4f0. (13)
3.5 Two-dimensional autocorrelation algorithm
An extension of Kasai’s autocorrelation method is proposedby Loupas et al. to improve its performance in the followingtwo regards (Loupas et al., 1995b):
1. The assumption of an unchanged center frequency of anultrasound burst throughout emission, propagation in-side the fluid and reception is discarded. This allows oneto account for the effect of frequency-dependent atten-uation, which is present in most relevant fluids. By ex-plicitly estimating the center frequency of the receivedsignal, a systematic velocity error stemming from therelationship in Eq. (1) v ∝ 1/f tx is avoided.
2. An information loss occurs if only a narrow-band partof a broadband echo signal is processed. Hence a bet-ter estimation of the velocity is achieved by including alarger part of the signal spectrum.
Both aspects are addressed by increasing the dimension-ality of Kasai’s autocorrelation; instead of just correlatingalong the slow-time axis, a 2D autocorrelation along theslow- and fast-time axis is performed. An autocorrelationwith a lag of one fast-time sample yields the estimate of the
center frequency as follows:
frx ≈ fs arg
(∑m
R(1k = 1, 1nb = 0)
)
≈1
2πfs
nsub
(2πb1/2+ nsubf0/fsc+ argR′(1, 0)
)(14)
frx ∈
(fs
nsubb1/2+ nsubf0/fsc±
12fs
nsub
]. (15)
Furthermore, the estimation of the frequencies ftx and fdcan be performed using M samples per gate, as follows:
fd ≈1
2πfPR argR′(0, 1). (16)
The extension of the Kasai autocorrelation algorithm po-tentially improves the estimation performance while still pre-serving a low computational complexity.
4 Online-capable, FPGA-based signal-processingimplementation
In order to provide online capability, the signal process-ing depicted in Fig. 2 has been realized on an FPGA (NIPXIe-7965R; National Instruments, Austin, Texas, USA).The FPGA communicates with a host PC through a periph-eral component interconnect express (PCIe) bus and has theability to stream data through direct memory access into themain memory of the PC.
The amplified echo signals (UPP,max = 1V) are digitizedthrough an A/D converter module (NI-5752; National Instru-ments, Austin, Texas, USA) for nch = 32 channels at an ex-ternally provided sampling rate 32MHz> fs > 50MHz witha quantization of 12 bit. The raw data rate rADC at this stageis as follows:
rADC = nch · nsampbytes · fframe ·NEPP ·Nsw ·Ngates ·K. (17)
Data are processed as signed 16 bit integer (nsampbytes =
2B) and, for a typical configuration as listed in Table 1, thedata rate amounts to 1.2GBs−1.
This data bandwidth is hardly suitable for continuousstreaming to a storage device over a long duration (> 1h)with common PC hardware. Therefore, raw data are onlybriefly retrieved for debugging purposes or for low frame-rate measurements and are otherwise not transferred to thehost.
The signal-processing steps that perform an IQ demodu-lation (bandpass filtering, Hilbert transform and down sam-pling) are significantly reduced in their computational com-plexity by fixing the ratio of the sampling frequency fs to theultrasound center frequency f0 at ftx/fs = 1/4. The matchedfilter can be realized for a sinusoidal transmit signal at ftx
https://doi.org/10.5194/jsss-9-227-2020 J. Sens. Sens. Syst., 9, 227–238, 2020

232 R. Nauber et al.: Measurement uncertainty analysis of ultrasound flow imaging
Table 1. Overview of the parameters of the signal processing.
Parameters
Number of channels Nch = 32Number of bytes per sample Nsampbytes = 2BNumber of gates Ngates = 51Subsampling factor Nsub = 13Multiplexing steps Nsw = 6Number of emissions NEPP = 50
withNperiods periods, assuming ftx ≈ frx with only trivial fil-ter coefficients ci , as follows:
ci =
1 i = 2+ 4n0 i = 1+ 4n,i = 3+ 4n−1 i = 4n
; n ∈ [0, Nperiods].
(18)
This allows one to implement the filtering without multipli-cation operations, only negations and additions are needed.
To provide a low computational complexity approximationof the Hilbert transform for a narrowband case, a fixed timedelay can be employed (Kantz et al., 2012) as follows:
z′(k, nb)≈ z′(k− 1, nb), (19)
where ftx/fs = 1/4. The signal processing up to this pointcontains just the summation, negation and storage primitivesand therefore can be implemented on an FPGA with modestresources. The data rate rIQ at this stage for a typical config-uration is given by the following:
rIQ = rADC · 2 · 1/nsub. (20)
Through the data reduction of 6.5 : 1, the data rate atthis stage is rIQ = 185MBs−1 for a typical configuration, aslisted in Table 1. A continuous data streaming to a storagedevice can be sustained for a long duration at this rate.
5 Performance evaluation of narrow-bandsignal-processing algorithms
5.1 Theoretical limit of measurement uncertainty
In order to characterize the performance of a signal-processing algorithm, it is not only helpful to have relativedata compared to other algorithms but also to relate it toa fundamental limit of attainable precision. This absolutelimit of uncertainty can be provided by means of the es-timation theory using the Cramér–Rao bound (CRB; Rad-hakrishna Rao, 1945; Cramér, 1946). Given a suitable signalmodel, the CRB represents the lowest possible variance forestimating a parameter from the signal with an unbiased esti-mator. In the following, a simple signal model for a discrete
time idealized ultrasound echo is described and a derivationof the CRB for velocity estimation is given.
A simple approximation of the ultrasound echo signalrealizations x(k, nb, θ , σ
2n ) consists of a sinusoidal signal
s(k, nb, θ ) superimposed with additive white Gaussian noisen(k, nb, σ
2n ) sparsely and periodically sampled in the fast-
(k) and slow-time (nb) axis as follows:
x(k, nb, θ , σ2n )= s(k, nb, θ )+ n(σ 2
n , k, nb), (21)
with
s(k, nb, θ )= Acos(
2π (f0+ fd )(k
fs+nb
fPR
)+ϕ0
),
(22)
and A being the amplitude of the scattering particles’ echo,ϕ0 a constant phase, and n(k, nb, σ
2n ) Gaussian white noise,
with a variance σ 2n and zero mean.
The unknown quantities are as follows:
θ =
A
fdϕ0
. (23)
The CRB provides the lower boundary for the variance ofan estimator θi according to the inequality, as follows:
var(θi)≥ CRB(θi)=[I−1(θ )
]ii, (24)
with I(θ ) being the Fisher information matrix, as follows:
[I(θ )]ij =−E[δ2 ln(p(x, θ ))
δθiδθj
]. (25)
Kay (1993) provided a formula for the case when theprobability density function p(x, θ ) of the signal model x,Eq. (22), is a Gaussian joint probability function as follows:
[I(θ )]ij =1σ 2n
∑k
∑nb
δs(k, nb, θ )δθi
δs(k, nb, θ )δθj
. (26)
The differentiation of s(k, nb, θ ) with respect to the un-known quantities is performed analytically, while the matrixinversion was performed numerically using MATLAB (TheMathWorks, Inc., Natick, Massachusetts, USA). The result-ing CRB for the velocity uncertainty as a function of thesignal-to-noise ratio (SNR) is given in Fig. 4c–d. It has aslope of −20 dB/decade, which is consistent with the CRBof other Doppler-based signal-processing problems (Fischeret al., 2010; Chan et al., 2012; Demirli and Saniie, 2001).
5.2 UADV measurements on a reference experiment
For an experimental characterization of the measurementperformance of the UADV system, a test rig based on the lin-ear translation of a single scattering object is used (Fig. 3).
J. Sens. Sens. Syst., 9, 227–238, 2020 https://doi.org/10.5194/jsss-9-227-2020

R. Nauber et al.: Measurement uncertainty analysis of ultrasound flow imaging 233
Figure 3. A measurement setup in which the tip of a glass fiberis mounted on a needle (ND) is insonified by an ultrasound trans-ducer (US) and moved by a linear translation stage (LS). A laservibrometer (LV) measures its velocity (vref) and position (sref).
It consists of a linear stage (41.121.102E; OWIS GmbH,Staufen, Germany) that is mounted over a glass tank with thedimensions of 212×81×135mm3. It moves a scattering ob-ject (glass fiber with a spherical tip, and diameter of 0.6mm,mounted in a hollow needle) with a constant velocity throughwater (ϑ = 20 ◦C; c = 1480ms−1). The ultrasound sensor ar-ray is mounted on the front wall of the tank and thereforeinsonates through an 8mm glass wall and a water-based ul-trasound couplant.
In order to trace back the measurement results of theUADV to the definitions of the respective units in the SIsystem, a simultaneous measurement of the relative posi-tion and velocity was done with a vibrometer (OFV-503;Polytech, Waldbronn, Germany; displacement decoder DD-900 and velocity decoder VD-09). A retroreflective tape (3MScotchlite) was attached to the shaft of the scattering object’smount. For a velocity set point of 10mms−1, a standard devi-ation of the velocity σv, ref, rel = 0.178% was determined forthe linear stage–vibrometer combination (for the same aver-aging time as the UADV system).
A total of 130 measurement cycles were conducted, con-sisting of a constant translation away from the front wall ofthe tank with a velocity set-point vref = 10mms−1 and therespective backward motion. Of the continuously obtainedUADV measurements, only those that originate from two de-fined positions near to and far from the wall during the move-ment away from the ultrasound transducer (Richter Sensorand Transducer Technology, Germany) are selected in thepostprocessing. The clutter-to-signal ratio (CSR) is CSR1 =
−7.3dB and CSR2 =−19.0dB, respectively. To ensure acommon time base for vibrometer and UADV measure-ments, the trigger signal of the UADV is acquired simulta-neously with the velocity and position signals. To test theperformance under different SNR conditions, white Gaus-sian noise was added to the raw digitized signals to achieveSNR=−6,−3, . . . , 12dB. Four algorithmic variants werecompared as follows:
– (DEF) – the 1D Kasai velocity estimator without clutterfiltering, as described in Sect. 3.4
– (CRF) – the 1D Kasai velocity estimator with a clutterfiltering according to Sect. 3.3
Table 2. Overview of the ultrasound parameters and the signal-processing algorithms.
Parameters
Excitation pulse Sinusoidal signal;f0 = 8MHz
Pulse length Nperiods = 8
Pulse repetition frequency fPR = 900Hz
Number of emissions NEPP = 50
Speed of sound cH2O = 1480ms−1
Clutter-to-signal ratio CSR1 =−7.3dB(near the wall)CSR2 =−19.0dB(far from the wall)
Sampling frequency fs = 32MHz
Velocity set point vref = 10mms−1
Number of repetitions N = 130
(DEF) M = 1, CRF off, ftx ≈ f0(CRF) M = 1, CRF on, ftx ≈ f0(CRF 2D) M = 3, CRF on, ftx ≈ f0(CRF 2D RF) M = 3, CRF on, ftx ≈ frx
– (CRF 2D) – the 2D velocity estimator as described inSect. 3.5 with clutter filtering but without an estimationof ftx
– (CRF 2D RF) – the 2D velocity estimator as with clutterfiltering including the estimation of ftx.
The parameterization of the experiment and of the algorithmsis listed in Table 2.
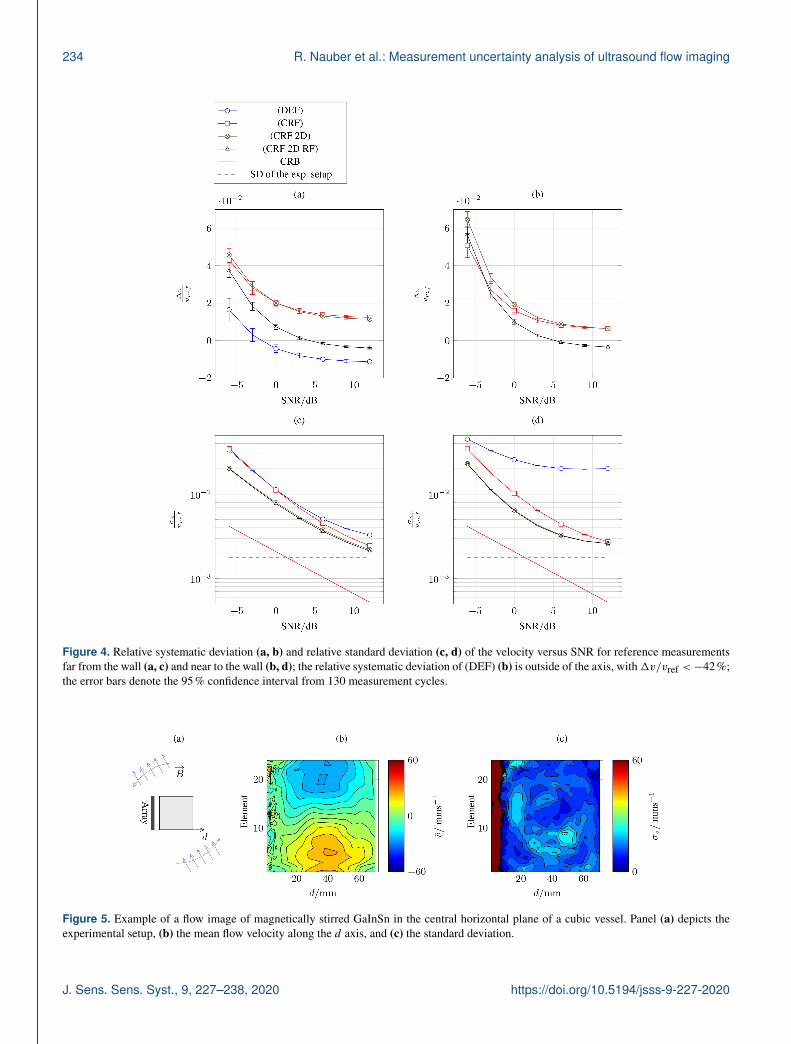
Figure 4 shows the relative systematic deviation from thereference velocity and the relative velocity standard devia-tion of the tested algorithms. For the low-CSR case (far fromthe wall) at SNR= 12dB, it can be seen that a slight negativebias of (DEF) is turned into a positive bias through clutter fil-tering (CRF) and (CRF 2D). This is compensated by the fre-quency estimation of (CRF 2D RF), which shows the lowestdeviations of all variants for SNR≥ 3dB. For the high-CSRcase (near to the wall), the variant (DEF) without clutter filterhas a relative deviation of 1v/vref <−42%. Through clut-ter filtering this strong negative bias is turned into a positivebias, which increases with lower SNR for (CRF) and (CRF2D). The RF estimation of (CRF 2D RF) gives the lowestsystematic bias for SNR≥ 0dB. The relative standard devi-ations of all variants of the Kasai’s algorithm do not reachthe CRB for the given signal model, which is consistent withthe findings of Chan et al. (2012). The lowest standard de-viations are consistently provided by the variants (CRF 2D)and (CRF 2D RF), which come as close as a factor of 3 to theCRB by using more samples per gate than (DEF) and (CRF).
https://doi.org/10.5194/jsss-9-227-2020 J. Sens. Sens. Syst., 9, 227–238, 2020
234 R. Nauber et al.: Measurement uncertainty analysis of ultrasound flow imaging
Figure 4. Relative systematic deviation (a, b) and relative standard deviation (c, d) of the velocity versus SNR for reference measurementsfar from the wall (a, c) and near to the wall (b, d); the relative systematic deviation of (DEF) (b) is outside of the axis, with1v/vref <−42%;the error bars denote the 95% confidence interval from 130 measurement cycles.
Figure 5. Example of a flow image of magnetically stirred GaInSn in the central horizontal plane of a cubic vessel. Panel (a) depicts theexperimental setup, (b) the mean flow velocity along the d axis, and (c) the standard deviation.
J. Sens. Sens. Syst., 9, 227–238, 2020 https://doi.org/10.5194/jsss-9-227-2020

R. Nauber et al.: Measurement uncertainty analysis of ultrasound flow imaging 235
Table 3. Measurement uncertainty budget for typical MHD experiments in liquid GaInSn.
Quan-tity
Uncertainty source Type of uncertainty estimationaccording to GUM
Relativestandarduncertainty;σv,rel
fd;ftx
Random effects of Doppler frequencyestimation, including phase jitter andelectrical noise
Type A estimation from calibration measurements(Fig. 4) for (CRF 2D RF) and an SNR of 5dB; normaldistribution with σv, rel = 0.4%
0.4%
fd;ftx
Unknown systematic effects of Dopplerfrequency estimation, includingfrequency-dependent attenuation of thefluid and drift in the slow-time clocksource
Type B estimation from calibration measurements(Fig. 4) for an SNR of 5dB; uniformly distributed inthe interval 1vrel =±0.08%
0.05%
c Value of the speed of sound of the fluidcGaInSn = 2740ms−1 (given by Morleyet al., 2008, without a measurement un-certainty)
Type A estimation based on Proffit and Carome (1962);σc, rel = 0.03%
0.03%
Unknown systematic variations of thespeed of sound in the fluid due to tem-perature changes
Type B estimation for the sound–speed temperature co-efficient of liquid gallium (Proffit and Carome, 1962;Popel et al., 2005);dcdϑ =−0.3m(sK)−1
for 1ϑ =±10K rectangular distributed in the interval1crel =±0.11%
0.06%
v Influence of the spatial resolution fromthe finite width of the sound field
Type B estimation for a beam width 1x = 3mm andtypical velocity gradients of MHD experiments esti-mated from numerical simulation;dvdx = 0.16mm−1
· vmax (Galindo et al., 2017);1v = 1/2 · dv
dx · b1vrel =±24%
13.9%
Total uncertainty√∑
iσ2v, rel, i = 13.9%
For the given experimental data, the algorithm variant (CRF2D RF) provides a suitable trade-off between systematic andstandard deviation and computational complexity.
6 Measurement uncertainty budget of the UADV inliquid metal
A measurement uncertainty budget according to theGUM (JCGM, 2008) is used to assess the contributions ofmeasurement uncertainty for the UADV system. Based onEq. (1), the measurand v is derived from the quantities fd, cand frx. Furthermore, the direct influence of the spatial av-eraging over the flow within the ultrasound beam width isconsidered. In Table 3, the uncertainties contribution of thesequantities are given for a typical MHD experiment.
For the uncertainties of fd and frx, the results of Sect. 5.2are transferred from the reference experiments in water totypical measurement conditions in low-melting liquid met-als. The maximum relative systematic deviation and stan-dard deviation for both investigated CSR and a typical SNR
of SNR= 5dB are used to calculate the equivalent uncer-tainty of the velocity. The influence of an uncertainty in thefluid’s speed of sound, c, is estimated by the uncertainty ofthe measurement of this quantity, in the literature and thetemperature dependence, assuming a temperature gradient of1ϑ =±10K. The uncertainty arising from spatial averag-ing through the ultrasound beam characteristics is calculatedby assuming a lateral averaging of 1x = 3mm and velocitygradients of numerical simulations of typical MHD experi-ments (Galindo et al., 2017).
It can be seen that the biggest contribution to the veloc-ity uncertainty of the UADV measurement system for typi-cal MHD settings with σv, rel = 13.9% stems from the spa-tial averaging over lateral resolution given by the ultrasoundbeam width of the unfocused transducers. This provides themost promising starting point for further improvements re-garding the measurement uncertainty of the UADV system.Furthermore, it justifies the approximations taken for com-putationally efficiently implementing the signal processing,even though lower uncertainty algorithms exist that approach
https://doi.org/10.5194/jsss-9-227-2020 J. Sens. Sens. Syst., 9, 227–238, 2020

236 R. Nauber et al.: Measurement uncertainty analysis of ultrasound flow imaging
the CRB (Chan et al., 2012) because signal processing is notthe limiting factor in the measurement uncertainty budget.
7 Example of liquid metal flow imaging
To demonstrate the capabilities of the ultrasound arrayDoppler velocimeter (UADV) with the proposed signal pro-cessing, it is applied to a simple MHD experiment. A cubicvessel with the dimensions of 67×67×67mm3 is filled withGaInSn and a 25-element linear transducer array (RichterSensor and Transducer Technology, Germany) is attachedto insonify the central horizontal plane (cf. Fig. 5a). Withthe application of a horizontally counterclockwise rotatingmagnet field, a counterclockwise central vortex forms. TheUADV measures the velocity component along the axis ofthe transducers (d axis) with the parameterization given inTable 2 and with fPR = 200Hz. The resulting planar flow im-age, using signal-processing variant (CRF 2D RF), is shownin Fig. 5b and c.
8 Conclusions
Experimental research in the field of MHD can benefit fromonline, noninvasive flow imaging for investigating funda-mental phenomena, such as flow instabilities and optimiz-ing industrial processes. We describe an online-capable sig-nal processing for pulsed-wave Doppler velocimetry that istailored to the specific requirements of lab-scale model ex-periments. It is based on a 2D autocorrelator, which allowsfor a reduction of systematic and stochastic errors throughexplicitly estimating the RF and utilizing multiple samplesper gate. We optimized the signal processing for low compu-tational complexity and implemented substantial parts on anFPGA. A typical reduction of the data bandwidth of 6.5 : 1enables continuous data streaming to PC hardware.
We evaluated the performance of the implemented signalprocessing in a water test rig with a single scattering objectand a reference velocity obtained through a laser vibrome-ter. Two different clutter signal levels emulate a measurementclose to and far from a wall. A velocity standard deviation ofσv, rel = 0.4% was found, which is about 3 times the funda-mental limit of the uncertainty, the CRB, for velocity estima-tion. The systematic deviation is 1vrel =±0.08%.
We investigated the measurement uncertainty budget forflow velocity measurements in a typical MHD experimentalsetup for the low-melting alloy GaInSn. The total measure-ment uncertainty of σv, rel = 13.9% almost solely stems fromthe effect of spatial averaging over the lateral resolution forflows with high-velocity gradients. This justifies the approx-imations taken for lowering the computational complexity ofthe signal processing.
A measurement uncertainty budget of a typical MHD ex-periment at laboratory scale suggests improvements towardsa better lateral resolution. In the context of flow imaging, this
can be provided by the focusing and steering of the ultra-sound beam using the phased-array principle.
The presented signal processing enables online, multi-plane flow visualization with the UADV research platform.A long measurement duration (> 1h), combined with a highframe rate (> 10Hz), allows one to investigate complex, in-stationary flows such as instability phenomena in cubes.
Data availability. Research data are available upon request fromthe authors.
Author contributions. RN implemented the signal processing,designed and conducted the numerical and experimental investiga-tions. LB and JC supervised the research. All authors discussed andproofread the manuscript.
Competing interests. The authors declare that they have no con-flict of interest.
Acknowledgements. The authors would like to thank theDeutsche Forschungsgemeinschaft (DFG) for their financial sup-port (grant no. DFG BU 2241-2), Hannes Beyer for the FPGA-based implementation, Dirk Räbiger (Helmholtz-Zentrum Dresden-Rossendorf) for providing the GaInSn experimental setup, and An-dreas Fischer (Bremen Institute for Metrology, Automation andQuality Science) for discussing the results.
Financial support. This research has been supported by theDeutsche Forschungsgemeinschaft (grant no. DFG BU 2241-2).
This open-access publication was fundedby the Technische Universität Dresden (TUD).
Review statement. This paper was edited by Marco Jose da Silvaand reviewed by two anonymous referees.
References
Alam, S. and Parker, K. J.: Implementation issues in ultra-sonic flow imaging, Ultrasound Med. Biol., 29, 517–528,https://doi.org/10.1016/S0301-5629(02)00704-4, 2003.
Baker, D.: Pulsed Ultrasonic Doppler Blood-Flow Sensing, Son-ics and Ultrasonics, IEEE T. Son. Ultrason., 17, 170–184,https://doi.org/10.1109/T-SU.1970.29558, 1970.
Bjaerum, S., Torp, H., and Kristoffersen, K.: Clutter filter designfor ultrasound color flow imaging, IEEE T. Ultrason. Ferr., 49,204–216, 2002.
Büttner, L., Nauber, R., Burger, M., Räbiger, D., Franke, S.,Eckert, S., and Czarske, J.: Dual-plane ultrasound flow mea-surements in liquid metals, Meas. Sci. Technol., 24, 055302,https://doi.org/10.1088/0957-0233/24/5/055302, 2013.
J. Sens. Sens. Syst., 9, 227–238, 2020 https://doi.org/10.5194/jsss-9-227-2020

R. Nauber et al.: Measurement uncertainty analysis of ultrasound flow imaging 237
Chan, A., Lam, E., and Srinivasan, V.: Optimal doppler fre-quency estimators for ultrasound and optical coherence to-mography, in: Biomedical Circuits and Systems Conference(BioCAS), IEEE, November 2012, Hsinchu, Taiwan, 264–267,https://doi.org/10.1109/BioCAS.2012.6418446, 2012.
Cramér, H.: Mathematical Methods of Statistics, Princeton Press,Princeton, NJ, 367–369, 1946.
Demirli, R. and Saniie, J.: Model-based estimation of ultrasonicechoes. Part I: Analysis and algorithms, IEEE T. Ultrason. Ferr.,48, 787–802, https://doi.org/10.1109/58.920713, 2001.
Eckert, S., Cramer, A., and Gerbeth, G.: Velocity Measure-ment Techniques for Liquid Metal Flows, in: Magnetohydro-dynamics, Fluid Mec. A., 80, 275–294, Springer Netherlands,https://doi.org/10.1007/978-1-4020-4833-3_17, 2007a.
Eckert, S., Gerbeth, G., Räbiger, D., Willers, B., and Zhang, C.:Experimental modeling using low melting point metallic melts:Relevance for metallurgical engineering, Steel Res. Int., 78, 419–425, 2007b.
Fischer, A., Pfister, T., and Czarske, J.: Derivation andcomparison of fundamental uncertainty limits for laser-two-focus velocimetry, laser Doppler anemometry andDoppler global velocimetry, Measurement, 43, 1556–1574,https://doi.org/10.1016/j.measurement.2010.09.009, 2010.
Furuichi, N.: Fundamental uncertainty analysis of flowratemeasurement using the ultrasonic Doppler velocityprofile method, Flow Meas. Instrum., 33, 202–211,https://doi.org/10.1016/j.flowmeasinst.2013.07.004, 2013.
Galindo, V., Nauber, R., Räbiger, D., Franke, S., Beyer, H., Büttner,L., Czarske, J., and Eckert, S.: Instabilities and spin-up behaviourof a rotating magnetic field driven flow in a rectangular cav-ity, Phys. Fluids, 29, 114104, https://doi.org/10.1063/1.4993777,2017.
Gardin, P., Galpin, J.-M., Regnier, M.-C., and Radot, J.-P.: Liq-uid steel flow control inside continuous casting mold us-ing a static magnetic field, IEEE T. Magn., 31, 2088–2091,https://doi.org/10.1109/20.376456, 1995.
JCGM: Guide to the expression of uncertainty in measurement,Tech. rep., Joint Committee for Guides in Metrology (JCGM),2008.
Jensen, A.: Estimation of blood velocities using ultrasound: a signalprocessing approach, Cambridge University Press, 1996.
Kantz, H., Kurths, J., and Mayer-Kress, G.: Nonlinear Analysis ofPhysiological Data, Springer Berlin Heidelberg, 2012.
Kasai, C., Namekawa, K., Koyano, A., and Omoto, R.: Real-Time Two-Dimensional Blood Flow Imaging Using an Auto-correlation Technique, IEEE T. Son. Ultrason., 32, 458–464,https://doi.org/10.1109/T-SU.1985.31615, 1985.
Kay, S. M.: Fundamentals of Statistical Signal Processing: Estima-tion Theory, Prentice-Hall, Inc., Upper Saddle River, NJ, USA,1993.
Lee, J., Cho, J., Yoo, Y. M., and kyong Song, T.: New clut-ter rejection method using time-domain averaging for ultra-sound color Doppler imaging, in: Ultrasonics Symposium (IUS),September 2009, IEEE International, Rome, Italy, 1371–1374,https://doi.org/10.1109/ULTSYM.2009.5441639, 2009.
Loupas, T., Peterson, R., and Gill, R.: Experimental evalua-tion of velocity and power estimation for ultrasound bloodflow imaging, by means of a two-dimensional autocor-
relation approach, IEEE T. Ultrason. Ferr., 42, 689–699,https://doi.org/10.1109/58.393111, 1995a.
Loupas, T., Powers, J., and Gill, R.: An axial velocity estimatorfor ultrasound blood flow imaging, based on a full evaluationof the Doppler equation by means of a two-dimensional au-tocorrelation approach, IEEE T. Ultrason. Ferr., 42, 672–688,https://doi.org/10.1109/58.393110, 1995b.
Lovstakken, L., Bjaernm, S., and Torp, H.: Optimal veloc-ity estimation in ultrasound color flow imaging in pres-ence of clutter, IEEE T. Ultrason. Ferr., 54, 539–549,https://doi.org/10.1109/TUFFC.2007.277, 2007.
Morley, N. B., Burris, J., Cadwallader, L. C., and Nornberg, M. D.:GaInSn usage in the research laboratory, Rev. Sci. Instrum., 79,056107, https://doi.org/10.1063/1.2930813, 2008.
Müller, G. and Friedrich, J.: Optimization and modellingof photovoltaic silicon crystallization processes, in: AIPConference Proceedings, Fourteenth International Sum-mer School on Crystal Growth, vol. 1270, p. 255281,https://doi.org/10.1063/1.3476230, 2010.
Nauber, R., Burger, M., Büttner, L., Franke, S., Räbiger, D.,Eckert, S., and Czarske, J.: Novel ultrasound array measure-ment system for flow mapping of complex liquid metal flows,The European Physical Journal Special Topics, 220, 43–52,https://doi.org/10.1140/epjst/e2013-01795-1, 2013a.
Nauber, R., Burger, M., Neumann, M., Büttner, L., Dadzis, K.,Niemietz, K., Pätzold, O., and Czarske, J.: Dual-plane flowmapping in a liquid-metal model experiment with a squaremelt in a traveling magnetic field, Exp. Fluids, 54, 1–11,https://doi.org/10.1007/s00348-013-1502-x, 2013b.
Nauber, R., Thieme, N., Radner, H., Beyer, H., Büttner,L., Dadzis, K., Pätzold, O., and Czarske, J.: Ultrasoundflow mapping of complex liquid metal flows with spa-tial self-calibration, Flow Meas. Instrum., 48, 59–63,https://doi.org/10.1016/j.flowmeasinst.2015.12.005, 2016.
Popel, P., Sidorov, V., Yagodin, D., Sivkov, G., and Mozgovoj, A.:Density and ultrasound velocity of some pure metals in liquidstate, in: 7th European Conference on Thermophysical Proper-ties, 2005.
Proffit, R. and Carome, E.: Measurements of the velocity and ab-sorption of ultrasound in liquid gallium, Tech. rep., DTIC Docu-ment, John Carroll University, Cleveland, Ohio, 1962.
Radhakrishna Rao, C.: Information and accuracy attainable in theestimation of statistical parameters, Bull. Calcutta Math. S., 37,81–91, 1945.
Shung, K.: Diagnostic Ultrasound: Imaging and Blood Flow Mea-surements, Second Edition, CRC Press, 2015.
Takeda, Y.: Velocity profile measurement by ultrasoundDoppler shift method, Int. J. Heat Fluid Fl., 7, 313–318,https://doi.org/10.1016/0142-727X(86)90011-1, 1986.
Thieme, N., Bönisch, P., Meier, D., Nauber, R., Büttner,L., Dadzis, K., Pätzold, O., Sylla, L., and Czarske,J.: Ultrasound Flow Mapping for the Investigation ofCrystal Growth, IEEE T. Ultrason. Ferr., 64, 725–735,https://doi.org/10.1109/TUFFC.2017.2654124, 2017.
Thomas, L. and Hall, A.: An improved wall filter for flow imagingof low velocity flow, in: 1994 Proceedings of IEEE Ultrason-ics Symposium, Cannes, France, 31 October–3 November 1994,3, 1701–1704, https://doi.org/10.1109/ULTSYM.1994.401918,1994.
https://doi.org/10.5194/jsss-9-227-2020 J. Sens. Sens. Syst., 9, 227–238, 2020

238 R. Nauber et al.: Measurement uncertainty analysis of ultrasound flow imaging
Timmel, K., Eckert, S., and Gerbeth, G.: Experimental Investigationof the Flow in a Continuous-Casting Mold under the Influenceof a Transverse, Direct Current Magnetic Field, Metall. Mater.Trans. A, 42, 68–80, https://doi.org/10.1007/s11663-010-9458-1, 2011.
Torp, H.: Clutter rejection filters in color flow imaging: A theoreti-cal approach, IEEE T. Ultrason. Ferr., 44, 417–424, 1997.
Torp, H., Lai, X., and Kristoffersen, K.: Comparison between cross-correlation and auto-correlation technique in color flow imag-ing, in: 1993 Proceedings IEEE Ultrasonics Symposium, Bal-timore, USA, 31 October–3 November 1993, 2, 1039–1042,https://doi.org/10.1109/ULTSYM.1993.339630, 1993.
Turin, G.: An introduction to matched filters, IRE T. Inform. Theor.,6, 311–329, https://doi.org/10.1109/TIT.1960.1057571, 1960.
Yasuda, H., Toh, T., Iwai, K., and Morita, K.: RecentProgress of EPM in Steelmaking, Casting, and Solid-ification Processing, ISIJ International, 47, 619–626,https://doi.org/10.2355/isijinternational.47.619, 2007.
J. Sens. Sens. Syst., 9, 227–238, 2020 https://doi.org/10.5194/jsss-9-227-2020