Embed Size (px)
Citation preview

Measurement Uncertainty Analysis and Traceability for Phase Noise Application Note
Products:
ı R&S®FSWP
This application note reviews the measurement uncertainty analysis and traceability for phase noise with
the new R&S®FSWP Phase Noise Analyzer.
It describes the new approach for measuring phase noise with the R&S®FSWP using direct down-
conversion with cross correlation and focuses on traceability using a derived primary measurement
standard.
Please find the most up-to-date document on our homepage http://www.rohde-schwarz.com/appnote/1EF95.
App
licat
ion
Not
e
Dr.
G. F
eldh
aus,
Dr.
G. R
oese
l,
A. R
oth,
J.
Wol
le
6.20
16 -
1E
F95
_01e
Table of Contents
01 Rohde & Schwarz Measurement Uncertainty Analysis and Traceability for Phase Noise
2
Table of Contents
1 Introduction ......................................................................................... 3
2 Fundamentals of Phase Noise and Phase Noise Measurement ..... 4
3 Phase Noise Analysis Using Direct Down-Conversion with Cross
Correlation ........................................................................................... 6
4 Traceability .......................................................................................... 9
4.1 Example Equation for Phase Noise .........................................................................11
4.2 Intrinsic Characteristics of the R&S FSWP .............................................................17
4.3 Verification Measurements by National Institutes .................................................25
5 References ........................................................................................ 34
6 Ordering Information ........................................................................ 35
Introduction
01 Rohde & Schwarz Measurement Uncertainty Analysis and Traceability for Phase Noise
3
1 Introduction
The R&S FSWP phase noise analyzer and VCO tester is the optimal test solution for
radar applications and when developing and manufacturing synthesizers, OCXOs,
DROs and VCOs. It can be easily configured to meet the required application. The
instrument's low‑noise internal local oscillator makes it possible to measure most
commercially available synthesizers and oscillators without any additional options. For
high‑end applications, the R&S FSWP can be equipped with a second receive path,
which enables cross‑correlation and, depending on the number of correlations used,
increases sensitivity – by up to 25 dB.
This application note describes shortly the fundamentals of phase noise and phase
noise measurement, the architecture of the R&S FSWP and focuses on the
measurement error and traceability to standards of national metrology institutes.
Fundamentals of Phase Noise and Phase Noise Measurement
01 Rohde & Schwarz Measurement Uncertainty Analysis and Traceability for Phase Noise
4
2 Fundamentals of Phase Noise and Phase
Noise Measurement
Phase noise is measured using an R&S FSWP phase noise analyzer.
In order to display RF signals with as little phase noise as possible, a 100 MHz low
phase noise (LPN) oscillator is used.
Describing a CW signal
The CW signal from an oscillator is described as follows:
𝑉(𝑡) = 𝑉0[1 + 𝛼(𝑡)] cos[2𝜋𝑓0𝑡 + 𝜙(𝑡)] (1)
where 𝑓0 is the carrier frequency, 𝑉0 is the amplitude, 𝛼(𝑡) is the normalized amplitude
fluctuation and 𝜙(𝑡) is the phase fluctuation.
The power spectral density of the phase fluctuation 𝑆𝜙 is:
𝑆𝜙(𝑓) =⟨Δ𝜙rms(𝑓)⟩2
NBW (2)
where ⟨Δ𝜙𝑟𝑚𝑠(𝑓)⟩2 is the average phase fluctuation at offset frequency 𝑓 (0 < 𝑓 < ∞)
referenced to carrier frequency 𝑓0. NBW (noise bandwidth) represents the equivalent
noise bandwidth used to measure the phase fluctuation. The unit is rad2 / Hz. 𝑆𝜙(𝑓) is
the sum of the fluctuations from the lower and upper sidebands.
(The measurement system's true bandwidth is bell-shaped. Because this is a digital
bandwidth, a mathematical transducer factor is used to calculate the equivalent noise
bandwidth; see also Influence of Filter Bandwidth 𝛿ℒ𝐵𝑊)
Measurand: phase noise
The measurand is the phase noise ℒ of an oscillator or RF signal generator This
results from the power spectral density (PSD) of the phase fluctuation 𝑆𝜙 [6]:
ℒ(𝑓) =1
2𝑆𝜙(𝑓) (3)
The phase noise ℒ(𝑓) only refers to the noise power density of a sideband. It is
accepted that the phase noise symmetrically surrounds the carrier frequency.
Phase noise is typically expressed in dBc/Hz.
The following applies:
ℒ(𝑓) = 10 ∙ log (1
2𝑆𝜙(𝑓)) [dBc/Hz] (4)
ℒ(𝑓) is measured as the ratio of carrier power 𝑃𝑐 to the phase noise power density
from the two sidebands:
ℒ(𝑓) = 10 ∙ log (phase noise power density from both sidebands per Hz at offset 𝑓
2 ∙ carrier power) (5)
Fundamentals of Phase Noise and Phase Noise Measurement
01 Rohde & Schwarz Measurement Uncertainty Analysis and Traceability for Phase Noise
5
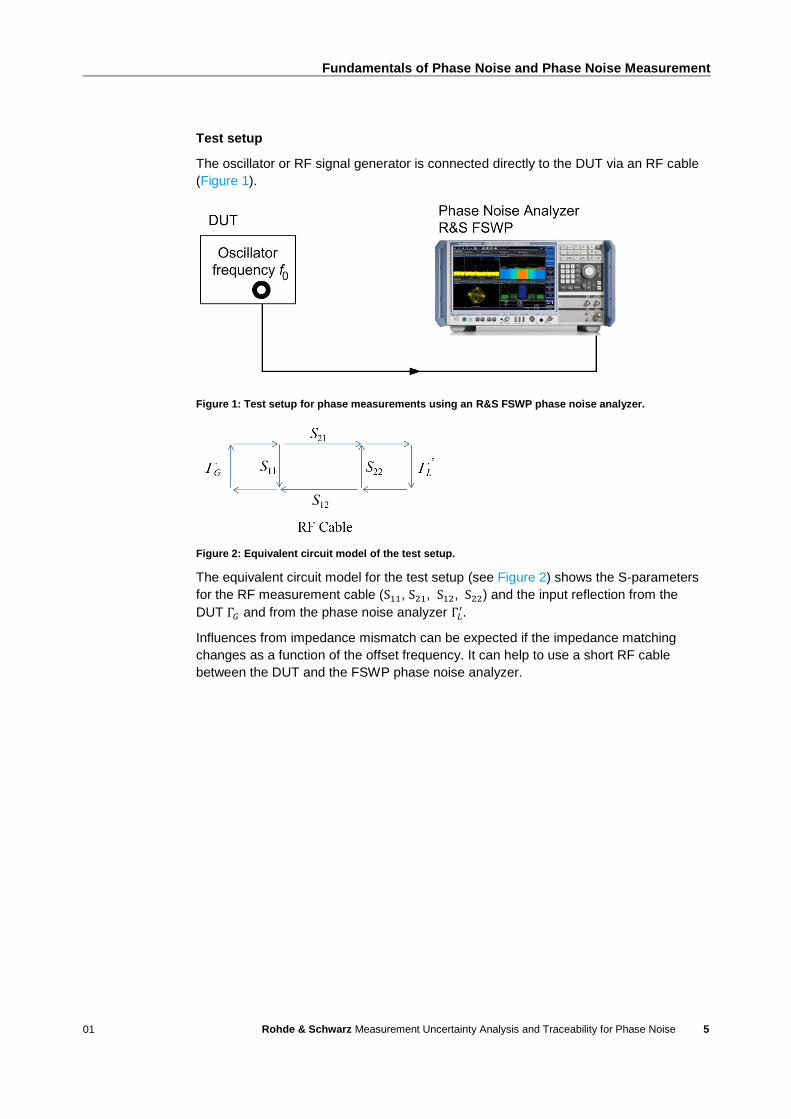
Test setup
The oscillator or RF signal generator is connected directly to the DUT via an RF cable
(Figure 1).
Figure 1: Test setup for phase measurements using an R&S FSWP phase noise analyzer.
Figure 2: Equivalent circuit model of the test setup.
The equivalent circuit model for the test setup (see Figure 2) shows the S-parameters
for the RF measurement cable (S11, S21, S12, S22) and the input reflection from the
DUT Γ𝐺 and from the phase noise analyzer Γ𝐿′.
Influences from impedance mismatch can be expected if the impedance matching
changes as a function of the offset frequency. It can help to use a short RF cable
between the DUT and the FSWP phase noise analyzer.
Phase Noise Analysis Using Direct Down-Conversion with Cross Correlation
01 Rohde & Schwarz Measurement Uncertainty Analysis and Traceability for Phase Noise
6
3 Phase Noise Analysis Using Direct Down-
Conversion with Cross Correlation
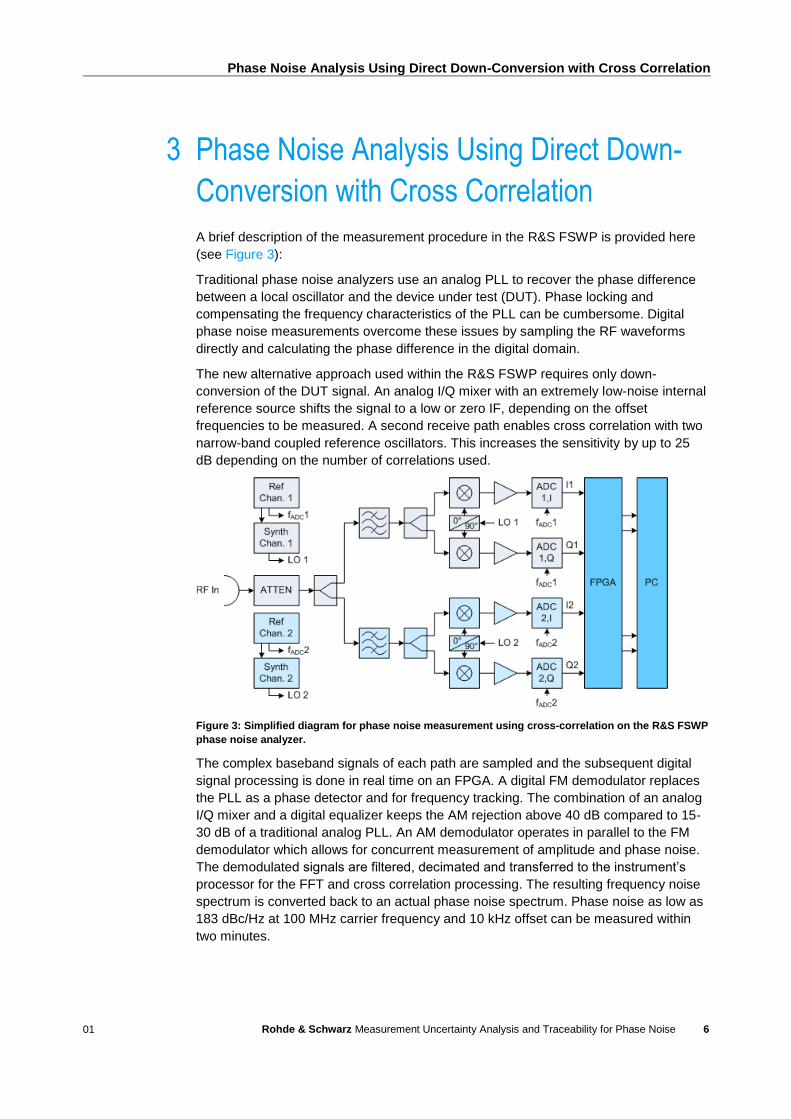
A brief description of the measurement procedure in the R&S FSWP is provided here
(see Figure 3):
Traditional phase noise analyzers use an analog PLL to recover the phase difference
between a local oscillator and the device under test (DUT). Phase locking and
compensating the frequency characteristics of the PLL can be cumbersome. Digital
phase noise measurements overcome these issues by sampling the RF waveforms
directly and calculating the phase difference in the digital domain.
The new alternative approach used within the R&S FSWP requires only down-
conversion of the DUT signal. An analog I/Q mixer with an extremely low-noise internal
reference source shifts the signal to a low or zero IF, depending on the offset
frequencies to be measured. A second receive path enables cross correlation with two
narrow-band coupled reference oscillators. This increases the sensitivity by up to 25
dB depending on the number of correlations used.
Figure 3: Simplified diagram for phase noise measurement using cross-correlation on the R&S FSWP
phase noise analyzer.
The complex baseband signals of each path are sampled and the subsequent digital
signal processing is done in real time on an FPGA. A digital FM demodulator replaces
the PLL as a phase detector and for frequency tracking. The combination of an analog
I/Q mixer and a digital equalizer keeps the AM rejection above 40 dB compared to 15-
30 dB of a traditional analog PLL. An AM demodulator operates in parallel to the FM
demodulator which allows for concurrent measurement of amplitude and phase noise.
The demodulated signals are filtered, decimated and transferred to the instrument’s
processor for the FFT and cross correlation processing. The resulting frequency noise
spectrum is converted back to an actual phase noise spectrum. Phase noise as low as
183 dBc/Hz at 100 MHz carrier frequency and 10 kHz offset can be measured within
two minutes.
Phase Noise Analysis Using Direct Down-Conversion with Cross Correlation
01 Rohde & Schwarz Measurement Uncertainty Analysis and Traceability for Phase Noise
7
Mathematical breakdown of the measurement signal
Equation (1) can be rewritten [3] (page 4; equation 3) as:
V(𝑡) = 𝑉0 cos(𝜔0𝑡) + 𝑥(𝑡) cos(𝜔0𝑡) − 𝑦(𝑡) sin(𝜔0𝑡) (6)
where 𝑥(𝑡) and 𝑦(𝑡) are influences resulting from noise.
The result is:
α(t) = V0√(1 +x(t)
V0)
2
− (y(t)
V0)
2
− 1 (7)
𝜙(𝑡) = arg(𝑥(𝑡), 𝑉0 + 𝑦(𝑡)) (3) (8)
For low noise |𝑥 𝑉0⁄ | ≪ 1, |𝑦 𝑉0⁄ | ≪ 1 (small-signal approximation), the result is:
α(t) =x(t)
V0 (9)
ϕ(t) =y(t)
V0 (10)
Cross-correlation
This section provides a rough sketch of the cross-correlation method (see Figure 3).
The calculations are derived from [4].
The objective is to introduce the variables 𝑚 (number of averaged cross-correlations)
and 𝐿𝑅𝑒𝑓 (single-channel noise levels) and to display the dependency of the
uncorrelated noise level 𝐿𝑅𝑒𝑓,𝑚 on the number 𝑚 of averaged cross-correlations.
Assumptions: the noise from reference channel 1 is in time domain 𝑎, the noise from
reference channel 2 is in 𝑏 and the noise from the DUT is in 𝑐.
The following applies in the time domain:
Channel 1: 𝑥 = 𝑎 + 𝑐
Channel 2: 𝑦 = 𝑏 + 𝑐
The following applies for Fourier transform during measurement time 𝑇 in the
frequency domain:
Channel 1: 𝑋 = 𝐴 + 𝐶
Channel 2: 𝑌 = 𝐵 + 𝐶
The phase noise of the DUT 𝑆𝑐𝑐 is obtained by cross-correlation between channels 1
and 2:
Scc = ⟨Sxy⟩m =1
T⟨XY∗⟩m =
1
T⟨CC∗⟩m +
1
T⟨CB∗⟩m +
1
T⟨AC∗⟩m +
1
T⟨AB∗⟩m (11)
The expression 1
𝑇⟨𝑋𝑌∗⟩𝑚 defines the mathematical operation of 𝑚 averagings of the
measurement results obtained in the individual channels during measurement time 𝑇.
If the noise level is dominant (when the phase noise from the DUT is limited ℒ𝐷𝑢𝑡 ≈ 0),
the following applies with normalization of the signal 𝑆𝑥𝑥 or 𝑆𝑦𝑦 [4] (page 35, equation
59):
Scc(m) = √π
4
1
√m (12)
Phase Noise Analysis Using Direct Down-Conversion with Cross Correlation
01 Rohde & Schwarz Measurement Uncertainty Analysis and Traceability for Phase Noise
8
This means that already during the first measurement (𝑚 = 1), the noise level of the
reference oscillators is attenuated by a factor of √𝜋
4 (corresponds to 0.52 dB).
With a very low phase noise DUT ℒ𝐷𝑈𝑇 ≪ ℒ𝑅𝑒𝑓1, the displayed 𝑚 = 1 can be used to
estimate the noise levels ℒ𝑅𝑒𝑓1 of the reference oscillators:
ℒRef1 ≈ ℒAnz,1 (13)
In the case of ℒ𝐷𝑈𝑇 = 0, only the noise from the reference oscillators is measured. This
noise is reduced by means of averaging 𝑚 [4].
ℒRefm ≈ ℒRef1 − 5 ∙ log m (14)
where 𝑚 is the number of averaged correlations in the measuring instrument.
ℒ𝑅𝑒𝑓𝑚 is equal to the displayed noise ℒ𝐴𝑛𝑧𝑚 output by the instrument for ℒ𝐷𝑈𝑇 =
0 during averaging 𝑚.
If ℒ𝐷𝑈𝑇 ≫ ℒ𝑅𝑒𝑓𝑚, then the measured noise ℒ𝐴𝑛𝑧𝑚 is the noise from the DUT.
The noise level ℒ𝑅𝑒𝑓𝑚 has two consequences.
On the one hand, the noise from the reference oscillators will cause dispersion of the
measurement results. On the other hand, the superposition of the phase noise from a
reference oscillator and from the DUT results in a positive systematic measurement
error, called a bias. This bias is strongly dependent on the difference between the
phase noise from the DUT and that from the reference oscillator (Δℒ𝑆𝑁𝑅 = ℒ𝐷𝑈𝑇 −
ℒ𝑅𝑒𝑓𝑚).
The dispersion of the measured values can be reduced and determined by averaging
the measurement results.
The bias calculation is not a trivial undertaking. There is no simple relationship such as
that below:
ℒAnzm = ℒRefm + ℒDUT (15)
If ℒ𝑅𝑒𝑓𝑚 ≈ ℒ𝐷𝑈𝑇 , then the displayed value would be expected to be 3 dB greater than
ℒ𝐷𝑈𝑇.
A mathematical simulation shows that cross-correlation provides a greater reduction of
the influence of the noise from the reference oscillator. Refer to "Noise Cancellation
Using Cross-Correlation" for more on this topic.
Traceability
01 Rohde & Schwarz Measurement Uncertainty Analysis and Traceability for Phase Noise
9
4 Traceability
The phase noise standard is calibrated using a derived primary measurement
standard. This means that the measurand is determined without a direct comparison to
a standard for that measurand. This in turn means that traceability is provided primarily
via the measurand RF attenuation / RF linearity.
Traceability of the phase noise measurand is provided in three ways:
1. Qualifying examination: Comparison of the phase noise of a low phase noise
(LPN) standard at 100 MHz as measured by a national metrology institute or an
accredited laboratory. Comparison of an R&S signal generator (R&S SMA100A in
this case) that has been measured at various frequencies by a national metrology
institute or an accredited laboratory (see “Verification Measurements by National
Institutes”).
2. Optional calibration of the R&S FSWP phase noise analyzer for the relevant
parameters: Linearity with reference to the offset frequency and hardware limit.
The phase noise measurand is derived in an uninterrupted chain of calibrations for
the basic RF parameters, including linearity and RF power.
3. Verification measurement using a digitally modulated oscillator.
Statements regarding the traceability process
Re 1) A very low phase noise, 100 MHz oscillator and an R&S SMA100A generator
were sent for calibration and measured using the phase noise analyzer.
Re 2) Optional calibration:
ı Linearity:
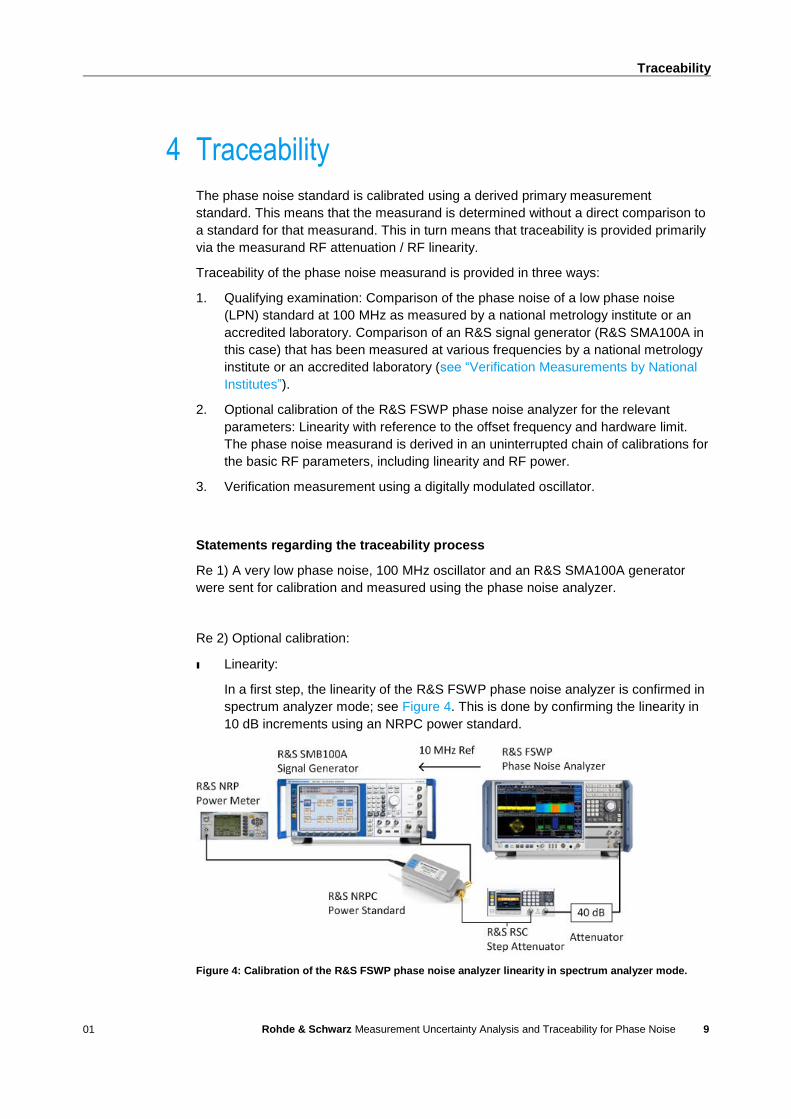
In a first step, the linearity of the R&S FSWP phase noise analyzer is confirmed in
spectrum analyzer mode; see Figure 4. This is done by confirming the linearity in
10 dB increments using an NRPC power standard.
Figure 4: Calibration of the R&S FSWP phase noise analyzer linearity in spectrum analyzer mode.
Traceability
01 Rohde & Schwarz Measurement Uncertainty Analysis and Traceability for Phase Noise
10
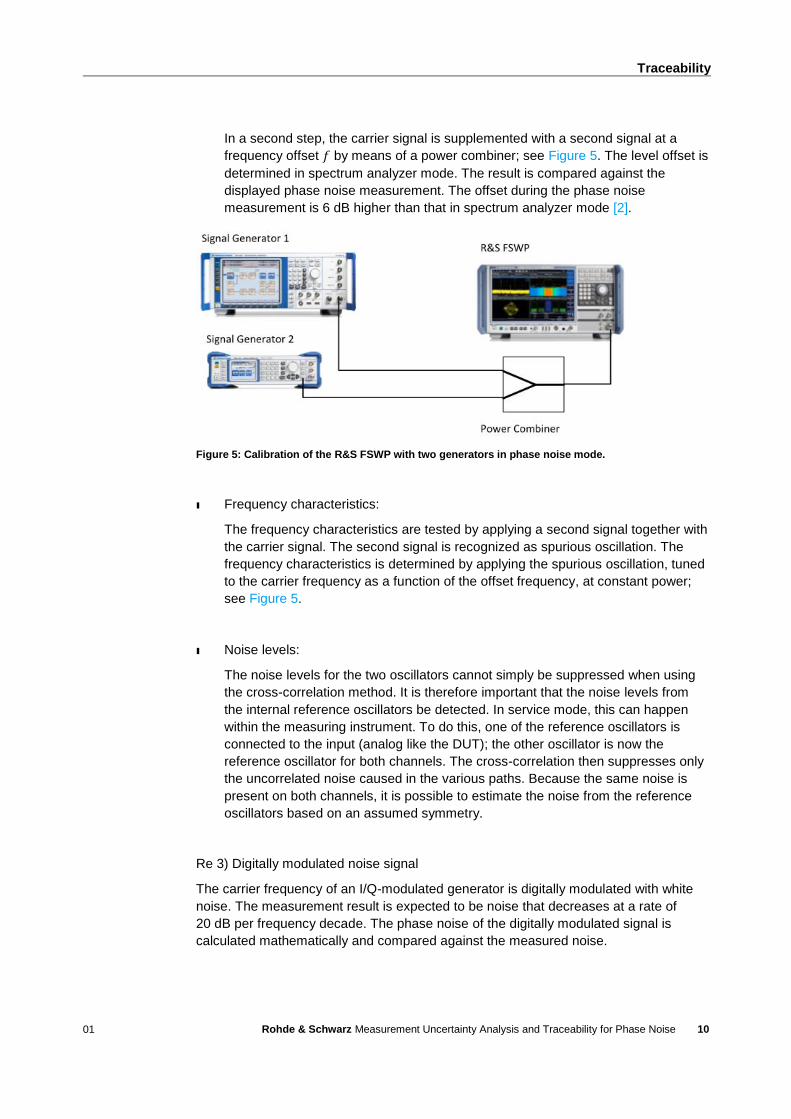
In a second step, the carrier signal is supplemented with a second signal at a
frequency offset 𝑓 by means of a power combiner; see Figure 5. The level offset is
determined in spectrum analyzer mode. The result is compared against the
displayed phase noise measurement. The offset during the phase noise
measurement is 6 dB higher than that in spectrum analyzer mode [2].
Figure 5: Calibration of the R&S FSWP with two generators in phase noise mode.
ı Frequency characteristics:
The frequency characteristics are tested by applying a second signal together with
the carrier signal. The second signal is recognized as spurious oscillation. The
frequency characteristics is determined by applying the spurious oscillation, tuned
to the carrier frequency as a function of the offset frequency, at constant power;
see Figure 5.
ı Noise levels:
The noise levels for the two oscillators cannot simply be suppressed when using
the cross-correlation method. It is therefore important that the noise levels from
the internal reference oscillators be detected. In service mode, this can happen
within the measuring instrument. To do this, one of the reference oscillators is
connected to the input (analog like the DUT); the other oscillator is now the
reference oscillator for both channels. The cross-correlation then suppresses only
the uncorrelated noise caused in the various paths. Because the same noise is
present on both channels, it is possible to estimate the noise from the reference
oscillators based on an assumed symmetry.
Re 3) Digitally modulated noise signal
The carrier frequency of an I/Q-modulated generator is digitally modulated with white
noise. The measurement result is expected to be noise that decreases at a rate of
20 dB per frequency decade. The phase noise of the digitally modulated signal is
calculated mathematically and compared against the measured noise.
Traceability
01 Rohde & Schwarz Measurement Uncertainty Analysis and Traceability for Phase Noise
11
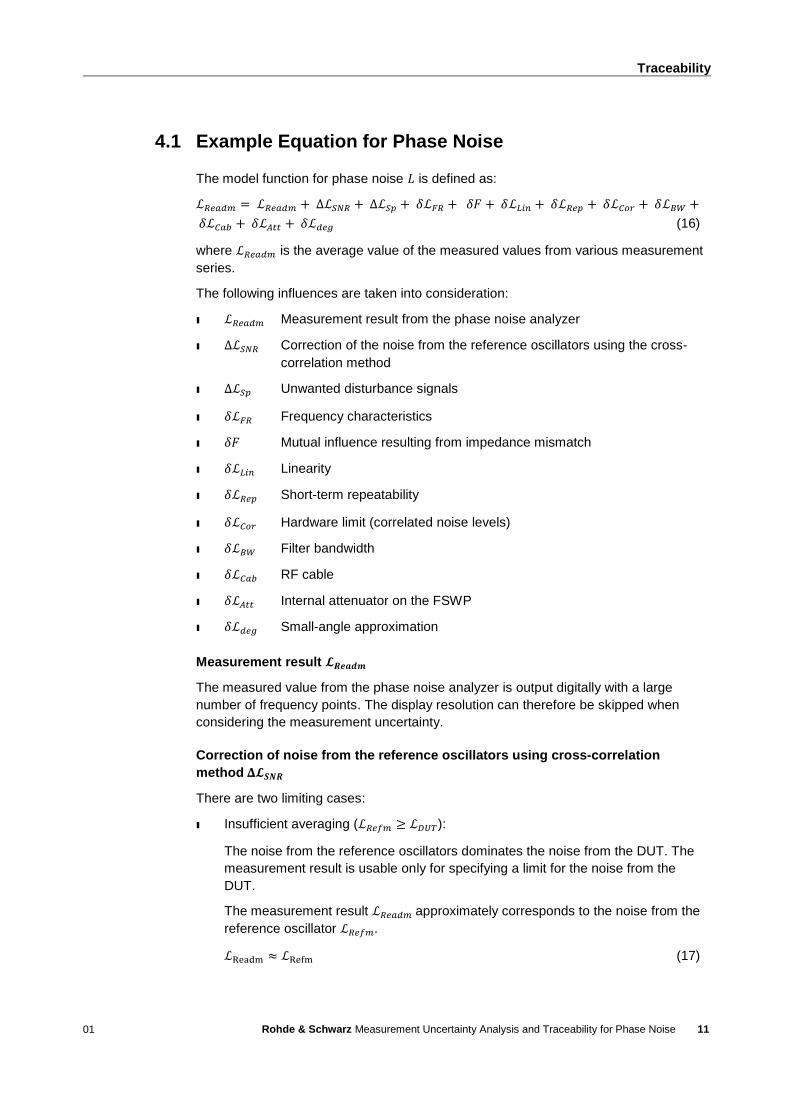
4.1 Example Equation for Phase Noise
The model function for phase noise 𝐿 is defined as:
ℒ𝑅𝑒𝑎𝑑𝑚 = ℒ𝑅𝑒𝑎𝑑𝑚 + Δℒ𝑆𝑁𝑅 + Δℒ𝑆𝑝 + 𝛿ℒ𝐹𝑅 + 𝛿𝐹 + 𝛿ℒ𝐿𝑖𝑛 + 𝛿ℒ𝑅𝑒𝑝 + 𝛿ℒ𝐶𝑜𝑟 + 𝛿ℒ𝐵𝑊 +
𝛿ℒ𝐶𝑎𝑏 + 𝛿ℒ𝐴𝑡𝑡 + 𝛿ℒ𝑑𝑒𝑔 (16)
where ℒ𝑅𝑒𝑎𝑑𝑚 is the average value of the measured values from various measurement
series.
The following influences are taken into consideration:
ı ℒ𝑅𝑒𝑎𝑑𝑚 Measurement result from the phase noise analyzer
ı Δℒ𝑆𝑁𝑅 Correction of the noise from the reference oscillators using the cross-
correlation method
ı Δℒ𝑆𝑝 Unwanted disturbance signals
ı 𝛿ℒ𝐹𝑅 Frequency characteristics
ı 𝛿𝐹 Mutual influence resulting from impedance mismatch
ı 𝛿ℒ𝐿𝑖𝑛 Linearity
ı 𝛿ℒ𝑅𝑒𝑝 Short-term repeatability
ı 𝛿ℒ𝐶𝑜𝑟 Hardware limit (correlated noise levels)
ı 𝛿ℒ𝐵𝑊 Filter bandwidth
ı 𝛿ℒ𝐶𝑎𝑏 RF cable
ı 𝛿ℒ𝐴𝑡𝑡 Internal attenuator on the FSWP
ı 𝛿ℒ𝑑𝑒𝑔 Small-angle approximation
Measurement result 𝓛𝑹𝒆𝒂𝒅𝒎
The measured value from the phase noise analyzer is output digitally with a large
number of frequency points. The display resolution can therefore be skipped when
considering the measurement uncertainty.
Correction of noise from the reference oscillators using cross-correlation
method 𝚫𝓛𝑺𝑵𝑹
There are two limiting cases:
ı Insufficient averaging (ℒ𝑅𝑒𝑓𝑚 ≥ ℒ𝐷𝑈𝑇):
The noise from the reference oscillators dominates the noise from the DUT. The
measurement result is usable only for specifying a limit for the noise from the
DUT.
The measurement result ℒ𝑅𝑒𝑎𝑑𝑚 approximately corresponds to the noise from the
reference oscillator ℒ𝑅𝑒𝑓𝑚 .
ℒReadm ≈ ℒRefm (17)
Traceability
01 Rohde & Schwarz Measurement Uncertainty Analysis and Traceability for Phase Noise
12
In principle, it is possible to reduce ℒ𝑅𝑒𝑓𝑚 as necessary by selecting many averagings.
In practice, there is a limit as defined by the hardware limit 𝛿ℒ𝐶𝑜𝑟.
ı Sufficient averaging (ℒ𝐷𝑈𝑇 > ℒ𝑅𝑒𝑓𝑚 , ℒ𝑆𝑁𝑅 > 5 dB ):
The noise from the DUT dominates the noise level component. The measurement
result permits an assessment of the phase noise from the DUT. The influence of
the bias, caused by the noise from the reference oscillators, is minimal.
The measurement result ℒ𝑅𝑒𝑎𝑑𝑚 represents the noise from the DUT ℒ𝐷𝑈𝑇.
ℒReadm ≈ ℒDUT (18)
If the noise from the reference oscillators ℒ𝑅𝑒𝑓𝑚 approximately matches the noise from
the DUT (ℒ𝐷𝑈𝑇 ≥ ℒ𝑅𝑒𝑓𝑚 , ℒ𝑆𝑁𝑅 ≥ 0 dB), then the bias Δℒ𝑆𝑁𝑅 is a complex function of the
offset ℒ𝑆𝑁𝑅 = ℒ𝐷𝑈𝑇 − ℒ𝑅𝑒𝑓𝑚. The bias additionally depends somewhat on the offset
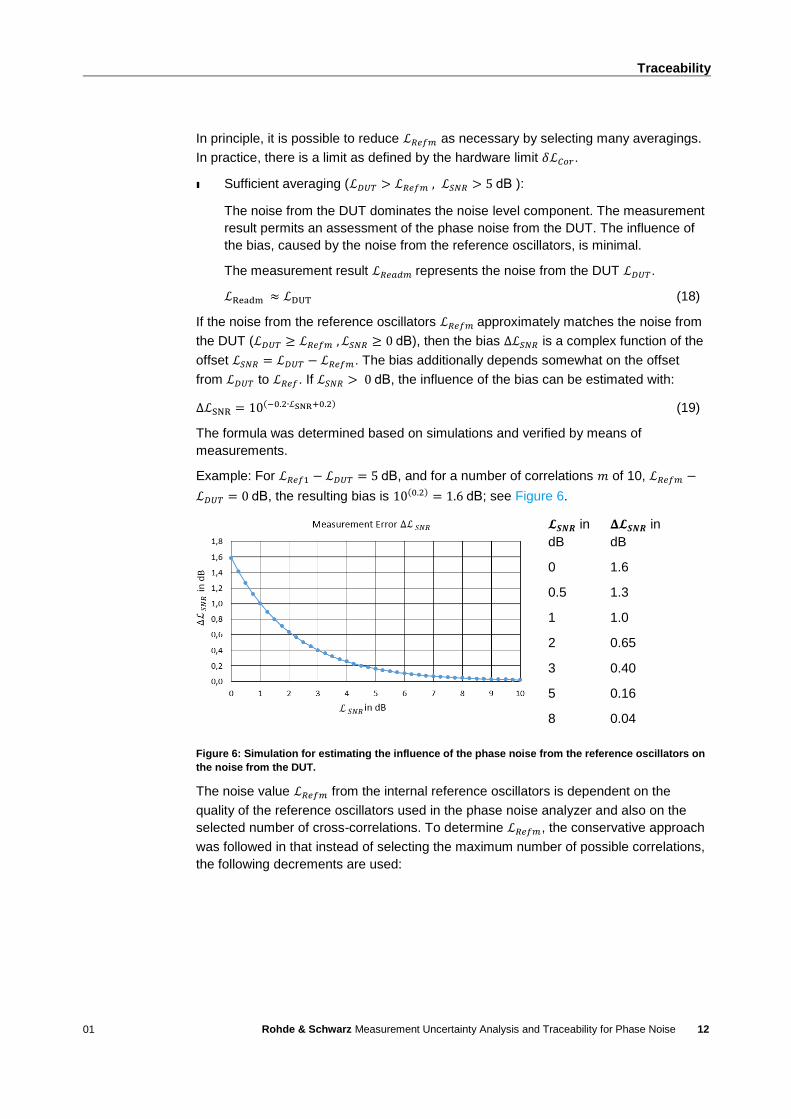
from ℒ𝐷𝑈𝑇 to ℒ𝑅𝑒𝑓. If ℒ𝑆𝑁𝑅 > 0 dB, the influence of the bias can be estimated with:
ΔℒSNR = 10(−0.2∙ℒSNR+0.2) (19)
The formula was determined based on simulations and verified by means of
measurements.
Example: For ℒ𝑅𝑒𝑓1 − ℒ𝐷𝑈𝑇 = 5 dB, and for a number of correlations 𝑚 of 10, ℒ𝑅𝑒𝑓𝑚 −
ℒ𝐷𝑈𝑇 = 0 dB, the resulting bias is 10(0.2) = 1.6 dB; see Figure 6.
Figure 6: Simulation for estimating the influence of the phase noise from the reference oscillators on
the noise from the DUT.
The noise value ℒ𝑅𝑒𝑓𝑚 from the internal reference oscillators is dependent on the
quality of the reference oscillators used in the phase noise analyzer and also on the
selected number of cross-correlations. To determine ℒ𝑅𝑒𝑓𝑚, the conservative approach
was followed in that instead of selecting the maximum number of possible correlations,
the following decrements are used:
𝓛𝑺𝑵𝑹 in
dB
𝚫𝓛𝑺𝑵𝑹 in
dB
0 1.6
0.5 1.3
1 1.0
2 0.65
3 0.40
5 0.16
8 0.04
Traceability
01 Rohde & Schwarz Measurement Uncertainty Analysis and Traceability for Phase Noise
13
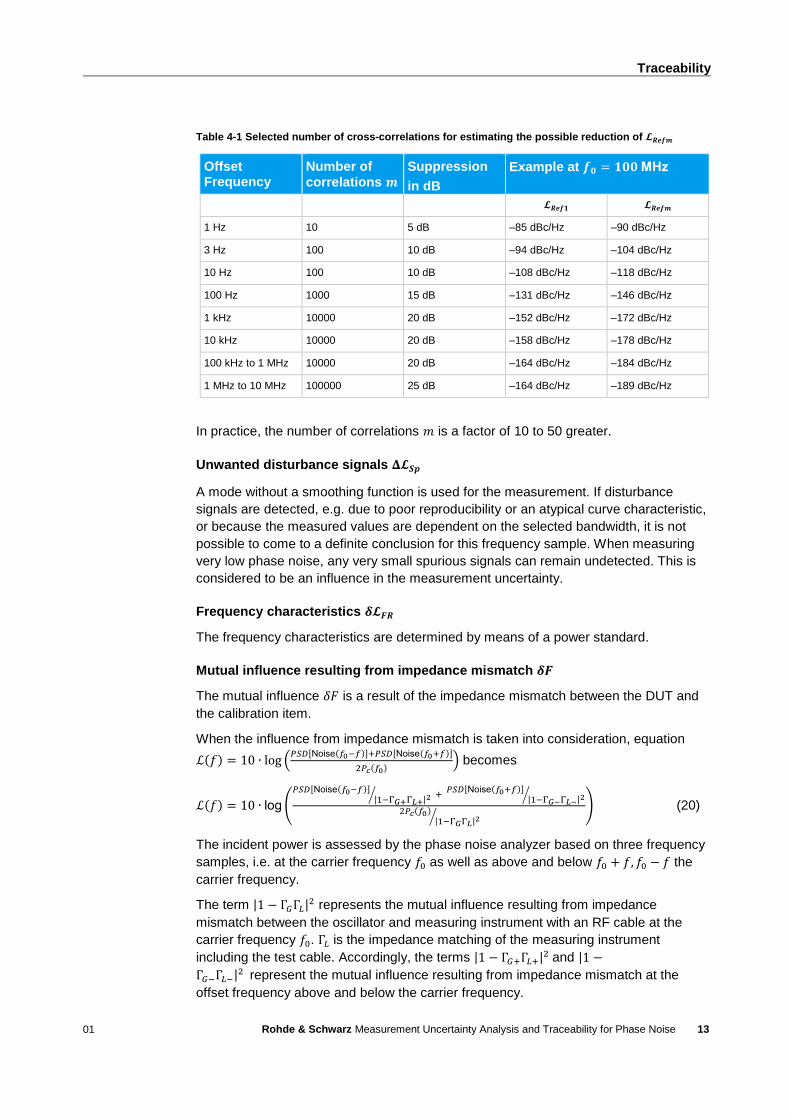
Table 4-1 Selected number of cross-correlations for estimating the possible reduction of 𝓛𝑹𝒆𝒇𝒎
Offset Frequency
Number of
correlations 𝒎
Suppression
in dB
Example at 𝒇𝟎 = 𝟏𝟎𝟎 MHz
𝓛𝑹𝒆𝒇𝟏 𝓛𝑹𝒆𝒇𝒎
1 Hz 10 5 dB –85 dBc/Hz –90 dBc/Hz
3 Hz 100 10 dB –94 dBc/Hz –104 dBc/Hz
10 Hz 100 10 dB –108 dBc/Hz –118 dBc/Hz
100 Hz 1000 15 dB –131 dBc/Hz –146 dBc/Hz
1 kHz 10000 20 dB –152 dBc/Hz –172 dBc/Hz
10 kHz 10000 20 dB –158 dBc/Hz –178 dBc/Hz
100 kHz to 1 MHz 10000 20 dB –164 dBc/Hz –184 dBc/Hz
1 MHz to 10 MHz 100000 25 dB –164 dBc/Hz –189 dBc/Hz
In practice, the number of correlations 𝑚 is a factor of 10 to 50 greater.
Unwanted disturbance signals 𝚫𝓛𝑺𝒑
A mode without a smoothing function is used for the measurement. If disturbance
signals are detected, e.g. due to poor reproducibility or an atypical curve characteristic,
or because the measured values are dependent on the selected bandwidth, it is not
possible to come to a definite conclusion for this frequency sample. When measuring
very low phase noise, any very small spurious signals can remain undetected. This is
considered to be an influence in the measurement uncertainty.
Frequency characteristics 𝜹𝓛𝑭𝑹
The frequency characteristics are determined by means of a power standard.
Mutual influence resulting from impedance mismatch 𝜹𝑭
The mutual influence 𝛿𝐹 is a result of the impedance mismatch between the DUT and
the calibration item.
When the influence from impedance mismatch is taken into consideration, equation
ℒ(𝑓) = 10 ∙ log (𝑃𝑆𝐷[Noise(𝑓0−𝑓)]+𝑃𝑆𝐷[Noise(𝑓0+𝑓)]
2𝑃𝑐(𝑓0)) becomes
ℒ(𝑓) = 10 ∙ log (
𝑃𝑆𝐷[Noise(𝑓0−𝑓)]|1−Γ𝐺+Γ𝐿+|2⁄ +
𝑃𝑆𝐷[Noise(𝑓0+𝑓)]|1−Γ𝐺−Γ𝐿−|2⁄
2𝑃𝑐(𝑓0)
|1−Γ𝐺Γ𝐿|2⁄) (20)
The incident power is assessed by the phase noise analyzer based on three frequency
samples, i.e. at the carrier frequency 𝑓0 as well as above and below 𝑓0 + 𝑓, 𝑓0 − 𝑓 the
carrier frequency.
The term |1 − Γ𝐺Γ𝐿|2 represents the mutual influence resulting from impedance
mismatch between the oscillator and measuring instrument with an RF cable at the
carrier frequency 𝑓0. Γ𝐿 is the impedance matching of the measuring instrument
including the test cable. Accordingly, the terms |1 − Γ𝐺+Γ𝐿+|2 and |1 −
Γ𝐺−Γ𝐿−|2 represent the mutual influence resulting from impedance mismatch at the
offset frequency above and below the carrier frequency.
Traceability
01 Rohde & Schwarz Measurement Uncertainty Analysis and Traceability for Phase Noise
14
It therefore follows that the impedance matching at the following frequencies is key: 𝑓0,
𝛿𝑓− = 𝑓0 − 𝑓 and 𝛿𝑓+ = 𝑓0 + 𝑓. The following applies as a result of the symmetry of the
phase noise around the carrier frequency (𝑃𝑆𝐷[Noise(𝑓0 − 𝑓)] = 𝑃𝑆𝐷[Noise(𝑓0 + 𝑓)]):
ℒ(f) = 10 ∙ log (PSD[Noise(f)]
Pc(f0)∙
1
2(
|1−ΓGΓL|2
|1−ΓG+ΓL+|2 +|1−ΓGΓL|2
|1−ΓG−ΓL−|2)) (21)
If the impedance matching between the oscillator and measuring instrument does not
change in magnitude and phase as a function of the frequency, the impedance
matching terms are cancelled out by the correlation.
If a change occurs in the mutual influence, the effect of the mutual influence 𝛿𝐹 on the
measurement result is as follows:
δF = 10 log (1
2(
|1−ΓGΓL|2
|1−ΓG+ΓL+|2 +|1−ΓGΓL|2
|1−ΓG−ΓL−|2)) (22)
Approximated to: 𝛿𝐹 ≈ 5 log(1 − 4𝑟𝐺𝑟𝐿 cos(𝛼) + 2𝑟𝐺+𝑟𝐿+ cos(𝛼+) + 2𝑟𝐺−𝑟𝐿− cos(𝛼−)).
The factor (𝑟𝐺𝑟𝐿 cos(𝛼)) is distributed in a U-shape.
In the worst-case scenario, the angle is 𝛼 = 90° or 270°. An angle change 𝛿𝛼 of 𝛼+ or
𝛼− as compared to 𝛼 causes the greatest change of the two positive terms as
compared to the first term, resulting therefore in a large deviation 𝛿𝐹.
As a function of phase change 𝛿𝛼+ and 𝛿𝛼−, the influence 𝛿𝐹 can be estimated.
Under the worst-case assumption cos(𝛼) = 0 where 𝛼 = 90° or 270°, the following
applies:
U(δF) = 10 log (1 + 2rGrL ∙ (sin(δα+) + sin(δα−))) (23)
𝛿𝛼+ and 𝛿𝛼− represent the relative phase change of the angle between the impedance
matching vector for the oscillator and the measuring instrument as a function of the
offset frequency. As a rule, the following applies: 𝛿𝛼+ ≈ − 𝛿𝛼−. In this case, the
impedance mismatch is averaged out. Because from 𝛿𝛼+ = − 𝛿𝛼−, it follows that
sin(𝛿𝛼+) + sin(𝛿𝛼−) = 0.
A conservative calculation is (𝛿𝛼 < 50°):
U(δF) ≈ 10 log(1 + 2rGrL ∙ δα) (24)
where 𝑢(𝛿𝐹) =1
√2𝑈(𝛿𝐹). 𝛿𝛼 is the estimated change in angle between the vectors of
the DUT and the R&S FSWP measuring instrument as a function of the offset
frequency. (In the calculation of the measurement uncertainty, the unit of the angle is
expressed in rad.)
Linearity 𝜹𝓛𝑳𝒊𝒏
The linearity is checked by means of a second CW signal. This is applied to the path
via a directional coupler. The directional coupler ensures a separation between the two
CW signals and thus prevents mutual influences. The same instrument set to spectrum
mode determines the offset between the wanted CW signal and the second CW signal.
The linearity of the instrument in spectrum mode was previously incrementally proven
using a power meter.
Traceability
01 Rohde & Schwarz Measurement Uncertainty Analysis and Traceability for Phase Noise
15
In spectrum mode, the second CW signal is 6 dB higher than in phase noise mode. A
3 dB suppression results because the CW signal contributes one half to the phase
noise and the other half to the amplitude noise. An additional 3 dB results from the
definition of the phase noise measurand. The phase noise is referenced to a single
sideband. In phase noise mode, the measured CW disturbance signal is assessed by a
factor of 4 lower than in spectrum mode.
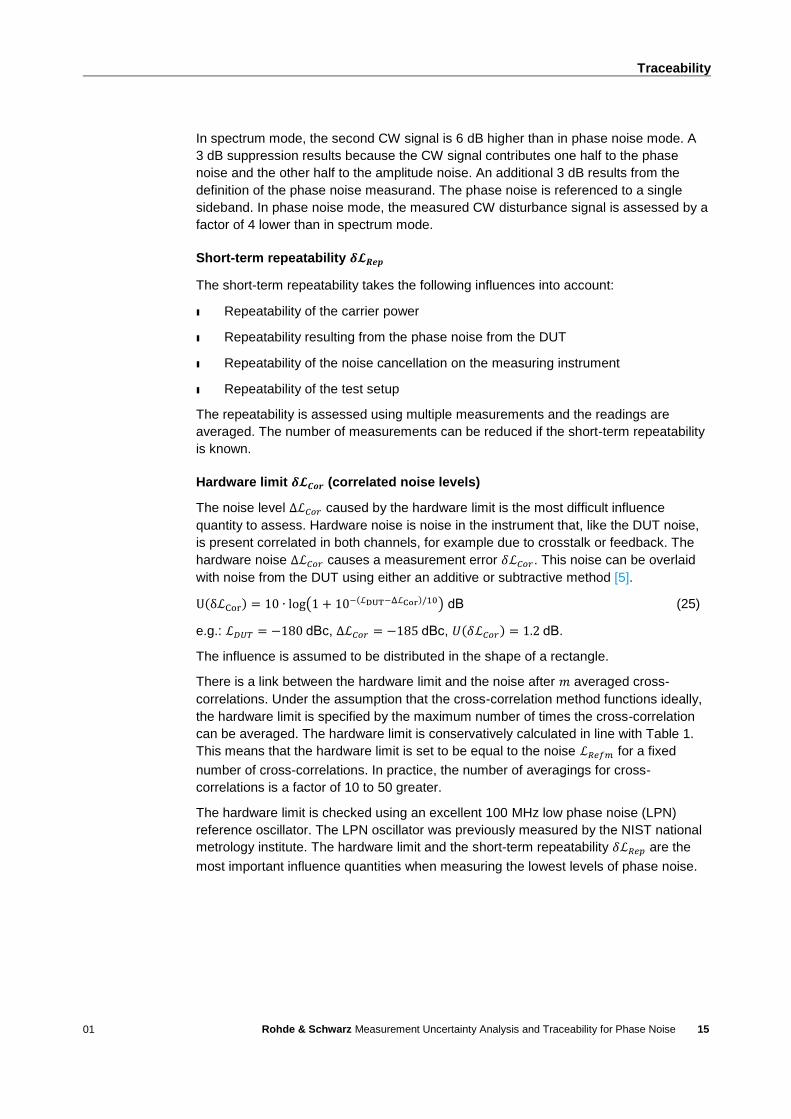
Short-term repeatability 𝜹𝓛𝑹𝒆𝒑
The short-term repeatability takes the following influences into account:
ı Repeatability of the carrier power
ı Repeatability resulting from the phase noise from the DUT
ı Repeatability of the noise cancellation on the measuring instrument
ı Repeatability of the test setup
The repeatability is assessed using multiple measurements and the readings are
averaged. The number of measurements can be reduced if the short-term repeatability
is known.
Hardware limit 𝜹𝓛𝑪𝒐𝒓 (correlated noise levels)
The noise level Δℒ𝐶𝑜𝑟 caused by the hardware limit is the most difficult influence
quantity to assess. Hardware noise is noise in the instrument that, like the DUT noise,
is present correlated in both channels, for example due to crosstalk or feedback. The
hardware noise Δℒ𝐶𝑜𝑟 causes a measurement error 𝛿ℒ𝐶𝑜𝑟. This noise can be overlaid
with noise from the DUT using either an additive or subtractive method [5].
U(δℒCor) = 10 ∙ log(1 + 10−(ℒDUT−ΔℒCor)/10) dB (25)
e.g.: ℒ𝐷𝑈𝑇 = −180 dBc, Δℒ𝐶𝑜𝑟 = −185 dBc, 𝑈(𝛿ℒ𝐶𝑜𝑟) = 1.2 dB.
The influence is assumed to be distributed in the shape of a rectangle.
There is a link between the hardware limit and the noise after 𝑚 averaged cross-
correlations. Under the assumption that the cross-correlation method functions ideally,
the hardware limit is specified by the maximum number of times the cross-correlation
can be averaged. The hardware limit is conservatively calculated in line with Table 1.
This means that the hardware limit is set to be equal to the noise ℒ𝑅𝑒𝑓𝑚 for a fixed
number of cross-correlations. In practice, the number of averagings for cross-
correlations is a factor of 10 to 50 greater.
The hardware limit is checked using an excellent 100 MHz low phase noise (LPN)
reference oscillator. The LPN oscillator was previously measured by the NIST national
metrology institute. The hardware limit and the short-term repeatability 𝛿ℒ𝑅𝑒𝑝 are the
most important influence quantities when measuring the lowest levels of phase noise.

Traceability
01 Rohde & Schwarz Measurement Uncertainty Analysis and Traceability for Phase Noise
16
Filter bandwidth 𝜹𝓛𝑩𝑾
The filter bandwidth can be set between 0.1 % and 30 %. In principle, a small
bandwidth is preferable because any measurement errors resulting from unwanted
disturbance signals are more easily detected. A smaller bandwidth however leads to
greater deviations when measurement values are acquired. A reasonable compromise
is therefore to set the greatest possible bandwidth when the disturbance signals are
known.
As a rule, a bandwidth of 1 % to 10 % is used. The filter bandwidth shows no errors as
a result of the digitization. Measurement errors result for large filter bandwidths
(> 100 kHz) if analog detectors do not maintain a constant frequency characteristics
over the bandwidth.
RF cable 𝜹𝓛𝑪𝒂𝒃
The RF cable changes the impedance matching for the measuring instrument. The
cable increases the wave amplitude as a function of the frequency when matching the
measuring instrument impedance to that of the DUT. An RF cable must be connected
to measure the impedance matching on the measuring instrument, so it is important to
use a well matched and stable RF cable.
The RF cable should experience little attenuation in the frequency range over 20 MHz.
This change in attenuation is conservatively estimated from measurements at less than
0.05 dB.
Internal attenuator 𝜹𝓛𝑨𝒕𝒕
The selection of a 5 dB or 10 dB attenuator pad additionally improves the impedance
matching for the measuring instrument. To fully utilize the dynamic range of the
measuring instrument, for example to provide evidence of very low phase noise, the
signal level at the input of the measuring instrument should be greater than 10 dBm.
Obviously, the hardware limit is reached more quickly as the signal level decreases.
This greatly restricts the use of an attenuator, so the measurements are performed
without an internal attenuator. However, it is possible to use an attenuator for
verification of the measurement results.
Small-angle approximation 𝜹𝓛𝒅𝒆𝒈
The small-angle approximation (see equations (9) and (10) is applicable only for low
noise. In practice, the noise is measured as incidental FM modulation. Only the zeroth
order of the Bessel functions applies. This leads to errors when the noise angle is
greater than 1 rad. Errors resulting from the small-angle approximation are negligible
because the phase noise is typically small [1] (page 256).
Traceability
01 Rohde & Schwarz Measurement Uncertainty Analysis and Traceability for Phase Noise
17
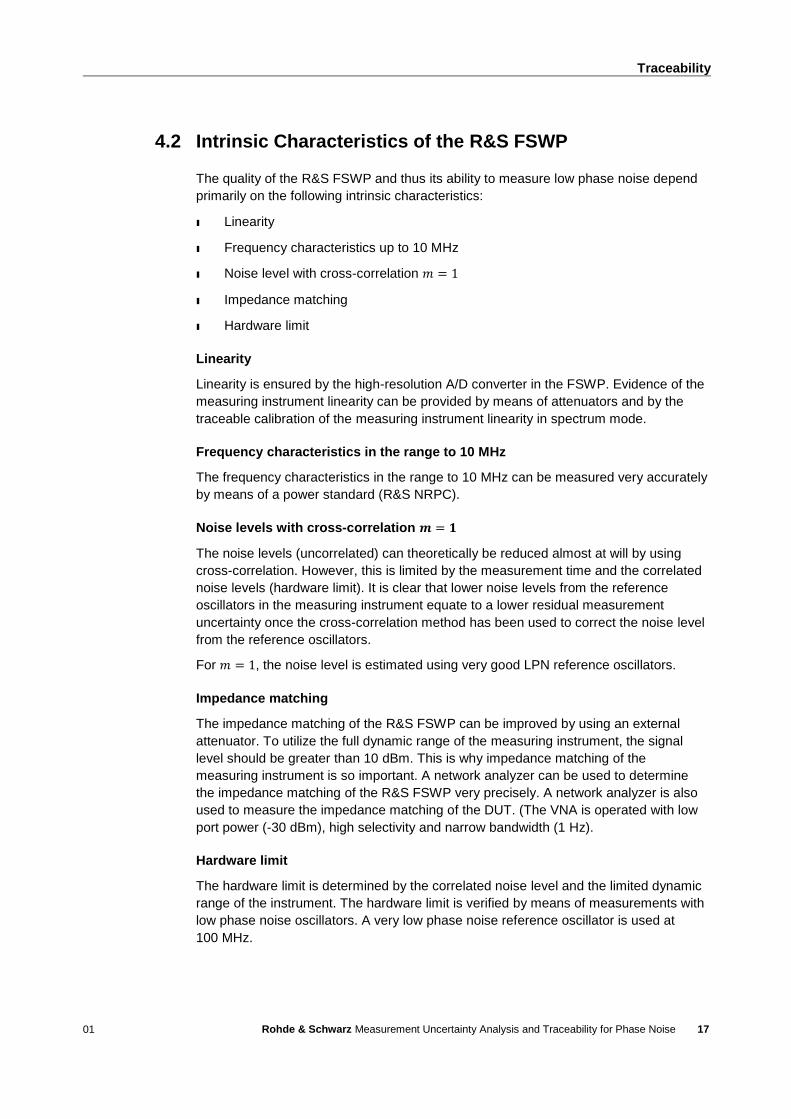
4.2 Intrinsic Characteristics of the R&S FSWP
The quality of the R&S FSWP and thus its ability to measure low phase noise depend
primarily on the following intrinsic characteristics:
ı Linearity
ı Frequency characteristics up to 10 MHz
ı Noise level with cross-correlation 𝑚 = 1
ı Impedance matching
ı Hardware limit
Linearity
Linearity is ensured by the high-resolution A/D converter in the FSWP. Evidence of the
measuring instrument linearity can be provided by means of attenuators and by the
traceable calibration of the measuring instrument linearity in spectrum mode.
Frequency characteristics in the range to 10 MHz
The frequency characteristics in the range to 10 MHz can be measured very accurately
by means of a power standard (R&S NRPC).
Noise levels with cross-correlation 𝒎 = 𝟏
The noise levels (uncorrelated) can theoretically be reduced almost at will by using
cross-correlation. However, this is limited by the measurement time and the correlated
noise levels (hardware limit). It is clear that lower noise levels from the reference
oscillators in the measuring instrument equate to a lower residual measurement
uncertainty once the cross-correlation method has been used to correct the noise level
from the reference oscillators.
For 𝑚 = 1, the noise level is estimated using very good LPN reference oscillators.
Impedance matching
The impedance matching of the R&S FSWP can be improved by using an external
attenuator. To utilize the full dynamic range of the measuring instrument, the signal
level should be greater than 10 dBm. This is why impedance matching of the
measuring instrument is so important. A network analyzer can be used to determine
the impedance matching of the R&S FSWP very precisely. A network analyzer is also
used to measure the impedance matching of the DUT. (The VNA is operated with low
port power (-30 dBm), high selectivity and narrow bandwidth (1 Hz).
Hardware limit
The hardware limit is determined by the correlated noise level and the limited dynamic
range of the instrument. The hardware limit is verified by means of measurements with
low phase noise oscillators. A very low phase noise reference oscillator is used at
100 MHz.
Traceability
01 Rohde & Schwarz Measurement Uncertainty Analysis and Traceability for Phase Noise
18
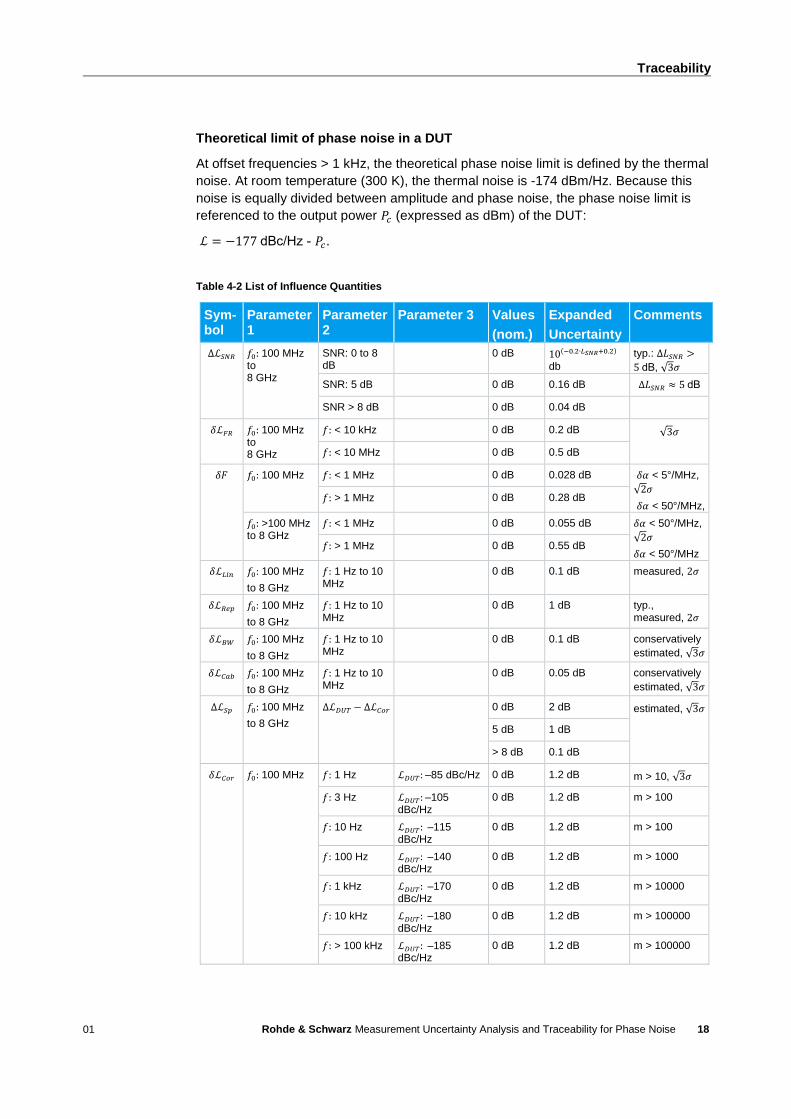
Theoretical limit of phase noise in a DUT
At offset frequencies > 1 kHz, the theoretical phase noise limit is defined by the thermal
noise. At room temperature (300 K), the thermal noise is -174 dBm/Hz. Because this
noise is equally divided between amplitude and phase noise, the phase noise limit is
referenced to the output power 𝑃𝑐 (expressed as dBm) of the DUT:
ℒ = −177 dBc/Hz - 𝑃𝑐.
Table 4-2 List of Influence Quantities
Sym-bol
Parameter 1
Parameter 2
Parameter 3 Values
(nom.)
Expanded
Uncertainty
Comments
Δℒ𝑆𝑁𝑅 𝑓0: 100 MHz to 8 GHz
SNR: 0 to 8 dB
0 dB 10(−0.2∙𝐿𝑆𝑁𝑅+0.2) db
typ.: Δ𝐿𝑆𝑁𝑅 >
5 dB, √3𝜎
SNR: 5 dB 0 dB 0.16 dB Δ𝐿𝑆𝑁𝑅 ≈ 5 dB
SNR > 8 dB 0 dB 0.04 dB
𝛿ℒ𝐹𝑅 𝑓0: 100 MHz to 8 GHz
𝑓: < 10 kHz 0 dB 0.2 dB √3𝜎
𝑓: < 10 MHz 0 dB 0.5 dB
𝛿𝐹 𝑓0: 100 MHz 𝑓: < 1 MHz 0 dB 0.028 dB 𝛿𝛼 < 5°/MHz,
√2𝜎
𝛿𝛼 < 50°/MHz, 𝑓: > 1 MHz 0 dB 0.28 dB
𝑓0: >100 MHz to 8 GHz
𝑓: < 1 MHz 0 dB 0.055 dB 𝛿𝛼 < 50°/MHz,
√2𝜎
𝛿𝛼 < 50°/MHz 𝑓: > 1 MHz 0 dB 0.55 dB
𝛿ℒ𝐿𝑖𝑛 𝑓0: 100 MHz
to 8 GHz
𝑓: 1 Hz to 10 MHz
0 dB 0.1 dB measured, 2𝜎
𝛿ℒ𝑅𝑒𝑝 𝑓0: 100 MHz
to 8 GHz
𝑓: 1 Hz to 10 MHz
0 dB 1 dB typ., measured, 2𝜎
𝛿ℒ𝐵𝑊 𝑓0: 100 MHz
to 8 GHz
𝑓: 1 Hz to 10 MHz
0 dB 0.1 dB conservatively
estimated, √3𝜎
𝛿ℒ𝐶𝑎𝑏 𝑓0: 100 MHz
to 8 GHz
𝑓: 1 Hz to 10 MHz
0 dB 0.05 dB conservatively
estimated, √3𝜎
Δℒ𝑆𝑝 𝑓0: 100 MHz
to 8 GHz
∆ℒ𝐷𝑈𝑇 − ∆ℒ𝐶𝑜𝑟 0 dB 2 dB estimated, √3𝜎
5 dB 1 dB
> 8 dB 0.1 dB
𝛿ℒ𝐶𝑜𝑟 𝑓0: 100 MHz 𝑓: 1 Hz ℒ𝐷𝑈𝑇: –85 dBc/Hz 0 dB 1.2 dB m > 10, √3𝜎
𝑓: 3 Hz ℒ𝐷𝑈𝑇: –105 dBc/Hz
0 dB 1.2 dB m > 100
𝑓: 10 Hz ℒ𝐷𝑈𝑇: –115 dBc/Hz
0 dB 1.2 dB m > 100
𝑓: 100 Hz ℒ𝐷𝑈𝑇: –140 dBc/Hz
0 dB 1.2 dB m > 1000
𝑓: 1 kHz ℒ𝐷𝑈𝑇: –170 dBc/Hz
0 dB 1.2 dB m > 10000
𝑓: 10 kHz ℒ𝐷𝑈𝑇: –180 dBc/Hz
0 dB 1.2 dB m > 100000
𝑓: > 100 kHz ℒ𝐷𝑈𝑇: –185 dBc/Hz
0 dB 1.2 dB m > 100000
Traceability
01 Rohde & Schwarz Measurement Uncertainty Analysis and Traceability for Phase Noise
19
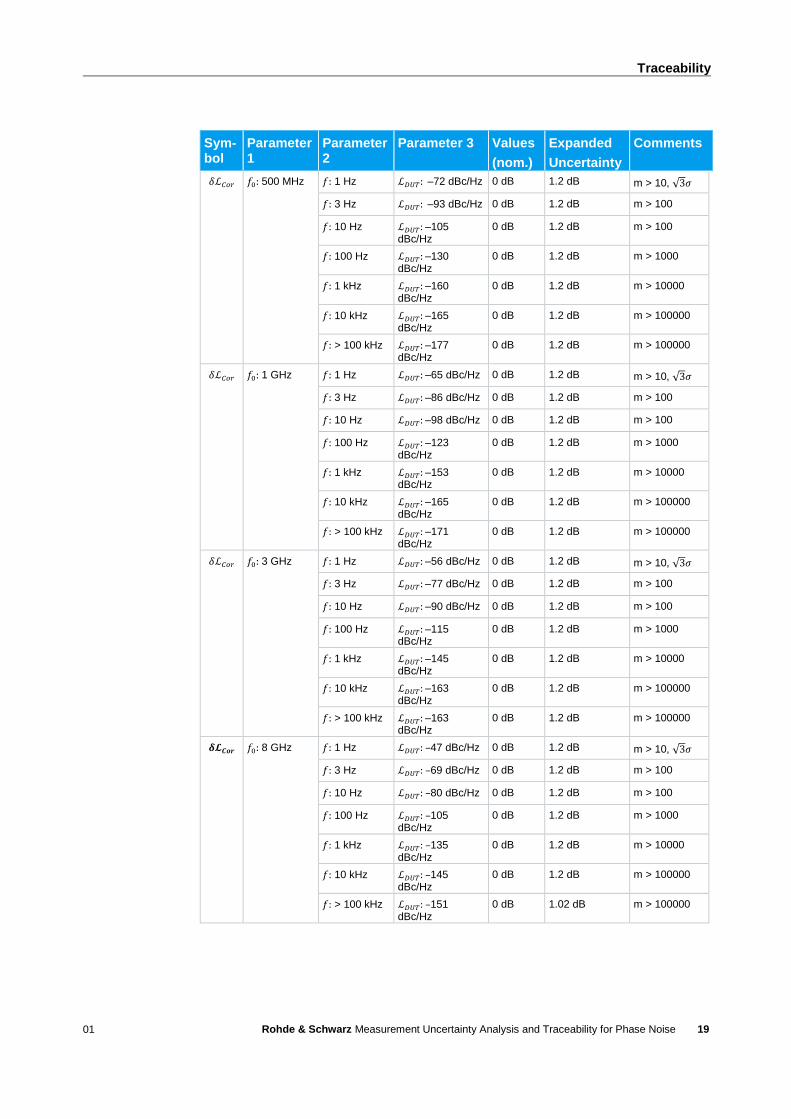
Sym-bol
Parameter 1
Parameter 2
Parameter 3 Values
(nom.)
Expanded
Uncertainty
Comments
𝛿ℒ𝐶𝑜𝑟 𝑓0: 500 MHz 𝑓: 1 Hz ℒ𝐷𝑈𝑇: –72 dBc/Hz 0 dB 1.2 dB m > 10, √3𝜎
𝑓: 3 Hz ℒ𝐷𝑈𝑇: –93 dBc/Hz 0 dB 1.2 dB m > 100
𝑓: 10 Hz ℒ𝐷𝑈𝑇: –105 dBc/Hz
0 dB 1.2 dB m > 100
𝑓: 100 Hz ℒ𝐷𝑈𝑇: –130 dBc/Hz
0 dB 1.2 dB m > 1000
𝑓: 1 kHz ℒ𝐷𝑈𝑇: –160 dBc/Hz
0 dB 1.2 dB m > 10000
𝑓: 10 kHz ℒ𝐷𝑈𝑇: –165 dBc/Hz
0 dB 1.2 dB m > 100000
𝑓: > 100 kHz ℒ𝐷𝑈𝑇: –177 dBc/Hz
0 dB 1.2 dB m > 100000
𝛿ℒ𝐶𝑜𝑟 𝑓0: 1 GHz 𝑓: 1 Hz ℒ𝐷𝑈𝑇: –65 dBc/Hz 0 dB 1.2 dB m > 10, √3𝜎
𝑓: 3 Hz ℒ𝐷𝑈𝑇: –86 dBc/Hz 0 dB 1.2 dB m > 100
𝑓: 10 Hz ℒ𝐷𝑈𝑇: –98 dBc/Hz 0 dB 1.2 dB m > 100
𝑓: 100 Hz ℒ𝐷𝑈𝑇: –123 dBc/Hz
0 dB 1.2 dB m > 1000
𝑓: 1 kHz ℒ𝐷𝑈𝑇: –153 dBc/Hz
0 dB 1.2 dB m > 10000
𝑓: 10 kHz ℒ𝐷𝑈𝑇: –165 dBc/Hz
0 dB 1.2 dB m > 100000
𝑓: > 100 kHz ℒ𝐷𝑈𝑇: –171 dBc/Hz
0 dB 1.2 dB m > 100000
𝛿ℒ𝐶𝑜𝑟 𝑓0: 3 GHz 𝑓: 1 Hz ℒ𝐷𝑈𝑇: –56 dBc/Hz 0 dB 1.2 dB m > 10, √3𝜎
𝑓: 3 Hz ℒ𝐷𝑈𝑇: –77 dBc/Hz 0 dB 1.2 dB m > 100
𝑓: 10 Hz ℒ𝐷𝑈𝑇: –90 dBc/Hz 0 dB 1.2 dB m > 100
𝑓: 100 Hz ℒ𝐷𝑈𝑇: –115 dBc/Hz
0 dB 1.2 dB m > 1000
𝑓: 1 kHz ℒ𝐷𝑈𝑇: –145 dBc/Hz
0 dB 1.2 dB m > 10000
𝑓: 10 kHz ℒ𝐷𝑈𝑇: –163 dBc/Hz
0 dB 1.2 dB m > 100000
𝑓: > 100 kHz ℒ𝐷𝑈𝑇: –163 dBc/Hz
0 dB 1.2 dB m > 100000
𝜹𝓛𝑪𝒐𝒓 𝑓0: 8 GHz 𝑓: 1 Hz ℒ𝐷𝑈𝑇: –47 dBc/Hz 0 dB 1.2 dB m > 10, √3𝜎
𝑓: 3 Hz ℒ𝐷𝑈𝑇: –69 dBc/Hz 0 dB 1.2 dB m > 100
𝑓: 10 Hz ℒ𝐷𝑈𝑇: –80 dBc/Hz 0 dB 1.2 dB m > 100
𝑓: 100 Hz ℒ𝐷𝑈𝑇: –105 dBc/Hz
0 dB 1.2 dB m > 1000
𝑓: 1 kHz ℒ𝐷𝑈𝑇: –135 dBc/Hz
0 dB 1.2 dB m > 10000
𝑓: 10 kHz ℒ𝐷𝑈𝑇: –145 dBc/Hz
0 dB 1.2 dB m > 100000
𝑓: > 100 kHz ℒ𝐷𝑈𝑇: –151 dBc/Hz
0 dB 1.02 dB m > 100000
Traceability
01 Rohde & Schwarz Measurement Uncertainty Analysis and Traceability for Phase Noise
20
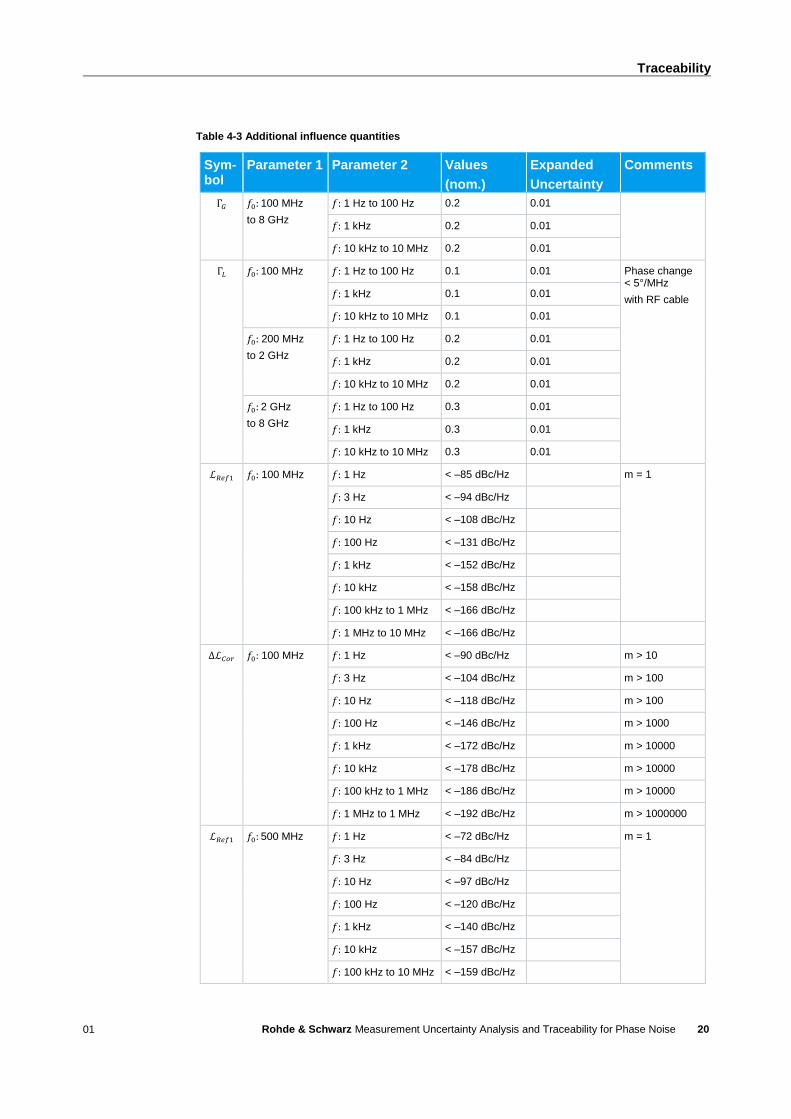
Table 4-3 Additional influence quantities
Sym-bol
Parameter 1 Parameter 2 Values
(nom.)
Expanded
Uncertainty
Comments
Γ𝐺 𝑓0: 100 MHz
to 8 GHz
𝑓: 1 Hz to 100 Hz 0.2 0.01
𝑓: 1 kHz 0.2 0.01
𝑓: 10 kHz to 10 MHz 0.2 0.01
Γ𝐿 𝑓0: 100 MHz 𝑓: 1 Hz to 100 Hz 0.1 0.01 Phase change < 5°/MHz
with RF cable 𝑓: 1 kHz 0.1 0.01
𝑓: 10 kHz to 10 MHz 0.1 0.01
𝑓0: 200 MHz
to 2 GHz
𝑓: 1 Hz to 100 Hz 0.2 0.01
𝑓: 1 kHz 0.2 0.01
𝑓: 10 kHz to 10 MHz 0.2 0.01
𝑓0: 2 GHz
to 8 GHz
𝑓: 1 Hz to 100 Hz 0.3 0.01
𝑓: 1 kHz 0.3 0.01
𝑓: 10 kHz to 10 MHz 0.3 0.01
ℒ𝑅𝑒𝑓1 𝑓0: 100 MHz 𝑓: 1 Hz < –85 dBc/Hz m = 1
𝑓: 3 Hz < –94 dBc/Hz
𝑓: 10 Hz < –108 dBc/Hz
𝑓: 100 Hz < –131 dBc/Hz
𝑓: 1 kHz < –152 dBc/Hz
𝑓: 10 kHz < –158 dBc/Hz
𝑓: 100 kHz to 1 MHz < –166 dBc/Hz
𝑓: 1 MHz to 10 MHz < –166 dBc/Hz
∆ℒ𝐶𝑜𝑟 𝑓0: 100 MHz 𝑓: 1 Hz < –90 dBc/Hz m > 10
𝑓: 3 Hz < –104 dBc/Hz m > 100
𝑓: 10 Hz < –118 dBc/Hz m > 100
𝑓: 100 Hz < –146 dBc/Hz m > 1000
𝑓: 1 kHz < –172 dBc/Hz m > 10000
𝑓: 10 kHz < –178 dBc/Hz m > 10000
𝑓: 100 kHz to 1 MHz < –186 dBc/Hz m > 10000
𝑓: 1 MHz to 1 MHz < –192 dBc/Hz m > 1000000
ℒ𝑅𝑒𝑓1 𝑓0: 500 MHz 𝑓: 1 Hz < –72 dBc/Hz m = 1
𝑓: 3 Hz < –84 dBc/Hz
𝑓: 10 Hz < –97 dBc/Hz
𝑓: 100 Hz < –120 dBc/Hz
𝑓: 1 kHz < –140 dBc/Hz
𝑓: 10 kHz < –157 dBc/Hz
𝑓: 100 kHz to 10 MHz < –159 dBc/Hz
Traceability
01 Rohde & Schwarz Measurement Uncertainty Analysis and Traceability for Phase Noise
21
Sym-bol
Parameter 1 Parameter 2 Values
(nom.)
Expanded
Uncertainty
Comments
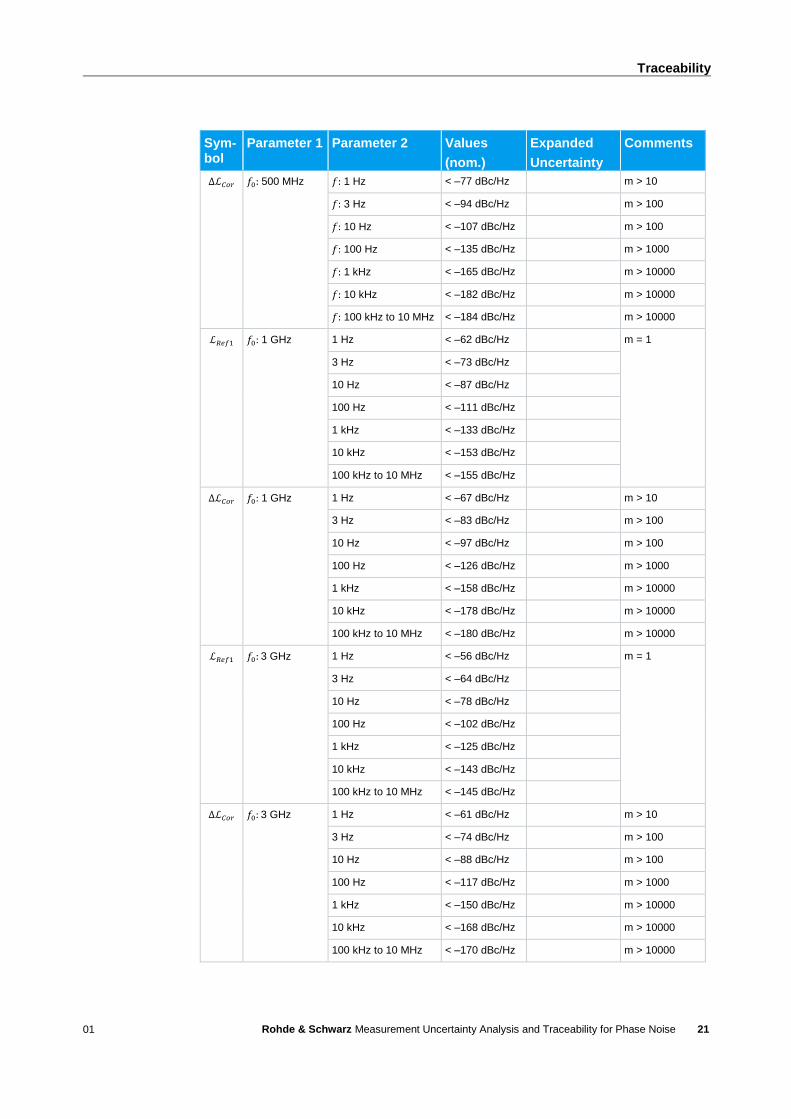
∆ℒ𝐶𝑜𝑟 𝑓0: 500 MHz 𝑓: 1 Hz < –77 dBc/Hz m > 10
𝑓: 3 Hz < –94 dBc/Hz m > 100
𝑓: 10 Hz < –107 dBc/Hz m > 100
𝑓: 100 Hz < –135 dBc/Hz m > 1000
𝑓: 1 kHz < –165 dBc/Hz m > 10000
𝑓: 10 kHz < –182 dBc/Hz m > 10000
𝑓: 100 kHz to 10 MHz < –184 dBc/Hz m > 10000
ℒ𝑅𝑒𝑓1 𝑓0: 1 GHz 1 Hz < –62 dBc/Hz m = 1
3 Hz < –73 dBc/Hz
10 Hz < –87 dBc/Hz
100 Hz < –111 dBc/Hz
1 kHz < –133 dBc/Hz
10 kHz < –153 dBc/Hz
100 kHz to 10 MHz < –155 dBc/Hz
∆ℒ𝐶𝑜𝑟 𝑓0: 1 GHz 1 Hz < –67 dBc/Hz m > 10
3 Hz < –83 dBc/Hz m > 100
10 Hz < –97 dBc/Hz m > 100
100 Hz < –126 dBc/Hz m > 1000
1 kHz < –158 dBc/Hz m > 10000
10 kHz < –178 dBc/Hz m > 10000
100 kHz to 10 MHz < –180 dBc/Hz m > 10000
ℒ𝑅𝑒𝑓1 𝑓0: 3 GHz
1 Hz < –56 dBc/Hz m = 1
3 Hz < –64 dBc/Hz
10 Hz < –78 dBc/Hz
100 Hz < –102 dBc/Hz
1 kHz < –125 dBc/Hz
10 kHz < –143 dBc/Hz
100 kHz to 10 MHz < –145 dBc/Hz
∆ℒ𝐶𝑜𝑟 𝑓0: 3 GHz 1 Hz < –61 dBc/Hz m > 10
3 Hz < –74 dBc/Hz m > 100
10 Hz < –88 dBc/Hz m > 100
100 Hz < –117 dBc/Hz m > 1000
1 kHz < –150 dBc/Hz m > 10000
10 kHz < –168 dBc/Hz m > 10000
100 kHz to 10 MHz < –170 dBc/Hz m > 10000
Traceability
01 Rohde & Schwarz Measurement Uncertainty Analysis and Traceability for Phase Noise
22
Sym-bol
Parameter 1 Parameter 2 Values
(nom.)
Expanded
Uncertainty
Comments
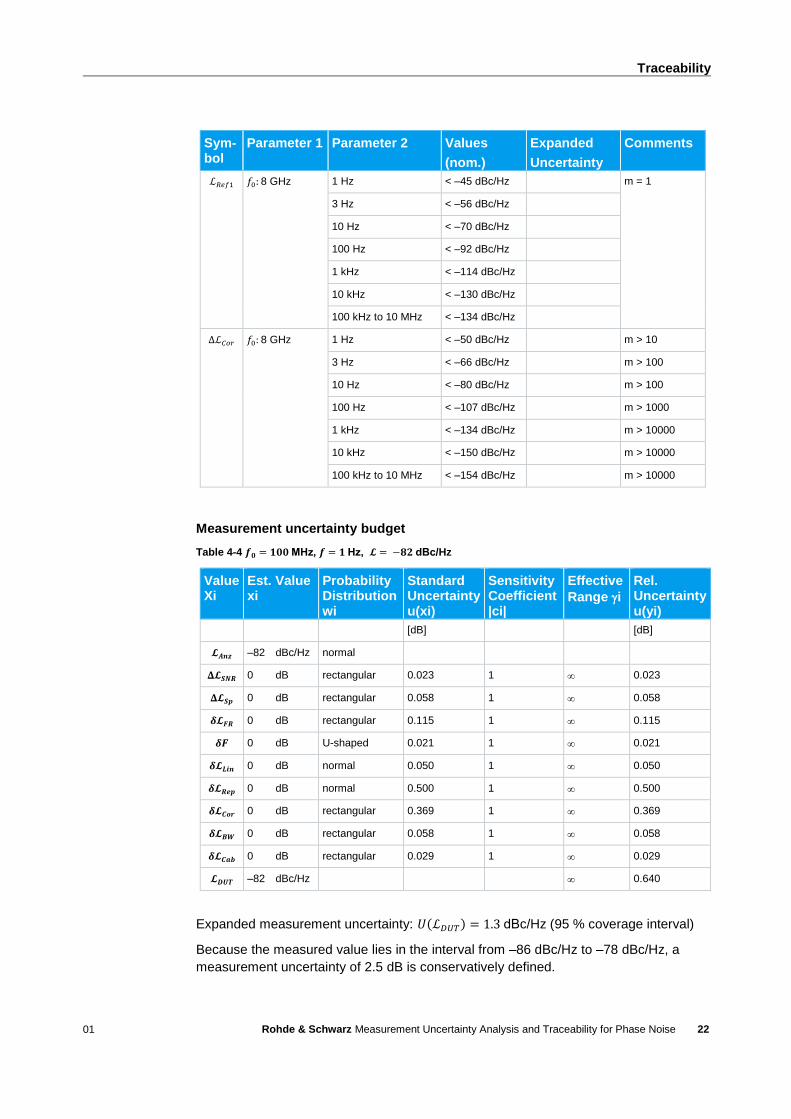
ℒ𝑅𝑒𝑓1 𝑓0: 8 GHz 1 Hz < –45 dBc/Hz m = 1
3 Hz < –56 dBc/Hz
10 Hz < –70 dBc/Hz
100 Hz < –92 dBc/Hz
1 kHz < –114 dBc/Hz
10 kHz < –130 dBc/Hz
100 kHz to 10 MHz < –134 dBc/Hz
∆ℒ𝐶𝑜𝑟 𝑓0: 8 GHz 1 Hz < –50 dBc/Hz m > 10
3 Hz < –66 dBc/Hz m > 100
10 Hz < –80 dBc/Hz m > 100
100 Hz < –107 dBc/Hz m > 1000
1 kHz < –134 dBc/Hz m > 10000
10 kHz < –150 dBc/Hz m > 10000
100 kHz to 10 MHz < –154 dBc/Hz m > 10000
Measurement uncertainty budget
Table 4-4 𝒇𝟎 = 𝟏𝟎𝟎 MHz, 𝒇 = 𝟏 Hz, 𝓛 = −𝟖𝟐 dBc/Hz
Value Xi
Est. Value xi
Probability Distribution wi
Standard Uncertainty u(xi)
Sensitivity Coefficient |ci|
Effective
Range i
Rel. Uncertainty u(yi)
[dB] [dB]
𝓛𝑨𝒏𝒛 –82 dBc/Hz normal
𝚫𝓛𝑺𝑵𝑹 0 dB rectangular 0.023 1 0.023
𝚫𝓛𝑺𝒑 0 dB rectangular 0.058 1 0.058
𝜹𝓛𝑭𝑹 0 dB rectangular 0.115 1 0.115
𝜹𝑭 0 dB U-shaped 0.021 1 0.021
𝜹𝓛𝑳𝒊𝒏 0 dB normal 0.050 1 0.050
𝜹𝓛𝑹𝒆𝒑 0 dB normal 0.500 1 0.500
𝜹𝓛𝑪𝒐𝒓 0 dB rectangular 0.369 1 0.369
𝜹𝓛𝑩𝑾 0 dB rectangular 0.058 1 0.058
𝜹𝓛𝑪𝒂𝒃 0 dB rectangular 0.029 1 0.029
𝓛𝑫𝑼𝑻 –82 dBc/Hz 0.640
Expanded measurement uncertainty: 𝑈(ℒ𝐷𝑈𝑇) = 1.3 dBc/Hz (95 % coverage interval)
Because the measured value lies in the interval from –86 dBc/Hz to –78 dBc/Hz, a
measurement uncertainty of 2.5 dB is conservatively defined.
Traceability
01 Rohde & Schwarz Measurement Uncertainty Analysis and Traceability for Phase Noise
23
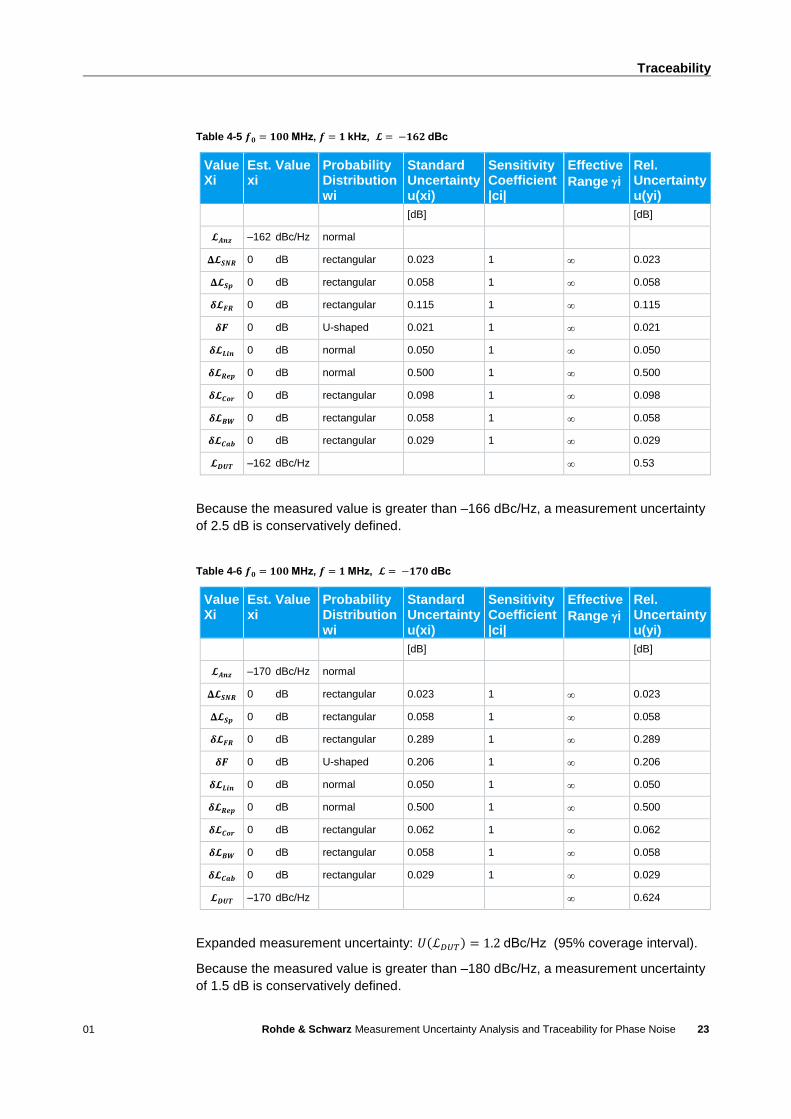
Table 4-5 𝒇𝟎 = 𝟏𝟎𝟎 MHz, 𝒇 = 𝟏 kHz, 𝓛 = −𝟏𝟔𝟐 dBc
Value Xi
Est. Value xi
Probability Distribution wi
Standard Uncertainty u(xi)
Sensitivity Coefficient |ci|
Effective
Range i
Rel. Uncertainty u(yi)
[dB] [dB]
𝓛𝑨𝒏𝒛 –162 dBc/Hz normal
𝚫𝓛𝑺𝑵𝑹 0 dB rectangular 0.023 1 0.023
𝚫𝓛𝑺𝒑 0 dB rectangular 0.058 1 0.058
𝜹𝓛𝑭𝑹 0 dB rectangular 0.115 1 0.115
𝜹𝑭 0 dB U-shaped 0.021 1 0.021
𝜹𝓛𝑳𝒊𝒏 0 dB normal 0.050 1 0.050
𝜹𝓛𝑹𝒆𝒑 0 dB normal 0.500 1 0.500
𝜹𝓛𝑪𝒐𝒓 0 dB rectangular 0.098 1 0.098
𝜹𝓛𝑩𝑾 0 dB rectangular 0.058 1 0.058
𝜹𝓛𝑪𝒂𝒃 0 dB rectangular 0.029 1 0.029
𝓛𝑫𝑼𝑻 –162 dBc/Hz 0.53
Because the measured value is greater than –166 dBc/Hz, a measurement uncertainty
of 2.5 dB is conservatively defined.
Table 4-6 𝒇𝟎 = 𝟏𝟎𝟎 MHz, 𝒇 = 𝟏 MHz, 𝓛 = −𝟏𝟕𝟎 dBc
Value Xi
Est. Value xi
Probability Distribution wi
Standard Uncertainty u(xi)
Sensitivity Coefficient |ci|
Effective
Range i
Rel. Uncertainty u(yi)
[dB] [dB]
𝓛𝑨𝒏𝒛 –170 dBc/Hz normal
𝚫𝓛𝑺𝑵𝑹 0 dB rectangular 0.023 1 0.023
𝚫𝓛𝑺𝒑 0 dB rectangular 0.058 1 0.058
𝜹𝓛𝑭𝑹 0 dB rectangular 0.289 1 0.289
𝜹𝑭 0 dB U-shaped 0.206 1 0.206
𝜹𝓛𝑳𝒊𝒏 0 dB normal 0.050 1 0.050
𝜹𝓛𝑹𝒆𝒑 0 dB normal 0.500 1 0.500
𝜹𝓛𝑪𝒐𝒓 0 dB rectangular 0.062 1 0.062
𝜹𝓛𝑩𝑾 0 dB rectangular 0.058 1 0.058
𝜹𝓛𝑪𝒂𝒃 0 dB rectangular 0.029 1 0.029
𝓛𝑫𝑼𝑻 –170 dBc/Hz 0.624
Expanded measurement uncertainty: 𝑈(ℒ𝐷𝑈𝑇) = 1.2 dBc/Hz (95% coverage interval).
Because the measured value is greater than –180 dBc/Hz, a measurement uncertainty
of 1.5 dB is conservatively defined.

Traceability
01 Rohde & Schwarz Measurement Uncertainty Analysis and Traceability for Phase Noise
24
The measurement uncertainty is scaled over the carrier frequency and the offset
frequency and can be displayed as a function of the phase noise. For very low phase
noise that lies close to the hardware limit of the measuring instrument, only an upper
limit can be specified for the phase noise. As a result of the logarithmic display, the
measurement uncertainty is strongly asymmetrical.
Two ranges are defined for the measurement uncertainty of the phase noise
measurements:
ı Phase noise 12 dB above the hardware limit. A measurement uncertainty of at
least 1.5 dB is assumed.
ℒ𝐷𝑈𝑇 = −140 (±1.5) dBc/Hz , Δℒ𝐶𝑜𝑟 = −160 dBc/Hz
ı Phase noise in the range of 4 dB to 12 dB above the hardware limit. A
measurement uncertainty of at least 2.5 dB is assumed.
ℒ𝐷𝑈𝑇 = −152 (±2.5) dBc/Hz , Δℒ𝐶𝑜𝑟 = −160 dBc/Hz
Traceability
01 Rohde & Schwarz Measurement Uncertainty Analysis and Traceability for Phase Noise
25
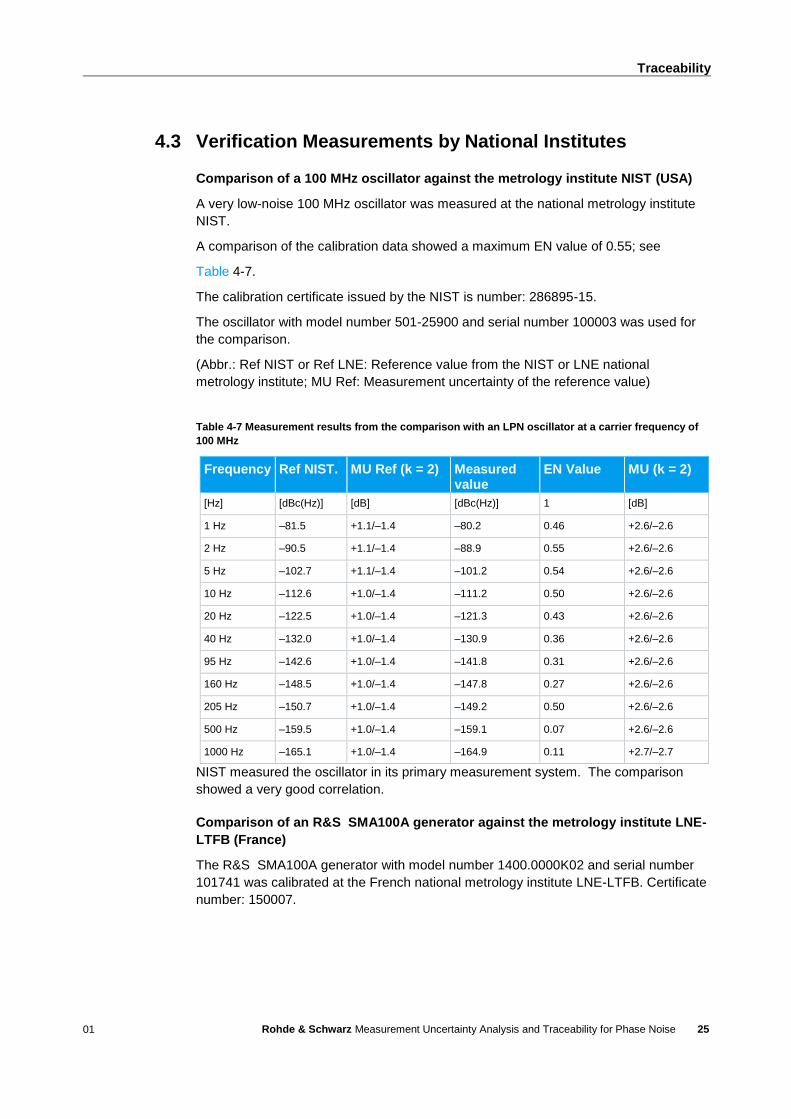
4.3 Verification Measurements by National Institutes
Comparison of a 100 MHz oscillator against the metrology institute NIST (USA)
A very low-noise 100 MHz oscillator was measured at the national metrology institute
NIST.
A comparison of the calibration data showed a maximum EN value of 0.55; see
Table 4-7.
The calibration certificate issued by the NIST is number: 286895-15.
The oscillator with model number 501-25900 and serial number 100003 was used for
the comparison.
(Abbr.: Ref NIST or Ref LNE: Reference value from the NIST or LNE national
metrology institute; MU Ref: Measurement uncertainty of the reference value)
Table 4-7 Measurement results from the comparison with an LPN oscillator at a carrier frequency of
100 MHz
Frequency Ref NIST. MU Ref (k = 2) Measured value
EN Value MU (k = 2)
[Hz] [dBc(Hz)] [dB] [dBc(Hz)] 1 [dB]
1 Hz –81.5 +1.1/–1.4 –80.2 0.46 +2.6/–2.6
2 Hz –90.5 +1.1/–1.4 –88.9 0.55 +2.6/–2.6
5 Hz –102.7 +1.1/–1.4 –101.2 0.54 +2.6/–2.6
10 Hz –112.6 +1.0/–1.4 –111.2 0.50 +2.6/–2.6
20 Hz –122.5 +1.0/–1.4 –121.3 0.43 +2.6/–2.6
40 Hz –132.0 +1.0/–1.4 –130.9 0.36 +2.6/–2.6
95 Hz –142.6 +1.0/–1.4 –141.8 0.31 +2.6/–2.6
160 Hz –148.5 +1.0/–1.4 –147.8 0.27 +2.6/–2.6
205 Hz –150.7 +1.0/–1.4 –149.2 0.50 +2.6/–2.6
500 Hz –159.5 +1.0/–1.4 –159.1 0.07 +2.6/–2.6
1000 Hz –165.1 +1.0/–1.4 –164.9 0.11 +2.7/–2.7
NIST measured the oscillator in its primary measurement system. The comparison
showed a very good correlation.
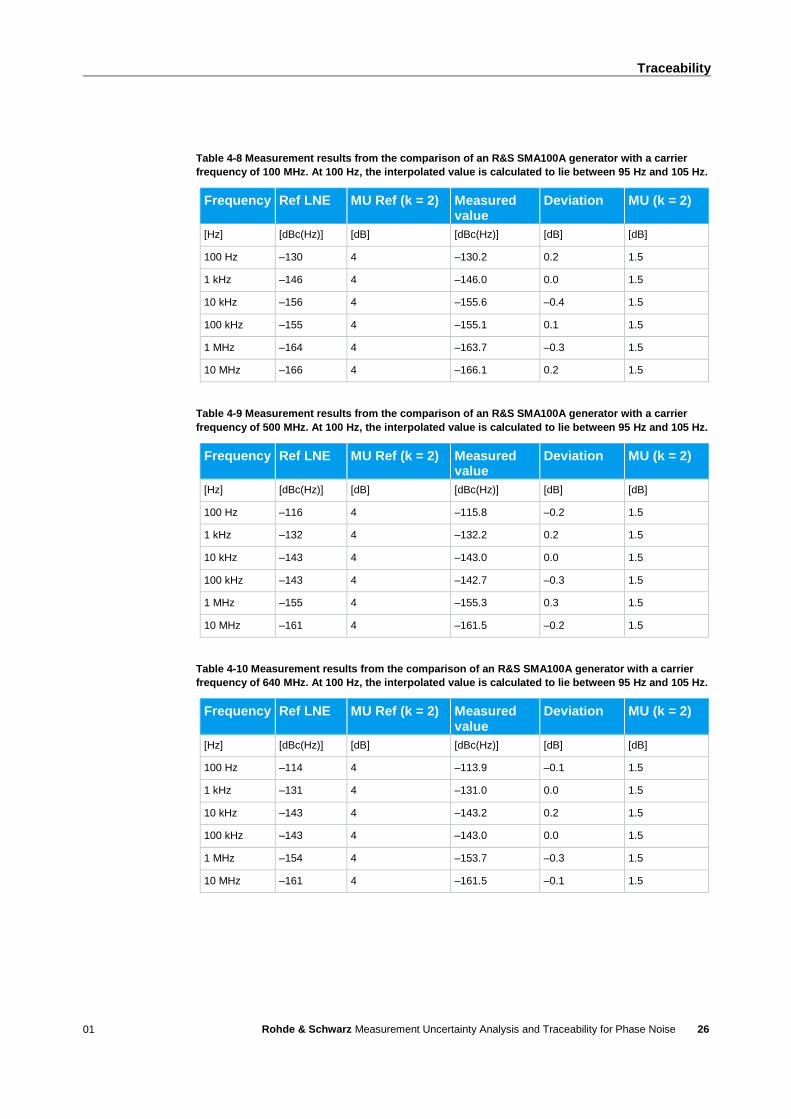
Comparison of an R&S SMA100A generator against the metrology institute LNE-
LTFB (France)
The R&S SMA100A generator with model number 1400.0000K02 and serial number
101741 was calibrated at the French national metrology institute LNE-LTFB. Certificate
number: 150007.
Traceability
01 Rohde & Schwarz Measurement Uncertainty Analysis and Traceability for Phase Noise
26
Table 4-8 Measurement results from the comparison of an R&S SMA100A generator with a carrier
frequency of 100 MHz. At 100 Hz, the interpolated value is calculated to lie between 95 Hz and 105 Hz.
Frequency Ref LNE MU Ref (k = 2) Measured value
Deviation MU (k = 2)
[Hz] [dBc(Hz)] [dB] [dBc(Hz)] [dB] [dB]
100 Hz –130 4 –130.2 0.2 1.5
1 kHz –146 4 –146.0 0.0 1.5
10 kHz –156 4 –155.6 –0.4 1.5
100 kHz –155 4 –155.1 0.1 1.5
1 MHz –164 4 –163.7 –0.3 1.5
10 MHz –166 4 –166.1 0.2 1.5
Table 4-9 Measurement results from the comparison of an R&S SMA100A generator with a carrier
frequency of 500 MHz. At 100 Hz, the interpolated value is calculated to lie between 95 Hz and 105 Hz.
Frequency Ref LNE MU Ref (k = 2) Measured value
Deviation MU (k = 2)
[Hz] [dBc(Hz)] [dB] [dBc(Hz)] [dB] [dB]
100 Hz –116 4 –115.8 –0.2 1.5
1 kHz –132 4 –132.2 0.2 1.5
10 kHz –143 4 –143.0 0.0 1.5
100 kHz –143 4 –142.7 –0.3 1.5
1 MHz –155 4 –155.3 0.3 1.5
10 MHz –161 4 –161.5 –0.2 1.5
Table 4-10 Measurement results from the comparison of an R&S SMA100A generator with a carrier
frequency of 640 MHz. At 100 Hz, the interpolated value is calculated to lie between 95 Hz and 105 Hz.
Frequency Ref LNE MU Ref (k = 2) Measured value
Deviation MU (k = 2)
[Hz] [dBc(Hz)] [dB] [dBc(Hz)] [dB] [dB]
100 Hz –114 4 –113.9 –0.1 1.5
1 kHz –131 4 –131.0 0.0 1.5
10 kHz –143 4 –143.2 0.2 1.5
100 kHz –143 4 –143.0 0.0 1.5
1 MHz –154 4 –153.7 –0.3 1.5
10 MHz –161 4 –161.5 –0.1 1.5
Traceability
01 Rohde & Schwarz Measurement Uncertainty Analysis and Traceability for Phase Noise
27
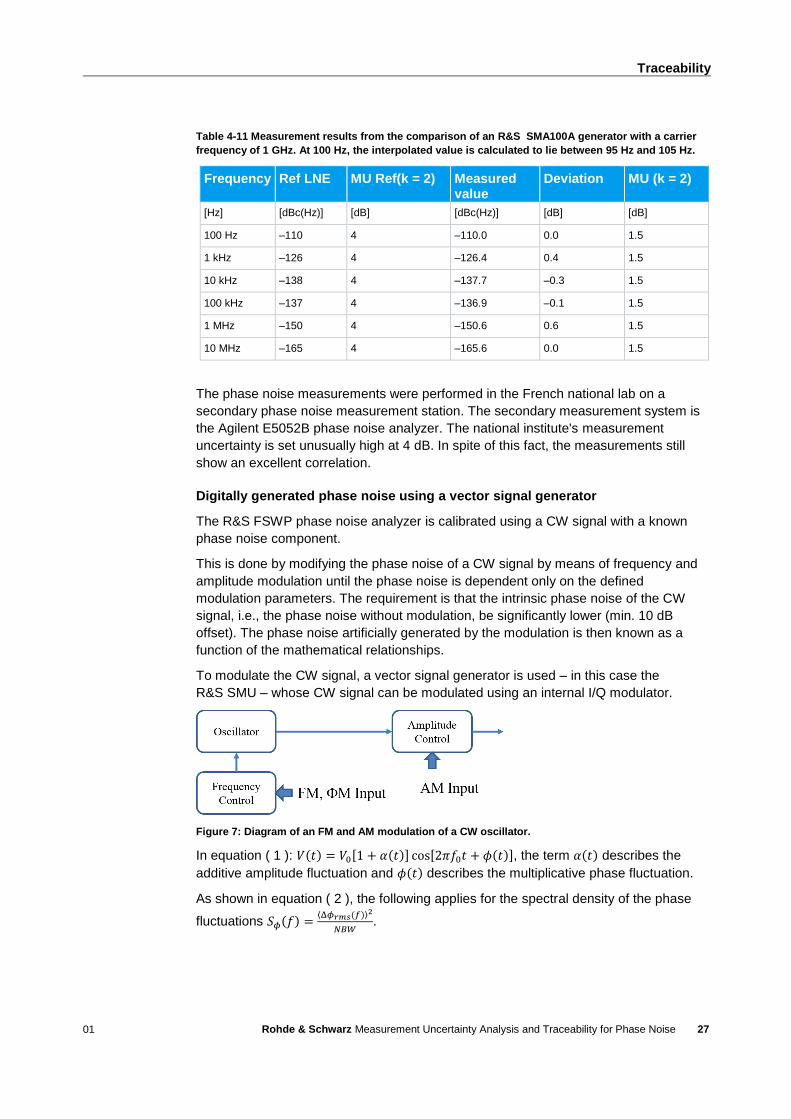
Table 4-11 Measurement results from the comparison of an R&S SMA100A generator with a carrier
frequency of 1 GHz. At 100 Hz, the interpolated value is calculated to lie between 95 Hz and 105 Hz.
Frequency Ref LNE MU Ref(k = 2) Measured value
Deviation MU (k = 2)
[Hz] [dBc(Hz)] [dB] [dBc(Hz)] [dB] [dB]
100 Hz –110 4 –110.0 0.0 1.5
1 kHz –126 4 –126.4 0.4 1.5
10 kHz –138 4 –137.7 –0.3 1.5
100 kHz –137 4 –136.9 –0.1 1.5
1 MHz –150 4 –150.6 0.6 1.5
10 MHz –165 4 –165.6 0.0 1.5
The phase noise measurements were performed in the French national lab on a
secondary phase noise measurement station. The secondary measurement system is
the Agilent E5052B phase noise analyzer. The national institute's measurement
uncertainty is set unusually high at 4 dB. In spite of this fact, the measurements still
show an excellent correlation.
Digitally generated phase noise using a vector signal generator
The R&S FSWP phase noise analyzer is calibrated using a CW signal with a known
phase noise component.
This is done by modifying the phase noise of a CW signal by means of frequency and
amplitude modulation until the phase noise is dependent only on the defined
modulation parameters. The requirement is that the intrinsic phase noise of the CW
signal, i.e., the phase noise without modulation, be significantly lower (min. 10 dB
offset). The phase noise artificially generated by the modulation is then known as a
function of the mathematical relationships.
To modulate the CW signal, a vector signal generator is used – in this case the
R&S SMU – whose CW signal can be modulated using an internal I/Q modulator.
Figure 7: Diagram of an FM and AM modulation of a CW oscillator.
In equation ( 1 ): 𝑉(𝑡) = 𝑉0[1 + 𝛼(𝑡)] cos[2𝜋𝑓0𝑡 + 𝜙(𝑡)], the term 𝛼(𝑡) describes the
additive amplitude fluctuation and 𝜙(𝑡) describes the multiplicative phase fluctuation.
As shown in equation ( 2 ), the following applies for the spectral density of the phase
fluctuations 𝑆𝜙(𝑓) =⟨Δ𝜙𝑟𝑚𝑠(𝑓)⟩2
𝑁𝐵𝑊.
Traceability
01 Rohde & Schwarz Measurement Uncertainty Analysis and Traceability for Phase Noise
28
From this, the ratio Δ𝑓 =𝑓(𝑡)−𝑓0
𝑓0=
1
2𝜋𝑓0
𝑑
𝑑𝑡𝜙 can be used to specify the spectral density
of the frequency fluctuations:
SΔf(f) =⟨Δf(f)⟩2
NBW= (
1
2πf0)
2
∙ (2πf)2 ∙ Sϕ(f) = (f
f0)
2
Sϕ(f) (26)
𝑆𝜙(𝑓) = (𝑓0
𝑓)
2
∙⟨Δ𝑓(𝑓)⟩2
𝑁𝐵𝑊
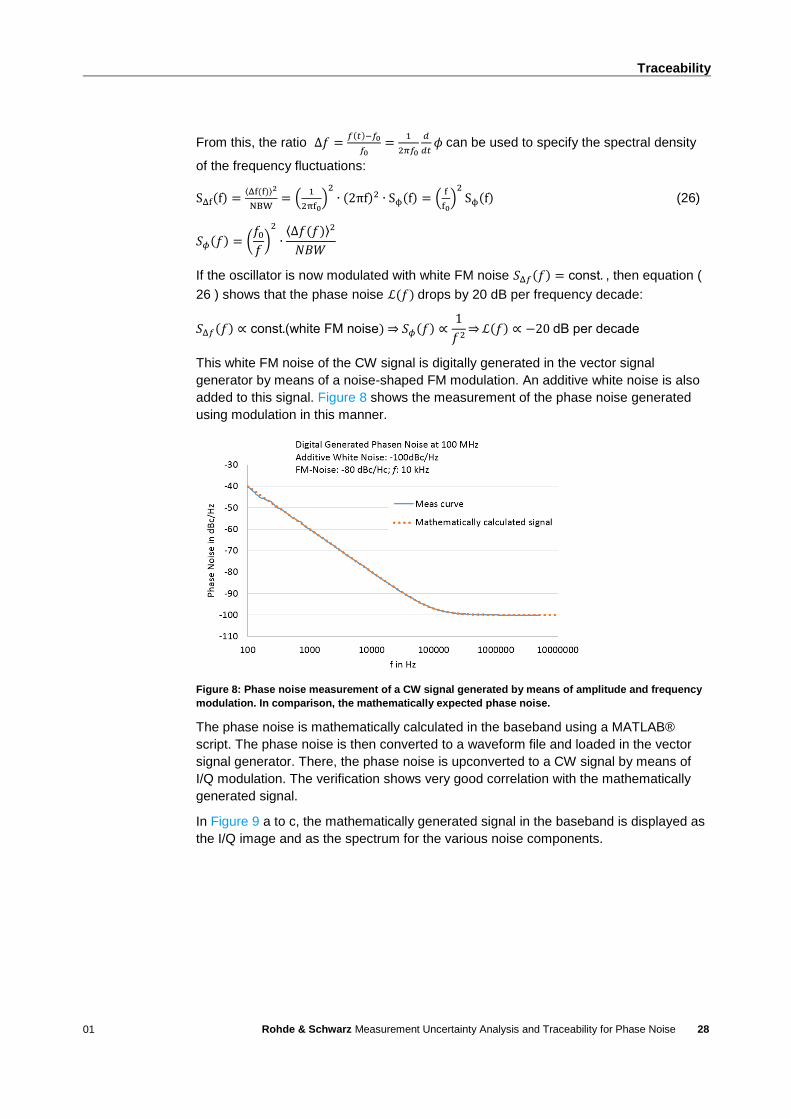
If the oscillator is now modulated with white FM noise 𝑆Δ𝑓(𝑓) = const. , then equation (
26 ) shows that the phase noise ℒ(𝑓) drops by 20 dB per frequency decade:
𝑆Δ𝑓(𝑓) ∝ const.(white FM noise) ⇒ 𝑆𝜙(𝑓) ∝1
𝑓2⇒ ℒ(𝑓) ∝ −20 dB per decade
This white FM noise of the CW signal is digitally generated in the vector signal
generator by means of a noise-shaped FM modulation. An additive white noise is also
added to this signal. Figure 8 shows the measurement of the phase noise generated
using modulation in this manner.
Figure 8: Phase noise measurement of a CW signal generated by means of amplitude and frequency
modulation. In comparison, the mathematically expected phase noise.
The phase noise is mathematically calculated in the baseband using a MATLAB®
script. The phase noise is then converted to a waveform file and loaded in the vector
signal generator. There, the phase noise is upconverted to a CW signal by means of
I/Q modulation. The verification shows very good correlation with the mathematically
generated signal.
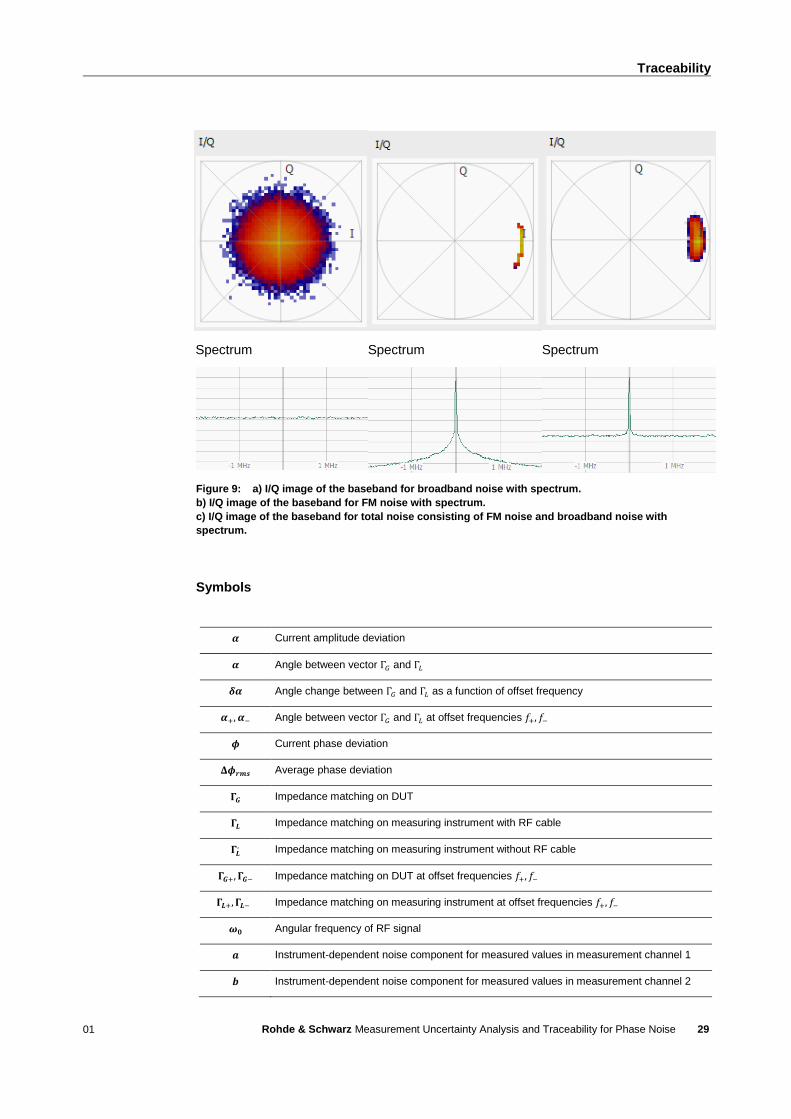
In Figure 9 a to c, the mathematically generated signal in the baseband is displayed as
the I/Q image and as the spectrum for the various noise components.
Traceability
01 Rohde & Schwarz Measurement Uncertainty Analysis and Traceability for Phase Noise
29
Spectrum Spectrum Spectrum
Figure 9: a) I/Q image of the baseband for broadband noise with spectrum.
b) I/Q image of the baseband for FM noise with spectrum.
c) I/Q image of the baseband for total noise consisting of FM noise and broadband noise with
spectrum.
Symbols
𝜶 Current amplitude deviation
𝜶 Angle between vector Γ𝐺 and Γ𝐿
𝜹𝜶 Angle change between Γ𝐺 and Γ𝐿 as a function of offset frequency
𝜶+, 𝜶− Angle between vector Γ𝐺 and Γ𝐿 at offset frequencies 𝑓+, 𝑓−
𝝓 Current phase deviation
𝚫𝝓𝒓𝒎𝒔 Average phase deviation
𝚪𝑮 Impedance matching on DUT
𝚪𝑳 Impedance matching on measuring instrument with RF cable
𝚪𝑳, Impedance matching on measuring instrument without RF cable
𝚪𝑮+, 𝚪𝑮− Impedance matching on DUT at offset frequencies 𝑓+, 𝑓−
𝚪𝑳+, 𝚪𝑳− Impedance matching on measuring instrument at offset frequencies 𝑓+, 𝑓−
𝝎𝟎 Angular frequency of RF signal
𝒂 Instrument-dependent noise component for measured values in measurement channel 1
𝒃 Instrument-dependent noise component for measured values in measurement channel 2
Traceability
01 Rohde & Schwarz Measurement Uncertainty Analysis and Traceability for Phase Noise
30
𝒄 DUT-dependent noise component for reading in measurement channels 1 and 2
𝒙 Measured value in measurement channel 1
𝒚 Measured value in measurement channel 2
𝐀𝐌 Amplitude modulation
𝑨, 𝑩, 𝑪 Fourier transform of 𝑎, 𝑏, 𝑐
𝒇𝟎 Carrier frequency
𝒇 Offset frequency
𝜹𝒇 Normalized frequency fluctuation
𝜹𝑭 Influence of impedance mismatch between DUT and measuring instrument
𝑭𝑴 Frequency modulation
𝜱𝑴 Phase modulation
𝓛 Phase noise expressed in dBc/Hz
𝓛𝑹𝒆𝒂𝒅 Displayed reading
𝓛𝑹𝒆𝒂𝒅𝒎 Displayed measured value with number of correlations 𝑚
𝓛𝑫𝑼𝑻 Phase noise of the DUT
𝓛𝑹𝒆𝒇𝟏 Phase noise of the measuring instrument with number of correlations 𝑚 = 1
𝓛𝑹𝒆𝒇𝒎 Phase noise from the measuring instrument with number of correlations 𝑚
𝚫𝓛𝑪𝒐𝒓 Measuring instrument-dependent correlated noise in both channels, hardware limit
𝚫𝓛𝑺𝑵𝑹 Noise level correction with cross-correlation
𝚫𝓛𝑺𝒑 Unwanted interference signals
𝜹𝓛𝑭𝑹 Influence of the frequency characteristics of the measuring instrument
𝜹𝓛𝑳𝒊𝒏 Influence of linearity
𝜹𝓛𝑹𝒆𝒑 Influence of short-term repeatability
𝜹𝓛𝑪𝒐𝒓 Influence of the hardware limit (correlated noise level)
𝜹𝓛𝑩𝑾 Influence of selected filter bandwidth
𝜹𝓛𝑨𝒕𝒕 Influence of an attenuator pad
𝜹𝓛𝒅𝒆𝒈 Influence of small-angle approximation
𝒎 Number of correlations
𝑵𝑩𝑾 Square-wave bandwidth (noise bandwidth)
𝒓𝑮, 𝒓𝑮+, 𝒓𝑮− DUT reflection as a function of the frequency 𝑓
𝒓𝑳, 𝒓𝑳+, 𝒓𝑳− Measuring instrument reflection as a function of frequency 𝑓
𝑺𝒄𝒄 Measured phase noise with correlation method expressed in rad2/Hz
𝑺𝝓 Spectral density of phase noise expressed in rad2/Hz
Traceability
01 Rohde & Schwarz Measurement Uncertainty Analysis and Traceability for Phase Noise
31
𝑺𝒇 Spectral density of frequency noise expressed in 1/Hz
𝑺𝟏𝟏, 𝑺𝟐𝟏 S-parameters for the RF cable
𝒕 Time
𝑻 Measurement time
𝑽𝟎 Amplitude of the RF signal
𝑽 RF signal amplitude as a function of time
𝒙, 𝒚 Measured value in measurement channel 1 or 2
𝑿, 𝒀 Fourier transform of 𝑋, 𝑌
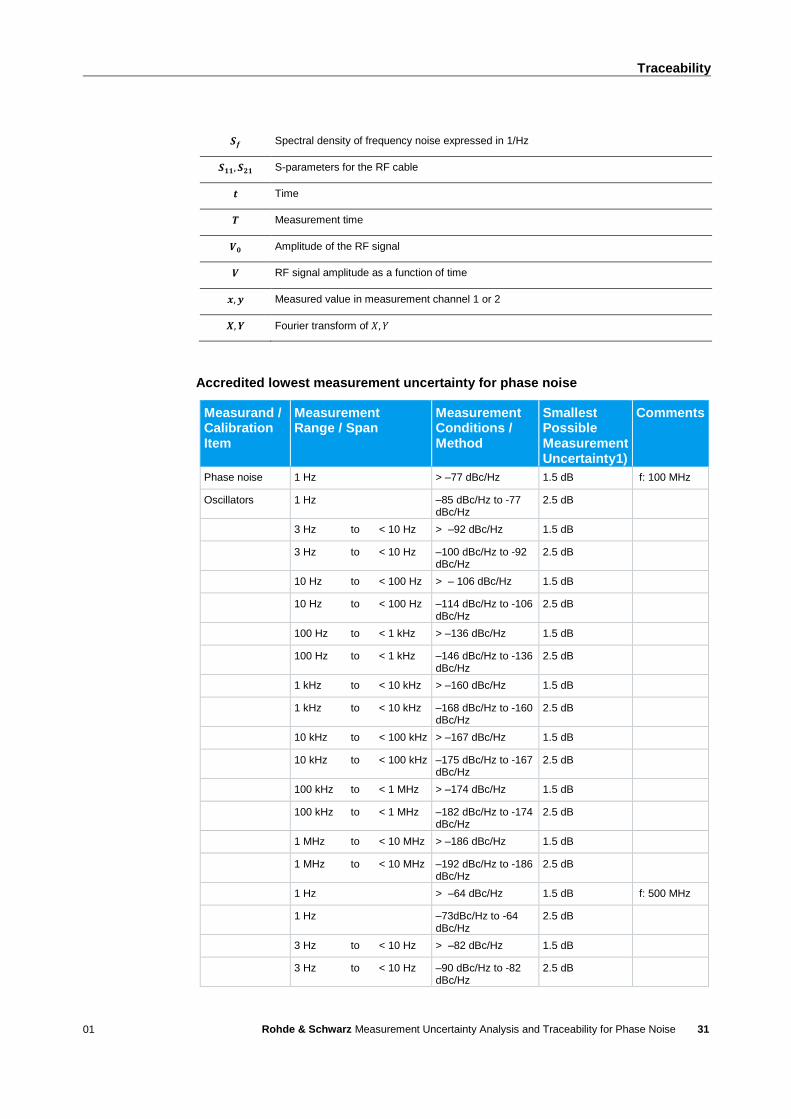
Accredited lowest measurement uncertainty for phase noise
Measurand / Calibration Item
Measurement Range / Span
Measurement Conditions / Method
Smallest Possible Measurement Uncertainty1)
Comments
Phase noise 1 Hz > –77 dBc/Hz 1.5 dB f: 100 MHz
Oscillators 1 Hz –85 dBc/Hz to -77 dBc/Hz
2.5 dB
3 Hz to < 10 Hz > –92 dBc/Hz 1.5 dB
3 Hz to < 10 Hz –100 dBc/Hz to -92 dBc/Hz
2.5 dB
10 Hz to < 100 Hz > – 106 dBc/Hz 1.5 dB
10 Hz to < 100 Hz –114 dBc/Hz to -106 dBc/Hz
2.5 dB
100 Hz to < 1 kHz > –136 dBc/Hz 1.5 dB
100 Hz to < 1 kHz –146 dBc/Hz to -136 dBc/Hz
2.5 dB
1 kHz to < 10 kHz > –160 dBc/Hz 1.5 dB
1 kHz to < 10 kHz –168 dBc/Hz to -160 dBc/Hz
2.5 dB
10 kHz to < 100 kHz > –167 dBc/Hz 1.5 dB
10 kHz to < 100 kHz –175 dBc/Hz to -167 dBc/Hz
2.5 dB
100 kHz to < 1 MHz > –174 dBc/Hz 1.5 dB
100 kHz to < 1 MHz –182 dBc/Hz to -174 dBc/Hz
2.5 dB
1 MHz to < 10 MHz > –186 dBc/Hz 1.5 dB
1 MHz to < 10 MHz –192 dBc/Hz to -186 dBc/Hz
2.5 dB
1 Hz > –64 dBc/Hz 1.5 dB f: 500 MHz
1 Hz –73dBc/Hz to -64 dBc/Hz
2.5 dB
3 Hz to < 10 Hz > –82 dBc/Hz 1.5 dB
3 Hz to < 10 Hz –90 dBc/Hz to -82 dBc/Hz
2.5 dB
Traceability
01 Rohde & Schwarz Measurement Uncertainty Analysis and Traceability for Phase Noise
32
Measurand / Calibration Item
Measurement Range / Span
Measurement Conditions / Method
Smallest Possible Measurement Uncertainty1)
Comments
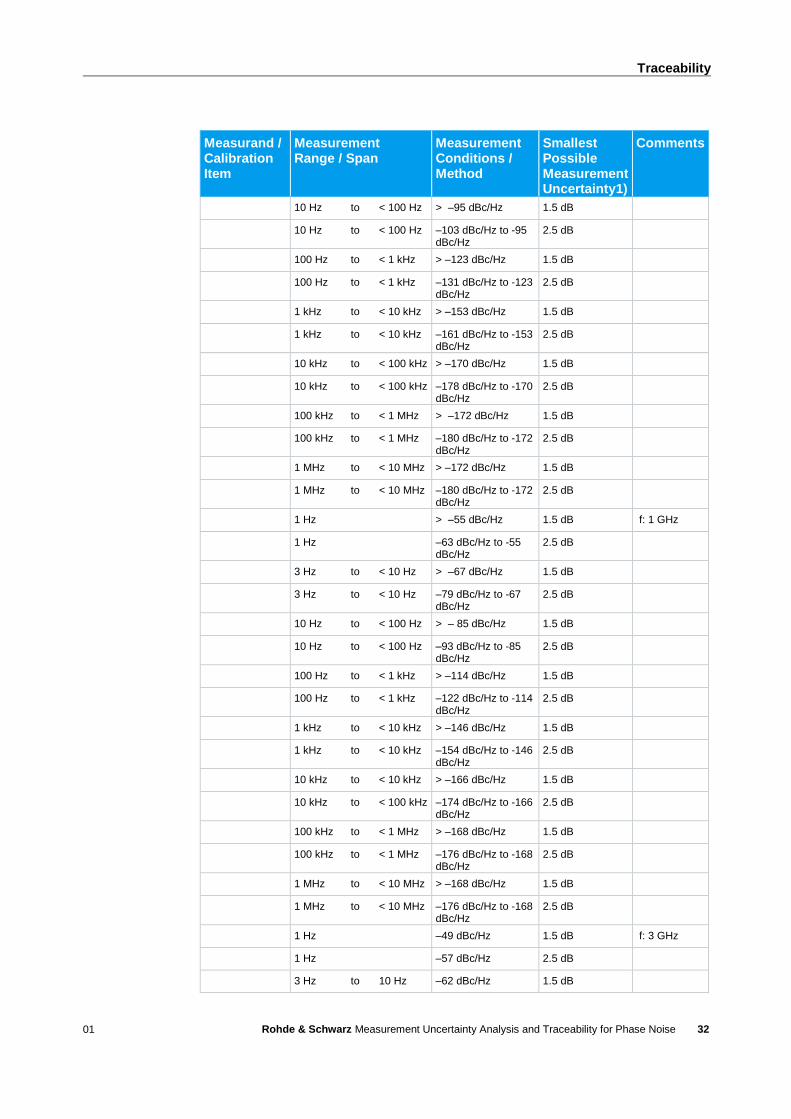
10 Hz to < 100 Hz > –95 dBc/Hz 1.5 dB
10 Hz to < 100 Hz –103 dBc/Hz to -95 dBc/Hz
2.5 dB
100 Hz to < 1 kHz > –123 dBc/Hz 1.5 dB
100 Hz to < 1 kHz –131 dBc/Hz to -123 dBc/Hz
2.5 dB
1 kHz to < 10 kHz > –153 dBc/Hz 1.5 dB
1 kHz to < 10 kHz –161 dBc/Hz to -153 dBc/Hz
2.5 dB
10 kHz to < 100 kHz > –170 dBc/Hz 1.5 dB
10 kHz to < 100 kHz –178 dBc/Hz to -170 dBc/Hz
2.5 dB
100 kHz to < 1 MHz > –172 dBc/Hz 1.5 dB
100 kHz to < 1 MHz –180 dBc/Hz to -172 dBc/Hz
2.5 dB
1 MHz to < 10 MHz > –172 dBc/Hz 1.5 dB
1 MHz to < 10 MHz –180 dBc/Hz to -172 dBc/Hz
2.5 dB
1 Hz > –55 dBc/Hz 1.5 dB f: 1 GHz
1 Hz –63 dBc/Hz to -55 dBc/Hz
2.5 dB
3 Hz to < 10 Hz > –67 dBc/Hz 1.5 dB
3 Hz to < 10 Hz –79 dBc/Hz to -67 dBc/Hz
2.5 dB
10 Hz to < 100 Hz > – 85 dBc/Hz 1.5 dB
10 Hz to < 100 Hz –93 dBc/Hz to -85 dBc/Hz
2.5 dB
100 Hz to < 1 kHz > –114 dBc/Hz 1.5 dB
100 Hz to < 1 kHz –122 dBc/Hz to -114 dBc/Hz
2.5 dB
1 kHz to < 10 kHz > –146 dBc/Hz 1.5 dB
1 kHz to < 10 kHz –154 dBc/Hz to -146 dBc/Hz
2.5 dB
10 kHz to < 10 kHz > –166 dBc/Hz 1.5 dB
10 kHz to < 100 kHz –174 dBc/Hz to -166 dBc/Hz
2.5 dB
100 kHz to < 1 MHz > –168 dBc/Hz 1.5 dB
100 kHz to < 1 MHz –176 dBc/Hz to -168 dBc/Hz
2.5 dB
1 MHz to < 10 MHz > –168 dBc/Hz 1.5 dB
1 MHz to < 10 MHz –176 dBc/Hz to -168 dBc/Hz
2.5 dB
1 Hz –49 dBc/Hz 1.5 dB f: 3 GHz
1 Hz –57 dBc/Hz 2.5 dB
3 Hz to 10 Hz –62 dBc/Hz 1.5 dB

Traceability
01 Rohde & Schwarz Measurement Uncertainty Analysis and Traceability for Phase Noise
33
Measurand / Calibration Item
Measurement Range / Span
Measurement Conditions / Method
Smallest Possible Measurement Uncertainty1)
Comments
3 Hz to 10 Hz –70 dBc/Hz 2.5 dB
10 Hz to 100 Hz –76 dBc/Hz 1.5 dB
10 Hz to 100 Hz –84 dBc/Hz 2.5 dB
100 Hz to 1 kHz –105 dBc/Hz 1.5 dB
100 Hz to 1 kHz –113 dBc/Hz 2.5 dB
1 kHz to 10 kHz –138 dBc/Hz 1.5 dB
1 kHz to 10 kHz –146 dBc/Hz 2.5 dB
10 kHz to 100 kHz –156 dBc/Hz 1.5 dB
10 kHz to 100 kHz –164 dBc/Hz 2.5 dB
100 kHz to 1 MHz –158 dBc/Hz 1.5 dB
100 kHz to 1 MHz –166 dBc/Hz 2.5 dB
1 MHz to 10 MHz –158 dBc/Hz 1.5 dB
1 MHz to 10 MHz –166 dBc/Hz 2.5 dB
1 Hz –38 dBc/Hz 1.5 dB f: 8 GHz
1 Hz –46 dBc/Hz 2.5 dB
3 Hz to 10 Hz –54 dBc/Hz 1.5 dB
3 Hz to 10 Hz –62 dBc/Hz 2.5 dB
10 Hz to 100 Hz –68 dBc/Hz 1.5 dB
10 Hz to 100 Hz –76 dBc/Hz 2.5 dB
100 Hz to 1 kHz –95 dBc/Hz 1.5 dB
100 Hz to 1 kHz –103 dBc/Hz 2.5 dB
1 kHz to 10 kHz –122 dBc/Hz 1.5 dB
1 kHz to 10 kHz –130 dBc/Hz 2.5 dB
10 kHz to 100 kHz –138 dBc/Hz 1.5 dB
10 kHz to 100 kHz –146 dBc/Hz 2.5 dB
100 kHz to 1 MHz –142 dBc/Hz 1.5 dB
100 kHz to 1 MHz –150 dBc/Hz 2.5 dB
1 MHz to 10 MHz –142 dBc/Hz 1.5 dB
1 MHz to 10 MHz –150 dBc/Hz 2.5 dB
References
01 Rohde & Schwarz Measurement Uncertainty Analysis and Traceability for Phase Noise
34
5 References
[1] A.L. Lance, W.D. Seal and F. Labaar, Phase Noise and AM Noise Measurements
in the Frequency Domain, NIST Publication TN-190, Chapter 7, pp. 255, 1984.
web page HYPERLINK "http://tf.nist.gov/general/tn1337/Tn190.pdf"
http://tf.nist.gov/general/tn1337/Tn190.pdf
[2] A. Hati, C.W. Nelson, N. Ashby, and D.A. Howes. Calibration uncertainty for the
NIT PM/AM noise standards, NIST Special Publication 250-90 July 2012. web
page http://www.nist.gov/calibrations/upload/SP250.pdf
[3] E. Rubiola. Primary Calibration of AM and PM Noise Measurements, January
2009. arXiv:0901.1073v [physics.ins-det]. web page http://www.rubiola.org
[4] E. Rubiola and F. Vernotte. The cross-spectrum experimental method, February
2010. arXiv:1003.0113
[5] C.W. Nelson, A. Hati and D.A. Howe. Phase inversion and collapse of cross-
spectral function, Electronic Letters, Vol.49, No. 25, pp. 1640-1641, Dec. 2013.
web page http://arxiv.org/ftp/arxiv/papers/1307/1307.6605.pdf
[6] J. R. Vig (chair.). IEEE Standard Definitions of Physical Quantities for
Fundamental Frequency and Time Metrology-Random Instabilities (IEEE
Standard 1139-1999). IEEE, New York, 1999
Ordering Information
01 Rohde & Schwarz Measurement Uncertainty Analysis and Traceability for Phase Noise
35
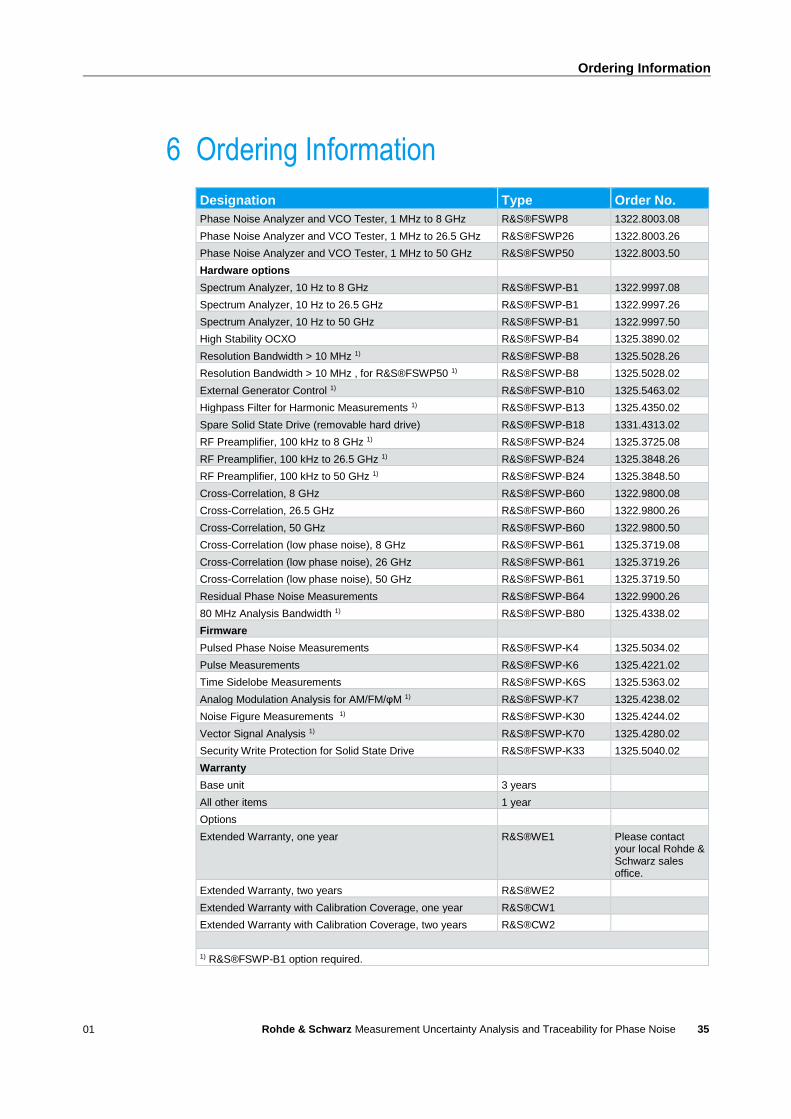
6 Ordering Information
Designation Type Order No.
Phase Noise Analyzer and VCO Tester, 1 MHz to 8 GHz R&S®FSWP8 1322.8003.08
Phase Noise Analyzer and VCO Tester, 1 MHz to 26.5 GHz R&S®FSWP26 1322.8003.26
Phase Noise Analyzer and VCO Tester, 1 MHz to 50 GHz R&S®FSWP50 1322.8003.50
Hardware options
Spectrum Analyzer, 10 Hz to 8 GHz R&S®FSWP-B1 1322.9997.08
Spectrum Analyzer, 10 Hz to 26.5 GHz R&S®FSWP-B1 1322.9997.26
Spectrum Analyzer, 10 Hz to 50 GHz R&S®FSWP-B1 1322.9997.50
High Stability OCXO R&S®FSWP-B4 1325.3890.02
Resolution Bandwidth > 10 MHz 1) R&S®FSWP-B8 1325.5028.26
Resolution Bandwidth > 10 MHz , for R&S®FSWP50 1) R&S®FSWP-B8 1325.5028.02
External Generator Control 1) R&S®FSWP-B10 1325.5463.02
Highpass Filter for Harmonic Measurements 1) R&S®FSWP-B13 1325.4350.02
Spare Solid State Drive (removable hard drive) R&S®FSWP-B18 1331.4313.02
RF Preamplifier, 100 kHz to 8 GHz 1) R&S®FSWP-B24 1325.3725.08
RF Preamplifier, 100 kHz to 26.5 GHz 1) R&S®FSWP-B24 1325.3848.26
RF Preamplifier, 100 kHz to 50 GHz 1) R&S®FSWP-B24 1325.3848.50
Cross-Correlation, 8 GHz R&S®FSWP-B60 1322.9800.08
Cross-Correlation, 26.5 GHz R&S®FSWP-B60 1322.9800.26
Cross-Correlation, 50 GHz R&S®FSWP-B60 1322.9800.50
Cross-Correlation (low phase noise), 8 GHz R&S®FSWP-B61 1325.3719.08
Cross-Correlation (low phase noise), 26 GHz R&S®FSWP-B61 1325.3719.26
Cross-Correlation (low phase noise), 50 GHz R&S®FSWP-B61 1325.3719.50
Residual Phase Noise Measurements R&S®FSWP-B64 1322.9900.26
80 MHz Analysis Bandwidth 1) R&S®FSWP-B80 1325.4338.02
Firmware
Pulsed Phase Noise Measurements R&S®FSWP-K4 1325.5034.02
Pulse Measurements R&S®FSWP-K6 1325.4221.02
Time Sidelobe Measurements R&S®FSWP-K6S 1325.5363.02
Analog Modulation Analysis for AM/FM/φM 1) R&S®FSWP-K7 1325.4238.02
Noise Figure Measurements 1) R&S®FSWP-K30 1325.4244.02
Vector Signal Analysis 1) R&S®FSWP-K70 1325.4280.02
Security Write Protection for Solid State Drive R&S®FSWP-K33 1325.5040.02
Warranty
Base unit 3 years
All other items 1 year
Options
Extended Warranty, one year R&S®WE1 Please contact your local Rohde & Schwarz sales office.
Extended Warranty, two years R&S®WE2
Extended Warranty with Calibration Coverage, one year R&S®CW1
Extended Warranty with Calibration Coverage, two years R&S®CW2
1) R&S®FSWP-B1 option required.
01 Rohde & Schwarz Measurement Uncertainty Analysis and Traceability for Phase Noise
36
Rohde & Schwarz
The Rohde & Schwarz electronics group offers
innovative solutions in the following business fields:
test and measurement, broadcast and media, secure
communications, cybersecurity, radiomonitoring and
radiolocation. Founded more than 80 years ago, this
independent company has an extensive sales and
service network and is present in more than 70
countries.
The electronics group is among the world market
leaders in its established business fields. The
company is headquartered in Munich, Germany. It
also has regional headquarters in Singapore and
Columbia, Maryland, USA, to manage its operations
in these regions.
Regional contact
Europe, Africa, Middle East +49 89 4129 12345 [email protected] North America 1 888 TEST RSA (1 888 837 87 72) [email protected] Latin America +1 410 910 79 88 [email protected] Asia Pacific +65 65 13 04 88 [email protected]
China +86 800 810 82 28 |+86 400 650 58 96 [email protected]
Sustainable product design
ı Environmental compatibility and eco-footprint
ı Energy efficiency and low emissions
ı Longevity and optimized total cost of ownership
This white paper and the supplied programs may
only be used subject to the conditions of use set
forth in the download area of the Rohde & Schwarz
website.
R&S® is a registered trademark of Rohde & Schwarz GmbH & Co.
KG; Trade names are trademarks of the owners.
Rohde & Schwarz GmbH & Co. KG
Mühldorfstraße 15 | 81671 Munich, Germany
Phone + 49 89 4129 - 0 | Fax + 49 89 4129 – 13777
www.rohde-schwarz.com
PA
D-T
-M: 3573.7
380.0
2/0
2.0
5/E
N/