Embed Size (px)
Citation preview
TeamSTEPPS® 2.0 AU
Measurement Toolkit
page 2 TeamSTEPPS® 2.0 AU Measurement Toolkit CONTENTS
ACKNOWLEDGEMENTS SA Health acknowledges the generosity of the USA Agency for Healthcare Research and Quality (AHRQ) and the USA Department of Defence (DOD) in permitting the use of TeamSTEPPS® program materials in Australia.
TeamSTEPPS® 2.0 AU Measurement Toolkit, e-learning courses and associated materials have been developed by the SA Health Clinical Leadership and Team Effectiveness team* in collaboration with the Women’s and
Children’s Health Network Digital Media Team and are based on the TeamSTEPPS® 2.0 Fundamentals Course, Instructor’s Guides and associated materials.
Courses also draw on previous versions of TeamSTEPPS® materials developed in South Australia and include images and media contributed by a range of individuals and organisations.
TeamSTEPPS® 2.0 AU materials represent the combined efforts of many people whose contributions we respectfully and gratefully acknowledge.
Ms Kate Morefield, SA Health Project Officer, Education and Research Ms Nadine Gurney, Senior Administrative Officer, Clinical Leadership and Team Effectiveness * Ms Pauline Spence, Management Facilitator Team EffectivenessMs Heidi Silverston, Director - Clinical Leadership and Team EffectivenessMs Kat Hite, Management Facilitator Team EffectivenessMs Holly Fewsdale, Administrative Officer, Clinical Leadership and Team Effectiveness
Disclaimer The Measurement Toolkit contains links to a number of other web sites which are not under the control of the authors. These are included on the basis that they contain content that is relevant to the topic being discussed. These links are provided for information and assistance only.
Although the authors have prepared the information within this toolkit with all due care, they do not guarantee or represent that the information is free from errors or omission.
Apart for fair dealing for the purpose of private study, research critique or review as allowed under the Copyright Act, no part of the TeamSTEPPS® Programme or any of its supporting documentation may be reproduced (including without limitation placed in computer memory) or adapted without the copyright owners’ written permission.
Please contact [email protected] to report any broken links.
TeamSTEPPS® 2.0 AU Measurement Toolkit page 3 CONTENTSD
CONTENTS
Acknowledgements ............................................................................................................................................................. 2
Disclaimer .................................................................................................................................................................................................. 2
Contents .................................................................................................................................................................................. 3
Introduction ............................................................................................................................................................................ 5
Abbreviations ............................................................................................................................................................................................ 6
Symbols ...................................................................................................................................................................................................... 7
Safety Climate Survey ......................................................................................................................................................... 9
Team Performance Observation Tool ........................................................................................................................... 15
Safety and Quality of Care ............................................................................................................................................... 19
Run and control charts ...................................................................................................................................................... 21
ISBAR Audit ......................................................................................................................................................................... 23
Briefing Audit ...................................................................................................................................................................... 26
Shared decision making ................................................................................................................................................... 31
CollaboRATE ........................................................................................................................................................................................... 31
SDM-Q-9 ................................................................................................................................................................................................. 32
E-Learning Evaluation ....................................................................................................................................................... 33
Knowledge Test ................................................................................................................................................................. 35
Training documentation .................................................................................................................................................... 37

page 4 TeamSTEPPS® 2.0 AU Measurement Toolkit CONTENTSD
This page has been left intentionally blank
TeamSTEPPS® 2.0 AU Measurement Toolkit page 5 CONTENTS
INTRODUCTION The Measurement Toolkit is intended to assist staff involved with measuring the effectiveness of TeamSTEPPS® 2.0 AU in their healthcare organisation, by providing additional information about the measures referred to in the Measurement online course.
The toolkit describes the tools used for data collection, outlines when each measure should be taken, indicates the levels of evaluation that the measures address, and provides example tables and charts that can be used to present and report findings. Suggested resources were selected, where possible, from open access literature; articles requiring subscriptions can be sourced through organisational libraries using the citations provided.
Copies of the tools are included in the TeamSTEPPS® 2.0 AU Facilitation Guide.
The following TeamSTEPPS® 2.0 AU resources have been developed for use with the toolkit:
> Questionnaires for online administration via SurveyMonkey, and> Excel templates to facilitate data entry, analysis and presentation.
TeamSTEPPS® 2.0 AU measures offer significant value to health service organisations accredited through the Australian Health Service Safety and Quality Accreditation (AHSSQA Scheme.
Example areas in which TeamSTEPPS® 2.0 AU measures can contribute evidence for accreditation to the National Safety and Quality in Health Service (NSQHS Standards second edition) have been highlighted in this document, using relevant examples of evidence from AHSSQA implementation resources.
Many of the cited examples relate to audit results and observations. Audit results can include survey instruments, forms and tools used to collect audits; analysis of data collected; reports on audits conducted, and documents showing that audit results were benchmarked).
Documents pertaining to TeamSTEPPS® training can be used as evidence for Accreditation; these Actions are described in the Training documentation section of the toolkit.
Other ways in which TeamSTEPPS® measures can contribute to accreditation involve communicating findings to workforce, health service organisations and governance, and reporting to committees and meetings (these are not specifically described in the present document).
The structure of the toolkit relates to the phases of TeamSTEPPS® measurement. The tools introduced first are those employed before TeamSTEPPS® is implemented in the clinical area or organisation.

page 6 TeamSTEPPS® 2.0 AU Measurement Toolkit CONTENTS
Abbreviations
ACSQHC Australian Commission on Safety and Quality in Health Care
AHRQ Agency for Healthcare Research and Quality
CollaboRATE 3-item tool for assessing shared decision making
IHI Institute for Healthcare Improvement
ISBAR Identity, Situation, Background, Assessment, Recommendations (structured handover tool)
KT Knowledge Test
LINK Link to reference for which a subscription is required
OA LINK Open access reference link
NSQHS Standard National Safety and Quality Health Service Standards (second edition)
SCS Safety Climate Survey
SDM Shared decision making
SDM-Q-9 9-item questionnaire for assessing shared decision making
TeamSTEPPS® Team Strategies and Tools to Enhance Performance and Patient Safety. TeamSTEPPS® is a registered trademark (Registered with the US Patent and Trademark office)
TSQIT TeamSTEPPS® Quality Improvement Team
TPOT Team Performance Observation Tool
VMIA Victorian Managed Insurance Agency
WCHN Women’s and Children’s Health Network

TeamSTEPPS® 2.0 AU Measurement Toolkit page 7 CONTENTSD
Symbols
Information about when to undertake and repeat the measure.
Tool available for online administration via SurveyMonkey (requires a paid account).
Excel templates have been constructed to calculate scores and produce tables and charts for presenting data.
Coloured sections indicate the level(s) of evaluation addressed by the measure, using the Kirkpatrick model.1
National Safety and Quality Health Service Standards (second edition)
National Standard 1: Clinical Governance
National Standard 2: Partnering with Consumers
National Standard 3: Preventing and Controlling Healthcare-Associated Infection
National Standard 4: Medication Safety
National Standard 5: Comprehensive Care
National Standard 6: Communicating for Safety
National Standard 7: Blood Management
National Standard 8: Recognising and Responding to Acute Deterioration
References
1. Kirkpatrick DL & Kirkpatrick JD. 2007. Implementing the four levels. San Francisco, Berrett-Koehler.

page 8 TeamSTEPPS® 2.0 AU Measurement Toolkit CONTENTSD
This page has been left intentionally blank
TeamSTEPPS® 2.0 AU Measurement Toolkit page 9 CONTENTSD
SAFETY CLIMATE SURVEY The Safety Climate Survey1 (SCS) is an Australian adaptation of the Safety Attitudes Questionnaire (SAQ),2 a widely used and rigorously evaluated measure of safety culture.3 Modifications to the SAQ by the Victorian Managed Insurance Agency (VMIA) have improved the applicability of this tool across a range of Australian healthcare settings.
Action 1.1 Examples of evidence include workforce safety climate survey.
The Safety Climate Survey is used to assess safety culture before TeamSTEPPS® implementation; it is then readministered every 12 months
Safety culture exists within clinical areas, and data are reported in this way. Before surveying with SCS, it is necessary to decide how the staff in your organisation will be grouped into clinical areas – respondents will nominate their area of work from these given areas. Similarly, a list of professions that covers all staff members will be required.
The Safety Climate Survey has been made available for online administration via SurveyMonkey.
It is also necessary to determine how each member of staff will be given the opportunity to complete the online survey. Survey links can be sent to individuals via email, but for staff members who do not routinely use email, shared devices (such as PCs, laptops or tablets) should be made available.
To ensure that you receive as many responses as possible, keep the survey open for at least three weeks. Reminders to participate can also be used.
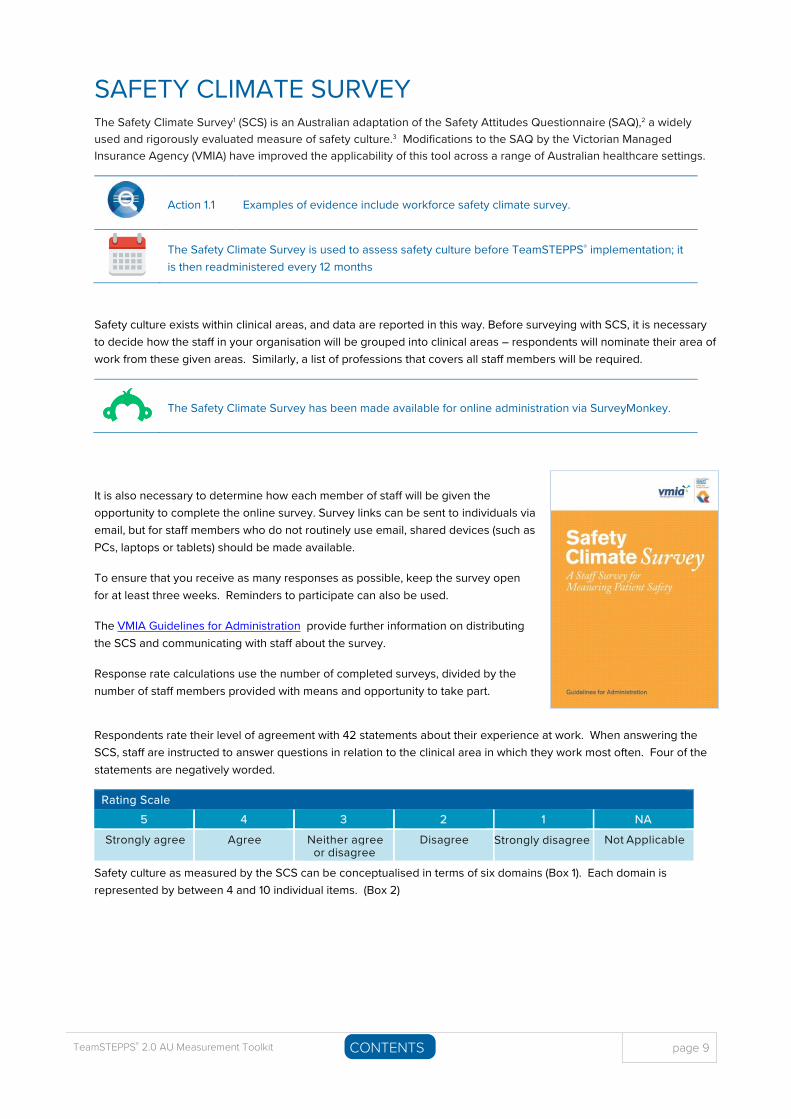
The VMIA Guidelines for Administration provide further information on distributing the SCS and communicating with staff about the survey.
Response rate calculations use the number of completed surveys, divided by the number of staff members provided with means and opportunity to take part.
Respondents rate their level of agreement with 42 statements about their experience at work. When answering the SCS, staff are instructed to answer questions in relation to the clinical area in which they work most often. Four of the statements are negatively worded.
Rating Scale 5 4 3 2 1 NA
Strongly agree Agree Neither agree or disagree
Disagree Strongly disagree Not Applicable
Safety culture as measured by the SCS can be conceptualised in terms of six domains (Box 1). Each domain is represented by between 4 and 10 individual items. (Box 2)

page 10 TeamSTEPPS® 2.0 AU Measurement Toolkit CONTENTSD
Box 1 | Safety culture domains
Domains Description
> Safety Climate> Teamwork Climate> Perceptions of Management> Working Conditions> Stress Recognition> Job Satisfaction
> Perceptions of a strong, proactive organisational commitment to safety.> Perceived quality of collaboration between personnel.> Approval of managerial action.> Perceived quality of the work environment and logistical support.> Acknowledgement of how performance is influenced by stressors.> Positivity about the work experience.
Box 2 | Safety culture domains and contributing items from the Safety Climate Survey
Domains Survey items
Safe
ty C
limat
e
> I would feel safe being treated here as a patient.> Errors are handled appropriately in my work area.> I receive appropriate feedback about my performance.> I am encouraged by my colleagues to report any patient safety concerns I may have.> The culture in my work area makes it easy to learn from the errors of others.> I know the proper channels to direct questions regarding patient safety.> My suggestions about safety would be acted upon if I expressed them to management.> This health service is doing more for patient safety now, than it did one year ago.> In my work area, it is difficult to discuss errors.reverse > Personnel frequently disregard rules or policies (e.g. treatment protocols/clinical pathways, sterile field, etc.)
that are established for my work area.reverse
Team
wor
k C
limat
e
> In my work area, it is difficult to speak up if I perceive a problem with patient care.reverse > I am frequently unable to express disagreement with doctors in this work area.reverse > Nurse input is well received in my work area.> Decision making in my work area frequently uses input from relevant personnel.> Disagreements in my work area are resolved appropriately (i.e. not who is right, but what is best for the patient).> I have the support I need from other personnel to care for patients.> It is easy for personnel in my work area to ask questions when there is something that they do not understand.> The people from different professions in this health service work together as a well-coordinated team.> I know the first and last names of all the personnel I worked with during my last shift.> I am satisfied with the quality of collaboration that I experience with staff from different professions in my work
area.
Perc
eptio
ns o
f M
anag
emen
t
> Health service management supports my daily efforts.> I am provided with adequate, timely information about events in the health service that might affect my work.> Leadership is driving us to be a safety-centred organisation.> Executive management does not knowingly compromise the safety of patients.> Line managers in my work area do not knowingly compromise the safety of patients.
Wok
ing
Con
ditio
ns > This health service does a good job of training new personnel.
> All the necessary information for important decisions is routinely available to me.> This health service deals constructively with problem staff/personnel.> Trainees in this clinical area are adequately supervised.> The levels of staffing in my work area are sufficient to handle the number of patients.
Stre
ss
Reco
gniti
on
> When my workload becomes excessive, my performance is impaired.> I am less effective at work when fatigued.> I am more likely to make errors in hostile or tense situations.> Fatigue impairs my performance during emergency situations.
Job
Satis
fact
ion > I like my job.
> Working in this health service is like being part of a large family.> This health service is a good place to work.> I am proud to work at this health service.> Morale in my work area is high.
reverse indicates the four negatively-worded items, for which scores are reversed ahead of domain score calculations

TeamSTEPPS® 2.0 AU Measurement Toolkit page 11 CONTENTSD
Domain scores are calculated by averaging scores from the contributing survey items, after excluding items answered with Not Applicable and reversing scores for negatively-worded items. Higher scores indicate more positive attitudes and higher performance in that domain of safety culture.
Three SCS items (Box 3) do not contribute to domain scores; findings from these items are described at the ‘individual item’ level only.
Box 3 | Safety Climate Survey items that do not contribute to safety culture domains
Survey Items
> Clinical handover is common in my work area.
> Important issues are well communicated at shift changes/handovers.
> Briefing other personnel before the start of a shift or before a procedure is animportant part of patient safety.
Results from individual SCS items are typically considered in terms of the ‘percent positive’ – that is, the proportion of staff whose answers to that item reflect a positive safety culture. For the 38 positively-worded items, positive responses are ‘agree/strongly agree’, and for the 4 negatively-worded items, ‘positive’ responses are ‘disagree/strongly disagree’.
Data exports from SurveyMonkey can be transferred to the SCS Workbook, which calculates domain scores, as well as the ‘percent positive’ for each SCS item. Data are returned as tables and charts for reporting. For a copy of the SCS Workbook, please contact the TeamSTEPPS® Mailbox.
Results from the initial data collection can be compared against results from subsequent years (see Table 1) to detect change in safety culture domains across time, and to refine priorities as progress is made.
Table 1 Example table | Mean safety culture domain scores benchmarked over time
2018 2019
Safety Culture Domains N= N=
Safety Climate X.XX X.XX
Teamwork Climate X.XX X.XX
Perceptions of Management X.XX X.XX
Working Conditions X.XX X.XX
Stress Recognition X.XX X.XX
Job Satisfaction X.XX X.XX
Overall performance X.XX X.XX
N = number of respondents to annual Safety Climate Survey
page 12 TeamSTEPPS® 2.0 AU Measurement Toolkit CONTENTSD
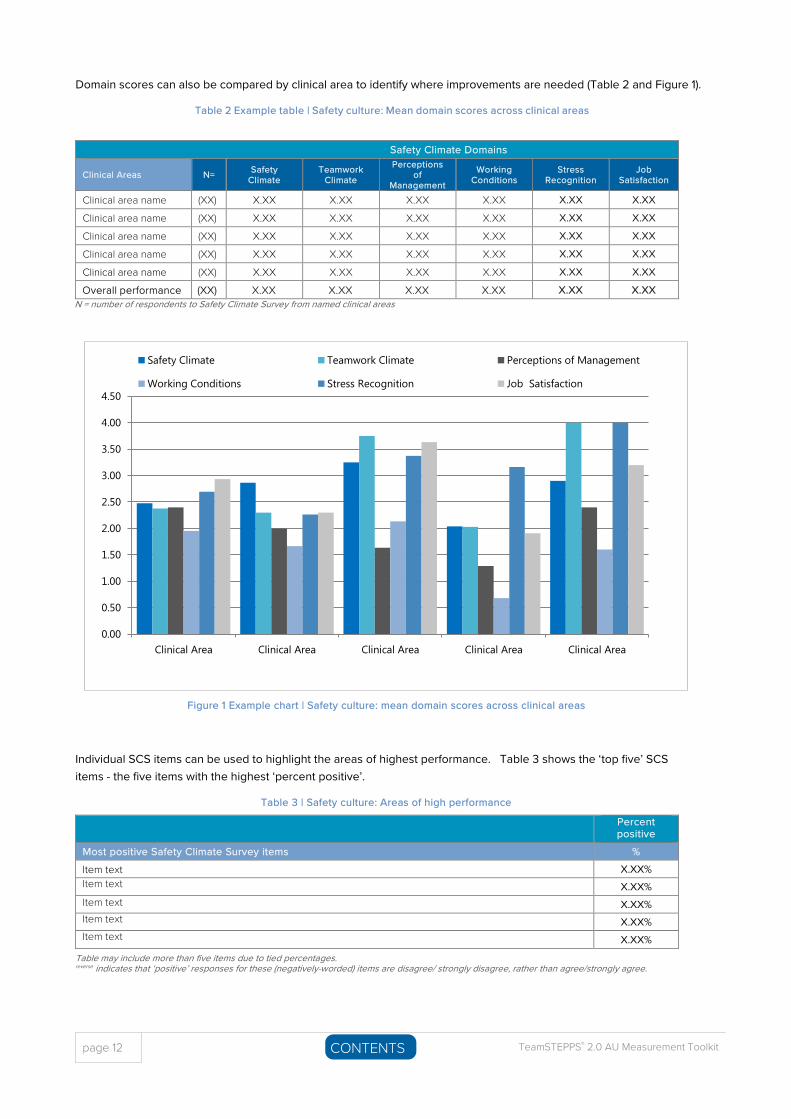
Domain scores can also be compared by clinical area to identify where improvements are needed (Table 2 and Figure 1).
Table 2 Example table | Safety culture: Mean domain scores across clinical areas
Safety Climate Domains
Clinical Areas N= Safety Climate
Teamwork Climate
Perceptions of
Management
Working Conditions
Stress Recognition
Job Satisfaction
Clinical area name (XX) X.XX X.XX X.XX X.XX X.XX X.XX
Clinical area name (XX) X.XX X.XX X.XX X.XX X.XX X.XX
Clinical area name (XX) X.XX X.XX X.XX X.XX X.XX X.XX
Clinical area name (XX) X.XX X.XX X.XX X.XX X.XX X.XX
Clinical area name (XX) X.XX X.XX X.XX X.XX X.XX X.XX
Overall performance (XX) X.XX X.XX X.XX X.XX X.XX X.XXN = number of respondents to Safety Climate Survey from named clinical areas
Figure 1 Example chart | Safety culture: mean domain scores across clinical areas
Individual SCS items can be used to highlight the areas of highest performance. Table 3 shows the ‘top five’ SCS items - the five items with the highest ‘percent positive’.
Table 3 | Safety culture: Areas of high performance
Percent positive
Most positive Safety Climate Survey items %
Item text X.XX% Item text X.XX% Item text X.XX% Item text X.XX% Item text X.XX%
Table may include more than five items due to tied percentages. reverse indicates that ‘positive’ responses for these (negatively-worded) items are disagree/ strongly disagree, rather than agree/strongly agree.
0.00
0.50
1.00
1.50
2.00
2.50
3.00
3.50
4.00
4.50
Clinical Area Clinical Area Clinical Area Clinical Area Clinical Area
Safety Climate Teamwork Climate Perceptions of Management
Working Conditions Stress Recognition Job Satisfaction
TeamSTEPPS® 2.0 AU Measurement Toolkit page 13 CONTENTSD
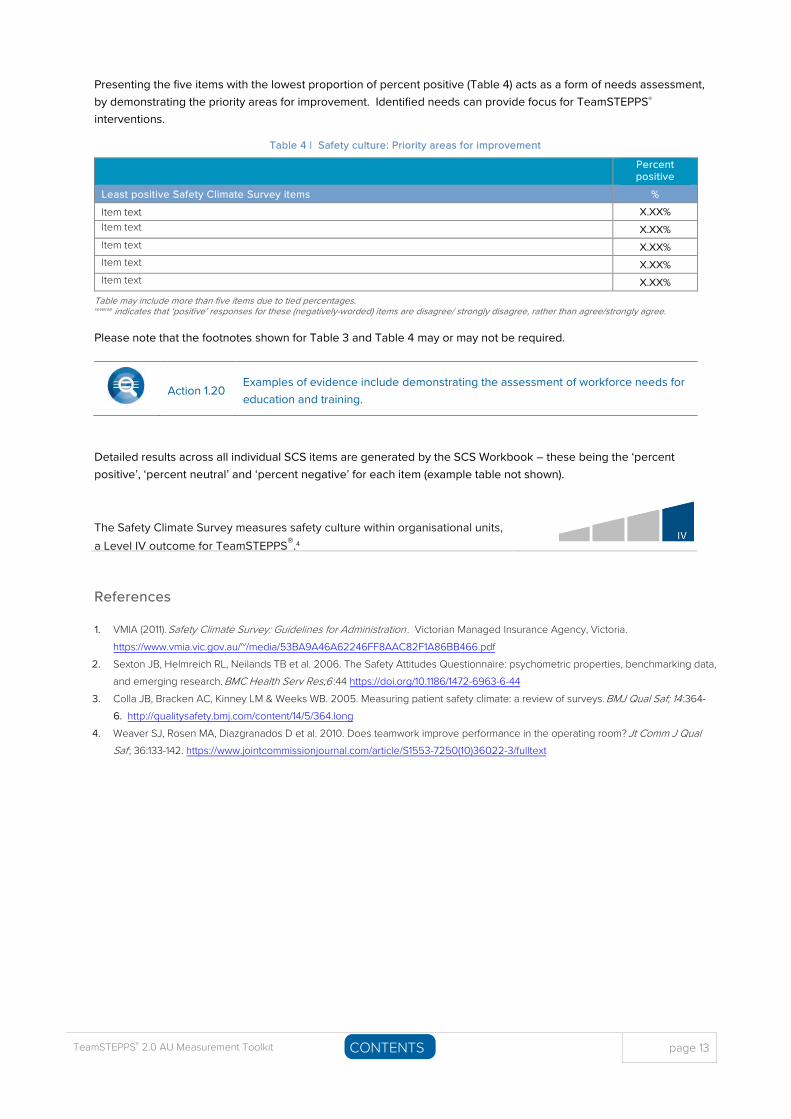
Presenting the five items with the lowest proportion of percent positive (Table 4) acts as a form of needs assessment, by demonstrating the priority areas for improvement. Identified needs can provide focus for TeamSTEPPS®
interventions.
Table 4 | Safety culture: Priority areas for improvement
Percent positive
Least positive Safety Climate Survey items % Item text X.XX% Item text X.XX% Item text X.XX% Item text X.XX% Item text X.XX%
Table may include more than five items due to tied percentages. reverse indicates that ‘positive’ responses for these (negatively-worded) items are disagree/ strongly disagree, rather than agree/strongly agree.
Please note that the footnotes shown for Table 3 and Table 4 may or may not be required.
Action 1.20 Examples of evidence include demonstrating the assessment of workforce needs for education and training.
Detailed results across all individual SCS items are generated by the SCS Workbook – these being the ‘percent positive’, ‘percent neutral’ and ‘percent negative’ for each item (example table not shown).
The Safety Climate Survey measures safety culture within organisational units, a Level IV outcome for TeamSTEPPS®.4
References
1. VMIA (2011). Safety Climate Survey: Guidelines for Administration . Victorian Managed Insurance Agency, Victoria.https://www.vmia.vic.gov.au/~/media/53BA9A46A62246FF8AAC82F1A86BB466.pdf
2. Sexton JB, Helmreich RL, Neilands TB et al. 2006. The Safety Attitudes Questionnaire: psychometric properties, benchmarking data,and emerging research. BMC Health Serv Res;6 :44 https://doi.org/10.1186/1472-6963-6-44
3. Colla JB, Bracken AC, Kinney LM & Weeks WB. 2005. Measuring patient safety climate: a review of surveys. BMJ Qual Saf; 14 :364-6. http://qualitysafety.bmj.com/content/14/5/364.long
4. Weaver SJ, Rosen MA, Diazgranados D et al. 2010. Does teamwork improve performance in the operating room? Jt Comm J Qual Saf ; 36:133-142. https://www.jointcommissionjournal.com/article/S1553-7250(10)36022-3/fulltext

page 14 TeamSTEPPS® 2.0 AU Measurement Toolkit CONTENTSD
This page has been left intentionally blank
TeamSTEPPS® 2.0 AU Measurement Toolkit page 15 CONTENTSD
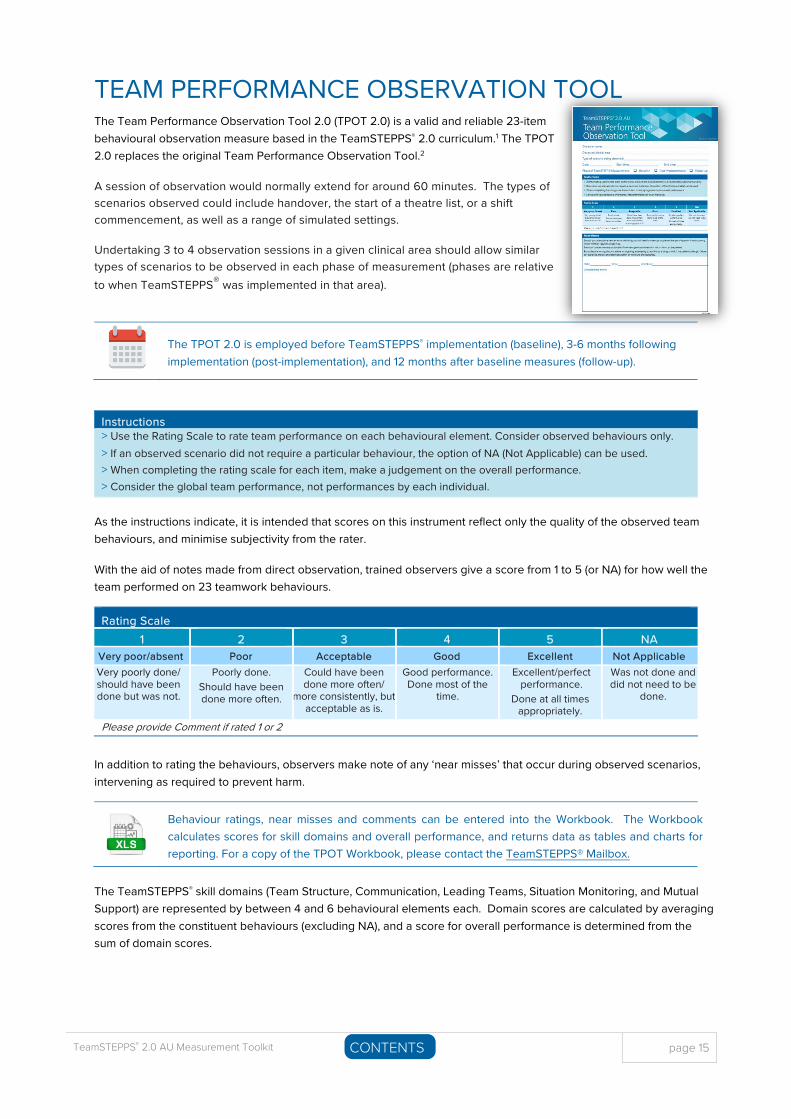
TEAM PERFORMANCE OBSERVATION TOOL The Team Performance Observation Tool 2.0 (TPOT 2.0) is a valid and reliable 23-item behavioural observation measure based in the TeamSTEPPS® 2.0 curriculum.1 The TPOT 2.0 replaces the original Team Performance Observation Tool.2
A session of observation would normally extend for around 60 minutes. The types of scenarios observed could include handover, the start of a theatre list, or a shift commencement, as well as a range of simulated settings.
Undertaking 3 to 4 observation sessions in a given clinical area should allow similar types of scenarios to be observed in each phase of measurement (phases are relative to when TeamSTEPPS® was implemented in that area).
The TPOT 2.0 is employed before TeamSTEPPS® implementation (baseline), 3-6 months following implementation (post-implementation), and 12 months after baseline measures (follow-up).
Instructions > Use the Rating Scale to rate team performance on each behavioural element. Consider observed behaviours only.> If an observed scenario did not require a particular behaviour, the option of NA (Not Applicable) can be used.> When completing the rating scale for each item, make a judgement on the overall performance.> Consider the global team performance, not performances by each individual.
As the instructions indicate, it is intended that scores on this instrument reflect only the quality of the observed team behaviours, and minimise subjectivity from the rater.
With the aid of notes made from direct observation, trained observers give a score from 1 to 5 (or NA) for how well the team performed on 23 teamwork behaviours.
Rating Scale 1 2 3 4 5 NA
Very poor/absent Poor Acceptable Good Excellent Not Applicable Very poorly done/ should have been done but was not.
Poorly done. Should have been done more often.
Could have been done more often/
more consistently, but acceptable as is.
Good performance. Done most of the
time.
Excellent/perfect performance.
Done at all times appropriately.
Was not done and did not need to be
done.
Please provide Comment if rated 1 or 2
In addition to rating the behaviours, observers make note of any ‘near misses’ that occur during observed scenarios, intervening as required to prevent harm.
Behaviour ratings, near misses and comments can be entered into the Workbook. The Workbook calculates scores for skill domains and overall performance, and returns data as tables and charts for reporting. For a copy of the TPOT Workbook, please contact the TeamSTEPPS® Mailbox.
The TeamSTEPPS® skill domains (Team Structure, Communication, Leading Teams, Situation Monitoring, and Mutual Support) are represented by between 4 and 6 behavioural elements each. Domain scores are calculated by averaging scores from the constituent behaviours (excluding NA), and a score for overall performance is determined from the sum of domain scores.
page 16 TeamSTEPPS® 2.0 AU Measurement Toolkit CONTENTSD
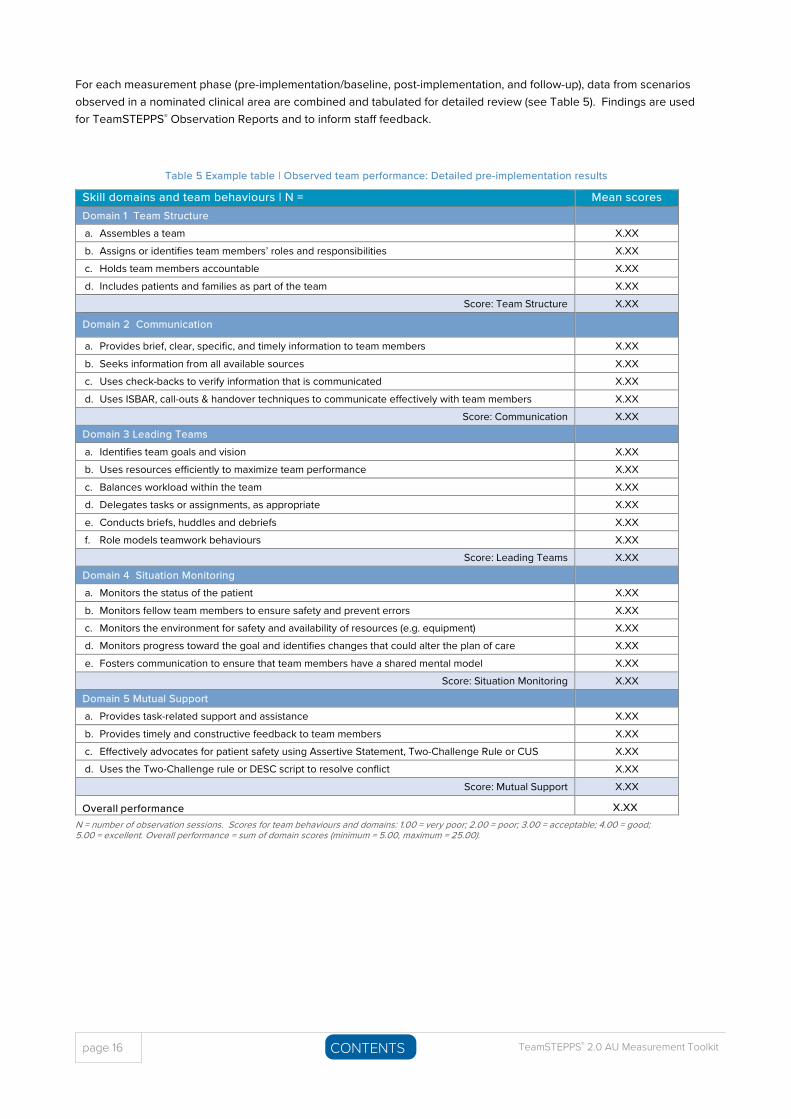
For each measurement phase (pre-implementation/baseline, post-implementation, and follow-up), data from scenarios observed in a nominated clinical area are combined and tabulated for detailed review (see Table 5). Findings are used for TeamSTEPPS® Observation Reports and to inform staff feedback.
Table 5 Example table | Observed team performance: Detailed pre-implementation results
Skill domains and team behaviours | N = Mean scores Domain 1 Team Structure a. Assembles a team X.XX b. Assigns or identifies team members’ roles and responsibilities X.XX c. Holds team members accountable X.XX d. Includes patients and families as part of the team X.XX
Score: Team Structure X.XX
Domain 2 Communication
a. Provides brief, clear, specific, and timely information to team members X.XX b. Seeks information from all available sources X.XX c. Uses check-backs to verify information that is communicated X.XX d. Uses ISBAR, call-outs & handover techniques to communicate effectively with team members X.XX
Score: Communication X.XX Domain 3 Leading Teams a. Identifies team goals and vision X.XX b. Uses resources efficiently to maximize team performance X.XX c. Balances workload within the team X.XX d. Delegates tasks or assignments, as appropriate X.XX e. Conducts briefs, huddles and debriefs X.XX f. Role models teamwork behaviours X.XX
Score: Leading Teams X.XX Domain 4 Situation Monitoring a. Monitors the status of the patient X.XX b. Monitors fellow team members to ensure safety and prevent errors X.XX c. Monitors the environment for safety and availability of resources (e.g. equipment) X.XX d. Monitors progress toward the goal and identifies changes that could alter the plan of care X.XX e. Fosters communication to ensure that team members have a shared mental model X.XX
Score: Situation Monitoring X.XX Domain 5 Mutual Support a. Provides task-related support and assistance X.XX b. Provides timely and constructive feedback to team members X.XX c. Effectively advocates for patient safety using Assertive Statement, Two-Challenge Rule or CUS X.XX d. Uses the Two-Challenge rule or DESC script to resolve conflict X.XX
Score: Mutual Support X.XX
Overall performance X.XXN = number of observation sessions. Scores for team behaviours and domains: 1.00 = very poor; 2.00 = poor; 3.00 = acceptable; 4.00 = good; 5.00 = excellent. Overall performance = sum of domain scores (minimum = 5.00, maximum = 25.00).
TeamSTEPPS® 2.0 AU Measurement Toolkit page 17 CONTENTSD
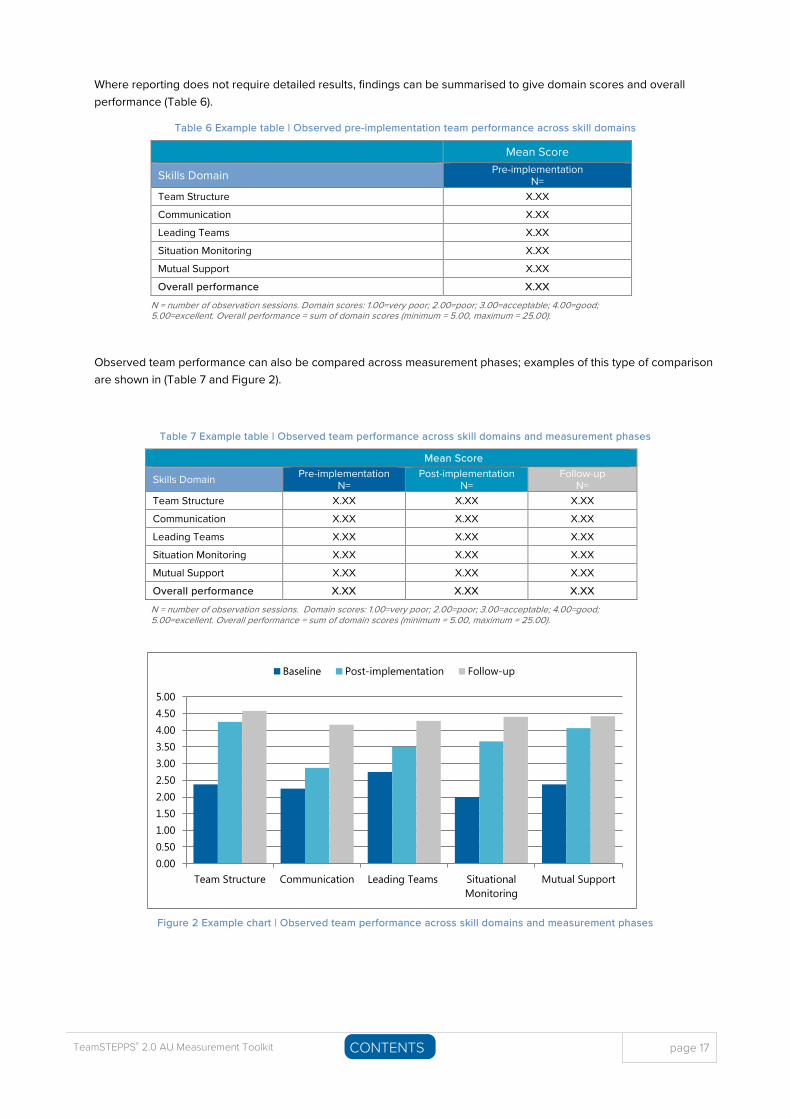
Where reporting does not require detailed results, findings can be summarised to give domain scores and overall performance (Table 6).
Table 6 Example table | Observed pre-implementation team performance across skill domains
Mean Score
Skills Domain Pre-implementation N=
Team Structure X.XX
Communication X.XX
Leading Teams X.XX
Situation Monitoring X.XX
Mutual Support X.XX
Overall performance X.XX
N = number of observation sessions. Domain scores: 1.00=very poor; 2.00=poor; 3.00=acceptable; 4.00=good; 5.00=excellent. Overall performance = sum of domain scores (minimum = 5.00, maximum = 25.00).
Observed team performance can also be compared across measurement phases; examples of this type of comparison are shown in (Table 7 and Figure 2).
Table 7 Example table | Observed team performance across skill domains and measurement phases
Mean Score
Skills Domain Pre-implementation N=
Post-implementation N=
Follow-up N=
Team Structure X.XX X.XX X.XX
Communication X.XX X.XX X.XX
Leading Teams X.XX X.XX X.XX
Situation Monitoring X.XX X.XX X.XX
Mutual Support X.XX X.XX X.XX
Overall performance X.XX X.XX X.XX
N = number of observation sessions. Domain scores: 1.00=very poor; 2.00=poor; 3.00=acceptable; 4.00=good; 5.00=excellent. Overall performance = sum of domain scores (minimum = 5.00, maximum = 25.00).
Figure 2 Example chart | Observed team performance across skill domains and measurement phases
0.000.501.001.502.002.503.003.504.004.505.00
Team Structure Communication Leading Teams SituationalMonitoring
Mutual Support
Baseline Post-implementation Follow-up
page 18 TeamSTEPPS® 2.0 AU Measurement Toolkit CONTENTSD
The Team Performance Observation Tool is a Level III measure as it concerns the behavioural implementation of TeamSTEPPS® skills.
References
1. Maguire M. 2016. Psychometric Testing of the TeamSTEPPS® 2.0 Team Performance Observation Tool . Doctorate of NursingScience Dissertations (Paper 2), Kenneshaw State University. https://digitalcommons.kennesaw.edu/dns_etd/2/
2. Baker D, Capella J, Hawkes C & Gallo J. 2010. The development of the Trauma Team Performance Observation Tool. 26th Annual Meeting of the Society for Industrial and Organisational Psychology , Chicago, IL. https://www.impaqint.com/work/papers-and-presentations/development-trauma-team-performance-observation-tool
TeamSTEPPS® 2.0 AU Measurement Toolkit page 19 CONTENTSD
SAFETY AND QUALITY OF CARE Measures of the safety and quality of care deliver the highest level of evidence regarding the effectiveness of TeamSTEPPS® training and interventions. In choosing measures, you may wish to consider organisational priorities or areas of known deficiency for specific clinical areas.
Consider reviewing the strategic, business or risk management plans that describe Action 1.1b organisational priorities and strategic directions for safe and high-quality clinical
care that are used as evidence for Action 1.1b.
There needs to be a justifiable link between the implementation of TeamSTEPPS® tools and strategies and projected improvement on target measures.
Measures can be obtained from a variety of sources. In many cases it is more feasible to gather data about clinical and organisational processes, than in relation to outcomes.
Clinical and administrative data systems can be audited for evidence of outcomes for patients, carers and staff, as well as for compliance with best practice guidelines and procedures. Data systems include electronic patient healthcare records; paper-based records can also be audited for inclusion/completion of checklists etc.
> Seek input from data analysts in your organisation or from your health department to obtain reports fromelectronic data systems.
Observational audits can be undertaken to measure the effectiveness of implementing TeamSTEPPS® tools (e.g. cross-monitoring) to improve workforce adherence to policies, procedures and protocols.
> Hand hygiene audits are examples of observational audits in the workplace.
Audit results offer valuable evidence for the actions required to meet NSQHS Standards.
Actions for which examples of evidence include Audit results for compliance with policies/ procedures/protocols/guidelines (incl. observational audit, records audit)
Action 1.7 Action 1.10
Action 1.14 Action 1.16 Action 1.27 Action 1.30
Action 2.3–2.7 Action 2.10
Action 3.1 Action 3.5–3.13
Action 3.15 Action 3.16
Action 4.1 Action 4.2 Action 4.4–4.12 Action 4.14 Action 4.15
Action 5.4 Action 6.2 Action 6.8 Action 6.9
Action 7.1 Action 7.2 Action 7.4–7.7 Action 7.9 Action 7.10
Action 8.1 Action 8.4 Action 8.5 Action 8.6 Action 8.8 Action 8.9 Action 8.12
Box 4 | Key resources relevant to safety and quality of care measures
Key Resources
> Clinical Care Standards support the delivery of appropriate care and reduce unwarranted variation in care. They target
key areas and provide opportunities to better align clinical practice with the best evidence.
https://www.safetyandquality.gov.au/our-work/clinical-care-standards/
> The National Health and Medical Research Council’s clinical practice guidelines portal provides links to clinical practice
guidelines developed for use in Australian healthcare settings. https://www.clinicalguidelines.gov.au/
Questionnaires can be used to gather views from staff or patients/carers.
> See Toolkit section on Shared decision making for information about questionnaires that can be usedto measure shared decision making in your organisation.
Interviews and focus groups can also be used to gather information.
page 20 TeamSTEPPS® 2.0 AU Measurement Toolkit CONTENTSD
Measures from before TeamSTEPPS® implementation (baseline) are compared with measures from subsequent time-points to evaluate the effectiveness of training and interventions. If data can be gathered retrospectively (e.g. from auditing healthcare records or other existing clinical or administrative data systems), baseline measures can be gathered after TeamSTEPPS®
implementation has begun. Arrangements for capturing new forms of data (vs data that is already being captured must be made ahead of time to obtain the pre-implementation measures.
Sharing measurement data is a great way to provide feedback to staff and to maintain enthusiasm to sustain improvements. Measures also provide evidence with relevance to numerous NSQHSS Actions.
Action 1.1 Examples of evidence include: Safety and quality performance data… that are monitored by the governing body, managers or the clinical governance committee.
Action 1.8 Examples of evidence include: Communication with the workforce… that provides feedback regarding safety and quality of patient care.
Action 1.9 Examples of evidence include: Communication with the workforce… on the health service organisation’s safety and quality performance.
Examples of safety and quality of care measures and how these can be summarised and represented can be seen in the following references from the open access literature (Box 5).
Box 5 | Safety and quality of care measures: Examples from Open Access Literature
Examples in Open Access Literature > Burnett S, Deelchand V, Franklin B et al. 2011. Missing clinical information in NHS hospital outpatient clinics: prevalence,
causes and effects on patient care. BMC Health Serv Res;11 :114.https://bmchealthservres.biomedcentral.com/articles/10.1186/1472-6963-11-114
> Etherton-Beer C, Venturato L, Horner B. 2013. Organisational Culture in Residential Aged Care Facilities. PLoS ONE 8 :e58002.[accessed online] http://journals.plos.org/plosone/article?id=10.1371/journal.pone.0058002
> Medlock S, Parlevliet JL, Sent D et al. 2017. An email-based intervention to improve the number and timeliness of letterssent from the hospital outpatient clinic to the general practitioner. PLoS ONE 12 :e0185812.http://journals.plos.org/plosone/article?id=10.1371/journal.pone.0185812
> Morgan L, Pickering SP, Hadi M et al. 2015. A combined teamwork training and work standardisation intervention inoperating theatres. BMJ Qual Saf 24: 111-119. http://qualitysafety.bmj.com/content/24/2/111
> Morgan, L, Robertson E, Hadi M et al. 2013. Capturing intraoperative process deviations using a direct observationalapproach. BMJ Open 3: e003519. http://bmjopen.bmj.com/content/3/11/e003519
> Pannick S, Davis R, Ashrafian H et al. 2015. Effects of interdisciplinary team care interventions on general medical wards.JAMA Intern Med 175: 1288-98. https://jamanetwork.com/journals/jamainternalmedicine/fullarticle/2301377
> Pannick S, Wachter R, Vincent C & Sevdalis N. 2016. Rethinking medical ward quality. BMJ 355: i5417.http://www.bmj.com/content/355/bmj.i5417
> Thor J, Lundberg J, Ask J et al. Application of statistical process control in healthcare improvement. BMJ Qual Saf 16 :387-399. http://qualitysafety.bmj.com/content/16/5/387
> Wahr J, Abernathy J, Lazarra E et al. 2017. Medication safety in the operating room. Br J Anaesth 118 :32-43.http://bjanaesthesia.org/article/S0007-0912(17)30113-7/fulltext
s in Open Access Literature
Indicators of the safety and quality of care are Level IV measures. These results for patients, families and care practices are the intended outcomes of TeamSTEPPS®.
TeamSTEPPS® 2.0 AU Measurement Toolkit page 21 CONTENTSD
RUN AND CONTROL CHARTS Run and control charts can be used to present measurement findings, and to answer whether changes and interventions have resulted in improvement.
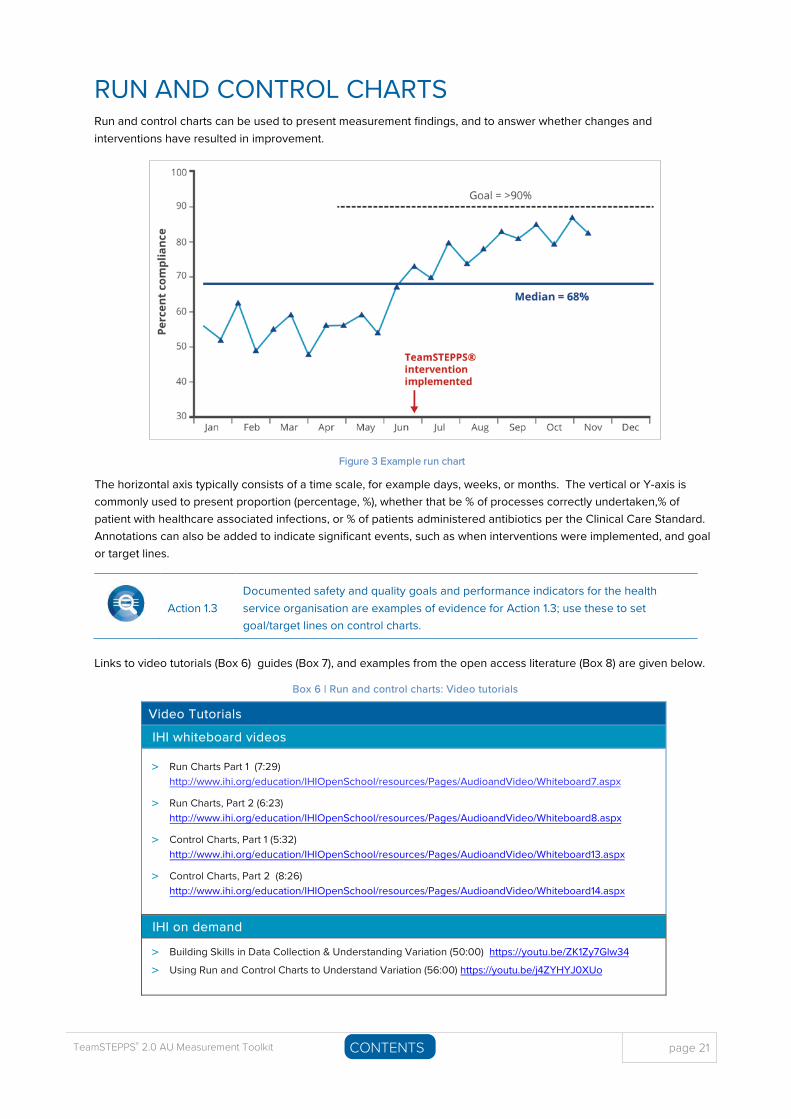
Figure 3 Example run chart
The horizontal axis typically consists of a time scale, for example days, weeks, or months. The vertical or Y-axis is commonly used to present proportion (percentage, %), whether that be % of processes correctly undertaken,% of patient with healthcare associated infections, or % of patients administered antibiotics per the Clinical Care Standard. Annotations can also be added to indicate significant events, such as when interventions were implemented, and goal or target lines.
Action 1.3 Documented safety and quality goals and performance indicators for the health service organisation are examples of evidence for Action 1.3; use these to set goal/target lines on control charts.
Links to video tutorials (Box 6) guides (Box 7), and examples from the open access literature (Box 8) are given below.
Box 6 | Run and control charts: Video tutorials
Video Tutorials
IHI whiteboard videos
> Run Charts Part 1 (7:29)http://www.ihi.org/education/IHIOpenSchool/resources/Pages/AudioandVideo/Whiteboard7.aspx
> Run Charts, Part 2 (6:23)http://www.ihi.org/education/IHIOpenSchool/resources/Pages/AudioandVideo/Whiteboard8.aspx
> Control Charts, Part 1 (5:32)http://www.ihi.org/education/IHIOpenSchool/resources/Pages/AudioandVideo/Whiteboard13.aspx
> Control Charts, Part 2 (8:26)http://www.ihi.org/education/IHIOpenSchool/resources/Pages/AudioandVideo/Whiteboard14.aspx
IHI on demand
> Building Skills in Data Collection & Understanding Variation (50:00) https://youtu.be/ZK1Zy7Glw34
> Using Run and Control Charts to Understand Variation (56:00) https://youtu.be/j4ZYHYJ0XUo
page 22 TeamSTEPPS® 2.0 AU Measurement Toolkit CONTENTSD
Box 7 | Run and control charts: Online guides and template
Other Resources
Guides
> Clinical Excellence Commission Quality Improvement Tools: Run Charts http://www.cec.health.nsw.gov.au/quality-
improvement/improvement-academy/quality-improvement-tools/run-charts
> Clinical Excellence Commission Quality Improvement Tools: Control Charts http://www.cec.health.nsw.gov.au/quality-
improvement/improvement-academy/quality-improvement-tools/control-charts
> Scottish Patient Safety Programme Good Practice Guide to Data Management: Run Charts
http://www.knowledge.scot.nhs.uk/media/CLT/ResourceUploads/1006891/
Good_Practice_Guide_Data_Management_run_ chart_rules.pdf
> Marsteller JA., Huizinga MM & Cooper LA. 2013. Statistical Process Control. Rockville, MD: AHRQ Publication No.13-0031-
EF. https://pcmh.ahrq.gov/page/statistical-process-controlpossible-uses-monitor-and-evaluate-patient-centered-medical-
home
Templates
> IHI Open School Run Chart Template
http://www.ihi.org/education/ihiopenschool/Courses/documents/practicumdocuments/run%20chart%
20template.xls
Box 8 | Run and control charts: Examples from Open Access Literature
Examples in Open Access Literature
> Alolayan A, Alkaiyat M, Ali Y et al. 2017. Improving physician's hand over among oncology staff using standardized
communication tool BMJ Open Qual;6 :u211844.w6141. http://bmjopenquality.bmj.com/content/6/1/u211844.w6141
> Benneyan JC, Lloyd RC & Plsek PE. 2003. Statistical process control as a tool for research and healthcare improvement.
Qual Saf Health Care;12 :458-464 https://www.ncbi.nlm.nih.gov/pmc/articles/PMC1758030/pdf/v012p00458.pdf
> Brunswicker A & Yogarajah A. 2014. Improving pre-operative medicines reconciliation. BMJ Open Qual;3 :u205475.w2230.
http://bmjopenquality.bmj.com/content/3/1/u205475.w2230
> Donnelly P, Lawson S, Watterson C. 2015. Improving paediatric prescribing practice in a district general hospital through
implementation of a quality improvement programme BMJ Open Qual;4 :u206996.w3769.
http://bmjopenquality.bmj.com/content/4/1/u206996.w3769
> Goodman D, Ogrinc G, Davies L et al. 2016. Explanation and elaboration of the SQUIRE Guidelines V.2.0: BMJ Qual Saf;25 :e7. http://qualitysafety.bmj.com/content/25/12/e7
> Mohammed MA, Worthington P & Woodall WH. 2008. Plotting basic control charts: tutorial notes for healthcare practitioners.
Qual Saf Health Care;17: 137-145. http://qualitysafety.bmj.com/content/17/2/137
> Perla R, Provost L, & Murray S. 2011. The run chart: a simple analytical tool for learning from variation in healthcare processes.
BMJ Qual Saf;20:46-51. http://qualitysafety.bmj.com/content/20/1/46
Run and control charts are used to depict the impact of TeamSTEPPS® training and interventions on Level III and Level IV measures.
TeamSTEPPS® 2.0 AU Measurement Toolkit page 23 CONTENTSD
ISBAR AUDIT Observational audits can be used to assess handovers for the extent to which relevant information is conveyed within the ISBAR information categories (Identify, Situation, Background, Assessment, and Recommendations). In a given clinical area, multiple handovers are observed within an audit cycle; observations should cover the range of possible shift handovers, as well as other transition contexts. Each audit cycle should cover a similar range of observed scenarios.
Action 6.1 Examples of evidence: Observation of clinicians’ practice that shows use of the health service’s clinical communication processes.
If ISBAR is already being used in the clinical area, existing (pre-implementation) handover practices can be assessed; a pre-implementation audit cycle provides a useful initial baseline against which to compare measures taken within 1 to 2 months of having implemented ISBAR as part of TeamSTEPPS® 2.0 AU. Follow-up audit cycles – undertaken every six months or so – are used to assess whether improvements to handover practice are sustained.
A post-implementation audit cycle (within 1 to 2 months) is undertaken, then follow-up audit cycles (approximately every six months). A pre-implementation cycle can be undertaken if ISBAR is already being used in the clinical area.
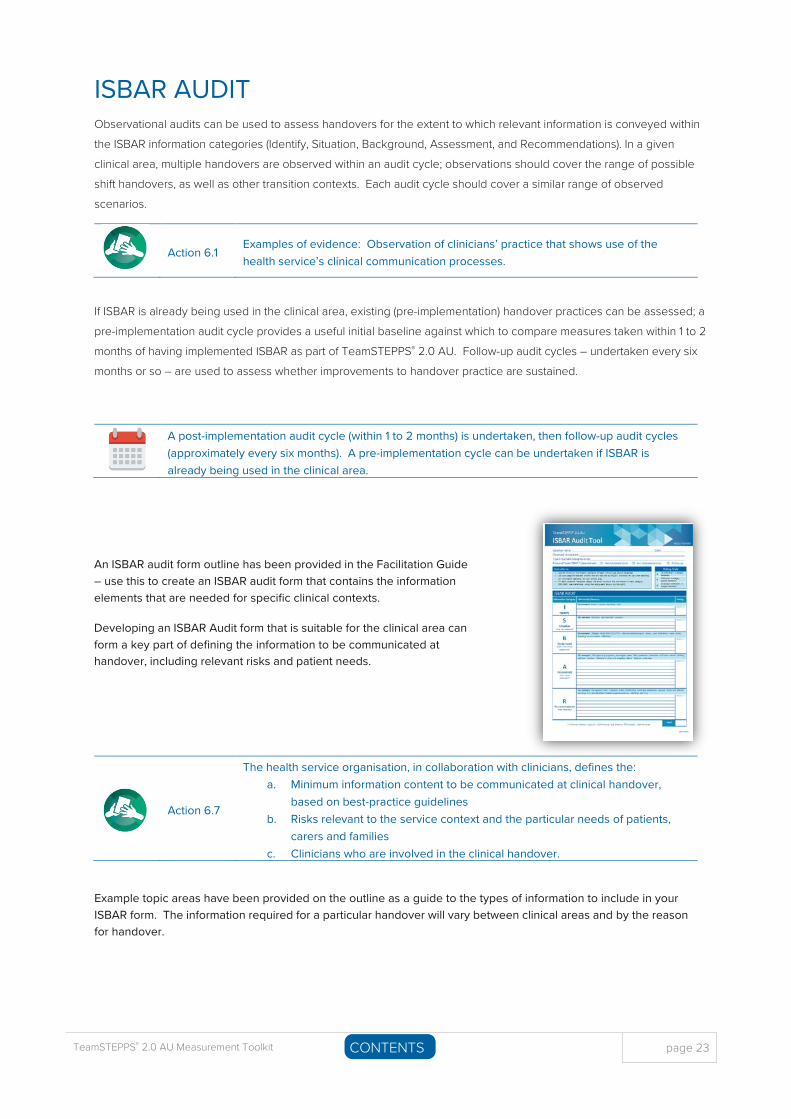
An ISBAR audit form outline has been provided in the Facilitation Guide – use this to create an ISBAR audit form that contains the informationelements that are needed for specific clinical contexts.
Developing an ISBAR Audit form that is suitable for the clinical area can form a key part of defining the information to be communicated at handover, including relevant risks and patient needs.
Action 6.7
The health service organisation, in collaboration with clinicians, defines the: a. Minimum information content to be communicated at clinical handover,
based on best-practice guidelinesb. Risks relevant to the service context and the particular needs of patients,
carers and familiesc. Clinicians who are involved in the clinical handover.
Example topic areas have been provided on the outline as a guide to the types of information to include in your ISBAR form. The information required for a particular handover will vary between clinical areas and by the reason for handover.
page 24 TeamSTEPPS® 2.0 AU Measurement Toolkit CONTENTSD
In determining the necessary information content, consider Actions across the NSQHS Standards that require and support communication of relevant information at transitions of care.
NSQHS Standards 2nd Edition Actions Information Category Actions Global Considersations
I Identify Action 6.5b
Action 6.7, 6.8
S Situation
B Background Actions 3.7, 4.5, 4.7, 5.10
A Assessment
Actions 4.6, 4.10, 4.12a, 5.7b, 5.11-5.14, 5.21-5.30, 5.31c, 5.33, 6.10, 7.5, 8.6e
R Recommendation
Actions 4.11, 4.12b, 4.12c, 5.13-5.14, 5.21-5.30, 5.31c, 5.32-5.33, 5.35-5.36, 8.5e, 8.6e
For each audited handover, an observer assesses the extent to which the information in each category (I, S, B, A & R) was transferred, returning five category scores of 0, 1, or 21 per the Rating Scale provided. Category scores are summed to give an overall handover score from 0 to 10.
Observers can also add comments about the handover, including the extent to which information was ordered in accordance with the ISBAR structure, and observed levels of clinician involvement in the handover.
Rating Scale
0 No information in category transferred
1 Information in category partially transferred
2 All relevant information in category transferred
Category scores and comments can be entered into the ISBAR Audit Workbook. Scores are returned as tables and charts for reporting. For a copy of the ISBAR Workbook, please contact the TeamSTEPPS® Mailbox.
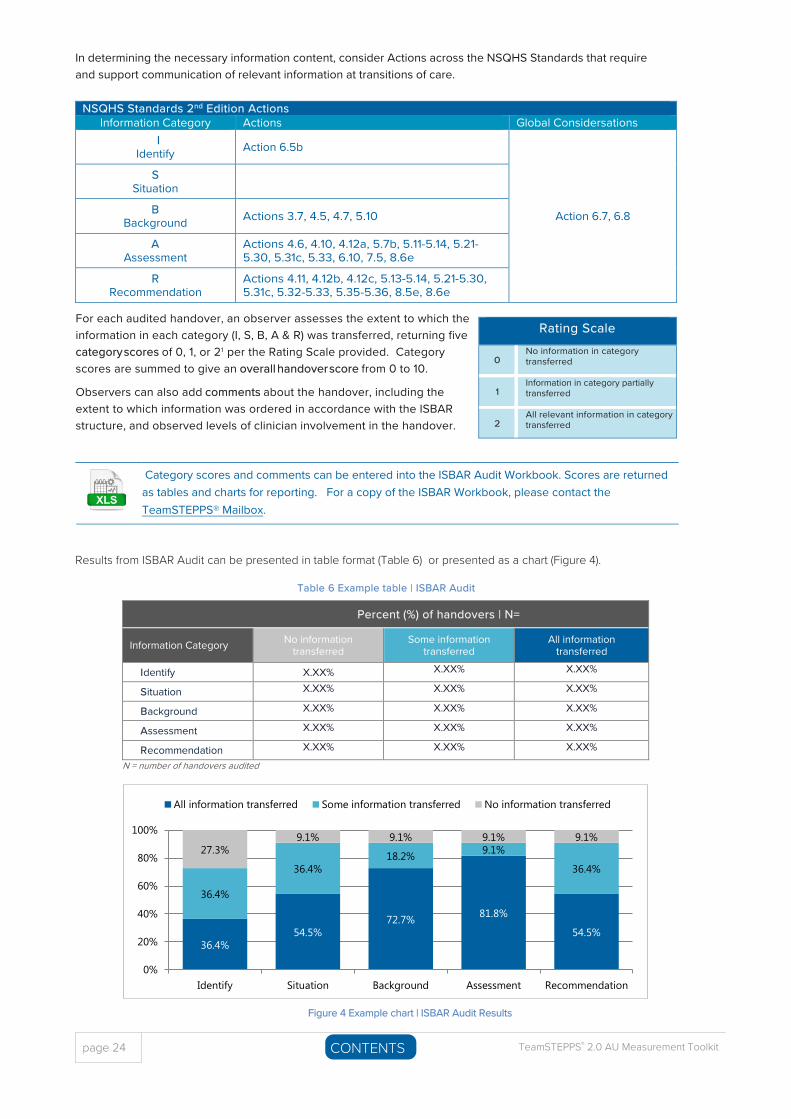
Results from ISBAR Audit can be presented in table format (Table 6) or presented as a chart (Figure 4).
Table 6 Example table | ISBAR Audit
Percent (%) of handovers | N=
Information Category No information transferred
Some information transferred
All information transferred
Identify X.XX% X.XX% X.XX%
Situation X.XX% X.XX% X.XX%
Background X.XX% X.XX% X.XX%
Assessment X.XX% X.XX% X.XX%
Recommendation X.XX% X.XX% X.XX%
N = number of handovers audited
36.4% 54.5%
72.7% 81.8%
54.5%
36.4%
36.4% 18.2% 9.1%
36.4%
27.3% 9.1% 9.1% 9.1% 9.1%
0%
20%
40%
60%
80%
100%
Identify Situation Background Assessment Recommendation
All information transferred Some information transferred No information transferred
Figure 4 Example chart | ISBAR Audit Results
TeamSTEPPS® 2.0 AU Measurement Toolkit page 25 CONTENTSD
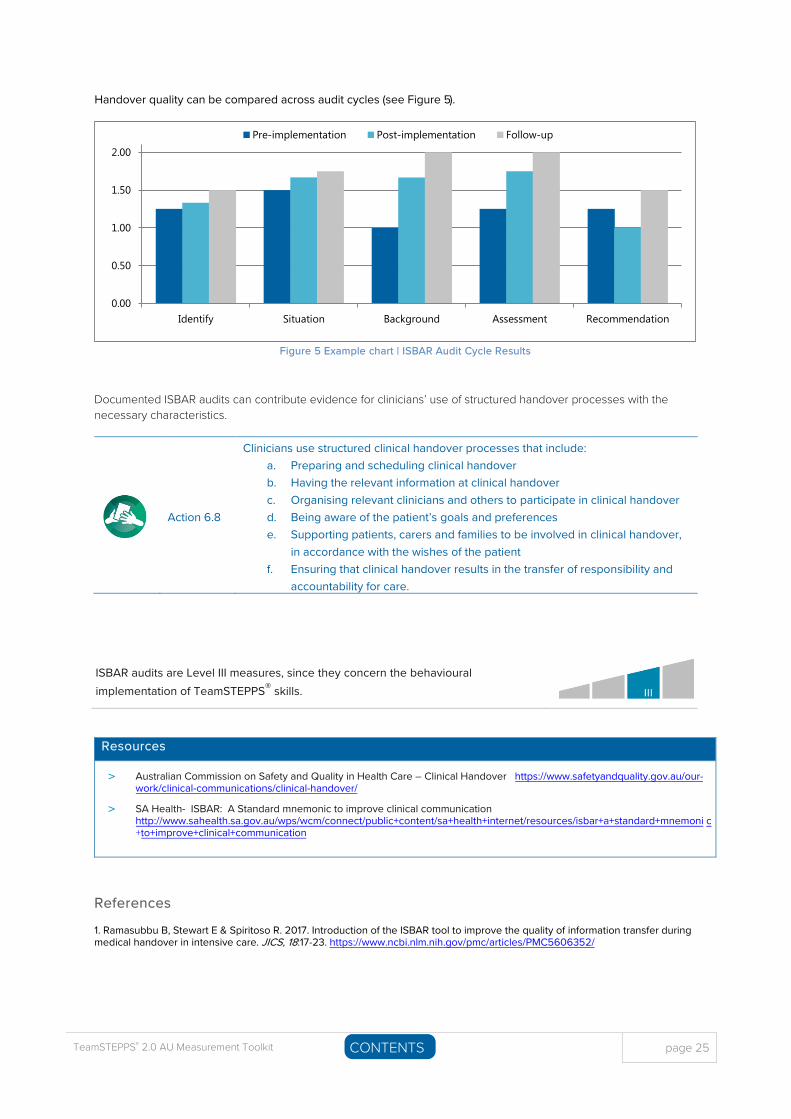
Handover quality can be compared across audit cycles (see Figure 5).
Figure 5 Example chart | ISBAR Audit Cycle Results
Documented ISBAR audits can contribute evidence for clinicians’ use of structured handover processes with the necessary characteristics.
Action 6.8
Clinicians use structured clinical handover processes that include: a. Preparing and scheduling clinical handoverb. Having the relevant information at clinical handoverc. Organising relevant clinicians and others to participate in clinical handoverd. Being aware of the patient’s goals and preferencese. Supporting patients, carers and families to be involved in clinical handover,
in accordance with the wishes of the patientf. Ensuring that clinical handover results in the transfer of responsibility and
accountability for care.
ISBAR audits are Level III measures, since they concern the behavioural implementation of TeamSTEPPS® skills.
Resources
> Australian Commission on Safety and Quality in Health Care – Clinical Handover https://www.safetyandquality.gov.au/our-work/clinical-communications/clinical-handover/
> SA Health- ISBAR: A Standard mnemonic to improve clinical communicationhttp://www.sahealth.sa.gov.au/wps/wcm/connect/public+content/sa+health+internet/resources/isbar+a+standard+mnemoni c+to+improve+clinical+communication
References
1. Ramasubbu B, Stewart E & Spiritoso R. 2017. Introduction of the ISBAR tool to improve the quality of information transfer duringmedical handover in intensive care. JICS, 18:17-23. https://www.ncbi.nlm.nih.gov/pmc/articles/PMC5606352/
0.00
0.50
1.00
1.50
2.00
Identify Situation Background Assessment Recommendation
Pre-implementation Post-implementation Follow-up

page 26 TeamSTEPPS® 2.0 AU Measurement Toolkit CONTENTSD
This page has been left intentionally blank
TeamSTEPPS® 2.0 AU Measurement Toolkit page 27 CONTENTSD
BRIEFING AUDIT Observational audits are used to measure the quality and consistency of briefing sessions that are implemented as a TeamSTEPPS® intervention, taking place (for example) at the start of a theatre list or the beginning of a work shift.
Action 5.5
The health service organisation has processes to: a. Support multidisciplinary collaboration and teamworkb. Define the roles and responsibilities of each clinician working in a team.Examples of evidence include: Schedule of regular multidisciplinary meetings – such as huddles or briefings.
Audit cycles (in which a number of briefings are observed in a given clinical area) capture information about how well the briefing intervention is carried out in the months following implementation, and how well briefing practice is sustained over the longer term. The auditing observer can be an attendee of the brief or someone from outside the team.
A post-implementation audit cycle (within 1 to 2 months) is undertaken, then follow-up audit cycles (approx. every six months).
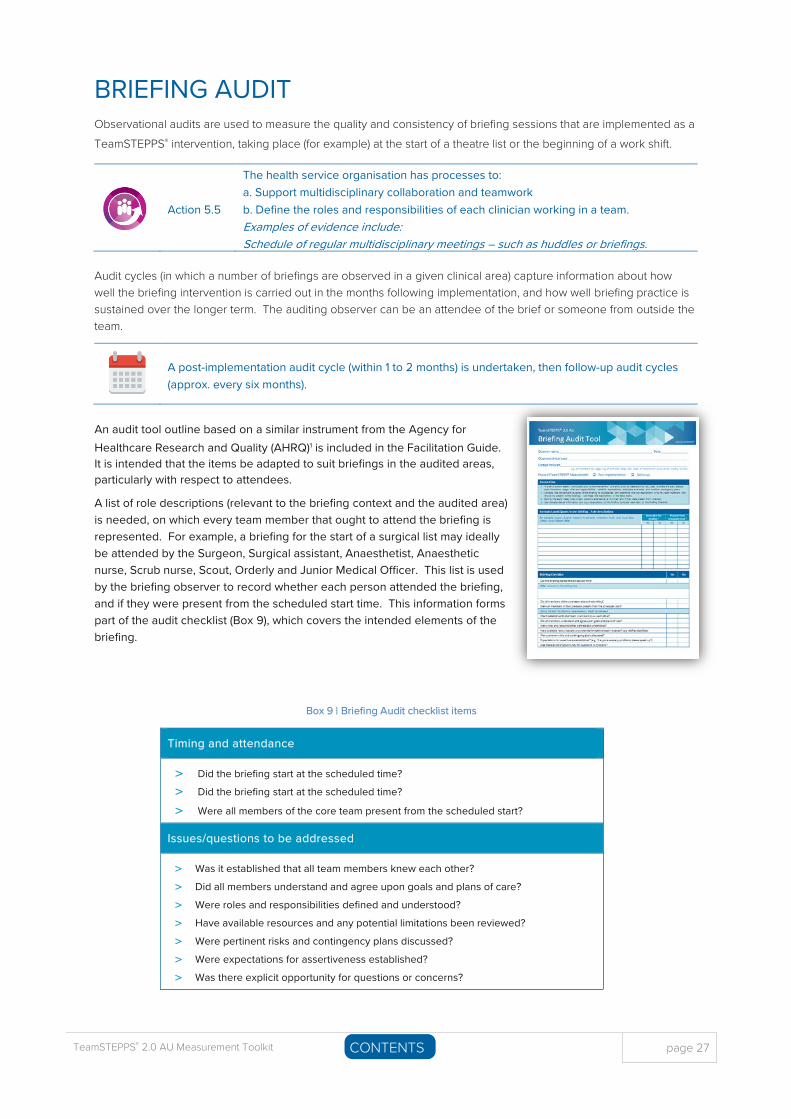
An audit tool outline based on a similar instrument from the Agency for Healthcare Research and Quality (AHRQ)1 is included in the Facilitation Guide. It is intended that the items be adapted to suit briefings in the audited areas, particularly with respect to attendees.
A list of role descriptions (relevant to the briefing context and the audited area) is needed, on which every team member that ought to attend the briefing is represented. For example, a briefing for the start of a surgical list may ideally be attended by the Surgeon, Surgical assistant, Anaesthetist, Anaesthetic nurse, Scrub nurse, Scout, Orderly and Junior Medical Officer. This list is used by the briefing observer to record whether each person attended the briefing, and if they were present from the scheduled start time. This information forms part of the audit checklist (Box 9), which covers the intended elements of the briefing.
Box 9 | Briefing Audit checklist items
Timing and attendance
> Did the briefing start at the scheduled time?
> Did the briefing start at the scheduled time?
> Were all members of the core team present from the scheduled start?
Issues/questions to be addressed
> Was it established that all team members knew each other?
> Did all members understand and agree upon goals and plans of care?
> Were roles and responsibilities defined and understood?
> Have available resources and any potential limitations been reviewed?
> Were pertinent risks and contingency plans discussed?
> Were expectations for assertiveness established?
> Was there explicit opportunity for questions or concerns?
page 28 TeamSTEPPS® 2.0 AU Measurement Toolkit CONTENTSD
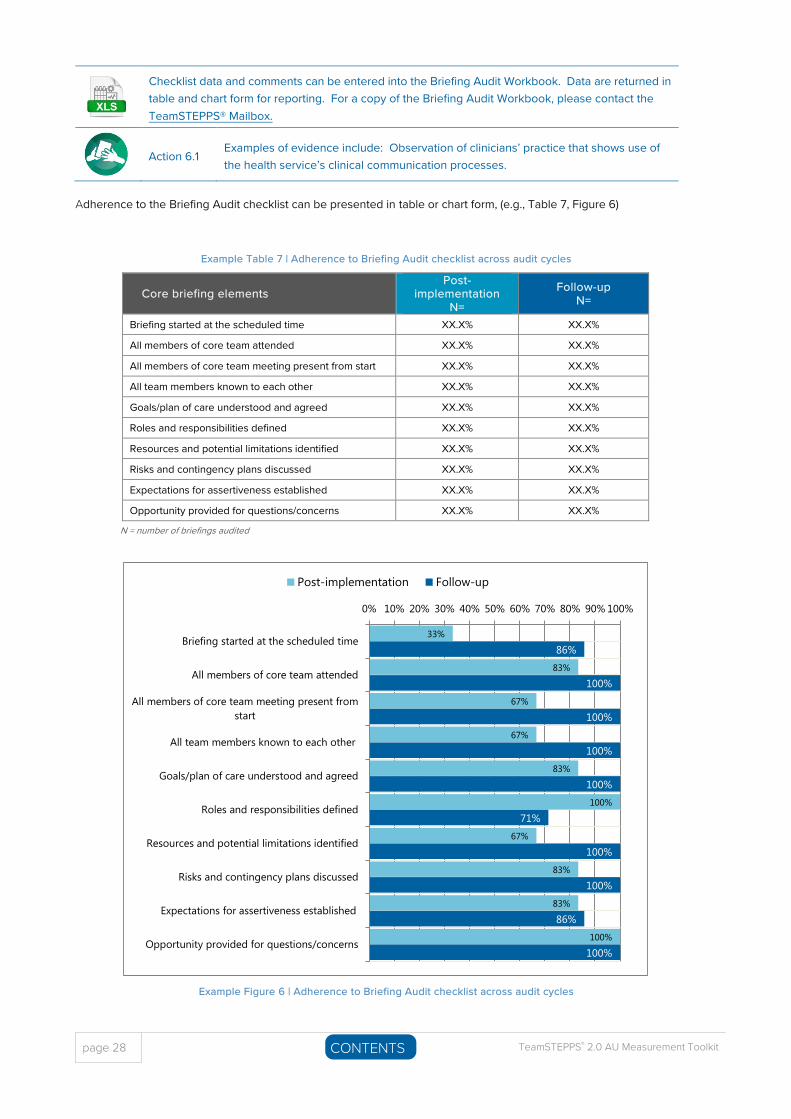
Checklist data and comments can be entered into the Briefing Audit Workbook. Data are returned in table and chart form for reporting. For a copy of the Briefing Audit Workbook, please contact the TeamSTEPPS® Mailbox.
Action 6.1 Examples of evidence include: Observation of clinicians’ practice that shows use of the health service’s clinical communication processes.
Adherence to the Briefing Audit checklist can be presented in table or chart form, (e.g., Table 7, Figure 6)
Example Table 7 | Adherence to Briefing Audit checklist across audit cycles
Core briefing elements Post-
implementation N=
Follow-up N=
Briefing started at the scheduled time XX.X% XX.X%
All members of core team attended XX.X% XX.X%
All members of core team meeting present from start XX.X% XX.X%
All team members known to each other XX.X% XX.X%
Goals/plan of care understood and agreed XX.X% XX.X%
Roles and responsibilities defined XX.X% XX.X%
Resources and potential limitations identified XX.X% XX.X%
Risks and contingency plans discussed XX.X% XX.X%
Expectations for assertiveness established XX.X% XX.X%
Opportunity provided for questions/concerns XX.X% XX.X%
N = number of briefings audited
Example Figure 6 | Adherence to Briefing Audit checklist across audit cycles
33%
83%
67%
67%
83%
100%
67%
83%
83%
100%
86%
100%
100%
100%
100%
71%
100%
100%
86%
100%
0% 10% 20% 30% 40% 50% 60% 70% 80% 90% 100%
Briefing started at the scheduled time
All members of core team attended
All members of core team meeting present fromstart
All team members known to each other
Goals/plan of care understood and agreed
Roles and responsibilities defined
Resources and potential limitations identified
Risks and contingency plans discussed
Expectations for assertiveness established
Opportunity provided for questions/concerns
Post-implementation Follow-up
TeamSTEPPS® 2.0 AU Measurement Toolkit page 29 CONTENTSD
Audit findings should be communicated to staff to improve the quality and consistency of future briefings. Results can also provide useful evidence for accreditation.
Share the results of your audit with your quality improvement teams, as well as the entire clinical team. Highlight areas where the team excels and opportunities for improvement. The audit data can provide insight into any education gaps and may identify deficiencies in team work and the delivery of care.
Briefing audits are Level III measures, since they concern the behavioural implementation of TeamSTEPPS® skills.
References
1. AHRQ Safety Program for Surgery. Operating Room Briefing and Debriefing Audit Tool . https://www.ahrq.gov/professionals/quality-patient-safety/hais/tools/surgery/tools/applying-cusp/or_briefing_audit.html

page 30 TeamSTEPPS® 2.0 AU Measurement Toolkit CONTENTSD
This page has been left intentionally blank
TeamSTEPPS® 2.0 AU Measurement Toolkit page 31 CONTENTSD
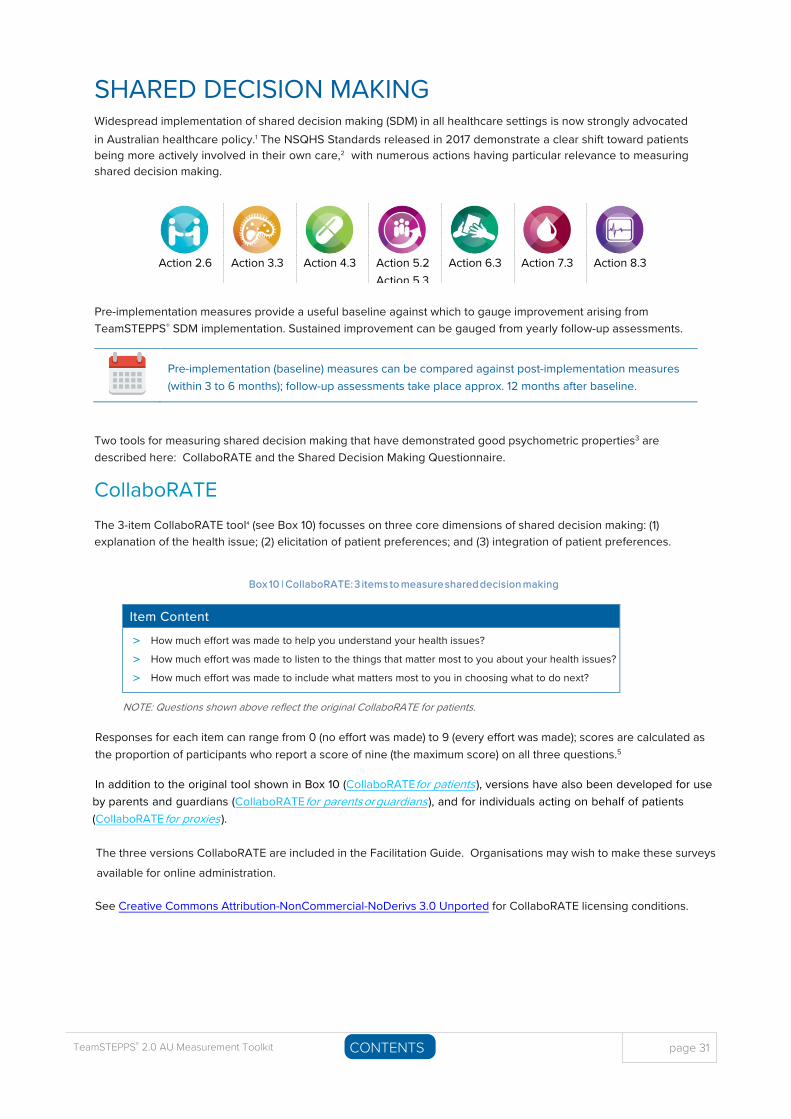
SHARED DECISION MAKING Widespread implementation of shared decision making (SDM) in all healthcare settings is now strongly advocated in Australian healthcare policy.1 The NSQHS Standards released in 2017 demonstrate a clear shift toward patients being more actively involved in their own care,2 with numerous actions having particular relevance to measuring shared decision making.
Action 2.6 Action 3.3 Action 4.3 Action 5.2 Action 5.3
Action 6.3 Action 7.3 Action 8.3
Pre-implementation measures provide a useful baseline against which to gauge improvement arising from TeamSTEPPS® SDM implementation. Sustained improvement can be gauged from yearly follow-up assessments.
Pre-implementation (baseline) measures can be compared against post-implementation measures (within 3 to 6 months); follow-up assessments take place approx. 12 months after baseline.
Two tools for measuring shared decision making that have demonstrated good psychometric properties3 are described here: CollaboRATE and the Shared Decision Making Questionnaire.
CollaboRATE The 3-item CollaboRATE tool4 (see Box 10) focusses on three core dimensions of shared decision making: (1) explanation of the health issue; (2) elicitation of patient preferences; and (3) integration of patient preferences.
Box 10 | CollaboRATE: 3 items to measure shared decision making
Item Content
> How much effort was made to help you understand your health issues?
> How much effort was made to listen to the things that matter most to you about your health issues?
> How much effort was made to include what matters most to you in choosing what to do next?
NOTE: Questions shown above reflect the original CollaboRATE for patients.
Responses for each item can range from 0 (no effort was made) to 9 (every effort was made); scores are calculated as the proportion of participants who report a score of nine (the maximum score) on all three questions.5
In addition to the original tool shown in Box 10 (CollaboRATE for patients ), versions have also been developed for use by parents and guardians (CollaboRATE for parents or guardians ), and for individuals acting on behalf of patients (CollaboRATE for proxies ).
The three versions CollaboRATE are included in the Facilitation Guide. Organisations may wish to make these surveys available for online administration.
See Creative Commons Attribution-NonCommercial-NoDerivs 3.0 Unported for CollaboRATE licensing conditions.

page 32 TeamSTEPPS® 2.0 AU Measurement Toolkit CONTENTSD
SDM-Q-9 The Shared Decision Making Questionnaire (SDM-Q-9)6 is a nine-item questionnaire that measures aspects of shared
decision making from the patient’s perspective; the SDM-Q-9-Doc7 measures the same concepts (see Box 11) from the clinician’s perspective. Also available are versions of the tool for paediatric nurses (PSDM-Q-NUR) and parents (PSDM-Q-PARENT). All four versions of the SDM-Q-9 are included in the Facilitation Guide. Organisations may wish to make these surveys available for online administration via SurveyMonkey.
See Creative Commons Attribution-NonCommercial-NoDerivs 4.0 International for SDM-Q-9 licensing conditions.
Box 11 | SDM-Q-9: Content of 9 items to measure shared decision making
Item Content
> Making clear that a decision is needed> Asking for the patient’s preferred involvement> Informing that different options exist to deal with the problem> Explaining advantages and disadvantages of each option> Investigating patient understanding and expectations> Identifying the patient’s preferred option> Weighing the different options> Making a shared decision> Agreeing on arrangements for how to proceed
Responses use a 6-point scale from ‘completely disagree’ to ‘completely agree’.
Shared decision making measures demonstrate the implementation of TeamSTEPPS® skills (Level III) as well as outcomes for patient care (Level IV).
References
1. Ervin K, Blackberry I & Haines H. 2016. Implementation of shared decision-making in Australia. APJHM;11:10-11.https://www.achsm.org.au/Public/Resources/Journal/Archives/Volume_11_Issue_2_2016.aspx
2. Trevena L, Shepherd HL, Bonner C et al.2017.Shared decision making in Australia. JEQHC;123:17-20.https://doi.org/10.1016/j.zefq.2017.05.011
3. Barr PJ, Thompson R, Walsh T et al. 2014. The psychometric properties of CollaboRATE. JMIR;16:e2.http://www.jmir.org/2014/1/e2/
4. Elwyn G, Barr PJ, Grande SW et al. 2013. Developing CollaboRATE. PEC;93:102-7. https://www.pec-journal.com/article/S0738-3991(13)00209-7/fulltext
5. Barr PJ, Forcino RC, Thompson R et al. 2017. Evaluating CollaboRATE in a clinical setting. BMJ Open;7:e014681.http://bmjopen.bmj.com/content/7/3/e014681
6. Kriston L, Scholl I, Holzel L et al. 2010.The 9-item Shared Decision Making Questionnaire (SDM-Q-9). PEC;80:94-9.https://www.pec-journal.com/article/S0738-3991(09)00450-9/fulltext
7. Scholl I, Kriston L, Dirmaier J et al. 2012. Development and psychometric properties of SDM-Q-Doc. PEC;88:284–290.https://www.pec-journal.com/article/S0738-3991(12)00118-8/fulltext
TeamSTEPPS® 2.0 AU Measurement Toolkit page 33 CONTENTSD
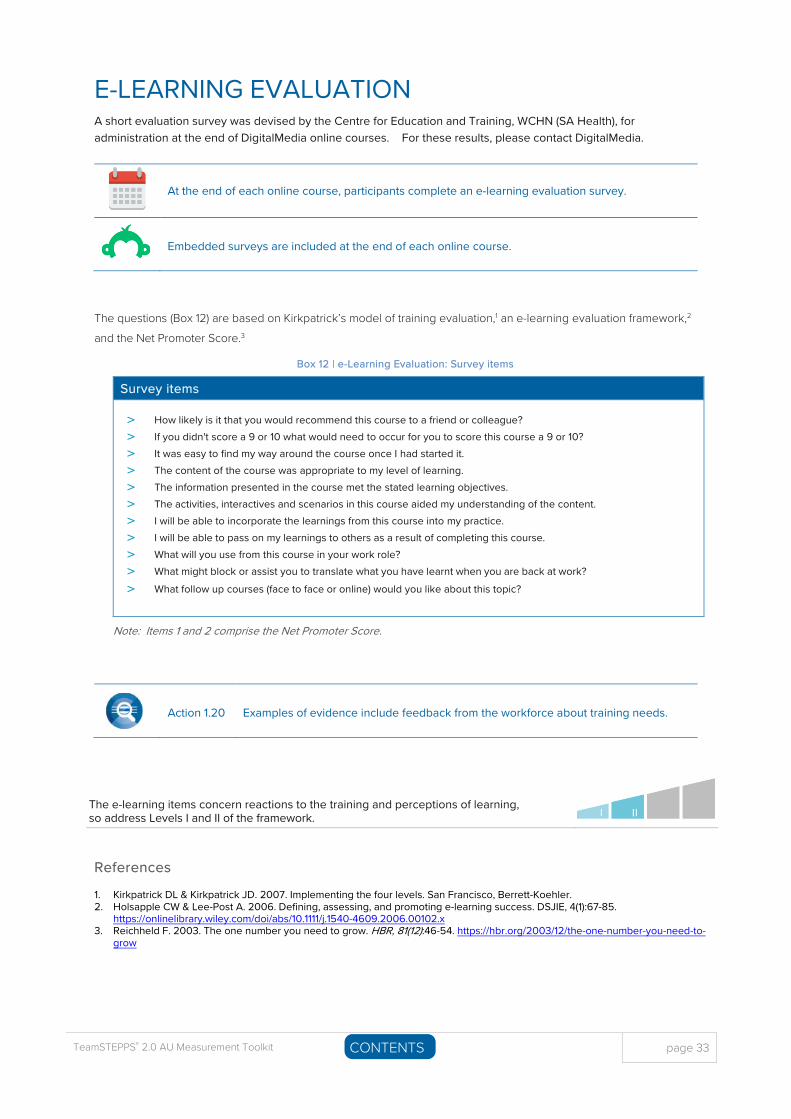
E-LEARNING EVALUATIONA short evaluation survey was devised by the Centre for Education and Training, WCHN (SA Health), for administration at the end of DigitalMedia online courses. For these results, please contact DigitalMedia.
At the end of each online course, participants complete an e-learning evaluation survey.
Embedded surveys are included at the end of each online course.
The questions (Box 12) are based on Kirkpatrick’s model of training evaluation,1 an e-learning evaluation framework,2 and the Net Promoter Score.3
Box 12 | e-Learning Evaluation: Survey items
Survey items
> How likely is it that you would recommend this course to a friend or colleague?> If you didn't score a 9 or 10 what would need to occur for you to score this course a 9 or 10?> It was easy to find my way around the course once I had started it.> The content of the course was appropriate to my level of learning.> The information presented in the course met the stated learning objectives.> The activities, interactives and scenarios in this course aided my understanding of the content.> I will be able to incorporate the learnings from this course into my practice.> I will be able to pass on my learnings to others as a result of completing this course.> What will you use from this course in your work role?> What might block or assist you to translate what you have learnt when you are back at work?> What follow up courses (face to face or online) would you like about this topic?
Note: Items 1 and 2 comprise the Net Promoter Score.
Action 1.20 Examples of evidence include feedback from the workforce about training needs.
The e-learning items concern reactions to the training and perceptions of learning, so address Levels I and II of the framework.
References
1. Kirkpatrick DL & Kirkpatrick JD. 2007. Implementing the four levels. San Francisco, Berrett-Koehler. 2. Holsapple CW & Lee-Post A. 2006. Defining, assessing, and promoting e-learning success. DSJIE, 4(1):67-85.
https://onlinelibrary.wiley.com/doi/abs/10.1111/j.1540-4609.2006.00102.x3. Reichheld F. 2003. The one number you need to grow. HBR, 81(12):46-54. https://hbr.org/2003/12/the-one-number-you-need-to-
grow

page 34 TeamSTEPPS® 2.0 AU Measurement Toolkit CONTENTSD
This page has been left intentionally blank
TeamSTEPPS® 2.0 AU Measurement Toolkit page 35 CONTENTS
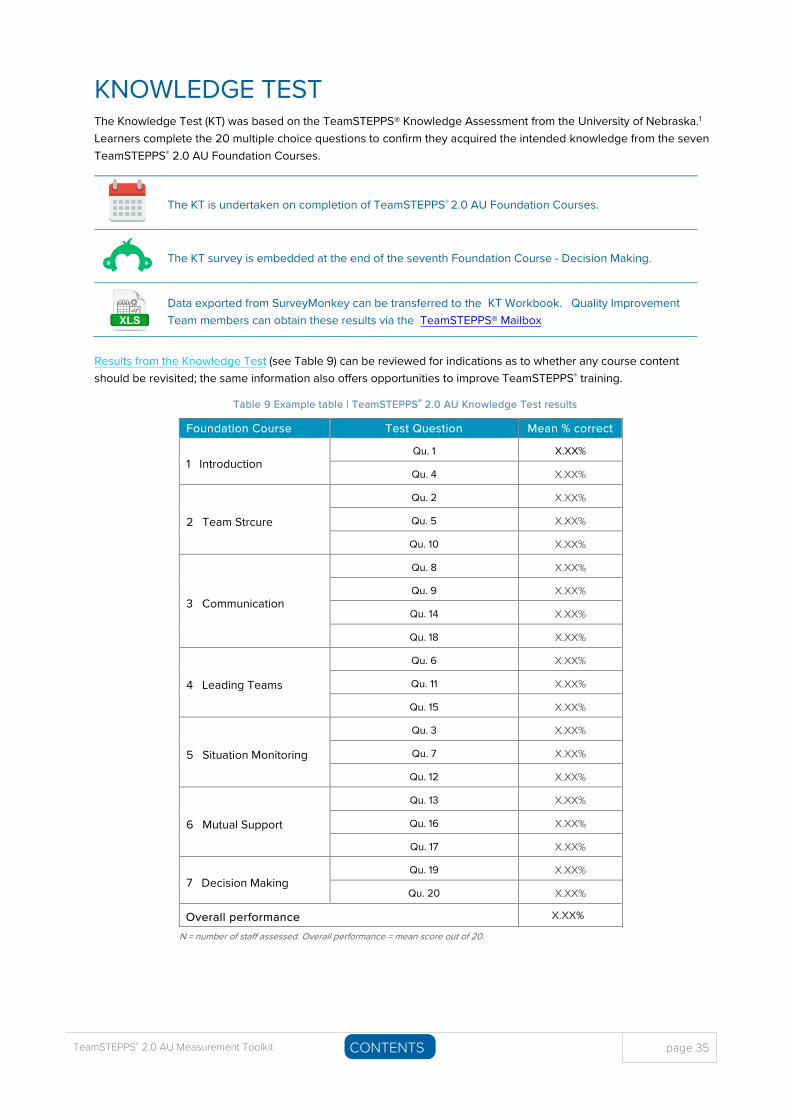
KNOWLEDGE TEST The Knowledge Test (KT) was based on the TeamSTEPPS® Knowledge Assessment from the University of Nebraska.1 Learners complete the 20 multiple choice questions to confirm they acquired the intended knowledge from the seven TeamSTEPPS® 2.0 AU Foundation Courses.
The KT is undertaken on completion of TeamSTEPPS® 2.0 AU Foundation Courses.
The KT survey is embedded at the end of the seventh Foundation Course - Decision Making.
Data exported from SurveyMonkey can be transferred to the KT Workbook. Quality Improvement Team members can obtain these results via the TeamSTEPPS® Mailbox
Results from the Knowledge Test (see Table 9) can be reviewed for indications as to whether any course content should be revisited; the same information also offers opportunities to improve TeamSTEPPS® training.
Table 9 Example table | TeamSTEPPS® 2.0 AU Knowledge Test results
Foundation Course Test Question Mean % correct
1 Introduction Qu. 1 X.XX%
Qu. 4 X.XX%
2 Team Strcure
Qu. 2 X.XX%
Qu. 5 X.XX%
Qu. 10 X.XX%
3 Communication
Qu. 8 X.XX%
Qu. 9 X.XX%
Qu. 14 X.XX%
Qu. 18 X.XX%
4 Leading Teams
Qu. 6 X.XX%
Qu. 11 X.XX%
Qu. 15 X.XX%
5 Situation Monitoring
Qu. 3 X.XX%
Qu. 7 X.XX%
Qu. 12 X.XX%
6 Mutual Support
Qu. 13 X.XX%
Qu. 16 X.XX%
Qu. 17 X.XX%
7 Decision Making Qu. 19 X.XX%
Qu. 20 X.XX%
Overall performance X.XX%
N = number of staff assessed. Overall performance = mean score out of 20.
page 36 TeamSTEPPS® 2.0 AU Measurement Toolkit CONTENTSD
The Knowledge Test is a Level II measure as it assesses the learning of content from TeamSTEPPS® 2.0 AU Foundation Courses.
References
1. Jones K. 2013. TeamSTEPPS Knowledge Assessment. University of Nebraska Medical Centre.https://www.unmc.edu/patient-safety/_documents/pre-post-teamstepps-training-knowledge-assessment.pdf
TeamSTEPPS® 2.0 AU Measurement Toolkit page 37 CONTENTSD
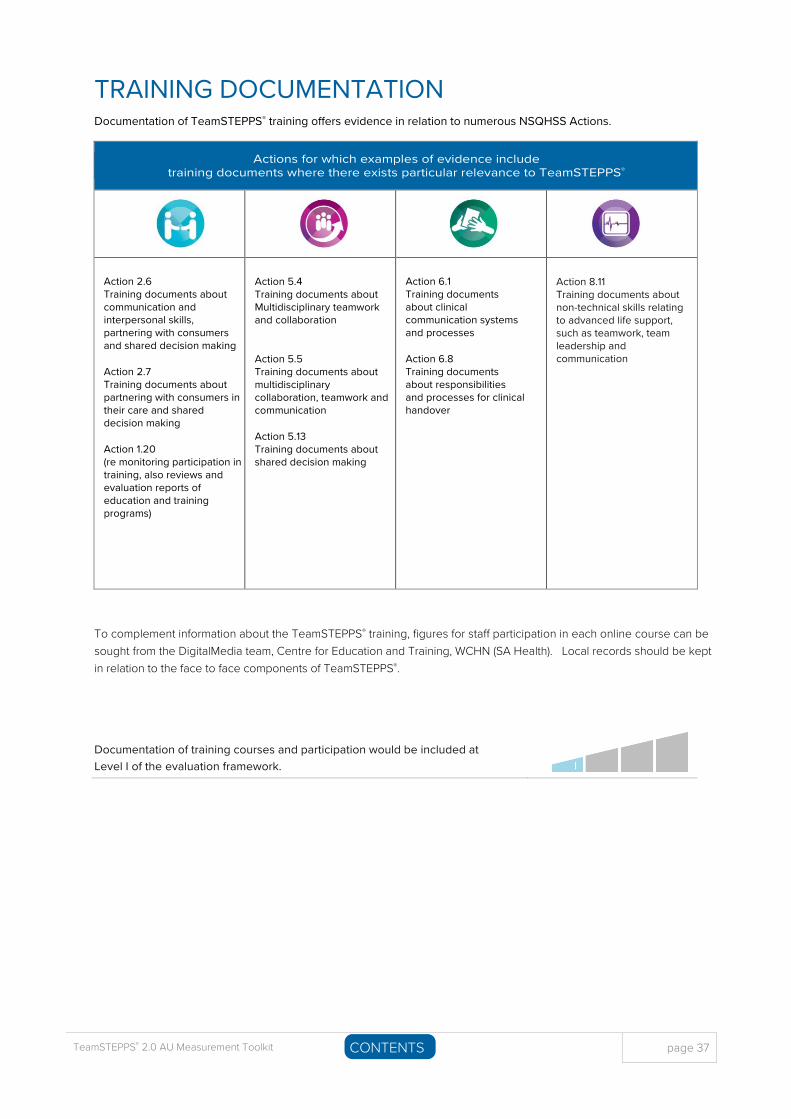
TRAINING DOCUMENTATION Documentation of TeamSTEPPS® training offers evidence in relation to numerous NSQHSS Actions.
Actions for which examples of evidence include training documents where there exists particular relevance to TeamSTEPPS®
Action 2.6 Training documents about communication and interpersonal skills, partnering with consumers and shared decision making
Action 2.7 Training documents about partnering with consumers in their care and shared decision making
Action 1.20 (re monitoring participation in training, also reviews and evaluation reports of education and training programs)
Action 5.4 Training documents about Multidisciplinary teamwork and collaboration
Action 5.5 Training documents about multidisciplinary collaboration, teamwork and communication
Action 5.13 Training documents about shared decision making
Action 6.1 Training documents about clinical communication systems and processes
Action 6.8 Training documents about responsibilities and processes for clinical handover
Action 8.11 Training documents about non-technical skills relating to advanced life support, such as teamwork, team leadership and communication
To complement information about the TeamSTEPPS® training, figures for staff participation in each online course can be sought from the DigitalMedia team, Centre for Education and Training, WCHN (SA Health). Local records should be kept in relation to the face to face components of TeamSTEPPS®.
Documentation of training courses and participation would be included at Level I of the evaluation framework.

For more informationSA Health TeamSTEPPS® Email: [email protected] © Department for Health and Wellbeing, Government of South Australia. All rights reserved. (TS Measurement Toolkit) v1.0 June 2018. For Official Use Only-I1-A1