Embed Size (px)
Citation preview
1
Measurement of Travel Behavior in a Trip-Based Survey Versus a Time Use Survey: A Comparative Analysis of Travel Estimates Using the 2001 National Household Travel
Survey and the 2003 American Time Use Survey
Jonaki Bose, Joy Sharp Bureau of Transportation Statistics, Department of Transportation, 400 Seventh Street, SW,
Washington DC 20590 I. Introduction There is an on-going discussion in the transportation community on whether trip-based travel surveys or activity-based surveys are more useful for understanding travel behavior. While it is acknowledged that activity surveys provide richer contextual information in understanding travel behavior, some research also suggests that activity surveys may provide better estimates of trips and certain travel characteristics, as compared to those surveys that focus solely on the activity of travel. In a review conducted by Harvey (2003), he reports that activity-based data collections collect more incidents of trip reports compared to trip-based data collections. In addition, he contends that the total amount of travel time reported in a given day is greater through time diaries rather than travel-based ones. Similar results were also substantiated in a synthesis conducted by Pendayla (2003). The objective of this work is to understand the nature of travel-related estimates from these two different kinds of surveys. This research uses data collected from the National Household Travel Survey (NHTS) collected in 2001 and 2002 and the recently released data from the 2003 American Time Use Survey (ATUS). During the earlier part of this decade, two large-scale national surveys were conducted in the United States – an activity-based time use survey (2003 ATUS) and a more traditional trip-based travel survey (2001 NHTS). The objectives of these surveys differed; however, given the timing and coverage of these data collection efforts, it allows for a unique opportunity to further examine travel-related estimates. The 2001 National Household Travel Survey collected nationally representative data from adults and children on both long distance and daily trips. For each respondent, all trips (i.e., defined as travel by any mode from one address to another) are recorded for a randomly designated day (24 hours). The 2003 American Time Use Survey collected data on activity segments for a 24-hour period from persons 15 and older, also on a randomly assigned day. For each respondent, distinct activities are recorded including travel or travel-related activities. For the most part, estimates made from the NHTS and ATUS are of comparable populations. NHTS includes data from persons of all ages, but can be restricted to those 15 and older. Data from both the NHTS and ATUS can be used to estimate total annual trips and the distribution of trips by purpose, mode, and other characteristics, although there are a few differences in how ‘trip’ can be defined across the two surveys. This paper examines the definitional and methodological differences between the surveys, and the potential impact they have on travel estimates. Travel data are used for many different purposes. Data from the NHTS survey is the only national source of information on the typical travel of U.S. residents, including the type and amount of travel, the use of different travel modes, the time and miles spent traveling for various purposes, ownership and use of the vehicle fleet, and how household composition and life-stage effects travel. The survey provides data on a wide range of topics needed to accurately describe
2
travel behavior and assess how it is changing over time. The survey also has many ancillary functions, such as: • Providing benchmark data to validate state and local surveys of travel. • Serving as the data source for the NCHRP 365 Trip Generation Rates. • Outlining trends in demands for transportation overall and by specific population groups,
such as the elderly, immigrants, women and workers. • Determining exposure for accident rate calculation and to broaden understanding of factors
relating to the safety of surface transportation. • Providing essential information on environmental impacts of travel, such as air-quality
analysis, and a source of data for examining environmental justice • Serving as a source for national trip-level data on walking, biking, and the use of transit,
including trends in these modes since 1969. • Providing information to support transportation planning and decision-making by all levels
of government and to help evaluate the effects of policy initiatives. II. Historical Review We reviewed prior research work in this area with two goals in mind. The first objective was to better understand the history of both travel and time use surveys in the context of travel research and to gain perspective on the key issues surrounding this topic. The second one was to ensure that the analysis we were considering was reasonable given the nature of the data and consistent with prior practice. Trip-based surveys have been traditionally used to obtain data needed for transportation planning and modeling. However, transportation planners and modelers have demonstrated increasing interest and need for activity-based approaches because they provide some context and additional dimensions around which travel occurs (e.g., Bhat 1997; Kalfs and Harvey 1997; Richardson 1997; Wen and Koppelman 2000; Harvey 2003; Pendayla 2003). Richardson (1997) indicated the need to better understand at-home activities that are a ‘clear substitute for corresponding out-of-home activities’ (like work) and ‘in-building activities’ such as going to a mall and shopping at multiple stores. Activity surveys over time might help get a sense of these substitution patterns. It has been argued that time use and travel researchers view time and space differently (Harvey 2003). Time use researchers look at time use carefully with some location detail, whereas travel diary studies generally focus on the where and how far much more, and don’t look beyond trip times (i.e., don’t examine the surroundings and other activities that drive travel.) There are few direct comparisons of data from time use surveys and activity-based surveys. Pas (1997) reported that in a pilot study for the Boston Area Travel Survey conducted by Stopher in 1992, activity diaries captured more non-home based trips and short, non-motorized trips. This assertion is repeated by different researchers, but there is not a lot of conclusive evidence. Harvey (2003) discusses work in 1983 that found that the process of identifying ‘trips out of context was more demanding and less intuitive.’ Pendyala (2003) postulates that, ‘Activity and time use surveys help respondents by jogging their memory about short and infrequent trips that may have been done during the day, linked trips that may have occurred in the context of multi-stop journeys, access and egress trips (segments) that occur in multi-modal journeys, and short stops (say, drop-off and pick-up passengers).’ He then asserts the need for future exploration where “. . . more
3
robust and controlled comparisons are warranted. Average trip rates, trip frequency distributions, and other measures emanating from the survey data sets should be compared across survey types. . . ” Thus this work is a wonderful opportunity to better understand the dynamics of reporting travel using a travel diary approach versus an activity-based approach. This research does not attempt to address questions related to the importance of obtaining contextual information in travel planning and modeling. These issues have been adequately addressed in previous research. Instead, it focuses on the key travel estimates collected or computed by both surveys and attempts to answer whether the common travel estimates produced are similar and, when differences exist, how might the methodological approaches used have impacted these estimates. III. Research Objectives This work was approached as a series of research questions. The following questions guided this research, and the paper presents our systematic effort to answer them. To answer the first seven questions, we attempt to create comparable definitions and categories across the two surveys, and then compare the resulting estimates for key travel estimates. After comparing these estimates, the final question is applied to each comparison in an attempt to explain differences in the estimates potentially resulting from the different definitional and methodological approaches. These differences are further explained and summarized in later sections of this paper.
1. Can comparable trips be created from the ATUS and the NHTS? 2. How do the ATUS and NHTS differ in their estimates of mean and median minutes spent traveling, total trips taken annually, and percent of persons not taking any trips on a given day? 3. For each ATUS ‘trip’ can we accurately identify a mode of transportation and are these mode categories comparable to the NHTS? If we are able to establish relatively similar mode categories—how do total numbers of annual trips and the distributions of trips by mode differ between the surveys? 4. For each ATUS ‘trip’ can we identify a purpose and are these purpose categories comparable to the NHTS? If we are able to establish relatively similar purpose categories—how do total numbers of annual trips and the distributions of trips by purpose differ between the surveys? 5. Are similar subgroup trends, for demographic characteristics such as sex, age, and worker status, visible for both surveys? 6. Are trip distributions by time of day and day of week comparable across surveys? 7. How do vehicle occupancy rates differ across the surveys? 8. Where differences exist, what are the potential causes for these differences? Do these differences suggest a potential preference in survey design or data collection methodology?
4
Again, the focus of this research is not to establish what is the ‘right’ or ‘best’ estimate. This work merely focuses on the nature of estimates resulting from the two surveys, and attempts to provide additional insight into those factors that might explain the differences in these estimates. IV. Survey Objectives and Design The National Household Travel Survey was a joint effort funded by two agencies within the Department of Transportation: the Bureau of Transportation Statistics (BTS) and the Federal Highway Administration (FHWA). The NHTS was designed to provide data on the full continuum of personal travel in the United States. This survey collected information on daily trips, as well as long distance travel of 50 miles or more. These data allow policy makers, analysts and researchers to accurately describe travel behavior, assess how it is changing over time, and make informed choices regarding transportation planning and policy. Until recently, it was the only national source of information on the typical travel of people in the country, and provided valuable information, such as: overall trip estimates for local and long-distance travel; amount of travel by purpose and mode; time and miles spent traveling; automobile ownership and use of the vehicle fleet; and travel differences across various demographic characteristics and by household composition.
The NHTS collected information from people in over 26,000 households across the country, resulting in approximately 62,000 person interviews. The data were collected by computer-assisted telephone interviews with a nationally representative sample of households selected from a random digit dial (RDD) sample. Each person in a sample household was asked to describe all trips made during a specified one-day period, referred to as travel day. This day was kept constant and could not change. Interviews were attempted during a 6-day window starting the day immediately following the assigned travel day. A travel diary was sent in advance to assist the respondent in recording trips and also assist in defining trips. In addition, respondents also provided information on their long distance travel, that is, trips of 50 or more miles away from home during a four-week period. (Trip information from the long distance section of the NHTS is not used in these analyses, although these trips or segments of these trips may be captured for the travel day if they occurred on this day.) Interviews were attempted with every member of the household and proxy reporting was allowed, albeit only in very limited situations. Data collection spanned 13 months, from April 2001 through May 2002, to be able to capture seasonal effects in travel. The American Time Use Survey (ATUS), sponsored by the Bureau of Labor Statistics, is the first federally administered, continuous survey on time use in the United States. The goal of the survey is to produces nationally representative estimates on the activities Americans spend their time. In ATUS, individuals are randomly selected from a subset of households that have completed their eighth and final month of interviews for the Current Population Survey (CPS). The CPS, thus the ATUS, employs an area probability sample design. ATUS respondents are interviewed only one time about how they spent their time on the previous day, where they were, and whom they were with. Interviews are completed by telephone during a specified day. This day is constant (i.e., always a Tuesday), but is allowed to change to subsequent weeks (up to eight) if the respondent is not reached during the first or subsequent attempts. Interviews are conducted the day immediately following the specified reporting day. All information for the 24-hour reporting period is captured by recall; a time diary or other respondent aid is not sent in
5
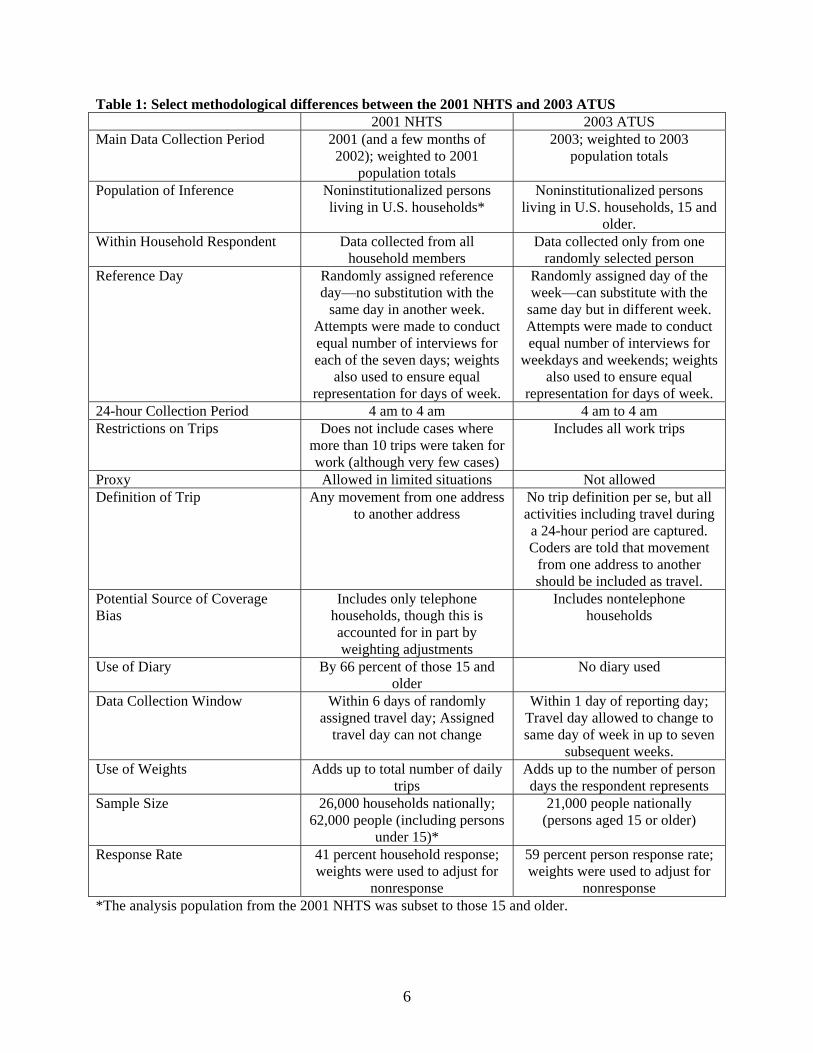
advance. Only one person per household is interviewed and proxy reporting is not allowed. Interviews were conducted during the 2003 calendar year and resulted in 21,000 completed person interviews with respondents 15 years old and older. The ATUS provides information on the amount of time people spend in many activities, with a particular focus on work and unpaid work activities. However, other activities are also captured, such as time spent socializing, leisure and, of interest in this research, transportation-related activities. Similar to the NHTS, the ATUS also collects information about where and with whom each activity occurred, and household and personal demographic characteristics —including sex, race, age, occupation, income, and household composition. The conduct of these two surveys provides a unique opportunity to compare travel estimates generated by these two large-scale, national data collection efforts. Given that this is not a true experimental design there are a number of ‘real-world’ constraints on comparing data from these two sources. These differences must also be acknowledged when comparing estimates between these two surveys. Table 1 illustrates some of the differences in methodological approaches.
6
Table 1: Select methodological differences between the 2001 NHTS and 2003 ATUS 2001 NHTS 2003 ATUS Main Data Collection Period 2001 (and a few months of
2002); weighted to 2001 population totals
2003; weighted to 2003 population totals
Population of Inference Noninstitutionalized persons living in U.S. households*
Noninstitutionalized persons living in U.S. households, 15 and
older. Within Household Respondent Data collected from all
household members Data collected only from one
randomly selected person Reference Day Randomly assigned reference
day—no substitution with the same day in another week.
Attempts were made to conduct equal number of interviews for each of the seven days; weights
also used to ensure equal representation for days of week.
Randomly assigned day of the week—can substitute with the
same day but in different week. Attempts were made to conduct equal number of interviews for
weekdays and weekends; weights also used to ensure equal
representation for days of week. 24-hour Collection Period 4 am to 4 am 4 am to 4 am Restrictions on Trips Does not include cases where
more than 10 trips were taken for work (although very few cases)
Includes all work trips
Proxy Allowed in limited situations Not allowed Definition of Trip Any movement from one address
to another address No trip definition per se, but all activities including travel during a 24-hour period are captured. Coders are told that movement
from one address to another should be included as travel.
Potential Source of Coverage Bias
Includes only telephone households, though this is accounted for in part by weighting adjustments
Includes nontelephone households
Use of Diary By 66 percent of those 15 and older
No diary used
Data Collection Window Within 6 days of randomly assigned travel day; Assigned
travel day can not change
Within 1 day of reporting day; Travel day allowed to change to same day of week in up to seven
subsequent weeks. Use of Weights Adds up to total number of daily
trips Adds up to the number of person days the respondent represents
Sample Size 26,000 households nationally; 62,000 people (including persons
under 15)*
21,000 people nationally (persons aged 15 or older)
Response Rate 41 percent household response; weights were used to adjust for
nonresponse
59 percent person response rate; weights were used to adjust for
nonresponse *The analysis population from the 2001 NHTS was subset to those 15 and older.
7
V. Results Given these methodological and definitional differences, we attempted to manipulate both data sets to see if comparable trip definitions as well as mode and purpose categories could be established in order to make estimates from the surveys more comparable. 1. Can comparable trips be created from the ATUS and the NHTS? Each trip captured in the NHTS is included as a separate record on the NHTS data file. During the interview, a trip was clearly defined to the respondent (i.e., each time you go from one address to another) and also supported by interview materials sent in advance of the interview (i.e., a travel diary). The ATUS on the other hand, captures all activities of any nature for the 24-hour reference period by respondent recall. Trips or travel were not pre-defined by the interviewer or survey materials; travel and travel-related activities are coded during and after the interview. Even so, to a major extent trips derived from the ATUS based on travel activities are highly comparable to the NHTS. There are however, a few areas where there are differences in how trips are defined and/or are coded: a. In the NHTS only travel activities where the person goes from one address to another address
is included as a trip. There are travel activities in the ATUS that would not be included in the NHTS. These activities can be identified as those having no valid mode of conveyance associated with then, and instead having a place code (as in “where did the activity occur”). Examples of activities coded as travel (TUTIER1CODE=’17’) include waiting for a bus or going through a drive-through. The first few tables in this section examine basic trip characteristics from the ATUS a) if all the travel cases are included regardless of whether travel activities only have a place code (i.e., no associated mode), and b) if travel activities with a place code only are not included.
b. In the NHTS transit trips include the mode and time spent getting to the transit mode, the
time spent waiting and then again from the transit mode to the final destination. In the ATUS, each of the activities is recorded separately. Consider the example of a person who walked to the bus stop, waited 10 minutes, rode the bus for 30 minutes, and then walked to work. The NHTS would record that as one bus trip. The ATUS would record this sequence as a series of four travel activities—walking to the bus stop, waiting for the bus, riding the bus, and walking to work. In order to make data from the two surveys relatively comparable either the activities in NHTS would have to be broken out or the activities from the ATUS would have to be chained together to form one trip. In this effort, we chose to chain transit travel events, i.e., ‘trip chain’ in the ATUS, and then examine its effect on total counts.
c. Trips that start and end at home, but involve walking, running or biking outdoors for any
reason are included in the NHTS as trips. For example, if a person walked around the block it would be counted as two trips in the NHTS—one to the furthest point the person went and the second trip would be the return trip from that point. In the ATUS these trips are coded in a couple of different places (i.e., sometimes as travel-related codes, but other times as ‘exercise’.). We examine these cases further, but do not make an attempt to isolate potential
8
‘exercise trips’ due to too many uncertainties. For example, for trips coded in the ATUS as ‘walks for exercise’, it is impossible to tell which were walks around the neighborhood (defined as a ‘trip’ in the NHTS) versus walks taken in a gym, around a track, etc. (not a trip in the NHTS). Therefore, these are not included in the ATUS files used for this research. Given the relatively small number of potential trips defined as exercise, excluding these should have minimal impact on most estimates; however, they are likely to have a more significant impact on the number of walk trips and therefore overall modal distributions. This is further discussed in appendix A on data issues.
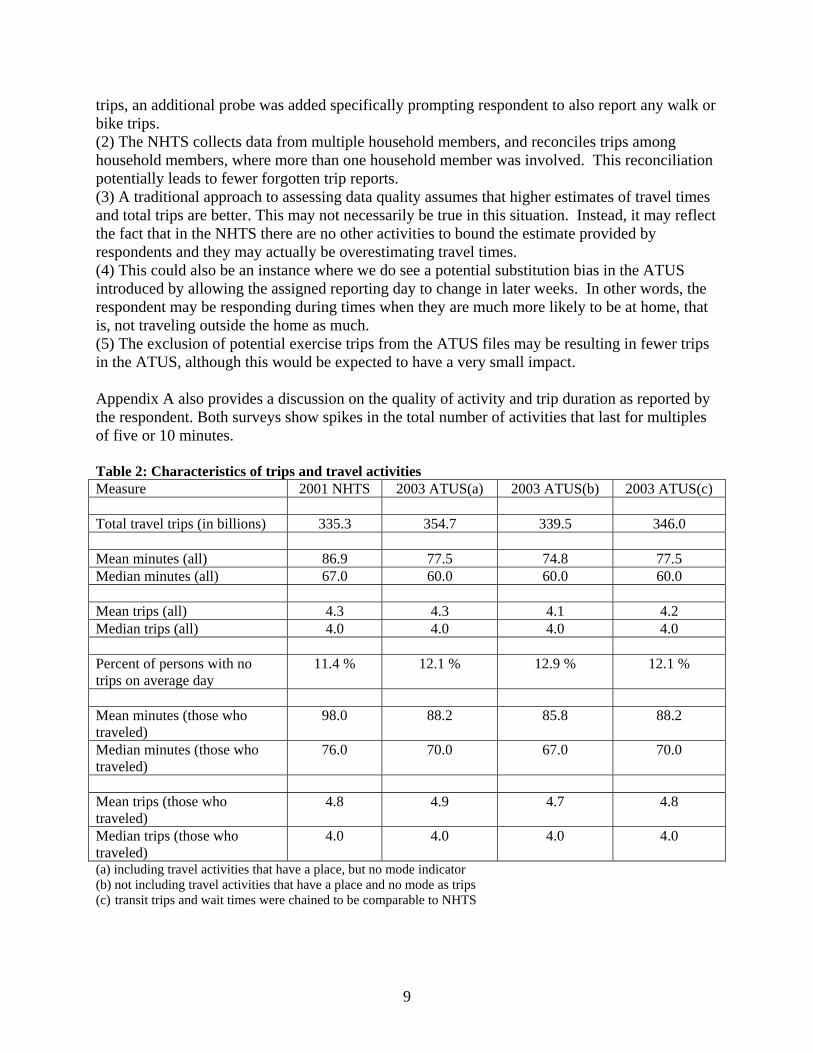
2. How do the ATUS and NHTS differ in their estimates of mean and median minutes spent traveling, total trips taken annually, and percent of persons not taking any trips on a given day? Table 2 compares basic trip estimates1 computed from both surveys, including total number of trips, average number of trips, and average daily trip times. We examine trips derived from three different ATUS files: a) where all the cases are included, even those with trips without a mode and without any transit trip chains created ; b) where cases without a valid mode code are not included, and; c) where transit trips are trip chained when appropriate and cases without an associated mode are included. While the file coded as ATUS (c) appears to be the most closely matched with the NHTS file in terms of trip definition, and thereby used in most statistical comparisons, we also display estimates from files a) and b) as a means of demonstrating the differences that can exist in travel estimates due to definitional and methodological differences. As shown in table 2, the estimates between the two surveys look very similar. Table 2 shows an ATUS estimate between 340 and 356 billion annual trips nationally compared to 335 billion trips from the NHTS. Further, if we adjust the total number of trips recorded by the NHTS for population growth between 2001 and 2003 (and assume travel behavior is constant), then the estimates are even closer. Assuming a 2.4 percent growth2 between 2001 and 2003 for the U.S. population 15 and older leads to an adjusted value of 343.4 billion trips based on the NHTS, which is not statistically different from the ATUS(c) estimate of 346.0 billion. Contrary to our expectations from prior research, the total number of trips in the NHTS per person and correspondingly, the total time spent in travel, is not lower in the NHTS compared to the ATUS. In fact, travel time is lower in the ATUS. It has been suggested that activity-based data collections would be expected to record more trips per person and therefore longer time spent in travel because the respondent has to account for every minute. There are a number of reasons (or a combination of reasons) that may shed light on why we might be seeing different results: (1) Recognizing undercounts of walk and bike trips in previous surveys, the 2001 NHTS added additional measures to ensure these types of more incidental trips were captured. A trip diary with illustrations of desired trips was provided to the respondent in advance. (Almost two-thirds of those 15 and older reported using a travel diary.) In addition, after collecting a respondent’s
1 Appendix A contains technical details on the files and weights used to generate estimates as well as details on variance estimation. Appendix B contains the standard errors for all estimates presented in this report. 2 Population estimates for 2001 and 2003 downloaded on 4 August 2005 from http://www.census.gov/popest/national/asrh/NC-EST2004/NC-EST2004-01.xls
9
trips, an additional probe was added specifically prompting respondent to also report any walk or bike trips. (2) The NHTS collects data from multiple household members, and reconciles trips among household members, where more than one household member was involved. This reconciliation potentially leads to fewer forgotten trip reports. (3) A traditional approach to assessing data quality assumes that higher estimates of travel times and total trips are better. This may not necessarily be true in this situation. Instead, it may reflect the fact that in the NHTS there are no other activities to bound the estimate provided by respondents and they may actually be overestimating travel times. (4) This could also be an instance where we do see a potential substitution bias in the ATUS introduced by allowing the assigned reporting day to change in later weeks. In other words, the respondent may be responding during times when they are much more likely to be at home, that is, not traveling outside the home as much. (5) The exclusion of potential exercise trips from the ATUS files may be resulting in fewer trips in the ATUS, although this would be expected to have a very small impact. Appendix A also provides a discussion on the quality of activity and trip duration as reported by the respondent. Both surveys show spikes in the total number of activities that last for multiples of five or 10 minutes. Table 2: Characteristics of trips and travel activities Measure 2001 NHTS 2003 ATUS(a) 2003 ATUS(b) 2003 ATUS(c) Total travel trips (in billions) 335.3 354.7 339.5 346.0 Mean minutes (all) 86.9 77.5 74.8 77.5 Median minutes (all) 67.0 60.0 60.0 60.0 Mean trips (all) 4.3 4.3 4.1 4.2 Median trips (all) 4.0 4.0 4.0 4.0 Percent of persons with no trips on average day
11.4 % 12.1 % 12.9 % 12.1 %
Mean minutes (those who traveled)
98.0 88.2 85.8 88.2
Median minutes (those who traveled)
76.0 70.0 67.0 70.0
Mean trips (those who traveled)
4.8 4.9 4.7 4.8
Median trips (those who traveled)
4.0 4.0 4.0 4.0
(a) including travel activities that have a place, but no mode indicator (b) not including travel activities that have a place and no mode as trips (c) transit trips and wait times were chained to be comparable to NHTS
10
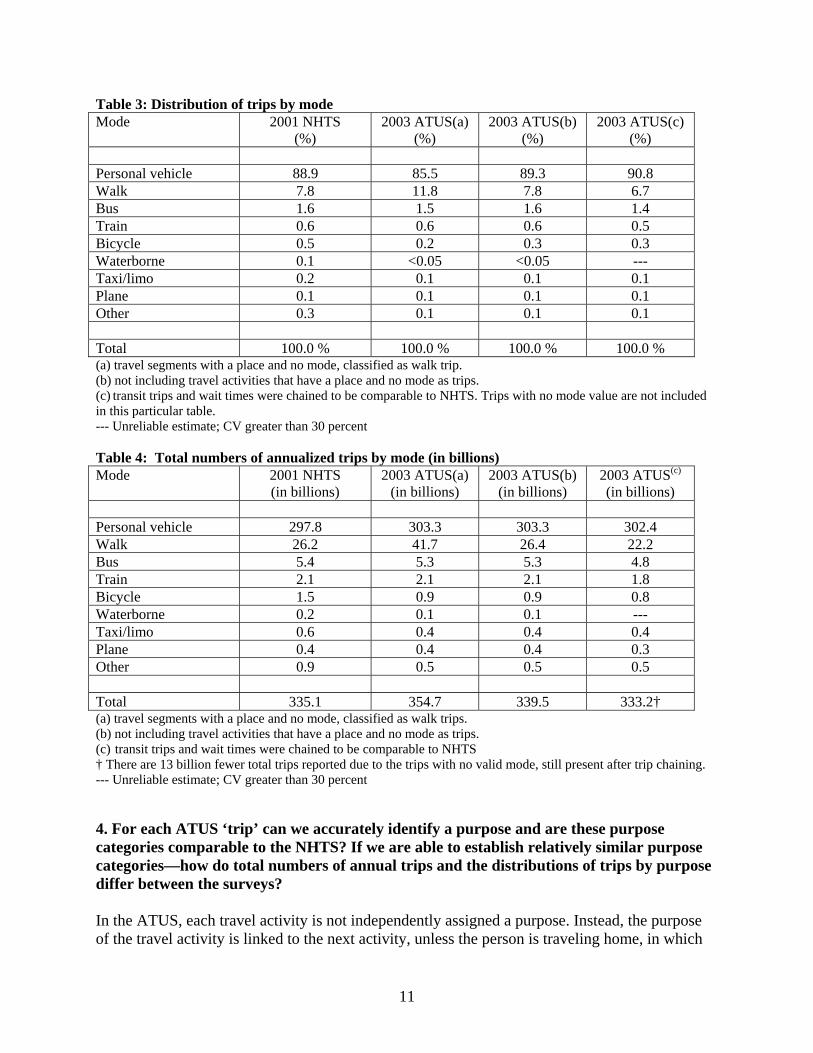
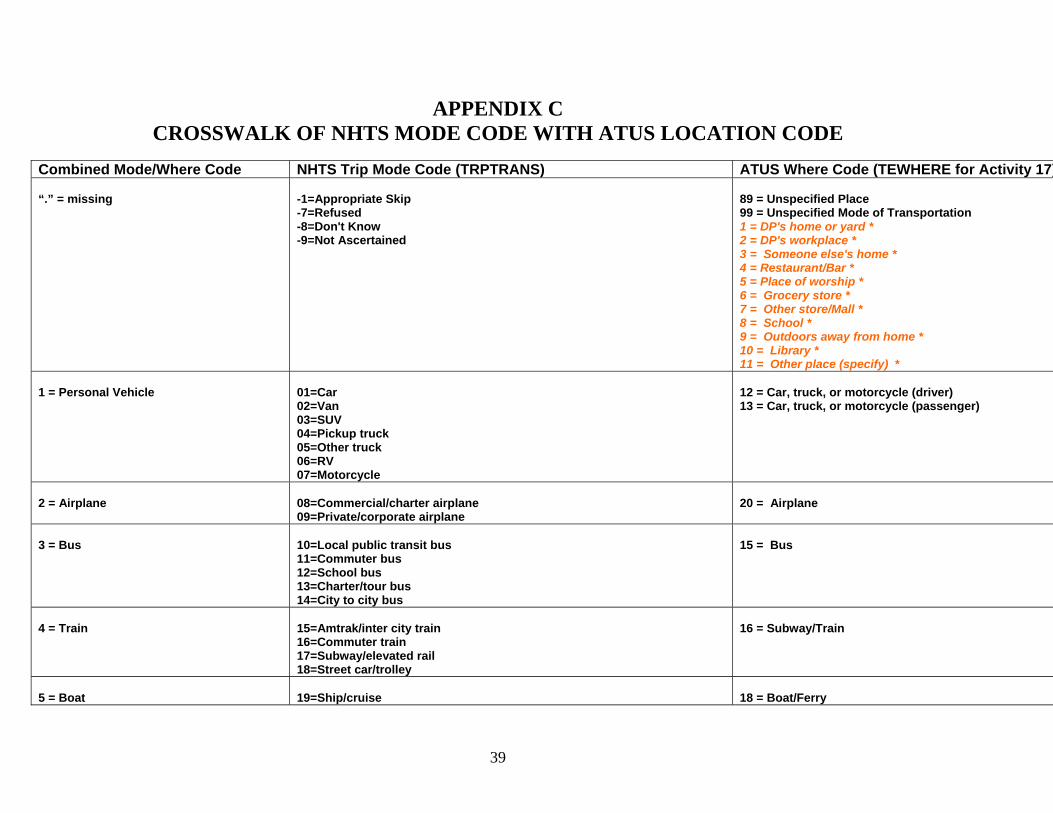
Recent research conducted in France and Belgium comparing trip-based and time use surveys (Armoogum et al. 2004) has further suggested that time use surveys produce lower immobility rates. This result, however, is not demonstrated in this analysis. Both surveys report a very similar percentage of persons not traveling on an average day, with a slightly higher immobility rate for the ATUS (12.1 percent as compared to 11.4 percent in the NHTS). 3. For each ATUS ‘trip’ can we accurately identify a mode of transportation and are these mode categories comparable to the NHTS? If we are able to establish relatively similar mode categories—how do total numbers of annual trips and the distributions of trips by mode differ between the surveys? The ATUS captures the location where an activity takes place, including a number of transportation-related mode categories. However, there are a few issues to consider when examining mode. First, the ATUS does not capture the same level of modal detail as the NHTS. The NHTS categories can be collapsed, for the most part, and crosswalked to the ATUS travel categories to make them comparable. Nine such categories were used in this comparison: 1) personal vehicle; 2) walk; 3) bus; 4) train; 5) bicycle; 6) waterborne modes; 7); taxi or limousine; 8) airplane; and 9) other. (See appendix C for the crosswalk between NHTS mode categories and ATUS location codes.) The second issue, as discussed earlier, relates to the 15 billion travel activities in the ATUS that do not have an associated mode. Some of these travel activities include for example, waiting outdoors for the bus. Even after accounting for travel activities that involve waiting for public transit by creating a transit trip chain record, there are about 13 billion travel activities (i.e., between three and four percent of all activities with travel-related codes) without an associated mode code. (See appendix A for a more detailed discussion of these cases.) Despite these issues, once again the distribution of trips by mode across the two surveys looks remarkably similar (table 3). The only substantively significant difference in mode distribution occurs in the ‘walk’ category; however, this could easily be a result of coding travel-related activities with no mode or coded as exercise as previously discussed. This result is further substantiated in table 4 which displays overall trip estimates by mode. Again, the only substantial statistical difference between trip estimates by mode occurs for the ‘walk’ category. There are other significant differences in percent distributions and totals, such as personal vehicle and bicycle trips, but substantively the differences are not as meaningful.
11
Table 3: Distribution of trips by mode Mode 2001 NHTS
(%) 2003 ATUS(a)
(%) 2003 ATUS(b)
(%) 2003 ATUS(c)
(%)
Personal vehicle 88.9 85.5 89.3 90.8 Walk 7.8 11.8 7.8 6.7 Bus 1.6 1.5 1.6 1.4 Train 0.6 0.6 0.6 0.5 Bicycle 0.5 0.2 0.3 0.3 Waterborne 0.1 <0.05 <0.05 --- Taxi/limo 0.2 0.1 0.1 0.1 Plane 0.1 0.1 0.1 0.1 Other 0.3 0.1 0.1 0.1 Total 100.0 % 100.0 % 100.0 % 100.0 % (a) travel segments with a place and no mode, classified as walk trip. (b) not including travel activities that have a place and no mode as trips. (c) transit trips and wait times were chained to be comparable to NHTS. Trips with no mode value are not included in this particular table. --- Unreliable estimate; CV greater than 30 percent Table 4: Total numbers of annualized trips by mode (in billions) Mode 2001 NHTS
(in billions) 2003 ATUS(a)
(in billions) 2003 ATUS(b)
(in billions) 2003 ATUS(c)
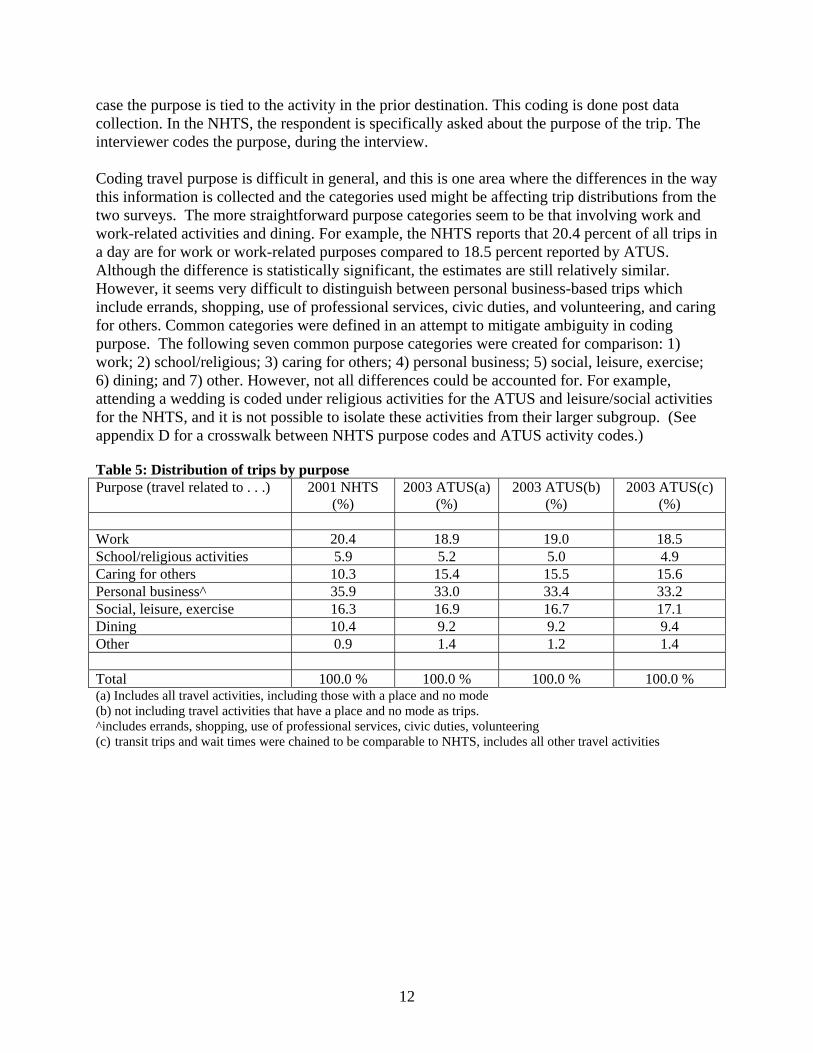
(in billions) Personal vehicle 297.8 303.3 303.3 302.4 Walk 26.2 41.7 26.4 22.2 Bus 5.4 5.3 5.3 4.8 Train 2.1 2.1 2.1 1.8 Bicycle 1.5 0.9 0.9 0.8 Waterborne 0.2 0.1 0.1 --- Taxi/limo 0.6 0.4 0.4 0.4 Plane 0.4 0.4 0.4 0.3 Other 0.9 0.5 0.5 0.5 Total 335.1 354.7 339.5 333.2† (a) travel segments with a place and no mode, classified as walk trips. (b) not including travel activities that have a place and no mode as trips. (c) transit trips and wait times were chained to be comparable to NHTS † There are 13 billion fewer total trips reported due to the trips with no valid mode, still present after trip chaining. --- Unreliable estimate; CV greater than 30 percent 4. For each ATUS ‘trip’ can we accurately identify a purpose and are these purpose categories comparable to the NHTS? If we are able to establish relatively similar purpose categories—how do total numbers of annual trips and the distributions of trips by purpose differ between the surveys? In the ATUS, each travel activity is not independently assigned a purpose. Instead, the purpose of the travel activity is linked to the next activity, unless the person is traveling home, in which
12
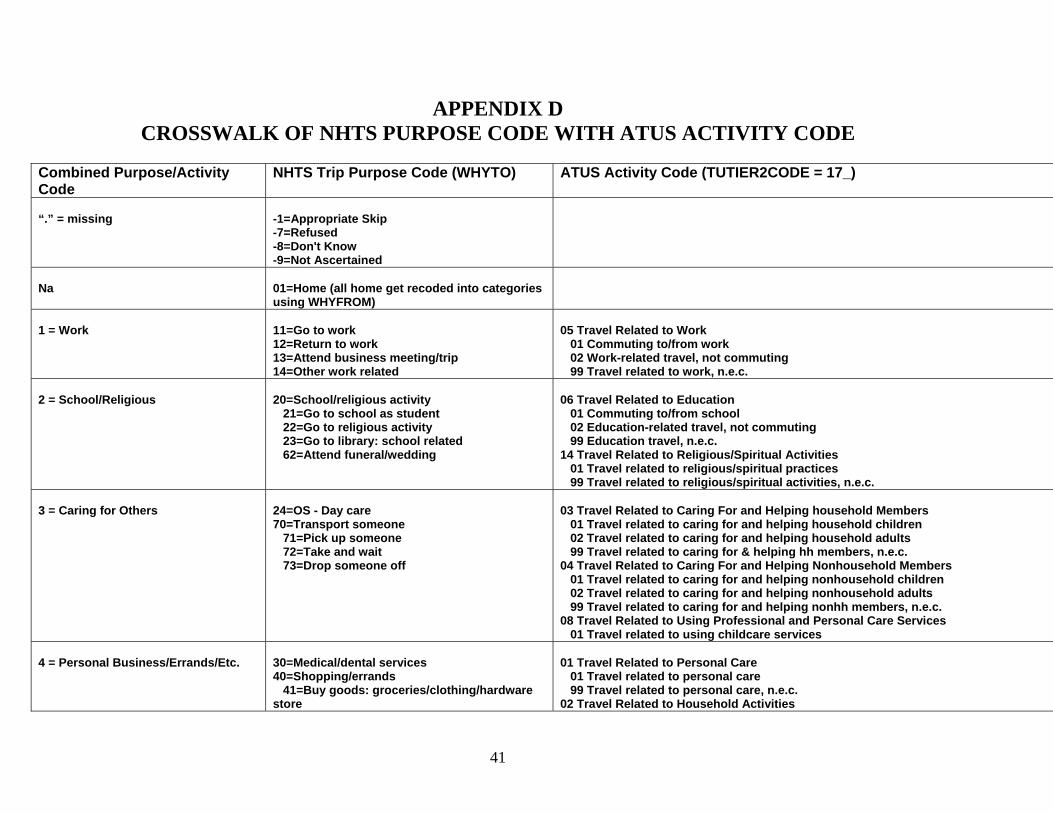
case the purpose is tied to the activity in the prior destination. This coding is done post data collection. In the NHTS, the respondent is specifically asked about the purpose of the trip. The interviewer codes the purpose, during the interview. Coding travel purpose is difficult in general, and this is one area where the differences in the way this information is collected and the categories used might be affecting trip distributions from the two surveys. The more straightforward purpose categories seem to be that involving work and work-related activities and dining. For example, the NHTS reports that 20.4 percent of all trips in a day are for work or work-related purposes compared to 18.5 percent reported by ATUS. Although the difference is statistically significant, the estimates are still relatively similar. However, it seems very difficult to distinguish between personal business-based trips which include errands, shopping, use of professional services, civic duties, and volunteering, and caring for others. Common categories were defined in an attempt to mitigate ambiguity in coding purpose. The following seven common purpose categories were created for comparison: 1) work; 2) school/religious; 3) caring for others; 4) personal business; 5) social, leisure, exercise; 6) dining; and 7) other. However, not all differences could be accounted for. For example, attending a wedding is coded under religious activities for the ATUS and leisure/social activities for the NHTS, and it is not possible to isolate these activities from their larger subgroup. (See appendix D for a crosswalk between NHTS purpose codes and ATUS activity codes.) Table 5: Distribution of trips by purpose Purpose (travel related to . . .) 2001 NHTS
(%) 2003 ATUS(a)
(%) 2003 ATUS(b)
(%) 2003 ATUS(c)
(%) Work 20.4 18.9 19.0 18.5 School/religious activities 5.9 5.2 5.0 4.9 Caring for others 10.3 15.4 15.5 15.6 Personal business^ 35.9 33.0 33.4 33.2 Social, leisure, exercise 16.3 16.9 16.7 17.1 Dining 10.4 9.2 9.2 9.4 Other 0.9 1.4 1.2 1.4 Total 100.0 % 100.0 % 100.0 % 100.0 % (a) Includes all travel activities, including those with a place and no mode (b) not including travel activities that have a place and no mode as trips. ^includes errands, shopping, use of professional services, civic duties, volunteering (c) transit trips and wait times were chained to be comparable to NHTS, includes all other travel activities
13
Table 6: Total numbers of annualized trips by purpose (in billions) Purpose (travel related to . . .) 2001 NHTS
(in billions) 2003 ATUS(a)
(in billions) 2003 ATUS(b)
(in billions) 2003 ATUS(c)
(in billions) Work 68.4 67.0 64.4 63.8 School/religious activities 19.6 18.4 17.0 17.1 Caring for others 34.4 54.4 52.6 54.0 Personal business^ 120.3 116.9 113.3 114.9 Social, leisure, exercise 54.7 60.1 56.8 59.1 Dining 34.7 32.7 31.4 32.4 Other 2.9 5.1 4.1 4.7 Total 334.9 354.7 339.5 346.0 (a) Includes all travel activities, including those with a place and no mode (b) not including travel activities that have a place and no mode as trips. ^includes errands, shopping, use of professional services, civic duties, volunteering (c) transit trips and wait times were chained to be comparable to NHTS, includes all other travel activities
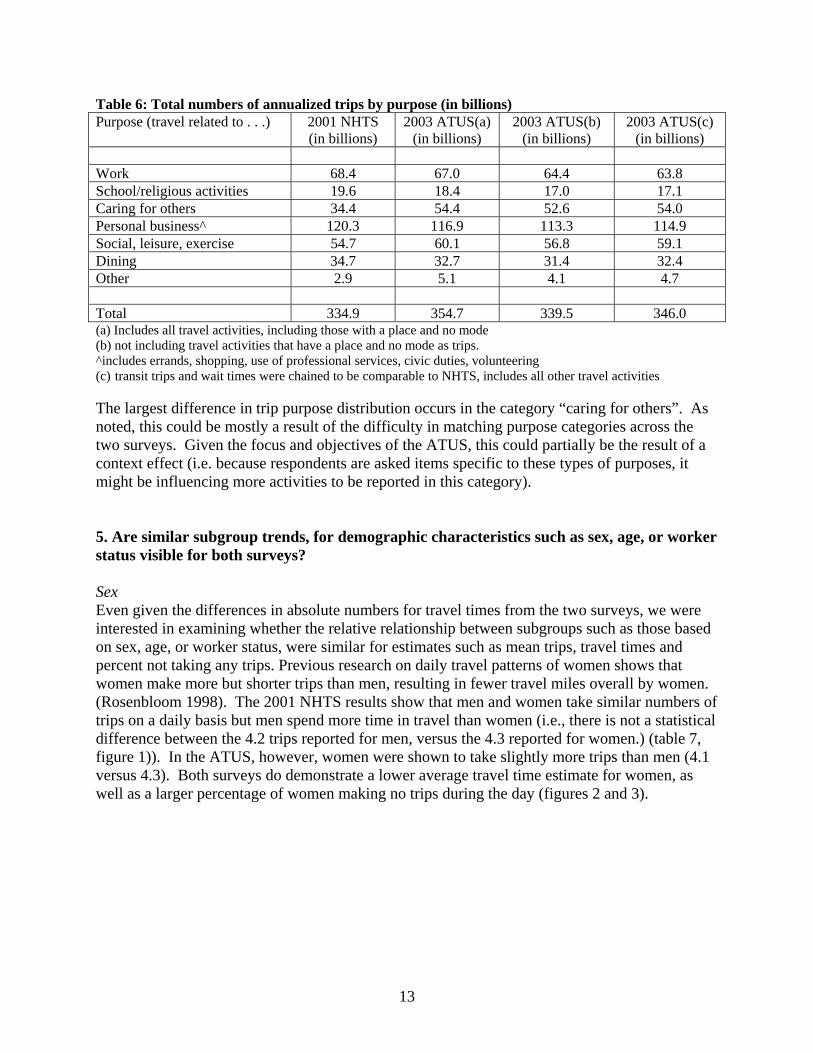
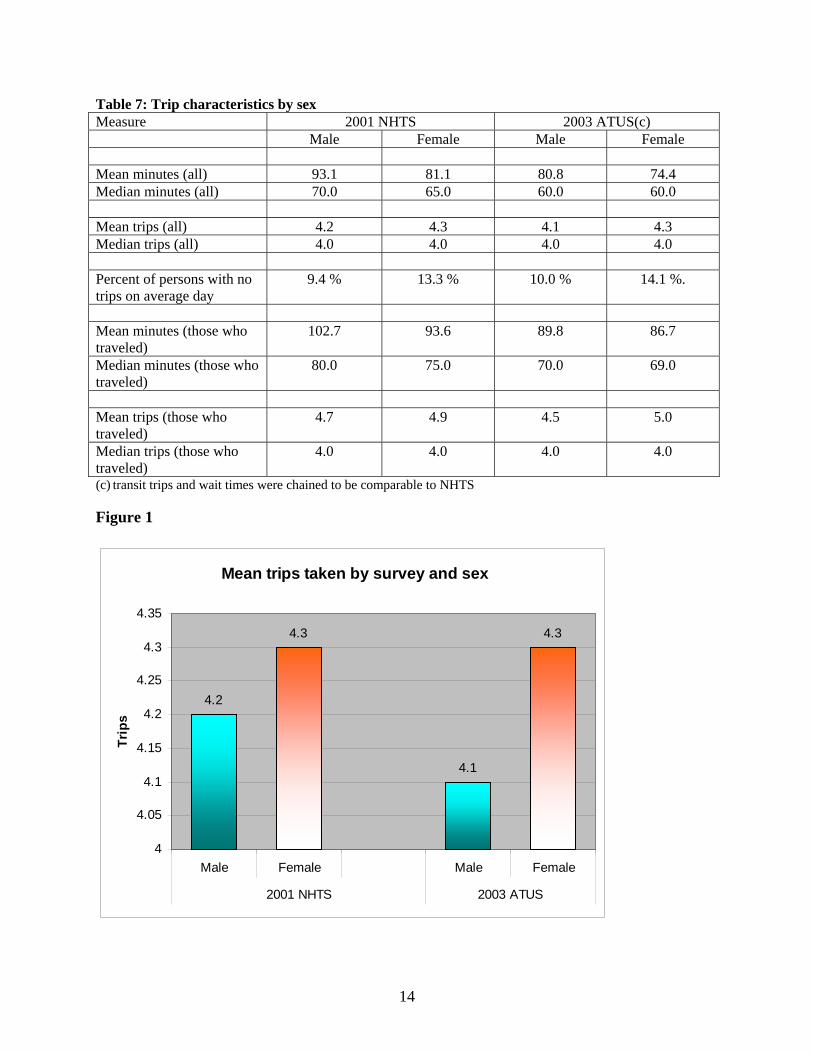
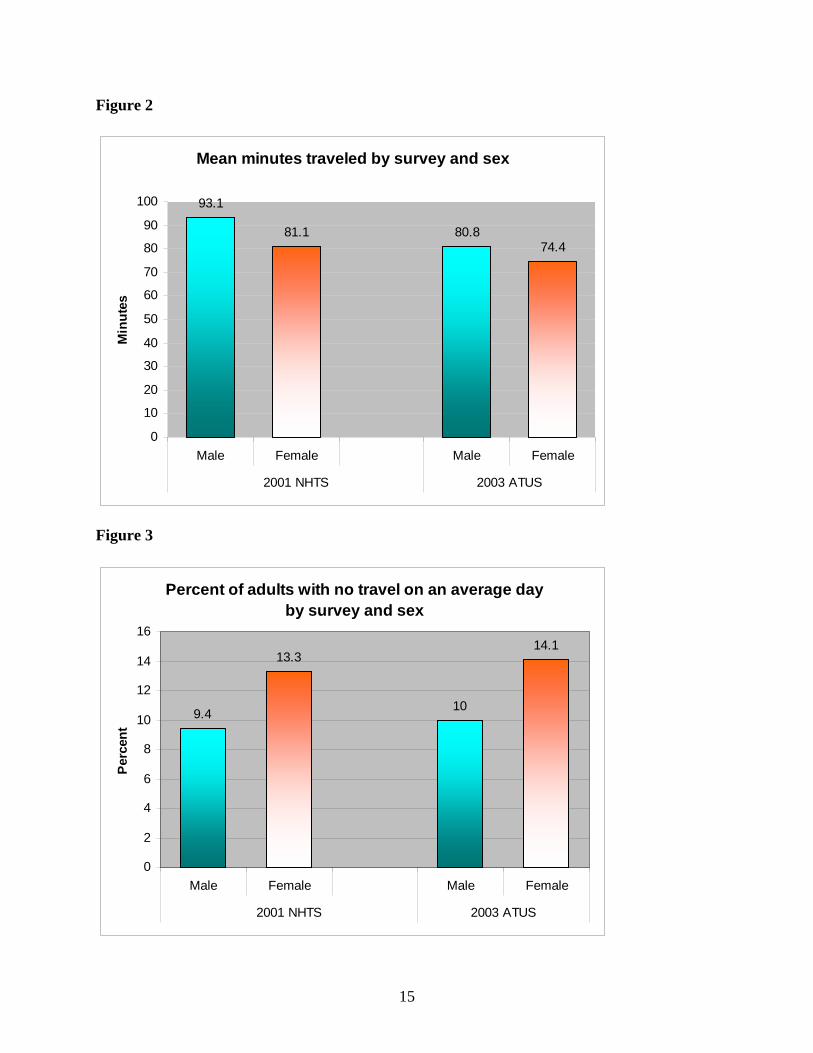
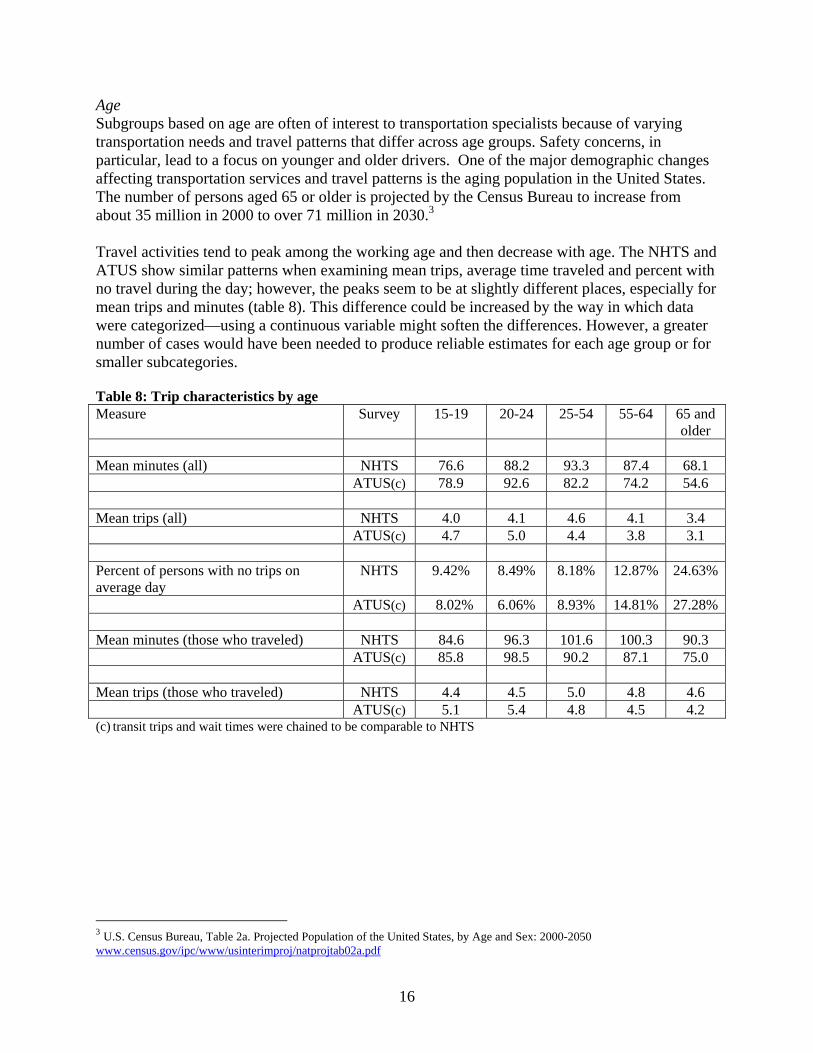
The largest difference in trip purpose distribution occurs in the category “caring for others”. As noted, this could be mostly a result of the difficulty in matching purpose categories across the two surveys. Given the focus and objectives of the ATUS, this could partially be the result of a context effect (i.e. because respondents are asked items specific to these types of purposes, it might be influencing more activities to be reported in this category). 5. Are similar subgroup trends, for demographic characteristics such as sex, age, or worker status visible for both surveys? Sex Even given the differences in absolute numbers for travel times from the two surveys, we were interested in examining whether the relative relationship between subgroups such as those based on sex, age, or worker status, were similar for estimates such as mean trips, travel times and percent not taking any trips. Previous research on daily travel patterns of women shows that women make more but shorter trips than men, resulting in fewer travel miles overall by women. (Rosenbloom 1998). The 2001 NHTS results show that men and women take similar numbers of trips on a daily basis but men spend more time in travel than women (i.e., there is not a statistical difference between the 4.2 trips reported for men, versus the 4.3 reported for women.) (table 7, figure 1)). In the ATUS, however, women were shown to take slightly more trips than men (4.1 versus 4.3). Both surveys do demonstrate a lower average travel time estimate for women, as well as a larger percentage of women making no trips during the day (figures 2 and 3).
14
Table 7: Trip characteristics by sex Measure 2001 NHTS 2003 ATUS(c) Male Female Male Female Mean minutes (all) 93.1 81.1 80.8 74.4 Median minutes (all) 70.0 65.0 60.0 60.0 Mean trips (all) 4.2 4.3 4.1 4.3 Median trips (all) 4.0 4.0 4.0 4.0 Percent of persons with no trips on average day
9.4 % 13.3 % 10.0 % 14.1 %.
Mean minutes (those who traveled)
102.7 93.6 89.8 86.7
Median minutes (those who traveled)
80.0 75.0 70.0 69.0
Mean trips (those who traveled)
4.7 4.9 4.5 5.0
Median trips (those who traveled)
4.0 4.0 4.0 4.0
(c) transit trips and wait times were chained to be comparable to NHTS
Figure 1
Mean trips taken by survey and sex
4.2
4.3
4.1
4.3
4
4.05
4.1
4.15
4.2
4.25
4.3
4.35
Male Female Male Female
2001 NHTS 2003 ATUS
Trip
s
15
Figure 2
Mean minutes traveled by survey and sex
93.1
81.1 80.874.4
0
10
20
30
40
50
60
70
80
90
100
Male Female Male Female
2001 NHTS 2003 ATUS
Min
utes
Figure 3
Percent of adults with no travel on an average day by survey and sex
9.4
13.3
10
14.1
0
2
4
6
8
10
12
14
16
Male Female Male Female
2001 NHTS 2003 ATUS
Perc
ent
16
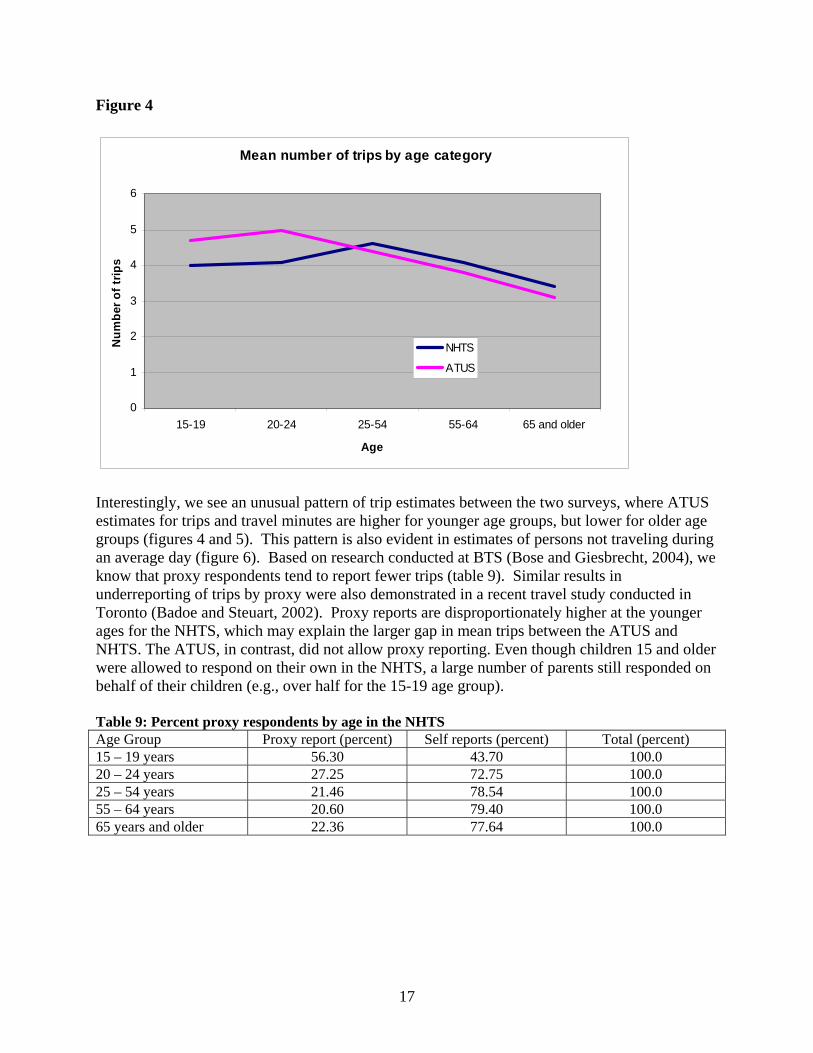
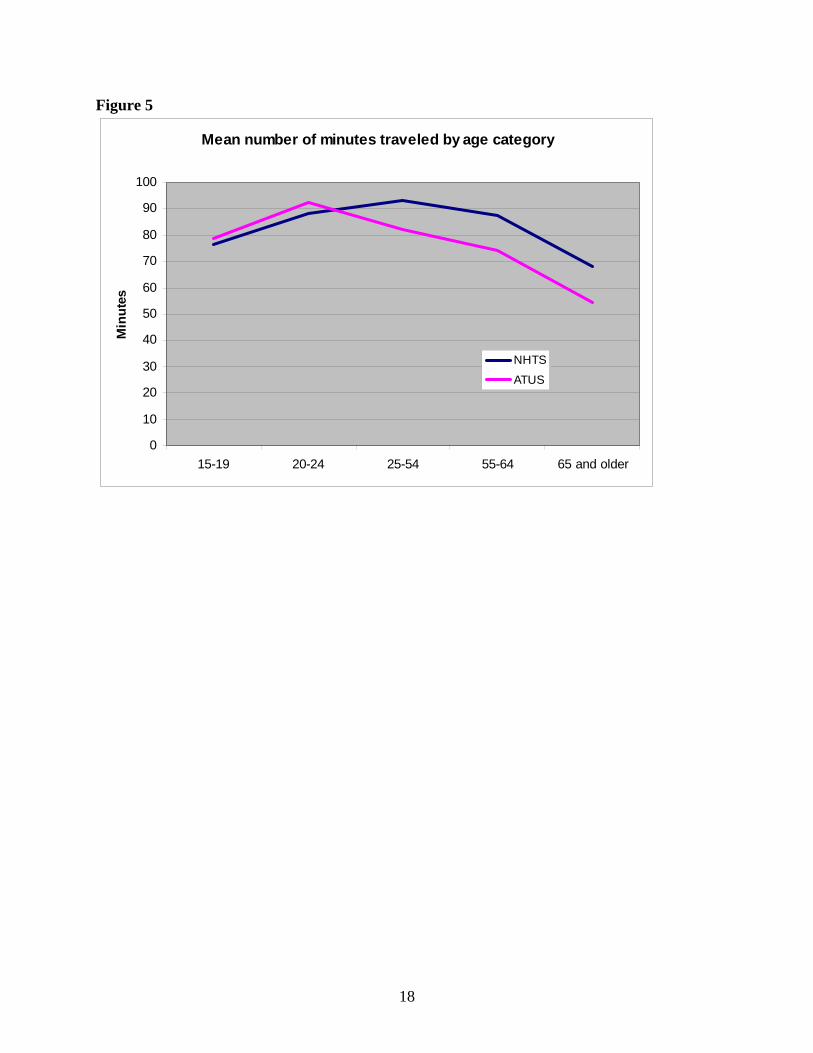
Age Subgroups based on age are often of interest to transportation specialists because of varying transportation needs and travel patterns that differ across age groups. Safety concerns, in particular, lead to a focus on younger and older drivers. One of the major demographic changes affecting transportation services and travel patterns is the aging population in the United States. The number of persons aged 65 or older is projected by the Census Bureau to increase from about 35 million in 2000 to over 71 million in 2030.3 Travel activities tend to peak among the working age and then decrease with age. The NHTS and ATUS show similar patterns when examining mean trips, average time traveled and percent with no travel during the day; however, the peaks seem to be at slightly different places, especially for mean trips and minutes (table 8). This difference could be increased by the way in which data were categorized—using a continuous variable might soften the differences. However, a greater number of cases would have been needed to produce reliable estimates for each age group or for smaller subcategories. Table 8: Trip characteristics by age Measure Survey 15-19 20-24 25-54 55-64 65 and
older Mean minutes (all) NHTS 76.6 88.2 93.3 87.4 68.1 ATUS(c) 78.9 92.6 82.2 74.2 54.6 Mean trips (all) NHTS 4.0 4.1 4.6 4.1 3.4 ATUS(c) 4.7 5.0 4.4 3.8 3.1 Percent of persons with no trips on average day
NHTS 9.42% 8.49% 8.18% 12.87% 24.63%
ATUS(c) 8.02% 6.06% 8.93% 14.81% 27.28% Mean minutes (those who traveled) NHTS 84.6 96.3 101.6 100.3 90.3 ATUS(c) 85.8 98.5 90.2 87.1 75.0 Mean trips (those who traveled) NHTS 4.4 4.5 5.0 4.8 4.6 ATUS(c) 5.1 5.4 4.8 4.5 4.2 (c) transit trips and wait times were chained to be comparable to NHTS
3 U.S. Census Bureau, Table 2a. Projected Population of the United States, by Age and Sex: 2000-2050 www.census.gov/ipc/www/usinterimproj/natprojtab02a.pdf
17
Figure 4
Mean number of trips by age category
0
1
2
3
4
5
6
15-19 20-24 25-54 55-64 65 and older
Age
Num
ber o
f trip
s
NHTS
ATUS
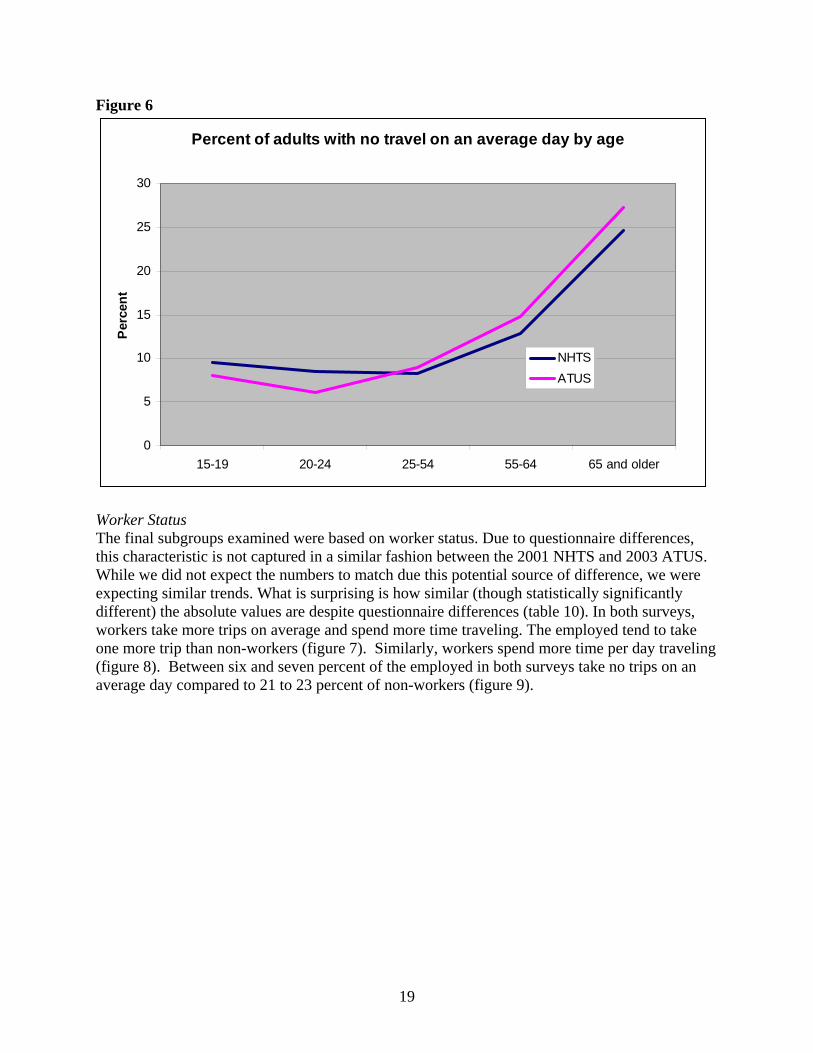
Interestingly, we see an unusual pattern of trip estimates between the two surveys, where ATUS estimates for trips and travel minutes are higher for younger age groups, but lower for older age groups (figures 4 and 5). This pattern is also evident in estimates of persons not traveling during an average day (figure 6). Based on research conducted at BTS (Bose and Giesbrecht, 2004), we know that proxy respondents tend to report fewer trips (table 9). Similar results in underreporting of trips by proxy were also demonstrated in a recent travel study conducted in Toronto (Badoe and Steuart, 2002). Proxy reports are disproportionately higher at the younger ages for the NHTS, which may explain the larger gap in mean trips between the ATUS and NHTS. The ATUS, in contrast, did not allow proxy reporting. Even though children 15 and older were allowed to respond on their own in the NHTS, a large number of parents still responded on behalf of their children (e.g., over half for the 15-19 age group). Table 9: Percent proxy respondents by age in the NHTS Age Group Proxy report (percent) Self reports (percent) Total (percent) 15 – 19 years 56.30 43.70 100.0 20 – 24 years 27.25 72.75 100.0 25 – 54 years 21.46 78.54 100.0 55 – 64 years 20.60 79.40 100.0 65 years and older 22.36 77.64 100.0
18
Figure 5
Mean number of minutes traveled by age category
0
10
20
30
40
50
60
70
80
90
100
15-19 20-24 25-54 55-64 65 and older
Min
utes
NHTS
ATUS
19
Figure 6
Percent of adults with no travel on an average day by age
0
5
10
15
20
25
30
15-19 20-24 25-54 55-64 65 and older
Per
cent
NHTSATUS
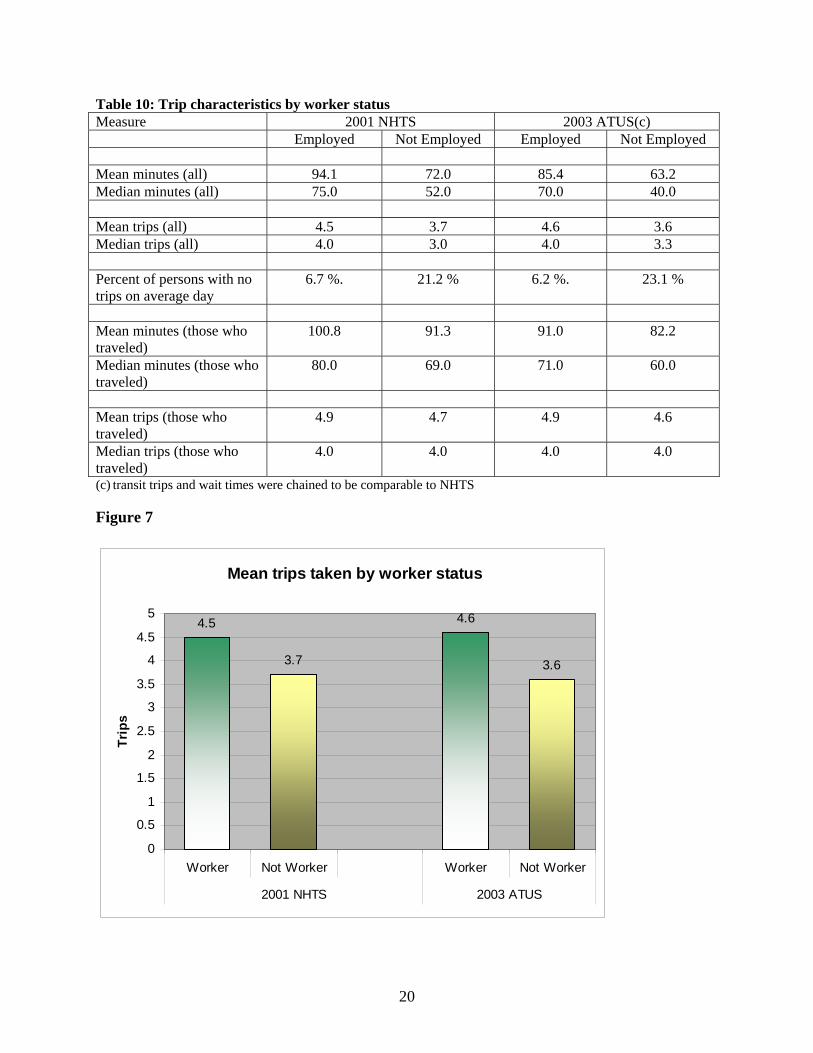
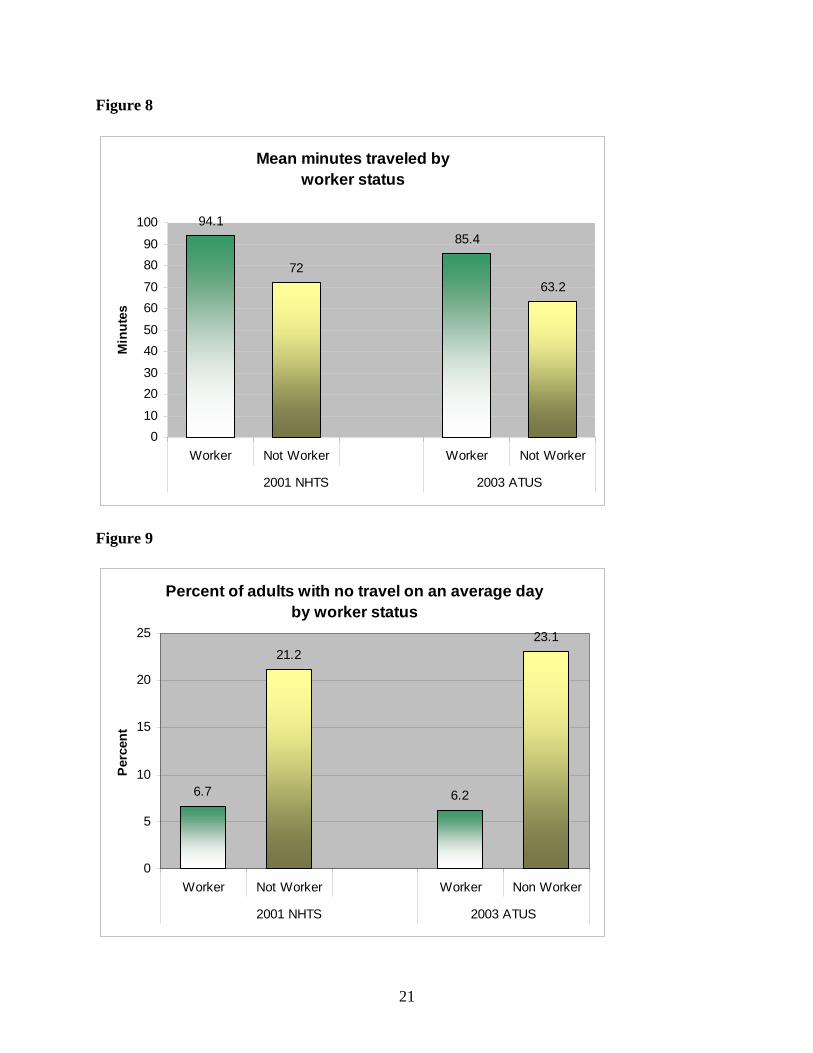
Worker Status The final subgroups examined were based on worker status. Due to questionnaire differences, this characteristic is not captured in a similar fashion between the 2001 NHTS and 2003 ATUS. While we did not expect the numbers to match due this potential source of difference, we were expecting similar trends. What is surprising is how similar (though statistically significantly different) the absolute values are despite questionnaire differences (table 10). In both surveys, workers take more trips on average and spend more time traveling. The employed tend to take one more trip than non-workers (figure 7). Similarly, workers spend more time per day traveling (figure 8). Between six and seven percent of the employed in both surveys take no trips on an average day compared to 21 to 23 percent of non-workers (figure 9).
20
Table 10: Trip characteristics by worker status Measure 2001 NHTS 2003 ATUS(c) Employed Not Employed Employed Not Employed Mean minutes (all) 94.1 72.0 85.4 63.2 Median minutes (all) 75.0 52.0 70.0 40.0 Mean trips (all) 4.5 3.7 4.6 3.6 Median trips (all) 4.0 3.0 4.0 3.3 Percent of persons with no trips on average day
6.7 %. 21.2 % 6.2 %. 23.1 %
Mean minutes (those who traveled)
100.8 91.3 91.0 82.2
Median minutes (those who traveled)
80.0 69.0 71.0 60.0
Mean trips (those who traveled)
4.9 4.7 4.9 4.6
Median trips (those who traveled)
4.0 4.0 4.0 4.0
(c) transit trips and wait times were chained to be comparable to NHTS
Figure 7
Mean trips taken by worker status
4.5
3.7
4.6
3.6
0
0.5
1
1.5
2
2.5
3
3.5
4
4.5
5
Worker Not Worker Worker Not Worker
2001 NHTS 2003 ATUS
Trip
s
21
Figure 8
Mean minutes traveled by worker status
94.1
72
85.4
63.2
010
2030
4050
6070
8090
100
Worker Not Worker Worker Not Worker
2001 NHTS 2003 ATUS
Min
utes
Figure 9
Percent of adults with no travel on an average day by worker status
6.7
21.2
6.2
23.1
0
5
10
15
20
25
Worker Not Worker Worker Non Worker
2001 NHTS 2003 ATUS
Perc
ent
22
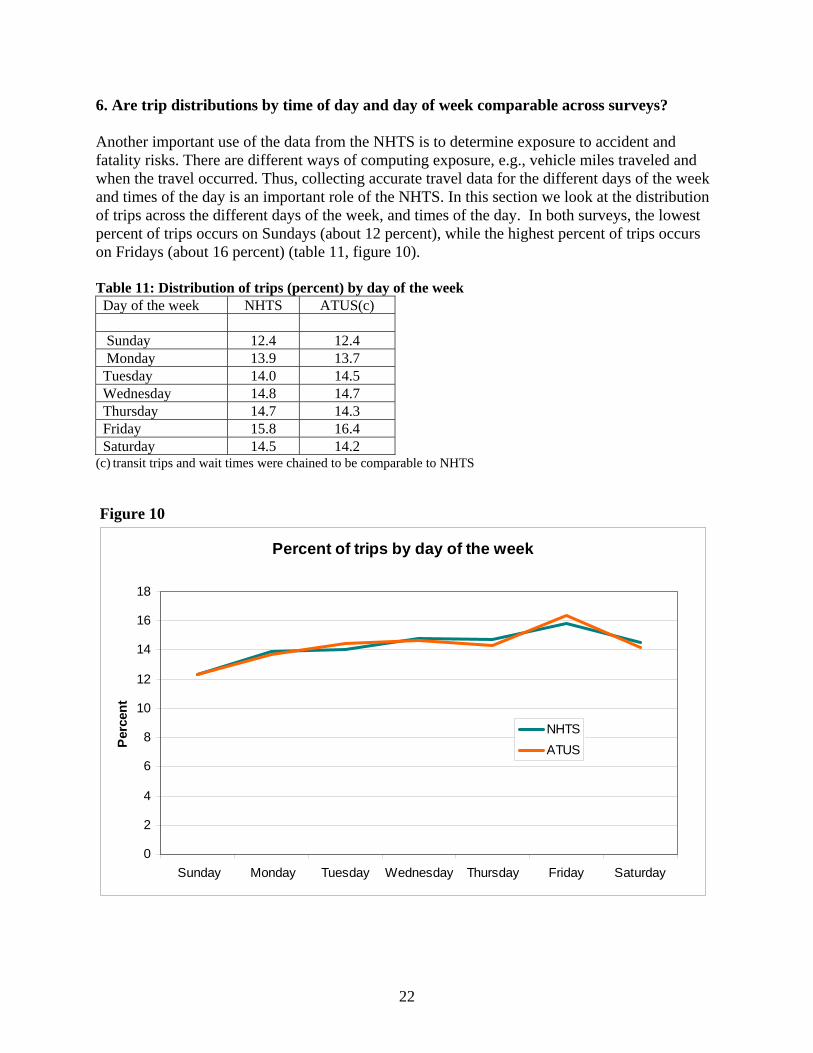
6. Are trip distributions by time of day and day of week comparable across surveys? Another important use of the data from the NHTS is to determine exposure to accident and fatality risks. There are different ways of computing exposure, e.g., vehicle miles traveled and when the travel occurred. Thus, collecting accurate travel data for the different days of the week and times of the day is an important role of the NHTS. In this section we look at the distribution of trips across the different days of the week, and times of the day. In both surveys, the lowest percent of trips occurs on Sundays (about 12 percent), while the highest percent of trips occurs on Fridays (about 16 percent) (table 11, figure 10). Table 11: Distribution of trips (percent) by day of the week Day of the week NHTS ATUS(c) Sunday 12.4 12.4 Monday 13.9 13.7 Tuesday 14.0 14.5 Wednesday 14.8 14.7 Thursday 14.7 14.3 Friday 15.8 16.4 Saturday 14.5 14.2
(c) transit trips and wait times were chained to be comparable to NHTS
Figure 10
Percent of trips by day of the week
0
2
4
6
8
10
12
14
16
18
Sunday Monday Tuesday Wednesday Thursday Friday Saturday
Per
cent
NHTSATUS
23
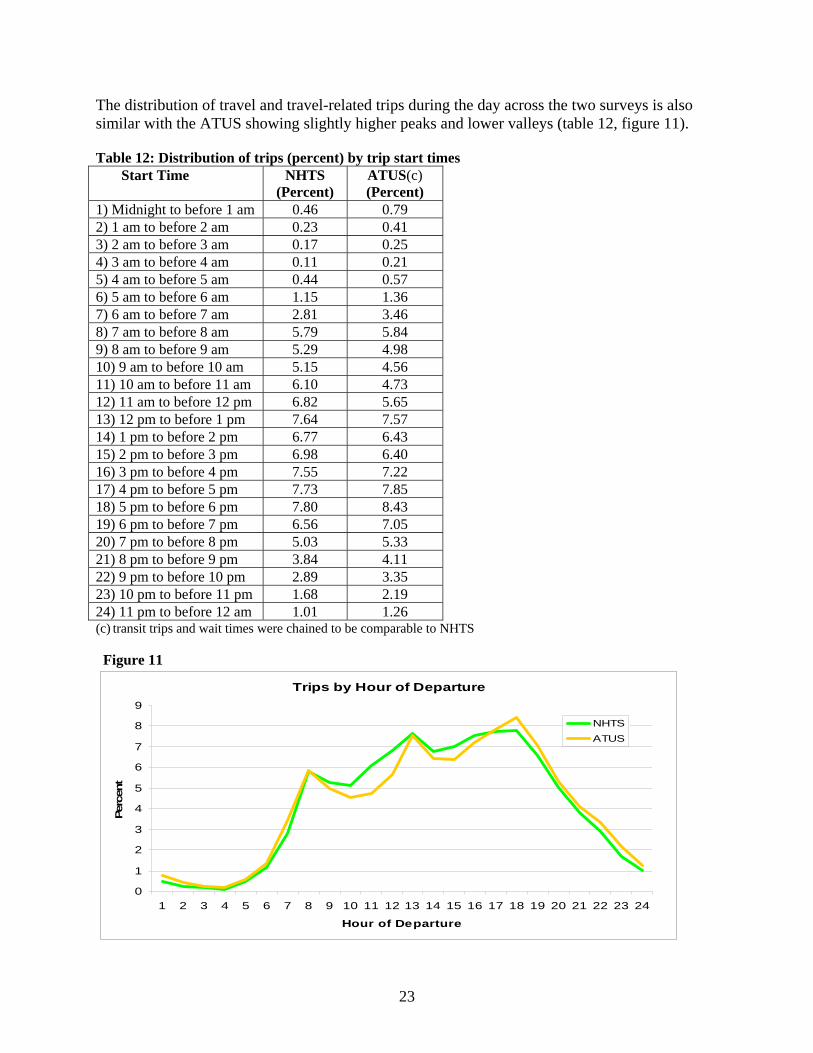
The distribution of travel and travel-related trips during the day across the two surveys is also similar with the ATUS showing slightly higher peaks and lower valleys (table 12, figure 11). Table 12: Distribution of trips (percent) by trip start times Start Time NHTS
(Percent) ATUS(c)
(Percent) 1) Midnight to before 1 am 0.46 0.79 2) 1 am to before 2 am 0.23 0.41 3) 2 am to before 3 am 0.17 0.25 4) 3 am to before 4 am 0.11 0.21 5) 4 am to before 5 am 0.44 0.57 6) 5 am to before 6 am 1.15 1.36 7) 6 am to before 7 am 2.81 3.46 8) 7 am to before 8 am 5.79 5.84 9) 8 am to before 9 am 5.29 4.98 10) 9 am to before 10 am 5.15 4.56 11) 10 am to before 11 am 6.10 4.73 12) 11 am to before 12 pm 6.82 5.65 13) 12 pm to before 1 pm 7.64 7.57 14) 1 pm to before 2 pm 6.77 6.43 15) 2 pm to before 3 pm 6.98 6.40 16) 3 pm to before 4 pm 7.55 7.22 17) 4 pm to before 5 pm 7.73 7.85 18) 5 pm to before 6 pm 7.80 8.43 19) 6 pm to before 7 pm 6.56 7.05 20) 7 pm to before 8 pm 5.03 5.33 21) 8 pm to before 9 pm 3.84 4.11 22) 9 pm to before 10 pm 2.89 3.35 23) 10 pm to before 11 pm 1.68 2.19 24) 11 pm to before 12 am 1.01 1.26 (c) transit trips and wait times were chained to be comparable to NHTS
Figure 11
Trips by Hour of Departure
0
1
2
3
4
5
6
7
8
9
1 2 3 4 5 6 7 8 9 10 11 12 13 14 15 16 17 18 19 20 21 22 23 24
Hour of Departure
Perc
ent
NHTSATUS
24
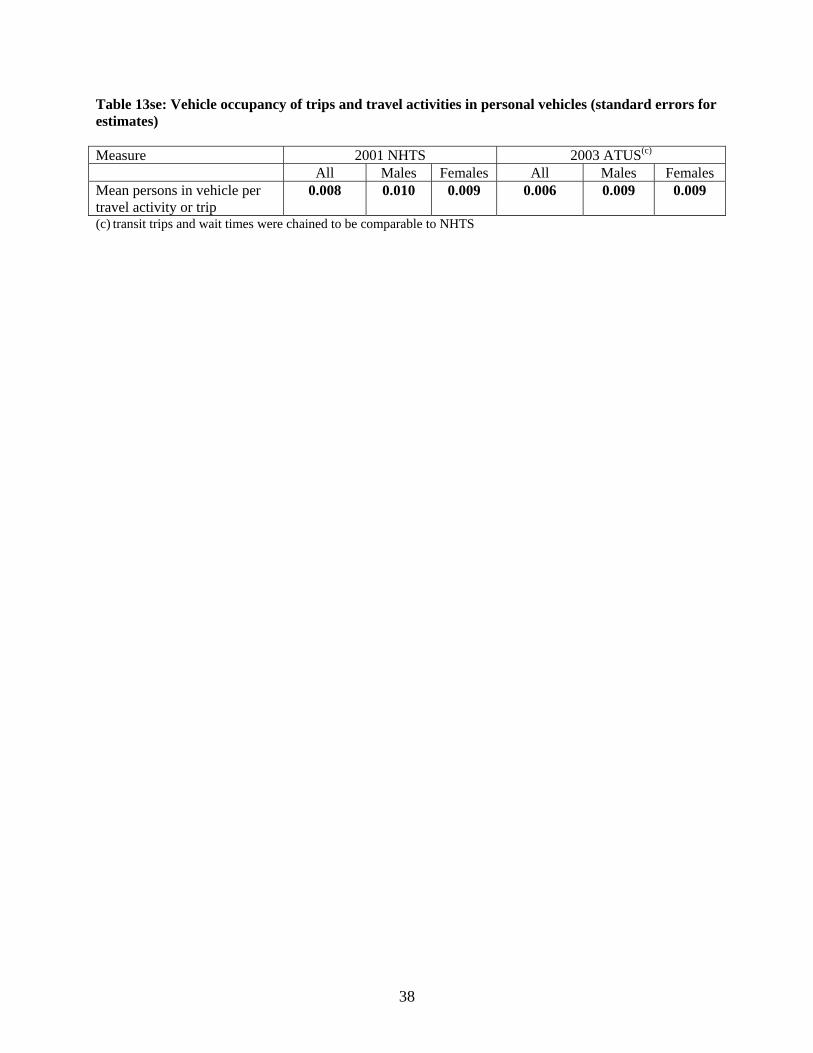
7. How do vehicle occupancy rates differ across the surveys? Traditionally in the NHTS, vehicle occupancy estimates are weighted by miles traveled. Since the ATUS does not collect mileage, the comparisons made here are based on simple means of total number of persons on trips taken in passenger vehicles such as cars, trucks, recreational vehicles (RV) and motorcycles. The 2001 NHTS shows 1.8 persons per trip compared to 1.7 persons per trip from the 2003 ATUS, which is a statistically significant difference, but perhaps not substantively very important (table 13). Both of these figures include the respondent and both household and non-household members. In both surveys, trips taken by females in personal vehicles have higher vehicle occupancies than trips taken by males. Table 13: Vehicle occupancy of trips and travel activities in personal vehicles Measure 2001 NHTS 2003 ATUS(c) All Males Females All Males Females Mean persons in vehicle per travel activity or trip
1.80 1.70 1.90 1.73 1.62 1.82
(c) transit trips and wait times were chained to be comparable to NHTS
VI. Summary of Results Despite the fairly dramatic differences in methodology, overall it can be argued that many of the key travel estimates produced from the two surveys are relatively similar. Overall trip estimates show no large differences when the files are manipulated to define trips similarly. As the research by Pendayla (2003) suggests, the ATUS does appear to generate more trips in an unchained file because the links of a multi-mode trip are individually recorded as separate activities (as compared to chained trips for transit in the NHTS file). Yet, when ‘trips’ are defined similarly, these estimates are remarkably similar. This suggest that trip-based surveys like the NHTS might not be missing incidental or non-motorized trips, although admittedly definitional and coding issues make it very difficult to provide conclusive evidence. However, it can also be speculated that changes in methodology for the 2001 survey may have helped to alleviate traditional misreports of more incidental trips. In addition to overall trip estimates, very similar estimates (or relationships between estimates) were produced across both surveys for the following travel characteristics:
- most modal estimates (except walk) - several trip purpose estimates - number of persons not taking trips - relationships between gender, age, and worker status - distribution of trips by day of week - distribution of trips by hour of departure - vehicle occupancy rates
Other than the very similar daily trip estimates, perhaps the most surprising result emerging from this analysis was the disparity in average daily travel time. Again, contrary to our expectations, the NHTS actually produced higher travel time estimates as compared to the ATUS. Even when including those activities potentially not incurring travel or meeting the NHTS trip definition, travel times were still consistently lower in the ATUS. As discussed before, there are a number
25
of potential explanations introduced by methodological differences. We could be seeing evidence of bounding effects and/or substitution bias in the ATUS estimates, or perhaps it is partially explained by more accurate estimates for the NHTS resulting from diary usage and added probing. Ambiguity in the reporting and coding of non-motorized travel may also have further confounded these results. There were other demonstrated differences as well, and these are listed below along with additional methodological reasons posited as to why they may have occurred. 1) Lower estimates of walk trips produced from the ATUS chained file - Walk trips are disproportionately impacted by the ambiguities in the reporting and coding of non-motorized travel thus confounding these results. It is highly likely that walk trips (as defined by the NHTS) were omitted from the ATUS file due to inadequate information to correctly categorize them as trips. The NHTS also defines trips such as a single walk trip around the block as as two separate trips (each half constituting one trip). 2) Differences in the distribution of trip purpose - Potential causes include: deriving purpose from the activity instead of directly asking the respondent and difficulty in defining common codes; and the survey objectives and prior questions (context effects), which might influence how purpose or activity is reported. 3) Equal trip rates for men and women produced in the NHTS file, compared to the higher rates for women in the ATUS and other research may reflect a true travel trend change; and underreporting of trips by men due to higher proxy reporting. However, the overall the rates from the two surveys are still very similar. 4) Directional differences in estimates by age subgroups perhaps due to higher rates of proxy reporting for younger age groups in the NHTS. VII. Conclusion A natural question that follows this research is whether particular methodologies are more suited to generating travel estimates, or even whether there is the need to conduct two different surveys for transportation purposes. Activity-based travel surveys not only provide information on travel, but also the context surrounding these travel activities. In addition, they are able to capture unlimited ‘sub-trip’ segments within a larger trip, e.g., in multi-modal trips. (The NHTS in part does this, too, but the resultant data file presents a multi-modal transit trip as one trip in the data file). The fact that each activity is captured separately may make the data easier to manipulate or ‘chain’ into different kinds of trips. Travel surveys, however, typically collect a great more detail on issues that are of interest to transportation modelers, researchers, and planners. For example, the NHTS currently captures more travel- and transportation specific data on:
a. travel of all household members (desired by many planners and modelers) b. driver status of the respondent c. detailed mode usage d. explicit, detailed purpose categories e. distance traveled
26
f. specifics on commute to work g. geo-specific data (though there are confidentiality issues regarding this) h. long distance trips, overnight stops i. attitudinal questions related to transportation issues j. vehicle ownership and specifics about each vehicle, including make, model, year, and
odometer readings k. which household vehicle was used for each personal vehicle trip l. occasional transit usage (i.e., transit use in last two weeks).
The NHTS also includes specific probes for rarer modes (e.g., walk and bike trips, transit usage) in order to better capture these trips. Some of these topics can easily be accommodated on a time use survey if the survey was designed to include these items. However, that may not be possible given that the objectives of the time use survey, and difficulty in incorporating all the trip-related characteristics needed to satisfy the transportation data user community without unduly interrupting the flow or redirecting the focus and objectives. In addition, the current sample size and design of the NHTS allows for some lower levels of geographic analysis. Given that the number of completed person interviews for the ATUS is about one-third that of the NHTS national sample, it is doubtful that reliable estimates at lower levels of geography (or for certain other sub-populations) could be produced with data from a single year of data collection. Also, the ATUS does not capture information for children below the age of 15, thus creating gap in the comprehensive capture of travel and eliminating an important subgroup for transportation analysis. Finally, transportation data used by many planners and modelers require the complete enumeration of the household to better understand the dynamics of travel behavior. The ATUS and the NHTS differ in some specific areas that at the moment cannot be reconciled. For example, trips for the purpose of walking and biking for exercise or to take a dog for walk are captured differently and cannot be aligned. There are travel-related trips on the ATUS with only a place code that cannot be matched to the NHTS and further understanding is needed of those. Purpose classifications would need to be made consistent. And finally, further thought would have to be given to what the effect of trends would be if a trip-based survey like the NHTS was replaced by an activity-based survey like the ATUS. The conduct of these surveys has afforded a unique opportunity to examine travel estimates by these two different types of surveys. Future research is planned to delve a little deeper into the issues addressed by this analysis, as well as utilize the additional rich data set produced by the ATUS. Future direction of current research:
(1) Further exploration into trips with no mode codes and walk/run trips reported under the exercise activity. Possibly making some more informed assumptions about these trips that would allow us to better match walk trips. (See discussion in appendix A.)
(2) Deconstructing the transit trips in the NHTS file to compare to an unlinked ATUS file.
Other proposed research with ATUS data: (1) Examine relationship between travel and other activities,
27
(2) Looking at the relationship of travel-related activities with concurrent secondary and tertiary activities.
(3) Because the ATUS is conducted continuously, use each year’s data set to track yearly trends and determine how estimates might be ‘rolled up’ over years to produce more reliable estimates for subpopulations and subgroups.
Needed research to better examine differences between surveys:
(1) True experimental design, perhaps with a GPS component for validation.
VIII. Acknowledgements The authors would like to express their appreciation to many others who have assisted in this effort with programming assistance, technical support, and paper review - Katharine Abraham, Dori Allard, Michael Cohen, Lee Giesbrecht, Elaine Murakami, Tina Shelley, and Roger Tourangeau. We would especially like to thank Yuki Nakamoto for her programming assistance that was critical in creating a comparable trip-chain file. References Armoogum, J., K. Axhausen, J.-P. Hubert, and J.L.Madre (2004) “Immobility and Mobility seen through Trip-based vs. Time Use Surveys.” Paper presented at 7th International Conference on Travel Survey Methods. Playa Herradurra, Costa Rica, August. Badoe, D.A., Steuart, G.N (2002). “Impact of Interviewing by Proxy in Travel Survey Conducted by Telephone,” Journal of Advanced Transportation, Vol. 6, No. 1. Bhat, C. (1997) “Recent Methodological Advances Relevant to Activity and Travel Behavior Analysis” Paper presented for 8th Meeting of the International Association for Travel Behavior Research, Austin, Texas, September 21-25. Bose, J. and Giesbrecht, L. (2004) Patterns of Proxy Usage in the 2001 National Household Travel Survey. Proceedings from the Survey Research Methods Section, American Statistical Association. Harvey, A. S. (2003). Time-Space Diaries: Merging Tradition, In Transport Survey Quality and Innovation, (Pergamon 2003) Elsevier Science Ltd, Oxford, UK. Kalfs, N. and Harvey, A. S. (1997), “Emerging Developments in Time Use and Mobility” Paper presented for 8th Meeting of the International Association for Travel Behavior Research, Austin, Texas, September 21-25. Pas, E. (1997). "Time Use and Travel Demand Modelling: Recent Developments and Current Challenges" Resource paper presented to the 8th Meeting of the International Association for Travel Behaviour Research, Austin, Texas , September 21-25.
28
Pendyala, R. (2003) Quality and Innovation in Time Use and Activity Surveys. In P.R. Stopher and P. Jones (eds) Transport Survey Quality and Innovation. Elsevier Science Ltd, Oxford, UK, pp. 181-190. Richardson, A. (1997). "Current Issues in Travel and Activity Surveys." Resource paper presented to the 8th Meeting of the International Association for Travel Behaviour Research, Austin, Texas , September 21-25. Rosenbloom, S. Trends in Women’s Travel Patterns. In U.S. Department of Transportation, Federal Highway Administration. Proceedings from the Second National Conference on Women’s Travel Issues. October 1996. Washington, DC, 1998. Wen, C and F. Koppelman (2000). A Conceptual and Methodological Framework for the Generation of Activity-travel Patterns, Transportation, Vol./No. 27:1. pp. 5-23.
29
APPENDIX A TECHNICAL NOTES AND DETAILED DATA ISSUES
Description of data files and variables For the purpose of this study we used the following 2003 ATUS files:
• Respondent (for weights and employments status) • Roster (for respondent demographic characteristics such as sex and age) • Activity (to identify trips, mode, purpose, day of week, and time of day) • Who (to determine vehicle occupancy rates) • The replicate file for the replicate weights
These files have been linked using common identifier variables across the files such as TUCASEID for person and activity links, and TUACTIVITY_N for activity and who-file links. Estimates have been made at the person and activity level. NHTS-based data that were used for this effort were obtained from the national person-level file containing information on all respondents and the daily-trip file with details on all daily trips taken by these respondents. These files were liked using the common household- and person-level identifiers, i.e., PERSONID and HOUSEID. Weights: All relevant estimates are weighted unless otherwise mentioned. TUFINLWGT on the ATUS respondent file has been used to estimate daily means and participation rates. It also has been used to calculate distributions of various characteristics and annual totals. Two different weights were used for data from the NHTS. WTPRNTL was used to estimates pertaining to individuals—e.g., to estimate the percent of people who made no trips on any given day, and WTTRDNTL was used to make trip-level estimates, e.g., the percent of trips made for work purposes. Variance estimation and significance testing: For the purpose of this study we report only those estimates with a coefficient of variance less than 30 percent. All differences cited are significant at a 0.05 alpha level. Replicate weights (Fay’s for ATUS provided by BLS and JK1 for NHTS) are used in variance estimation. Appendix B contains standard errors for all relevant weighted estimates. More Detail Explanation of Data Comparability Issues The following questions reflect some of the issues we grappled with as we examined the data from the two surveys. What are these cases with a valid mode of conveyance? We need a better understanding of travel activities in the ATUS, especially where the activity is not occurring in a standard mode. Examples include waiting for the bus and drive-through banking. The first step is to example the distribution of these ‘place’-based travel activities. Trip chaining accounted for some of these activities, but not most of them. Overall, after transit trip
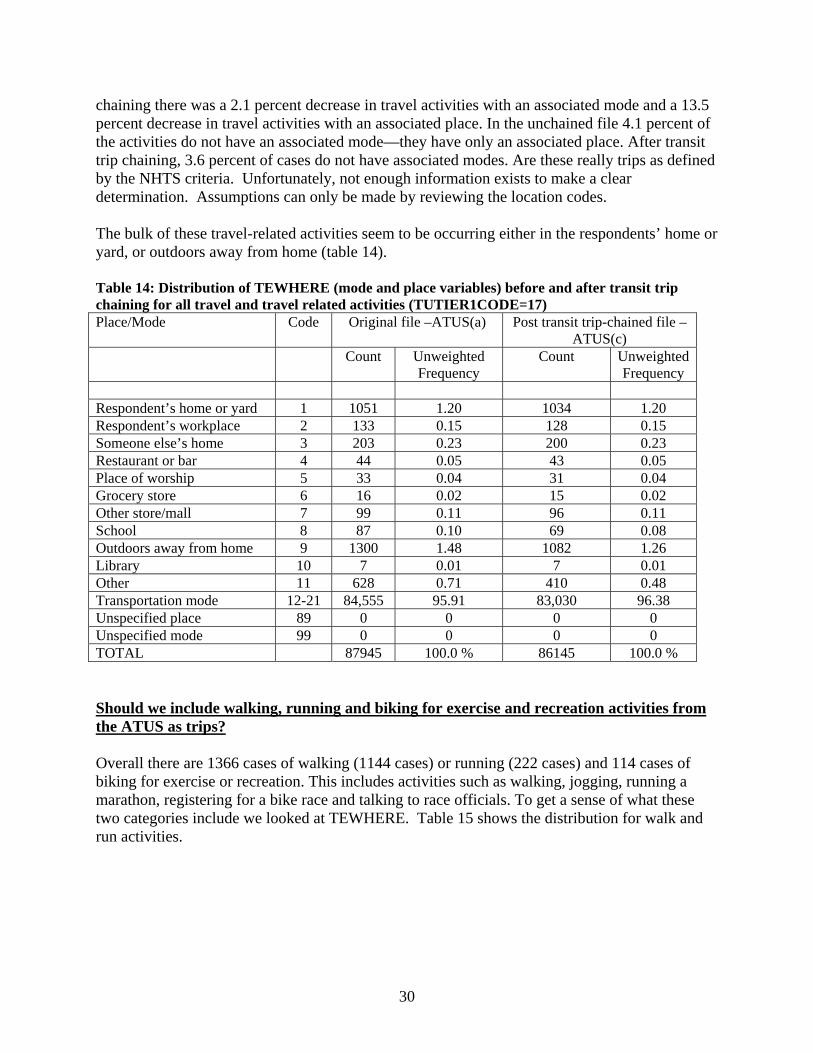
30
chaining there was a 2.1 percent decrease in travel activities with an associated mode and a 13.5 percent decrease in travel activities with an associated place. In the unchained file 4.1 percent of the activities do not have an associated mode—they have only an associated place. After transit trip chaining, 3.6 percent of cases do not have associated modes. Are these really trips as defined by the NHTS criteria. Unfortunately, not enough information exists to make a clear determination. Assumptions can only be made by reviewing the location codes. The bulk of these travel-related activities seem to be occurring either in the respondents’ home or yard, or outdoors away from home (table 14). Table 14: Distribution of TEWHERE (mode and place variables) before and after transit trip chaining for all travel and travel related activities (TUTIER1CODE=17) Place/Mode Code Original file –ATUS(a) Post transit trip-chained file –
ATUS(c) Count Unweighted
Frequency Count Unweighted
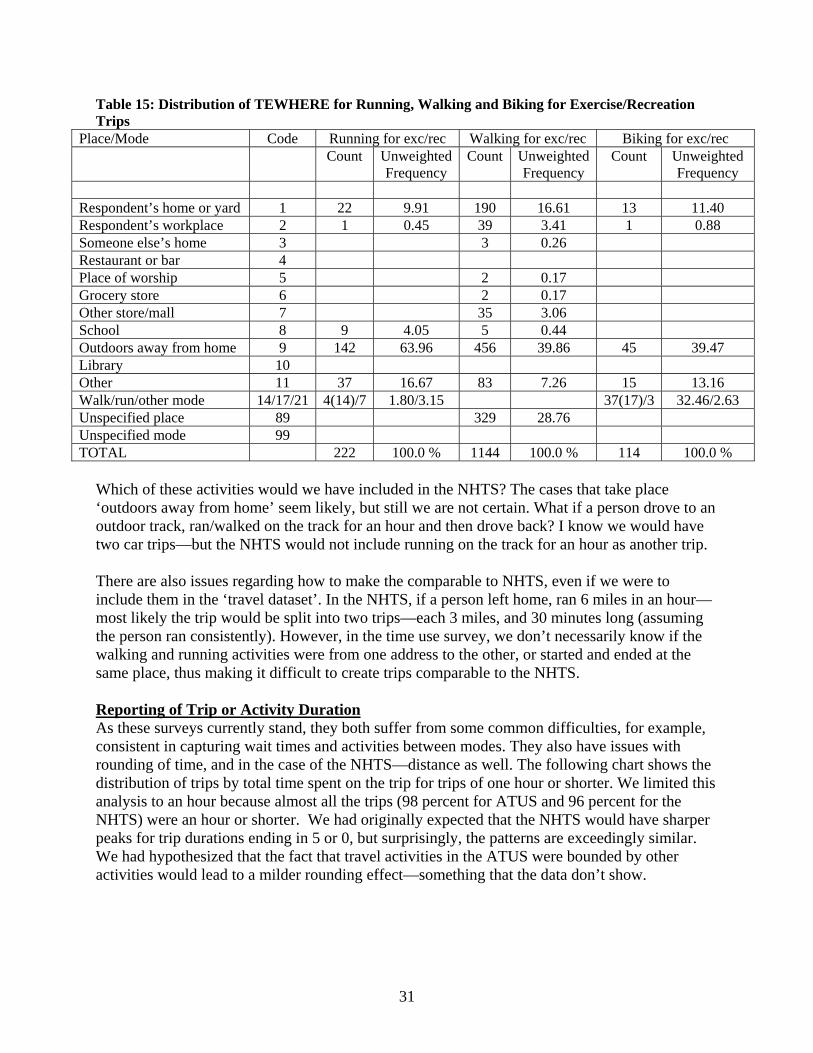
Frequency Respondent’s home or yard 1 1051 1.20 1034 1.20 Respondent’s workplace 2 133 0.15 128 0.15 Someone else’s home 3 203 0.23 200 0.23 Restaurant or bar 4 44 0.05 43 0.05 Place of worship 5 33 0.04 31 0.04 Grocery store 6 16 0.02 15 0.02 Other store/mall 7 99 0.11 96 0.11 School 8 87 0.10 69 0.08 Outdoors away from home 9 1300 1.48 1082 1.26 Library 10 7 0.01 7 0.01 Other 11 628 0.71 410 0.48 Transportation mode 12-21 84,555 95.91 83,030 96.38 Unspecified place 89 0 0 0 0 Unspecified mode 99 0 0 0 0 TOTAL 87945 100.0 % 86145 100.0 % Should we include walking, running and biking for exercise and recreation activities from the ATUS as trips? Overall there are 1366 cases of walking (1144 cases) or running (222 cases) and 114 cases of biking for exercise or recreation. This includes activities such as walking, jogging, running a marathon, registering for a bike race and talking to race officials. To get a sense of what these two categories include we looked at TEWHERE. Table 15 shows the distribution for walk and run activities.
31
Table 15: Distribution of TEWHERE for Running, Walking and Biking for Exercise/Recreation Trips
Place/Mode Code Running for exc/rec Walking for exc/rec Biking for exc/rec Count Unweighted
Frequency Count Unweighted
Frequency Count Unweighted
Frequency Respondent’s home or yard 1 22 9.91 190 16.61 13 11.40 Respondent’s workplace 2 1 0.45 39 3.41 1 0.88 Someone else’s home 3 3 0.26 Restaurant or bar 4 Place of worship 5 2 0.17 Grocery store 6 2 0.17 Other store/mall 7 35 3.06 School 8 9 4.05 5 0.44 Outdoors away from home 9 142 63.96 456 39.86 45 39.47 Library 10 Other 11 37 16.67 83 7.26 15 13.16 Walk/run/other mode 14/17/21 4(14)/7 1.80/3.15 37(17)/3 32.46/2.63 Unspecified place 89 329 28.76 Unspecified mode 99 TOTAL 222 100.0 % 1144 100.0 % 114 100.0 %
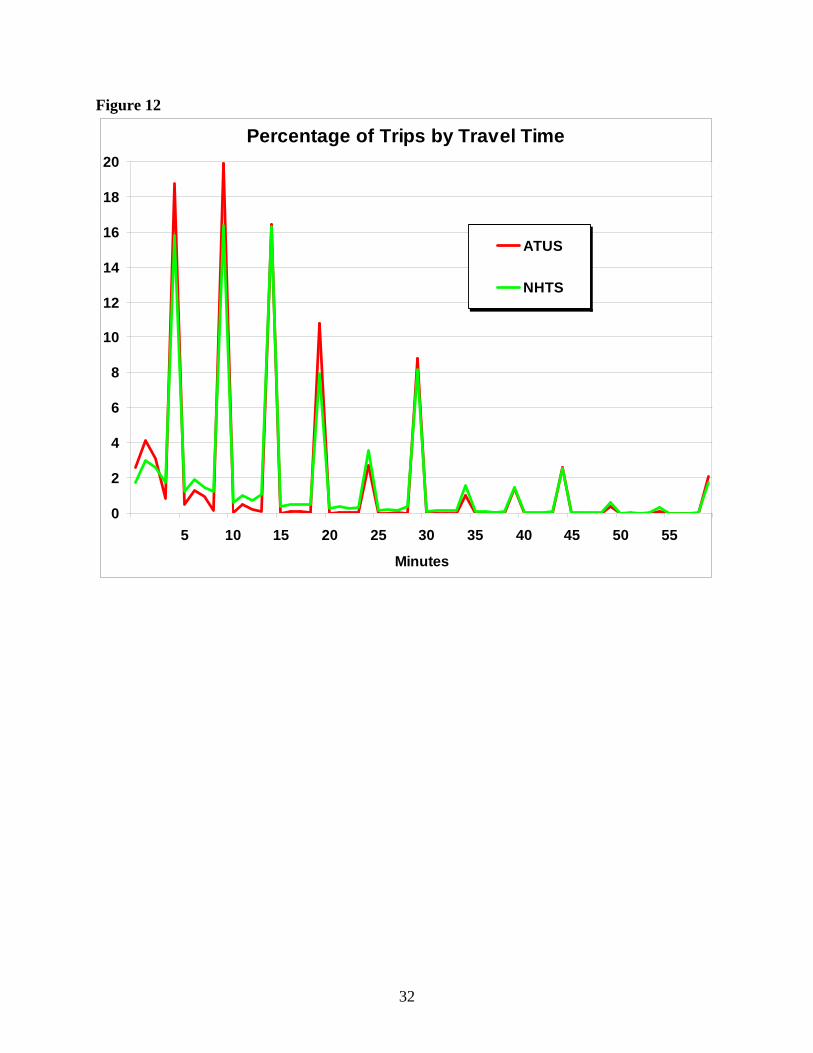
Which of these activities would we have included in the NHTS? The cases that take place ‘outdoors away from home’ seem likely, but still we are not certain. What if a person drove to an outdoor track, ran/walked on the track for an hour and then drove back? I know we would have two car trips—but the NHTS would not include running on the track for an hour as another trip. There are also issues regarding how to make the comparable to NHTS, even if we were to include them in the ‘travel dataset’. In the NHTS, if a person left home, ran 6 miles in an hour—most likely the trip would be split into two trips—each 3 miles, and 30 minutes long (assuming the person ran consistently). However, in the time use survey, we don’t necessarily know if the walking and running activities were from one address to the other, or started and ended at the same place, thus making it difficult to create trips comparable to the NHTS. Reporting of Trip or Activity Duration As these surveys currently stand, they both suffer from some common difficulties, for example, consistent in capturing wait times and activities between modes. They also have issues with rounding of time, and in the case of the NHTS—distance as well. The following chart shows the distribution of trips by total time spent on the trip for trips of one hour or shorter. We limited this analysis to an hour because almost all the trips (98 percent for ATUS and 96 percent for the NHTS) were an hour or shorter. We had originally expected that the NHTS would have sharper peaks for trip durations ending in 5 or 0, but surprisingly, the patterns are exceedingly similar. We had hypothesized that the fact that travel activities in the ATUS were bounded by other activities would lead to a milder rounding effect—something that the data don’t show.
32
Figure 12
Percentage of Trips by Travel Time
0
2
4
6
8
10
12
14
16
18
20
5 10 15 20 25 30 35 40 45 50 55
Minutes
ATUS
NHTS
33
APPENDIX B
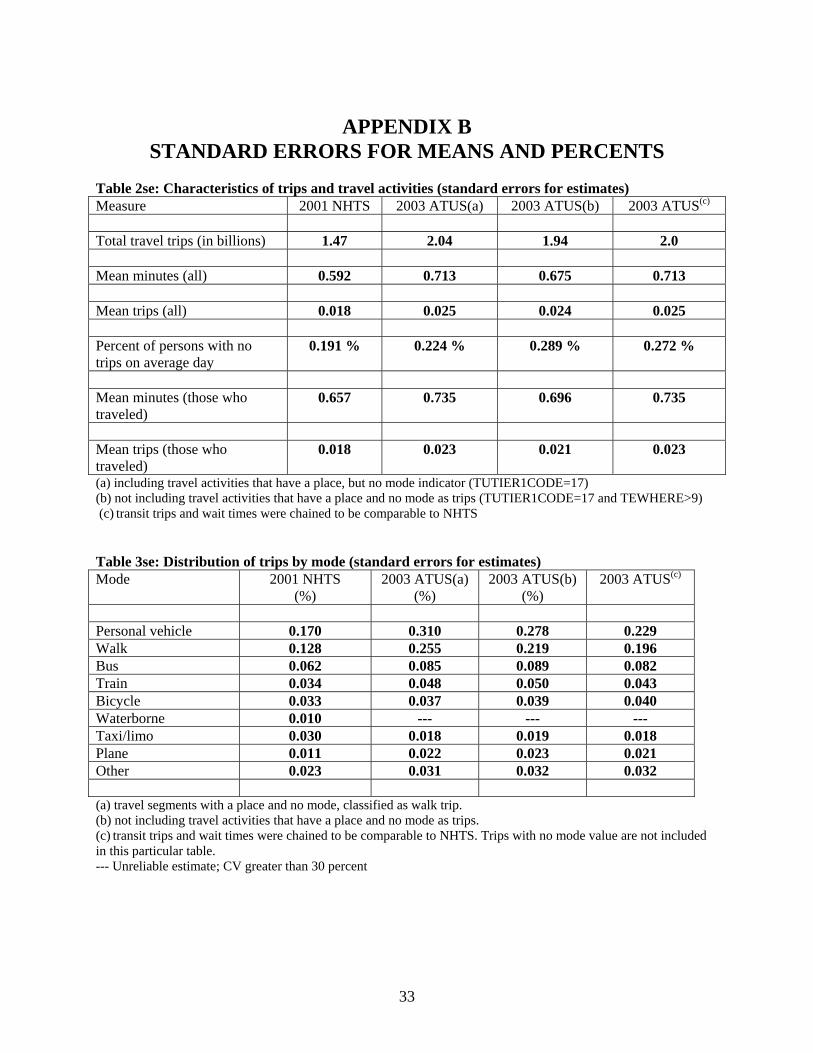
STANDARD ERRORS FOR MEANS AND PERCENTS Table 2se: Characteristics of trips and travel activities (standard errors for estimates) Measure 2001 NHTS 2003 ATUS(a) 2003 ATUS(b) 2003 ATUS(c) Total travel trips (in billions) 1.47 2.04 1.94 2.0 Mean minutes (all) 0.592 0.713 0.675 0.713 Mean trips (all) 0.018 0.025 0.024 0.025 Percent of persons with no trips on average day
0.191 % 0.224 % 0.289 % 0.272 %
Mean minutes (those who traveled)
0.657 0.735 0.696 0.735
Mean trips (those who traveled)
0.018 0.023 0.021 0.023
(a) including travel activities that have a place, but no mode indicator (TUTIER1CODE=17) (b) not including travel activities that have a place and no mode as trips (TUTIER1CODE=17 and TEWHERE>9) (c) transit trips and wait times were chained to be comparable to NHTS
Table 3se: Distribution of trips by mode (standard errors for estimates) Mode 2001 NHTS
(%) 2003 ATUS(a)
(%) 2003 ATUS(b)
(%) 2003 ATUS(c)
Personal vehicle 0.170 0.310 0.278 0.229 Walk 0.128 0.255 0.219 0.196 Bus 0.062 0.085 0.089 0.082 Train 0.034 0.048 0.050 0.043 Bicycle 0.033 0.037 0.039 0.040 Waterborne 0.010 --- --- --- Taxi/limo 0.030 0.018 0.019 0.018 Plane 0.011 0.022 0.023 0.021 Other 0.023 0.031 0.032 0.032 (a) travel segments with a place and no mode, classified as walk trip. (b) not including travel activities that have a place and no mode as trips. (c) transit trips and wait times were chained to be comparable to NHTS. Trips with no mode value are not included in this particular table. --- Unreliable estimate; CV greater than 30 percent
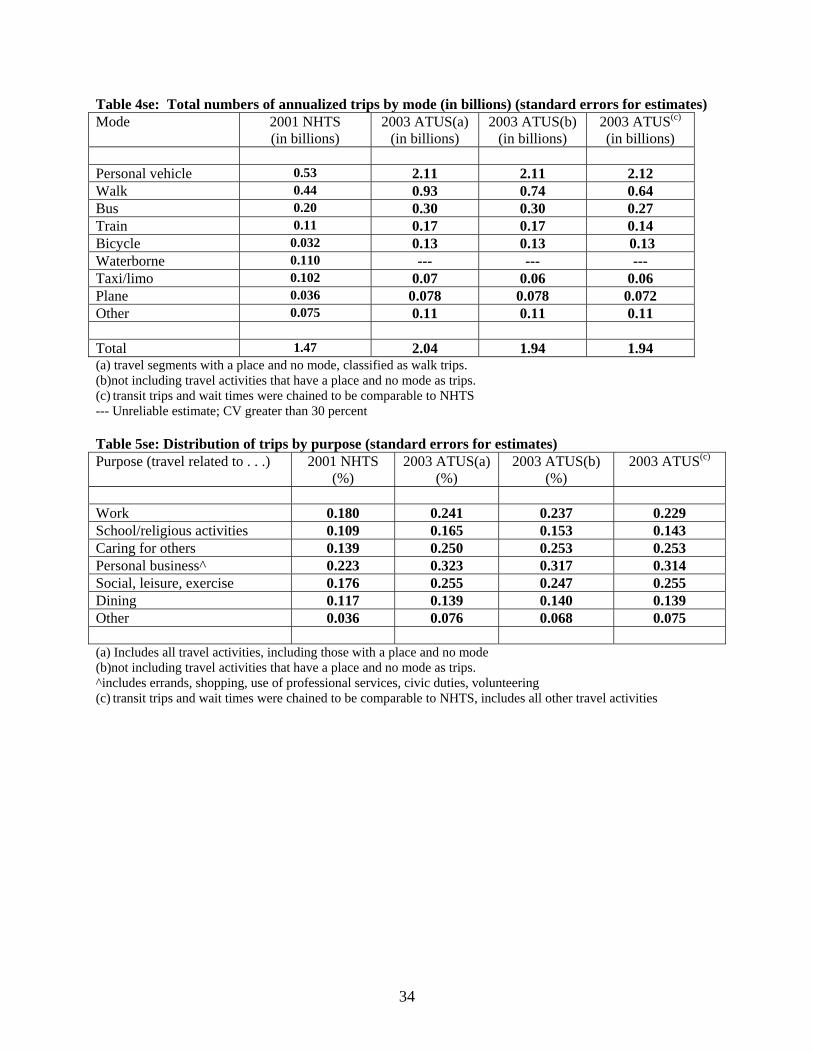
34
Table 4se: Total numbers of annualized trips by mode (in billions) (standard errors for estimates) Mode 2001 NHTS
(in billions) 2003 ATUS(a)
(in billions) 2003 ATUS(b)
(in billions) 2003 ATUS(c)
(in billions) Personal vehicle 0.53 2.11 2.11 2.12 Walk 0.44 0.93 0.74 0.64 Bus 0.20 0.30 0.30 0.27 Train 0.11 0.17 0.17 0.14 Bicycle 0.032 0.13 0.13 0.13 Waterborne 0.110 --- --- --- Taxi/limo 0.102 0.07 0.06 0.06 Plane 0.036 0.078 0.078 0.072 Other 0.075 0.11 0.11 0.11 Total 1.47 2.04 1.94 1.94 (a) travel segments with a place and no mode, classified as walk trips. (b)not including travel activities that have a place and no mode as trips. (c) transit trips and wait times were chained to be comparable to NHTS --- Unreliable estimate; CV greater than 30 percent Table 5se: Distribution of trips by purpose (standard errors for estimates) Purpose (travel related to . . .) 2001 NHTS
(%) 2003 ATUS(a)
(%) 2003 ATUS(b)
(%) 2003 ATUS(c)
Work 0.180 0.241 0.237 0.229 School/religious activities 0.109 0.165 0.153 0.143 Caring for others 0.139 0.250 0.253 0.253 Personal business^ 0.223 0.323 0.317 0.314 Social, leisure, exercise 0.176 0.255 0.247 0.255 Dining 0.117 0.139 0.140 0.139 Other 0.036 0.076 0.068 0.075 (a) Includes all travel activities, including those with a place and no mode (b)not including travel activities that have a place and no mode as trips. ^includes errands, shopping, use of professional services, civic duties, volunteering (c) transit trips and wait times were chained to be comparable to NHTS, includes all other travel activities
35
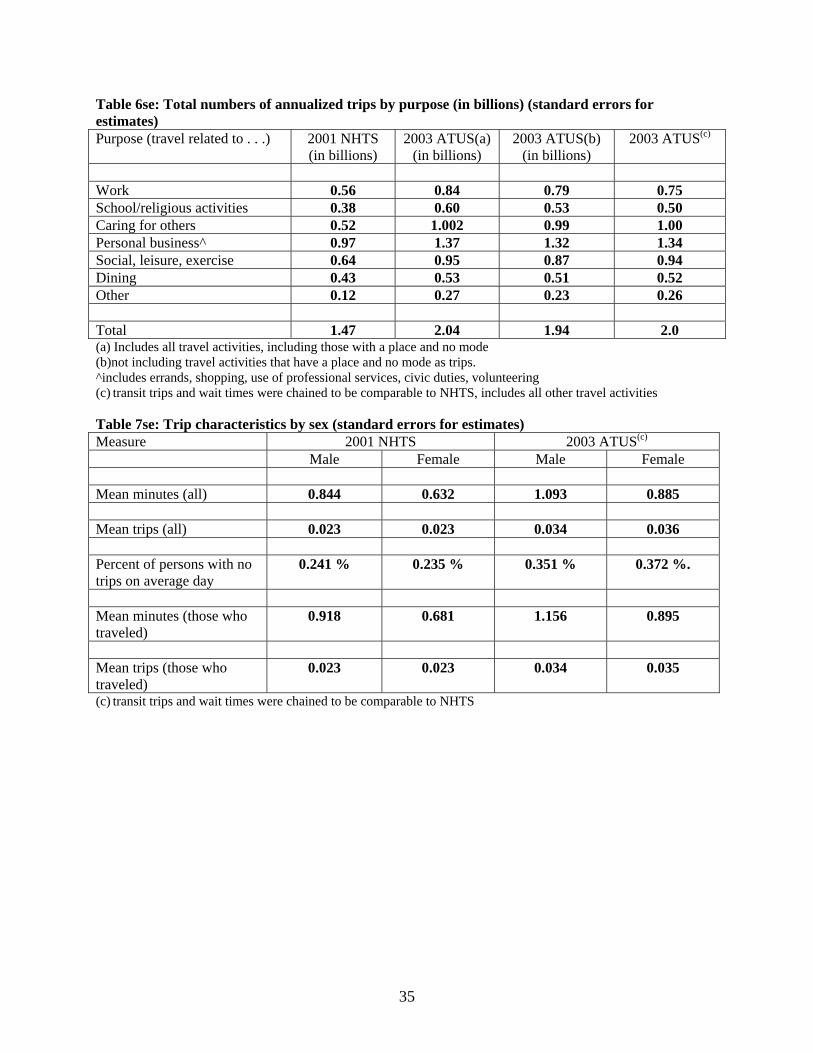
Table 6se: Total numbers of annualized trips by purpose (in billions) (standard errors for estimates) Purpose (travel related to . . .) 2001 NHTS
(in billions) 2003 ATUS(a)
(in billions) 2003 ATUS(b)
(in billions) 2003 ATUS(c)
Work 0.56 0.84 0.79 0.75 School/religious activities 0.38 0.60 0.53 0.50 Caring for others 0.52 1.002 0.99 1.00 Personal business^ 0.97 1.37 1.32 1.34 Social, leisure, exercise 0.64 0.95 0.87 0.94 Dining 0.43 0.53 0.51 0.52 Other 0.12 0.27 0.23 0.26 Total 1.47 2.04 1.94 2.0 (a) Includes all travel activities, including those with a place and no mode (b)not including travel activities that have a place and no mode as trips. ^includes errands, shopping, use of professional services, civic duties, volunteering (c) transit trips and wait times were chained to be comparable to NHTS, includes all other travel activities
Table 7se: Trip characteristics by sex (standard errors for estimates) Measure 2001 NHTS 2003 ATUS(c) Male Female Male Female Mean minutes (all) 0.844 0.632 1.093 0.885 Mean trips (all) 0.023 0.023 0.034 0.036 Percent of persons with no trips on average day
0.241 % 0.235 % 0.351 % 0.372 %.
Mean minutes (those who traveled)
0.918 0.681 1.156 0.895
Mean trips (those who traveled)
0.023 0.023 0.034 0.035
(c) transit trips and wait times were chained to be comparable to NHTS
36
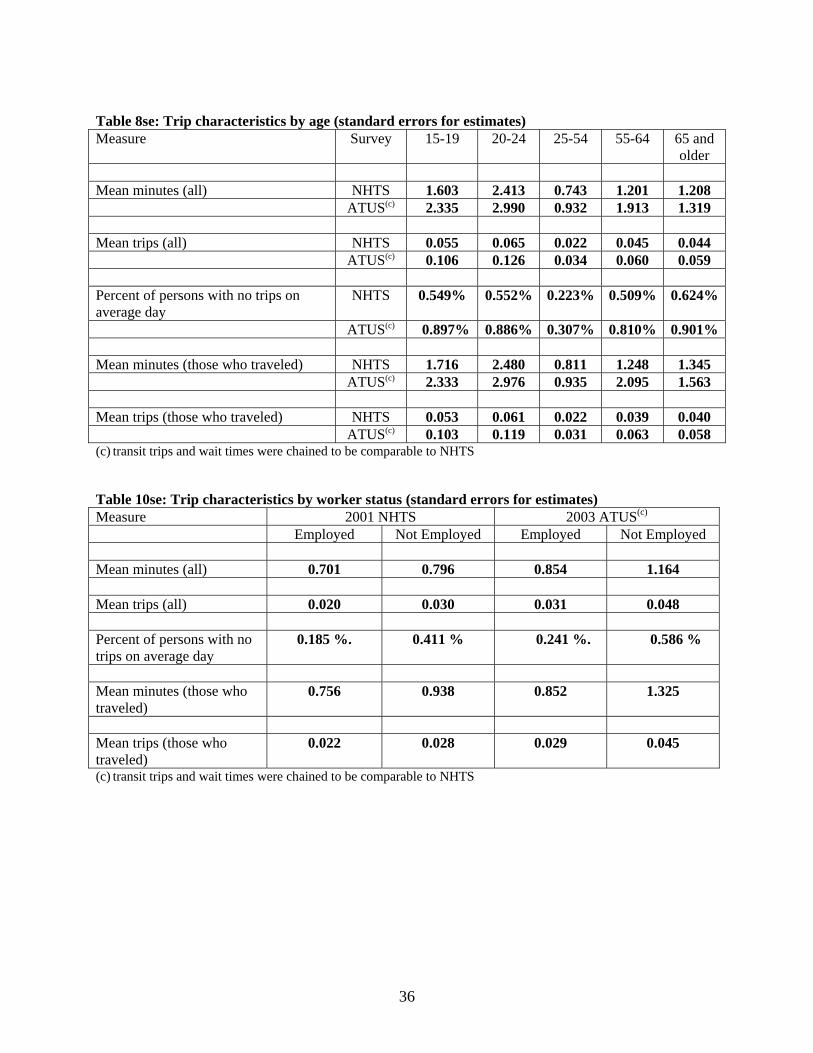
Table 8se: Trip characteristics by age (standard errors for estimates) Measure Survey 15-19 20-24 25-54 55-64 65 and
older Mean minutes (all) NHTS 1.603 2.413 0.743 1.201 1.208 ATUS(c) 2.335 2.990 0.932 1.913 1.319 Mean trips (all) NHTS 0.055 0.065 0.022 0.045 0.044 ATUS(c) 0.106 0.126 0.034 0.060 0.059 Percent of persons with no trips on average day
NHTS 0.549% 0.552% 0.223% 0.509% 0.624%
ATUS(c) 0.897% 0.886% 0.307% 0.810% 0.901% Mean minutes (those who traveled) NHTS 1.716 2.480 0.811 1.248 1.345 ATUS(c) 2.333 2.976 0.935 2.095 1.563 Mean trips (those who traveled) NHTS 0.053 0.061 0.022 0.039 0.040 ATUS(c) 0.103 0.119 0.031 0.063 0.058 (c) transit trips and wait times were chained to be comparable to NHTS
Table 10se: Trip characteristics by worker status (standard errors for estimates) Measure 2001 NHTS 2003 ATUS(c) Employed Not Employed Employed Not Employed Mean minutes (all) 0.701 0.796 0.854 1.164 Mean trips (all) 0.020 0.030 0.031 0.048 Percent of persons with no trips on average day
0.185 %. 0.411 % 0.241 %. 0.586 %
Mean minutes (those who traveled)
0.756 0.938 0.852 1.325
Mean trips (those who traveled)
0.022 0.028 0.029 0.045
(c) transit trips and wait times were chained to be comparable to NHTS
37
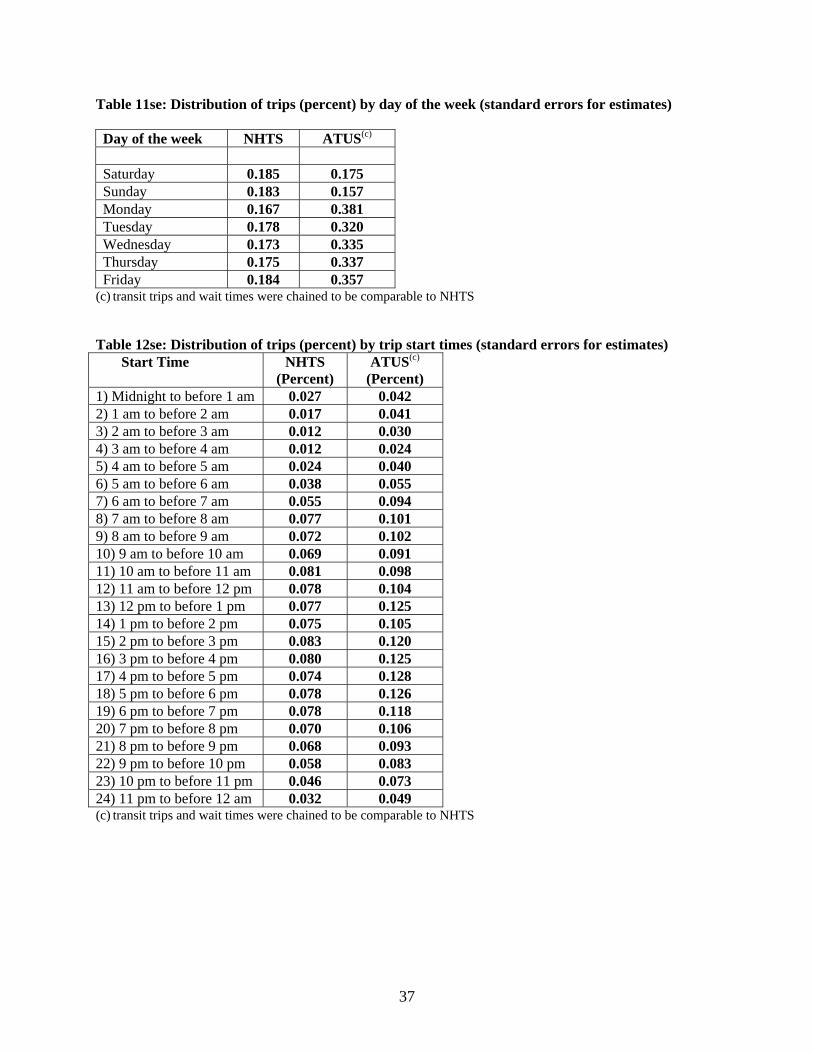
Table 11se: Distribution of trips (percent) by day of the week (standard errors for estimates)
Day of the week NHTS ATUS(c) Saturday 0.185 0.175 Sunday 0.183 0.157 Monday 0.167 0.381 Tuesday 0.178 0.320 Wednesday 0.173 0.335 Thursday 0.175 0.337 Friday 0.184 0.357
(c) transit trips and wait times were chained to be comparable to NHTS
Table 12se: Distribution of trips (percent) by trip start times (standard errors for estimates) Start Time NHTS
(Percent) ATUS(c)
(Percent) 1) Midnight to before 1 am 0.027 0.042 2) 1 am to before 2 am 0.017 0.041 3) 2 am to before 3 am 0.012 0.030 4) 3 am to before 4 am 0.012 0.024 5) 4 am to before 5 am 0.024 0.040 6) 5 am to before 6 am 0.038 0.055 7) 6 am to before 7 am 0.055 0.094 8) 7 am to before 8 am 0.077 0.101 9) 8 am to before 9 am 0.072 0.102 10) 9 am to before 10 am 0.069 0.091 11) 10 am to before 11 am 0.081 0.098 12) 11 am to before 12 pm 0.078 0.104 13) 12 pm to before 1 pm 0.077 0.125 14) 1 pm to before 2 pm 0.075 0.105 15) 2 pm to before 3 pm 0.083 0.120 16) 3 pm to before 4 pm 0.080 0.125 17) 4 pm to before 5 pm 0.074 0.128 18) 5 pm to before 6 pm 0.078 0.126 19) 6 pm to before 7 pm 0.078 0.118 20) 7 pm to before 8 pm 0.070 0.106 21) 8 pm to before 9 pm 0.068 0.093 22) 9 pm to before 10 pm 0.058 0.083 23) 10 pm to before 11 pm 0.046 0.073 24) 11 pm to before 12 am 0.032 0.049 (c) transit trips and wait times were chained to be comparable to NHTS
38
Table 13se: Vehicle occupancy of trips and travel activities in personal vehicles (standard errors for estimates) Measure 2001 NHTS 2003 ATUS(c) All Males Females All Males Females Mean persons in vehicle per travel activity or trip
0.008 0.010 0.009 0.006 0.009 0.009
(c) transit trips and wait times were chained to be comparable to NHTS
39
APPENDIX C CROSSWALK OF NHTS MODE CODE WITH ATUS LOCATION CODE
Combined Mode/Where Code NHTS Trip Mode Code (TRPTRANS) ATUS Where Code (TEWHERE for Activity 17) “.” = missing
-1=Appropriate Skip -7=Refused -8=Don't Know -9=Not Ascertained
89 = Unspecified Place 99 = Unspecified Mode of Transportation 1 = DP's home or yard * 2 = DP's workplace * 3 = Someone else's home * 4 = Restaurant/Bar * 5 = Place of worship * 6 = Grocery store * 7 = Other store/Mall * 8 = School * 9 = Outdoors away from home * 10 = Library * 11 = Other place (specify) *
1 = Personal Vehicle
01=Car 02=Van 03=SUV 04=Pickup truck 05=Other truck 06=RV 07=Motorcycle
12 = Car, truck, or motorcycle (driver) 13 = Car, truck, or motorcycle (passenger)
2 = Airplane
08=Commercial/charter airplane 09=Private/corporate airplane
20 = Airplane
3 = Bus
10=Local public transit bus 11=Commuter bus 12=School bus 13=Charter/tour bus 14=City to city bus
15 = Bus
4 = Train
15=Amtrak/inter city train 16=Commuter train 17=Subway/elevated rail 18=Street car/trolley
16 = Subway/Train
5 = Boat
19=Ship/cruise
18 = Boat/Ferry
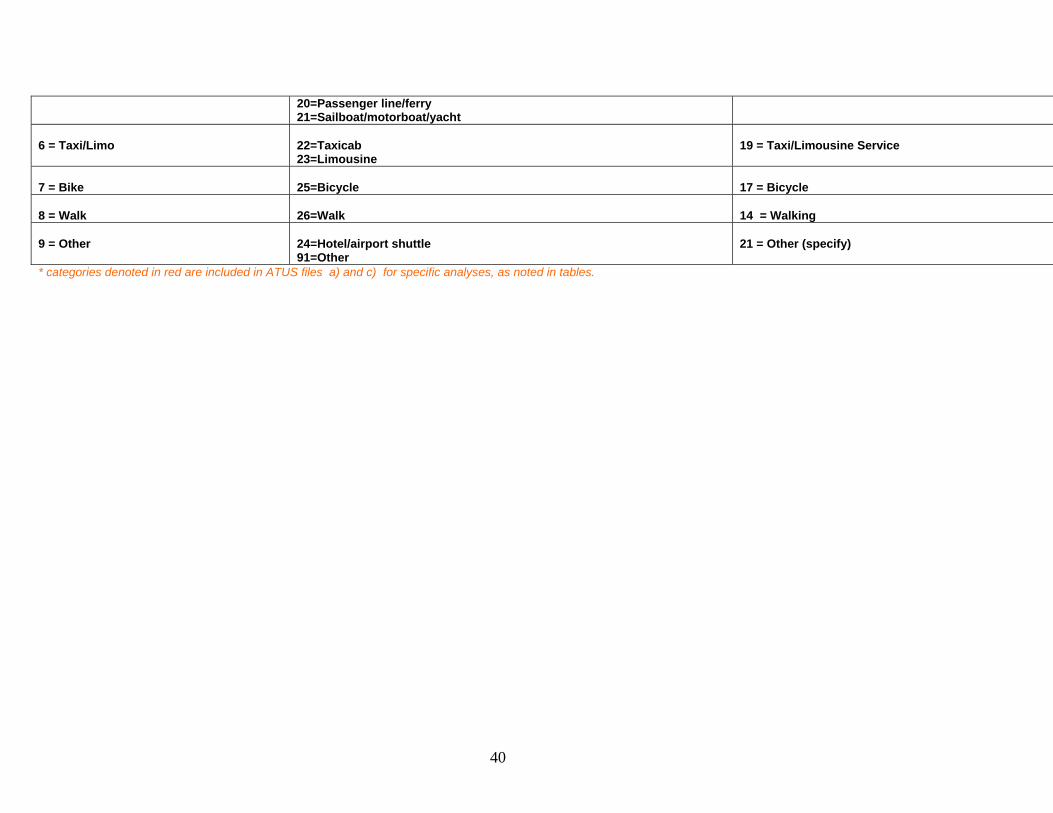
40
20=Passenger line/ferry 21=Sailboat/motorboat/yacht
6 = Taxi/Limo
22=Taxicab 23=Limousine
19 = Taxi/Limousine Service
7 = Bike
25=Bicycle
17 = Bicycle
8 = Walk
26=Walk
14 = Walking
9 = Other
24=Hotel/airport shuttle 91=Other
21 = Other (specify)
* categories denoted in red are included in ATUS files a) and c) for specific analyses, as noted in tables.
41
APPENDIX D CROSSWALK OF NHTS PURPOSE CODE WITH ATUS ACTIVITY CODE
Combined Purpose/Activity Code
NHTS Trip Purpose Code (WHYTO) ATUS Activity Code (TUTIER2CODE = 17_)
“.” = missing
-1=Appropriate Skip -7=Refused -8=Don't Know -9=Not Ascertained
Na
01=Home (all home get recoded into categories using WHYFROM)
1 = Work
11=Go to work 12=Return to work 13=Attend business meeting/trip 14=Other work related
05 Travel Related to Work 01 Commuting to/from work 02 Work-related travel, not commuting 99 Travel related to work, n.e.c.
2 = School/Religious
20=School/religious activity 21=Go to school as student 22=Go to religious activity 23=Go to library: school related 62=Attend funeral/wedding
06 Travel Related to Education 01 Commuting to/from school 02 Education-related travel, not commuting 99 Education travel, n.e.c. 14 Travel Related to Religious/Spiritual Activities 01 Travel related to religious/spiritual practices 99 Travel related to religious/spiritual activities, n.e.c.
3 = Caring for Others
24=OS - Day care 70=Transport someone 71=Pick up someone 72=Take and wait 73=Drop someone off
03 Travel Related to Caring For and Helping household Members 01 Travel related to caring for and helping household children 02 Travel related to caring for and helping household adults 99 Travel related to caring for & helping hh members, n.e.c. 04 Travel Related to Caring For and Helping Nonhousehold Members 01 Travel related to caring for and helping nonhousehold children 02 Travel related to caring for and helping nonhousehold adults 99 Travel related to caring for and helping nonhh members, n.e.c. 08 Travel Related to Using Professional and Personal Care Services 01 Travel related to using childcare services
4 = Personal Business/Errands/Etc.
30=Medical/dental services 40=Shopping/errands 41=Buy goods: groceries/clothing/hardware store
01 Travel Related to Personal Care 01 Travel related to personal care 99 Travel related to personal care, n.e.c. 02 Travel Related to Household Activities
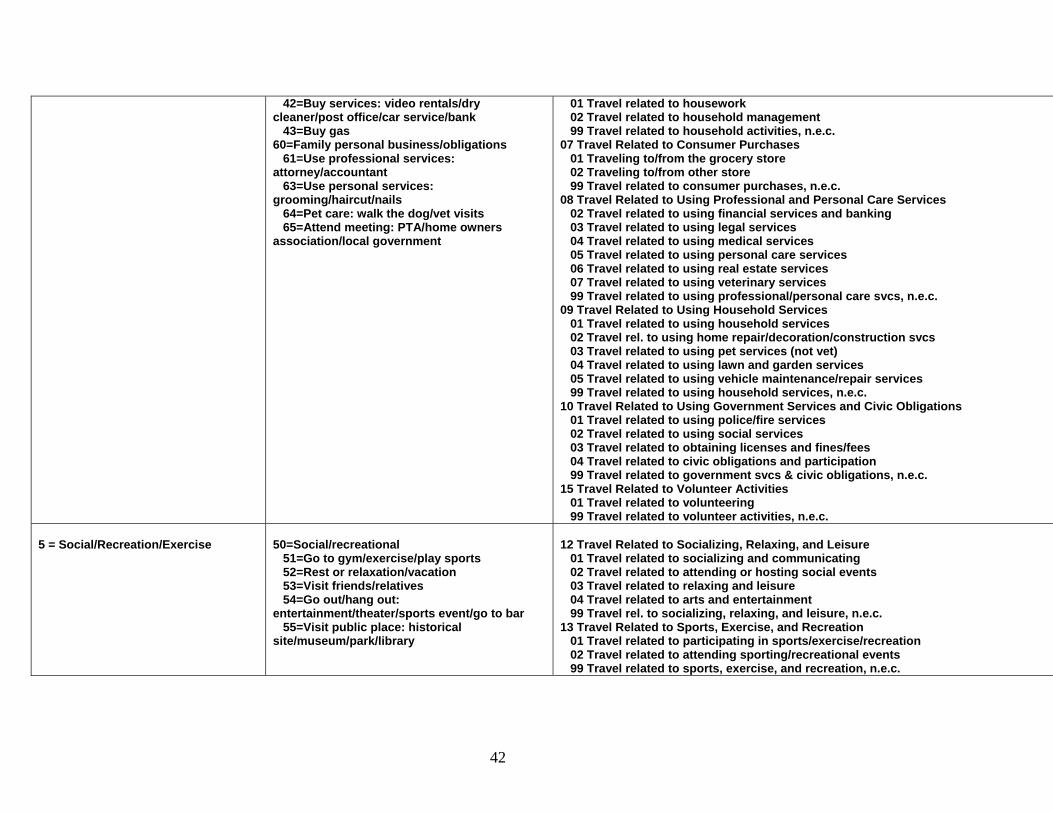
42
42=Buy services: video rentals/dry cleaner/post office/car service/bank 43=Buy gas 60=Family personal business/obligations 61=Use professional services: attorney/accountant 63=Use personal services: grooming/haircut/nails 64=Pet care: walk the dog/vet visits 65=Attend meeting: PTA/home owners association/local government
01 Travel related to housework 02 Travel related to household management 99 Travel related to household activities, n.e.c. 07 Travel Related to Consumer Purchases 01 Traveling to/from the grocery store 02 Traveling to/from other store 99 Travel related to consumer purchases, n.e.c. 08 Travel Related to Using Professional and Personal Care Services 02 Travel related to using financial services and banking 03 Travel related to using legal services 04 Travel related to using medical services 05 Travel related to using personal care services 06 Travel related to using real estate services 07 Travel related to using veterinary services 99 Travel related to using professional/personal care svcs, n.e.c. 09 Travel Related to Using Household Services 01 Travel related to using household services 02 Travel rel. to using home repair/decoration/construction svcs 03 Travel related to using pet services (not vet) 04 Travel related to using lawn and garden services 05 Travel related to using vehicle maintenance/repair services 99 Travel related to using household services, n.e.c. 10 Travel Related to Using Government Services and Civic Obligations 01 Travel related to using police/fire services 02 Travel related to using social services 03 Travel related to obtaining licenses and fines/fees 04 Travel related to civic obligations and participation 99 Travel related to government svcs & civic obligations, n.e.c. 15 Travel Related to Volunteer Activities 01 Travel related to volunteering 99 Travel related to volunteer activities, n.e.c.
5 = Social/Recreation/Exercise
50=Social/recreational 51=Go to gym/exercise/play sports 52=Rest or relaxation/vacation 53=Visit friends/relatives 54=Go out/hang out: entertainment/theater/sports event/go to bar 55=Visit public place: historical site/museum/park/library
12 Travel Related to Socializing, Relaxing, and Leisure 01 Travel related to socializing and communicating 02 Travel related to attending or hosting social events 03 Travel related to relaxing and leisure 04 Travel related to arts and entertainment 99 Travel rel. to socializing, relaxing, and leisure, n.e.c. 13 Travel Related to Sports, Exercise, and Recreation 01 Travel related to participating in sports/exercise/recreation 02 Travel related to attending sporting/recreational events 99 Travel related to sports, exercise, and recreation, n.e.c.
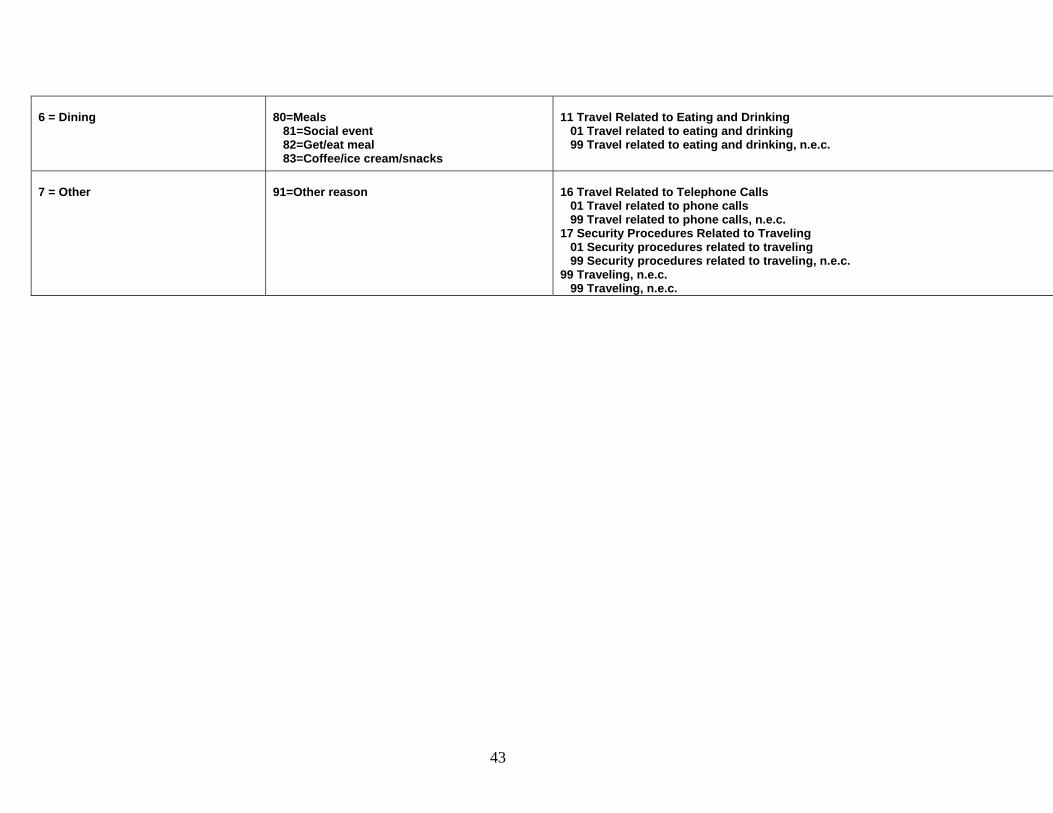
43
6 = Dining
80=Meals 81=Social event 82=Get/eat meal 83=Coffee/ice cream/snacks
11 Travel Related to Eating and Drinking 01 Travel related to eating and drinking 99 Travel related to eating and drinking, n.e.c.
7 = Other
91=Other reason
16 Travel Related to Telephone Calls 01 Travel related to phone calls 99 Travel related to phone calls, n.e.c. 17 Security Procedures Related to Traveling 01 Security procedures related to traveling 99 Security procedures related to traveling, n.e.c. 99 Traveling, n.e.c. 99 Traveling, n.e.c.