Embed Size (px)
Citation preview
Measurement of the neutrino neutral-current elasticdifferential cross section on mineral oil at E##1 GeV
The MIT Faculty has made this article openly available. Please share how this access benefits you. Your story matters.
Citation Aguilar-Arevalo, A. et al. “Measurement of the neutrino neutral-current elastic differential cross section on mineral oil at E_{ν}#1��GeV.” Physical Review D 82.9 (2010) : n. pag. © 2010 The AmericanPhysical Society
As Published http://dx.doi.org/10.1103/PhysRevD.82.092005
Publisher American Physical Society
Version Final published version
Citable link http://hdl.handle.net/1721.1/63147
Terms of Use Article is made available in accordance with the publisher'spolicy and may be subject to US copyright law. Please refer to thepublisher's site for terms of use.
Measurement of the neutrino neutral-current elastic differential cross sectionon mineral oil at E� � 1 GeV
A.A. Aguilar-Arevalo,14 C. E. Anderson,19 A.O. Bazarko,16 S. J. Brice,8 B. C. Brown,8 L. Bugel,12 J. Cao,14 L. Coney,5
J.M. Conrad,13 D. C. Cox,10 A. Curioni,19 R. Dharmapalan,1 Z. Djurcic,2 D.A. Finley,8 B. T. Fleming,19 R. Ford,8
F. G. Garcia,8 G. T. Garvey,11 J. Grange,9 C. Green,8,11 J. A. Green,10,11 T. L. Hart,5 E. Hawker,4,11 R. Imlay,12
R. A. Johnson,4 G. Karagiorgi,13 P. Kasper,8 T. Katori,10,13 T. Kobilarcik,8 I. Kourbanis,8 S. Koutsoliotas,3 E.M. Laird,16
S. K. Linden,19 J.M. Link,18 Y. Liu,15 Y. Liu,1 W.C. Louis,11 K. B.M. Mahn,6 W. Marsh,8 C. Mauger,11 V. T. McGary,13
G. McGregor,11 W. Metcalf,12 P. D. Meyers,16 F. Mills,8 G. B. Mills,11 J. Monroe,6 C.D. Moore,8 J. Mousseau,9
R. H. Nelson,5 P. Nienaber,17 J. A. Nowak,12 B. Osmanov,9 S. Ouedraogo,12 R. B. Patterson,16 Z. Pavlovic,11
D. Perevalov,1,8 C. C. Polly,8 E. Prebys,8 J. L. Raaf,4 H. Ray,9 B. P. Roe,15 A. D. Russell,8 V. Sandberg,11 R. Schirato,11
D. Schmitz,8 M.H. Shaevitz,6 F. C. Shoemaker,16,* D. Smith,7 M. Soderberg,19 M. Sorel,6,† P. Spentzouris,8 J. Spitz,19
I. Stancu,1 R. J. Stefanski,8 M. Sung,12 H. A. Tanaka,16 R. Tayloe,10 M. Tzanov,5 R.G. Van de Water,11 M.O. Wascko,12,‡
D.H. White,11 M. J. Wilking,5 H. J. Yang,15 G. P. Zeller,8 and E.D. Zimmerman5
(MiniBooNE Collaboration)
1University of Alabama, Tuscaloosa, Alabama 35487, USA2Argonne National Laboratory, Argonne, Illinois 60439, USA3Bucknell University, Lewisburg, Pennsylvania 17837, USA4University of Cincinnati, Cincinnati, Ohio 45221, USA5University of Colorado, Boulder, Colorado 80309, USA6Columbia University, New York, New York 10027, USA
7Embry Riddle Aeronautical University, Prescott, Arizona 86301, USA8Fermi National Accelerator Laboratory, Batavia, Illinois 60510, USA
9University of Florida, Gainesville, Florida 32611, USA10Indiana University, Bloomington, Indiana 47405, USA
11Los Alamos National Laboratory, Los Alamos, New Mexico 87545, USA12Louisiana State University, Baton Rouge, Louisiana 70803, USA
13Massachusetts Institute of Technology, Cambridge, Massachusetts 02139, USA14Instituto de Ciencias Nucleares, Universidad National Autonoma de Mexico, D.F. 04510, Mexico
15University of Michigan, Ann Arbor, Michigan 48109, USA16Princeton University, Princeton, New Jersey 08544, USA
17Saint Mary’s University of Minnesota, Winona, Minnesota 55987, USA18Virginia Polytechnic Institute and State University, Blacksburg, Virginia 24061, USA
19Yale University, New Haven, Connecticut 06520, USA(Received 13 August 2010; published 18 November 2010)
We report a measurement of the flux-averaged neutral-current elastic differential cross section for
neutrinos scattering on mineral oil (CH2) as a function of four-momentum transferred squared, Q2. It is
obtained by measuring the kinematics of recoiling nucleons with kinetic energy greater than 50 MeV
which are readily detected in MiniBooNE. This differential cross-section distribution is fit with fixed
nucleon form factors apart from an axial mass MA that provides a best fit for MA ¼ 1:39� 0:11 GeV.
Using the data from the charged-current neutrino interaction sample, a ratio of neutral-current to charged-
current quasielastic cross sections as a function of Q2 has been measured. Additionally, single protons
with kinetic energies above 350 MeV can be distinguished from neutrons and multiple nucleon events.
Using this marker, the strange quark contribution to the neutral-current axial vector form factor atQ2 ¼ 0,
�s, is found to be �s ¼ 0:08� 0:26.
DOI: 10.1103/PhysRevD.82.092005 PACS numbers: 13.15.+g, 12.15.Mm, 13.85.Dz, 14.20.Dh
*Deceased.†Present address: IFIC, Universidad de Valencia and CSIC, Valencia 46071, Spain.‡Present address: Imperial College, London SW7 2AZ, United Kingdom.
PHYSICAL REVIEW D 82, 092005 (2010)
1550-7998=2010=82(9)=092005(16) 092005-1 � 2010 The American Physical Society
I. INTRODUCTION
Neutrino-nucleon neutral-current elastic (NCE) scatter-ing is a unique and fundamental probe of the nucleon.NCE scattering on a nuclear target such as carbon maybe viewed as scattering from the individual nucleons butmay also include contributions from collective nucleareffects. This process should be sensitive to nucleonisoscalar weak currents as opposed to charged-currentquasielastic (CCQE) scattering which interacts only viaisovector weak currents. Therefore, the NCE process canbe used to search for strange quarks in the nucleonwhich may show themselves via the isoscalar weakcurrent. In addition, the NCE process offers a comple-mentary channel to CCQE to investigate any substantialcollective nuclear effects in a nucleus such as carbon.
Over the years, a handful of experiments have measured(anti)neutrino-proton neutral-current elastic scatteringcross sections, most commonly as ratios to QE scattering[1–7]. The most recent and highest statistics measurementwas conducted in the mid-1980s at Brookhaven NationalLaboratory (BNL) using a 170 ton liquid scintillator de-tector operating in a horn-focused neutrino (antineutrino)beam. In this case, BNL E734 recorded 1686 �p ! �p and1821 ��p ! ��p candidate events allowing for measure-ments of the differential cross section for this process asa function of four-momentum transfer squared (Q2). Thesewere effectively NCE/CCQE differential cross-section ra-tios as the BNL neutrino flux was determined from aCCQE event sample [8].
The MiniBooNE experiment [9,10], while designed tosearch for neutrino oscillations, also has the capability tomeasure NCE scattering given that NCE events account forabout 18% of the total neutrino sample collected. A largefraction of these neutral-current events are readily observ-able in the MiniBooNE detector which uses pure mineraloil (CH2) as a detector medium. The detector is predomi-nantly a Cherenkov detector, however, fluors presented inthe mineral oil produce a small amount of scintillation lightwell below Cherenkov threshold for relativistic chargedparticles (such as electrons, muons, protons, etc.). Theabsence of prompt Cherenkov light allows for the identi-fication and measurement of the recoiling nucleons pro-duced in neutrino NCE scattering.
The main result presented in this paper is a high-statistics measurement of the flux-averaged differentialcross section as a function of Q2 for NCE scattering onCH2 in MiniBooNE for 0:1 GeV2 <Q2 < 1:65 GeV2. It ispresented as scattering from individual nucleons bothbound (in carbon) and free (in hydrogen). However, it isacknowledged that nuclear effects may well be importantfor full understanding of this data.
A preliminary measurement of the MiniBooNE NCEdifferential cross section had been performed early onusing 6:57� 1019 protons on the neutrino production tar-get (POT) [11]. The results presented in this paper are
based on the entire data set in neutrino mode, for a totalof 6:46� 1020 POT and an improved event reconstruction.MiniBooNE has also collected antineutrino data which willbe presented in subsequent works.To characterize the NCE from carbon in MiniBooNE,
the relativistic Fermi gas model of Smith andMoniz is usedas described in Sec. II D. Within this model, two funda-mental parameters are employed: the nucleon axial massMA and the strange quark contribution to the axial formfactor,�s. It is acknowledged that nuclear effects in carbonmay cause this axial mass to be an ‘‘effective’’ value andnot the same as that for scattering from free nucleons. Theformalism for NCE scattering on free nucleons, which isbasic to any model-dependent approach to characterize theNCE data, is summarized in Appendix B.While the generally accepted value for MA is 1:026�
0:021 GeV [12], recent experiments [13–16] measuringCCQE from nuclear targets have found it useful to employvalues that are 20%–30% larger to fit theQ2 dependence oftheir observed yields. It may be that this increased value ofMA should be understood not as the MA obtained for freenucleons but rather as a parametrization of neglected nu-clear effects [17,18]. Regardless, an extraction ofMA fromNCE scattering offers a complementary test to the MA
determined from CCQE.Previously, BNL E734 is the only experiment to report
an MA measurement from a NCE sample. They obtainMA ¼ 1:06� 0:05 GeV [7] fitting their measured �p !�p and ��p ! ��p differential cross sections as a functionof Q2. A later reanalysis of that sample data obtainedsimilarly small values of MA [19]. In this paper, a mea-surement of MA is determined from NCE scattering inde-pendent of CCQE.The strange quark contribution to the nucleon spin at
Q2 ¼ 0, �s, can also be extracted via the NCE processwithin a relativistic Fermi gas model. The NCE differentialcross section at low Q2 is sensitive to �s [20] for bothneutrinos and antineutrinos. The BNL E734 experimentmeasured these processes and reported �s ¼ �0:15�0:09 [7,19,21]. However, ratio measurements offer thepossibility for extracting �s at low Q2 with reduced sys-tematic errors. For example, a measurement of ð�p !�pÞ=ð��n ! �pÞ has been proposed by the FINeSSE
experiment [22]. In this paper, a ratio of ð�p !�pÞ=ð�N ! �NÞ at Q2 > 0:7 GeV is used to extract �s,where N is a neutron or proton.In the following sections the MiniBooNE experiment is
described, including a description of the neutrino beamline, detector, neutrino flux prediction, and the cross-section model used to predict the rates of different neutrinointeractions in the detector. In Secs. III and IV, methodsand techniques used in the NCE analysis are presentedtogether with various results, including the NCE differen-tial cross section, the NCE/CCQE ratio and measurementsofMA and �s. Section V contains a summary of the paper.
A. A. AGUILAR-AREVALO et al. PHYSICAL REVIEW D 82, 092005 (2010)
092005-2
Also, Appendixes A and B have additional informationuseful for interpreting the results which is not included inthe main text.
II. MINIBOONE EXPERIMENT
A. Neutrino beam line
The Booster Neutrino Beam line (BNB) at the FermiNational Accelerator Laboratory uses a beam of protonswith momentum 8:89 GeV=c to produce an intense andalmost pure beam of �� with an average energy of about
800 MeV. Protons are extracted from the Fermilab Boosterin 1:6 �s pulses with �4� 1012 protons in each beampulse. They are delivered onto a beryllium target, where asecondary beam of mesons is produced in p-Be interac-tions. Mesons are passed through a magnetic horn, a devicewhich focuses positively charged particles and defocusesnegatively charged particles. Mesons decay in an air-filleddecay pipe producing a beam of neutrinos. Using themagnetic horn increases the neutrino flux at theMiniBooNE detector by a factor of �6. The details onthe BNB components can be found in Ref. [9].
B. Neutrino flux prediction
The neutrino flux at the detector is calculated via aGEANT4-based [23] Monte Carlo (MC) beam simulation.
The simulation includes a full beam geometry, specified byshape, location, and material composition of the BNBcomponents. The MC generates protons upstream of thetarget and propagates them through the target, generatingand propagating products of p-Be interactions through therest of the simulated BNB. In the �� flux at the
MiniBooNE detector, 96.7% of neutrinos are producedvia �þ ! �þ þ �� decay. The �þ production double
differential cross section used in the beam MC is basedon a fit to an external measurement from the HARP
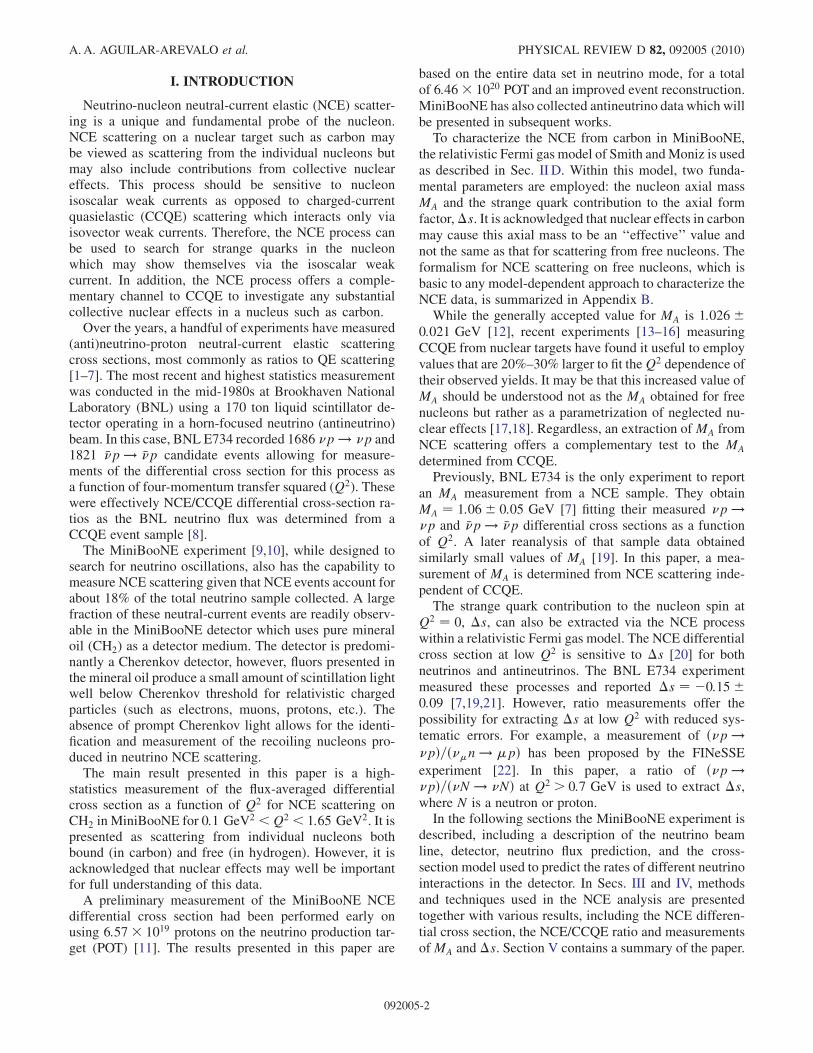
experiment on the same target and with the same protonbeam energy as in the BNB [24].The neutrino flux prediction for different types of neu-
trino species is shown in Fig. 1. Flux tables are available inRef. [25]. The �þ production contribution to the neutrinoflux uncertainty is about 5% at the peak of the flux distri-bution, increasing significantly at low and high neutrinoenergies. Other contributions to the flux error include un-certainties on other mesons production cross sections, thenumber of POT, and the horn magnetic field [9,26].
C. Detector
The MiniBooNE detector is situated 541 m from theBe target, under 3 m of overburden in order to reducecosmic backgrounds. It is a 12.2 m diameter spherical steeltank, filled with mineral oil. The tank is divided intotwo optically isolated regions: a signal region being aninner sphere of radius 5.75 m and a veto region that is anouter shell with a thickness of 0.35 m. Photomultipliertubes (PMTs) are used to detect photons emitted by thecharged particles which are produced in the neutrinointeractions. Charged particles may emit both Cherenkovand scintillation light. Information from all PMTs is usedto identify and reconstruct the products of neutrinointeractions.A total of 1520 8-inch PMTs [27] are instrumented in the
detector. There are 1280 PMTs attached to the sphericalbarrier from the inside, in the signal region, facing towardthe center of the tank and distributed approximately uni-formly. The remaining 240 PMTs are placed in the vetoregion and are used to tag charged particles entering orleaving the tank. The veto PMTs are mounted back-to-back, tangentially to the optical barrier, in order to have asmuch veto view as possible. Details on the MiniBooNEdetector can be found elsewhere [10].
D. Cross-section model
Neutrino interactions within the detector are simulatedwith the NUANCE-V3 event generator [28], where therelativistic Fermi gas model of Smith and Moniz [29] isused to describe NCE scattering. Fermi momentum forcarbon is taken to be 220� 20 MeV and binding energy34� 9 MeV.The contribution from strange quarks to the vector and
axial vector form factors is taken to be zero. The erroron�s is taken to be 0.1. The value ofMA used in the MC isdifferent for the quasielastic (both neutral and charged-current) scattering on carbon and hydrogen: For scatteringon carbonMA ¼ 1:230� 0:077 GeV is used (as measuredfrom the CCQE channel in MiniBooNE [13]), while forscattering on hydrogen MA ¼ 1:13� 0:10 GeV is used(which is the average between the values measured by thedeuterium-based scattering experiments and MiniBooNE).For resonant pion production, the Rein and Sehgal model
[30] is used. In the few GeV range, such processes are
(GeV)νE0 0.5 1 1.5 2 2.5 3
/PO
T/5
0 M
eV2
1/cm
-1510
-1410
-1310
-1210
-1110µνµνeνeν
FIG. 1 (color online). Neutrino flux at the MiniBooNE detec-tor for different types of neutrinos as a function of their energy asreported in [9,25].
MEASUREMENT OF THE NEUTRINO NEUTRAL-CURRENT . . . PHYSICAL REVIEW D 82, 092005 (2010)
092005-3
dominated by the �ð1232Þ resonance, although contribu-tions from higher mass resonances are also included in theMC. A value of M1�
A ¼ 1:10� 0:27 GeV is used for both
charge current (CC) and NC single pion events as deter-mined from external data [31–34]. For multipion produc-tion processes, a value of MN�
A ¼ 1:30� 0:52 GeV is
assumed so that the sum of the exclusive CC channelsreproduces CC inclusive data [35].
Intranuclear final state interactions (FSI) inside the car-bon nucleus are modeled in NUANCE using a binary cascademodel [28], where the scattered hadrons are propagatedthrough the nucleus, which is simulated based on models ofnuclear density and Fermi momentum. Because of FSI, aNCE interaction may produce more than one final stateparticle (other than the neutrino). For NCE scattering oncarbon, the probability of producing multiple nucleons is�26% integrated over the MiniBooNE flux, according toNUANCE. Also, a NC pion event might not contain any
pions in the final state as the pion can be absorbed in thecarbon nucleus or the baryonic resonance reinteracts with-out decaying. These are the dominant mechanisms bywhich NC pion events can become backgrounds to thisanalysis. The probability that a pion is absorbed is �20%in carbon for MiniBooNE energies, according to theNUANCE simulation. The intranuclear pion absorption cross
section is assigned a 25% uncertainty based on externalpion-carbon data [36–38], and �N ! NN interactions areassigned a 100% uncertainty.
Neutrino interactions outside the detector, in the sur-rounding dirt or in the detector material (referred to as‘‘dirt’’ background henceforth), are simulated the sameway as the in-tank interactions but with a cross sectionreweighted according to the density of the material relativeto that of the mineral oil.
Particle propagation in the detector is modeled using aGEANT3-based [39] MC with GCALOR [40] hadronic in-teractions simulating the detector response to particlesproduced in the neutrino interactions. GCALOR was chosenover GFLUKA [41] simulation, as it provides a better modelof �þ interactions on carbon [42].
III. NEUTRAL-CURRENT ELASTIC ANALYSIS
A. Event reconstruction
Event reconstruction in MiniBooNE is based on findinga set of parameters (position, time, direction, and energy—where applicable) which maximizes the event likelihoodusing the charge and time information from all PMTs.Each event is reconstructed using some combination ofsix different event hypotheses—single proton (NCE-like),single muon (�� CCQE-like), single electron (�e CCQE-
like), single �0 (NC �0 productionlike), muon and �þwith the same vertex (�� CC �þ productionlike), and
muon and �0 with the same vertex (�� CC �0 production-
like). A charge-time likelihood minimization method [43]
is used to obtain the best estimate of the kinematic observ-ables in each event hypothesis. Under the NCE hypothesis,each event is assumed to be a pointlike proton withCherenkov and scintillation light emission profilesdetermined from the MC. The output variables from theseevent reconstructions (such as likelihood ratios be-tween two different event hypotheses) allow for particleidentification.The resulting position resolution is �0:75 m for proton
events in the detector and �1:35 m for neutrons, with anenergy resolution of �20% for protons and �30% forneutrons. For protons above Cherenkov threshold, thedirection resolution is �10�.Light emission properties of protons differ from those of
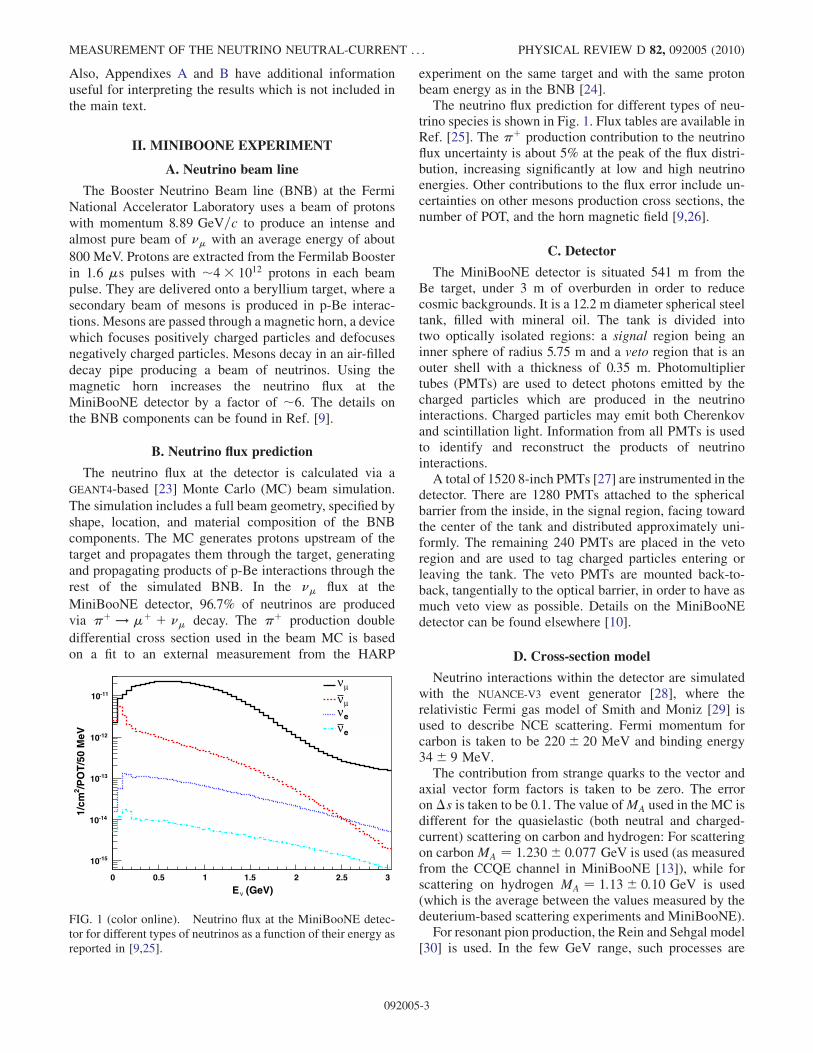
other charged particles in the detector, allowing for theirparticle identification. For instance, protons differ fromelectrons in terms of the fraction of prompt light emitted,defined as the fraction of PMT hits with a corrected timebetween �5 and 5 ns, as illustrated in Fig. 2, where thecorrected time is the time difference between the PMT hittime and the reconstructed event time, with light propaga-tion time from the reconstructed vertex to the PMT alsotaken into account.Being neutral particles, neutrons themselves do not cause
light emission in the detector. However wemay detect themthrough their subsequent strong reinteractions, in whichusually energetic protons are produced. Because we detectNCE neutrons only through secondary protons, they arevirtually indistinguishable from NCE proton events.For MiniBooNE NCE interactions, the total charge on
all PMTs is proportional to the sum of kinetic energies ofall final state nucleons that are produced in the interaction,which is referred to throughout this paper as T. It isimportant to understand that the nucleon kinetic energymeasured this way is different from the one determinedfrom the track-based reconstruction used in the SciBooNE
Tank PMT hits40 60 80 100 120 140 160
Fra
ctio
n o
f p
rom
pt
hit
s
0.2
0.3
0.4
0.5
0.6
0.7
0.8
0.9 MC neutral current elastic
Beam-unrelated data
FIG. 2 (color online). Fraction of prompt hits versus the totalnumber of tank PMT hits for beam-unrelated data and NCE MCevents reconstructed under an electron hypothesis. The error barscorrespond to the root mean square of the distributions.
A. A. AGUILAR-AREVALO et al. PHYSICAL REVIEW D 82, 092005 (2010)
092005-4
[44] and BNL E734 [7] experiments. In that case, thereconstructed proton track length is proportional to thekinetic energy of the most energetic proton produced inthe event. Also the particle identification in MiniBooNE isbased almost entirely on the properties of the measuredCherenkov ring (such as ring sharpness, charge, and timelikelihoods), whereas the track-based experiments mostlyuse the particle’s energy loss along the track.
B. Event selection
The following set of selection criteria (cuts) are appliedto the full MiniBooNE data set to select the NCE sample:
(1) Only 1 subevent to ensure the event is NC andincludes no decaying particles (e.g., � decay). Asubevent is a cluster of at least 10 tank PMT hits forwhich there is no more than 10 ns between any twoconsecutive hits. For example, a CCQE event typi-cally contains two subevents; the first subevent isassociated with the outgoing muon, while the sec-ond is associated with the subsequent decay electron[26].
(2) Number of veto PMT hits is less than 6 to removeevents exiting or entering the detector: V hits< 6.
(3) Number of tank PMT hits is greater than 24 toensure a reliable reconstruction: T hits> 24.
(4) Beam time window cut in order to consider onlyevents time-coincident with the neutrino beam.
(5) Reconstructed proton energy of T < 650 MeV(above which the signal to background ratio de-creases significantly).
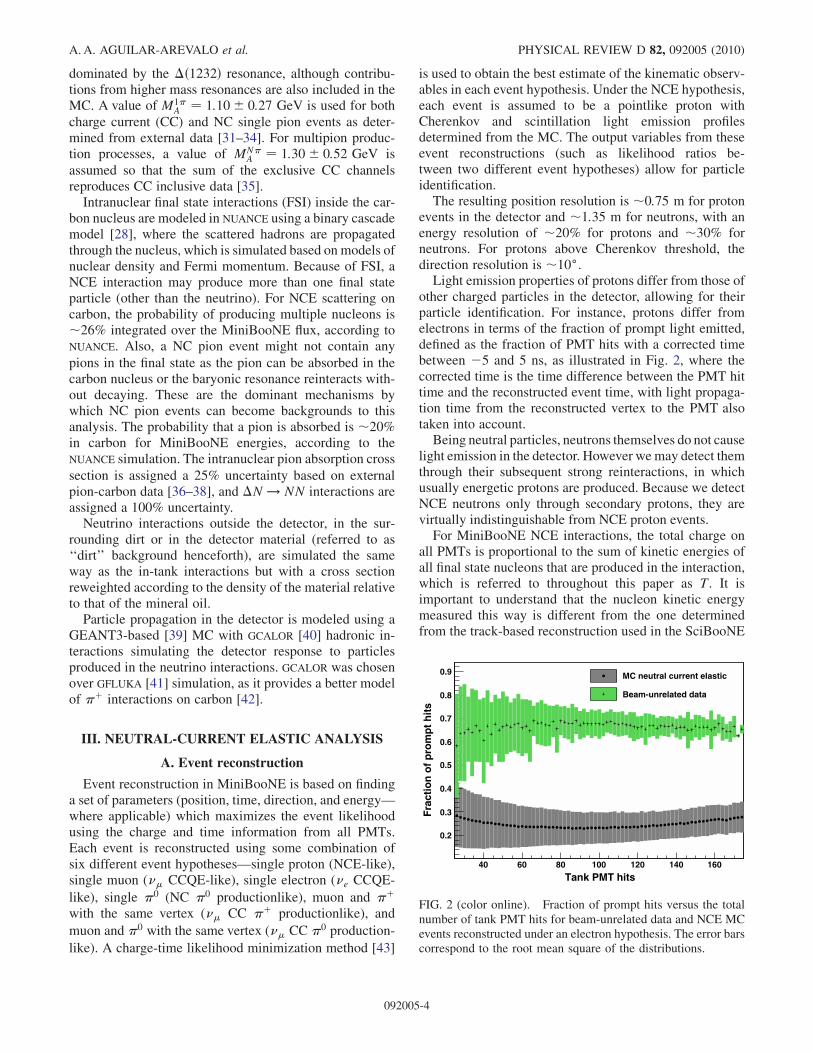
(6) Log-likelihood ratio between electron and protonevent hypotheses of lnðLe=LpÞ< 0:42. The pur-
pose of this cut is to eliminate beam-unrelated elec-trons from cosmic-ray muon decays. Even though
the variable shown in Fig. 2 provides a good sepa-ration between proton and electron events, it wasfound that the log-likelihood ratio is most effectivein capturing all differences between the NCE signaland this background. The lnðLe=LpÞ variable and
the value of the cut are shown in Fig. 3 for simulatedNCE and the beam-unrelated data. The beam-unrelated data events are mostly muon decay(Michel) electrons.
(7) A fiducial volume cut, defined as follows:
RfiducialðTÞ ¼�R< 4:2 m if T < 200 MeV;R < 5:0 m if T > 200 MeV:
A tighter fiducial volume is required at low energiesto reduce the dirt background.
A total of 94 531 events pass the NCE cuts resultingfrom 6:46� 1020 POT. This is the largest NCE eventsample collected to date. The efficiency of the cuts isestimated to be 35%, a large portion of which stems fromthe fiducial volume cut. We consider all NCE events withoriginal vertices inside the detector as signal. The pre-dicted fraction of NCE events in the sample is 65%. Theremaining 35% of events are backgrounds of differenttypes: 15% are NCE-like backgrounds, 10% dirt events,and 10% other backgrounds (of which only 0.5% are beam-unrelated). The reconstructed nucleon kinetic energy spec-trum for selected NCE events with a uniform fiducialvolume cut is shown in Fig. 4 along with the predictedbackground contributions.The NCE-like background consists of NC pion produc-
tion channels with no pion in the final state (i.e. the pion isabsorbed in the initial target nucleus through FSI). In thiscase, the final state particles for these events are solelynucleons. In MiniBooNE, this is indistinguishable from thefinal state produced in NCE events and hence why these
)p/Le
ln(L-1 -0.5 0 0.5 1 1.5 2
En
trie
s
0
0.02
0.04
0.06
0.08
0.1
0.12Neutral current elastic MC
Beam-unrelated data
FIG. 3 (color online). Log-likelihood ratio between electronand proton event hypotheses for MC-generated NCE scatteringevents and beam-unrelated data. Both histograms are normalizedto unit area. Events with lnðLe=LpÞ< 0:42 are selected for the
analysis.
T (MeV)100 200 300 400 500 600
Eve
nts
/(12
MeV
)
0
500
1000
1500
2000
2500
3000
Data with total error
Total MC
Neutral current elasticNCE-like backgroundsDirt backgrounds
Other backgrounds
FIG. 4 (color online). Reconstructed nucleon kinetic energyspectra for the data and MC after the NCE event selection and auniform fiducial volume cut of R < 4:2 m are applied. All MCdistributions are normalized to the number of POT).
MEASUREMENT OF THE NEUTRINO NEUTRAL-CURRENT . . . PHYSICAL REVIEW D 82, 092005 (2010)
092005-5
events are referred to as NCE-like background. The NCE-like background contributes mostly at intermediate ener-gies 200 MeV< T < 500 MeV.
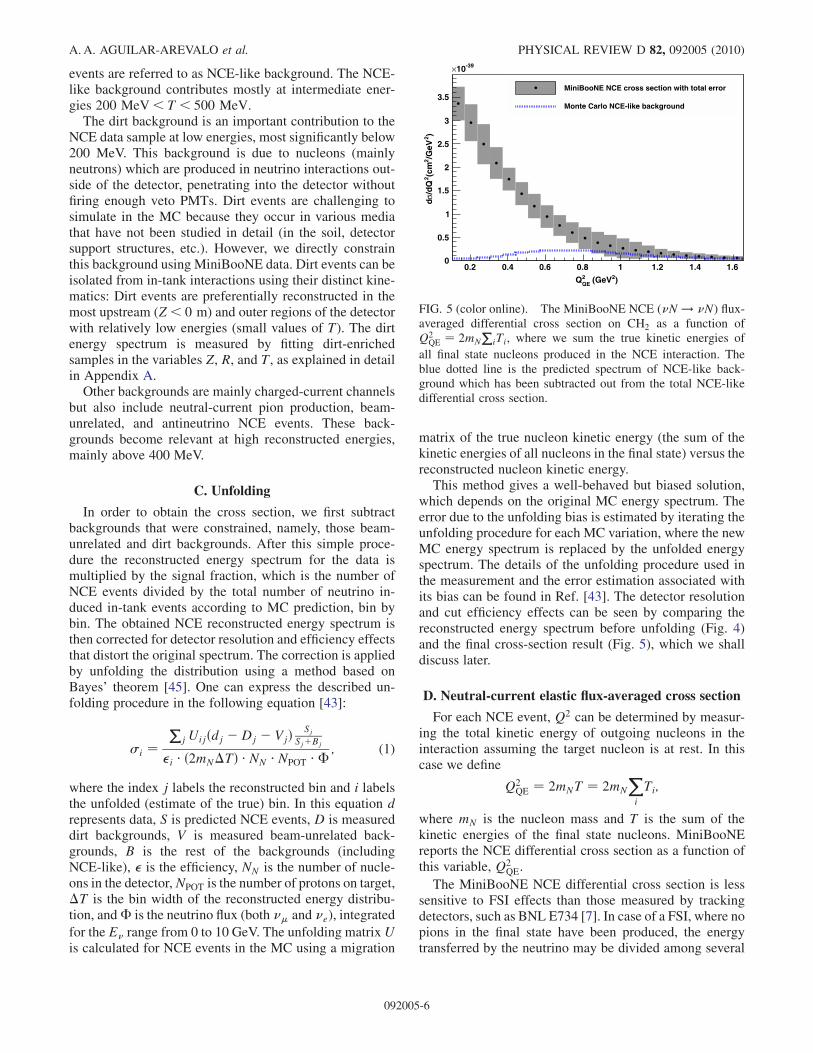
The dirt background is an important contribution to theNCE data sample at low energies, most significantly below200 MeV. This background is due to nucleons (mainlyneutrons) which are produced in neutrino interactions out-side of the detector, penetrating into the detector withoutfiring enough veto PMTs. Dirt events are challenging tosimulate in the MC because they occur in various mediathat have not been studied in detail (in the soil, detectorsupport structures, etc.). However, we directly constrainthis background using MiniBooNE data. Dirt events can beisolated from in-tank interactions using their distinct kine-matics: Dirt events are preferentially reconstructed in themost upstream (Z < 0 m) and outer regions of the detectorwith relatively low energies (small values of T). The dirtenergy spectrum is measured by fitting dirt-enrichedsamples in the variables Z, R, and T, as explained in detailin Appendix A.
Other backgrounds are mainly charged-current channelsbut also include neutral-current pion production, beam-unrelated, and antineutrino NCE events. These back-grounds become relevant at high reconstructed energies,mainly above 400 MeV.
C. Unfolding
In order to obtain the cross section, we first subtractbackgrounds that were constrained, namely, those beam-unrelated and dirt backgrounds. After this simple proce-dure the reconstructed energy spectrum for the data ismultiplied by the signal fraction, which is the number ofNCE events divided by the total number of neutrino in-duced in-tank events according to MC prediction, bin bybin. The obtained NCE reconstructed energy spectrum isthen corrected for detector resolution and efficiency effectsthat distort the original spectrum. The correction is appliedby unfolding the distribution using a method based onBayes’ theorem [45]. One can express the described un-folding procedure in the following equation [43]:
�i ¼P
j Uijðdj �Dj � VjÞ SjSjþBj
�i � ð2mN�TÞ � NN � NPOT �� ; (1)
where the index j labels the reconstructed bin and i labelsthe unfolded (estimate of the true) bin. In this equation drepresents data, S is predicted NCE events, D is measureddirt backgrounds, V is measured beam-unrelated back-grounds, B is the rest of the backgrounds (includingNCE-like), � is the efficiency, NN is the number of nucle-ons in the detector,NPOT is the number of protons on target,�T is the bin width of the reconstructed energy distribu-tion, and� is the neutrino flux (both �� and �e), integrated
for the E� range from 0 to 10 GeV. The unfolding matrixUis calculated for NCE events in the MC using a migration
matrix of the true nucleon kinetic energy (the sum of thekinetic energies of all nucleons in the final state) versus thereconstructed nucleon kinetic energy.This method gives a well-behaved but biased solution,
which depends on the original MC energy spectrum. Theerror due to the unfolding bias is estimated by iterating theunfolding procedure for each MC variation, where the newMC energy spectrum is replaced by the unfolded energyspectrum. The details of the unfolding procedure used inthe measurement and the error estimation associated withits bias can be found in Ref. [43]. The detector resolutionand cut efficiency effects can be seen by comparing thereconstructed energy spectrum before unfolding (Fig. 4)and the final cross-section result (Fig. 5), which we shalldiscuss later.
D. Neutral-current elastic flux-averaged cross section
For each NCE event, Q2 can be determined by measur-ing the total kinetic energy of outgoing nucleons in theinteraction assuming the target nucleon is at rest. In thiscase we define
Q2QE ¼ 2mNT ¼ 2mN
Xi
Ti;
where mN is the nucleon mass and T is the sum of thekinetic energies of the final state nucleons. MiniBooNEreports the NCE differential cross section as a function ofthis variable, Q2
QE.
The MiniBooNE NCE differential cross section is lesssensitive to FSI effects than those measured by trackingdetectors, such as BNL E734 [7]. In case of a FSI, where nopions in the final state have been produced, the energytransferred by the neutrino may be divided among several
)2 (GeVQE2Q
0.2 0.4 0.6 0.8 1 1.2 1.4 1.6
)2/G
eV2
(cm
2/d
Qσd
0
0.5
1
1.5
2
2.5
3
3.5
-3910×
MiniBooNE NCE cross section with total error
Monte Carlo NCE-like background
FIG. 5 (color online). The MiniBooNE NCE (�N ! �N) flux-averaged differential cross section on CH2 as a function ofQ2
QE ¼ 2mN
PiTi, where we sum the true kinetic energies of
all final state nucleons produced in the NCE interaction. Theblue dotted line is the predicted spectrum of NCE-like back-ground which has been subtracted out from the total NCE-likedifferential cross section.
A. A. AGUILAR-AREVALO et al. PHYSICAL REVIEW D 82, 092005 (2010)
092005-6
outgoing nucleons, but the total energy released in theMiniBooNE detector stays roughly the same due to energyconservation. Track-based detectors measure Q2 by theproton track length and its angle with respect to the beamdirection, which are kinematic observables of the mostenergetic proton produced in the NCE event. In that case,FSI may have large effects on the kinematics of individualoutgoing nucleons, including the most energetic nucleon.Of course, there are still some FSI interactions producingfinal state pions which must be modeled and which canaffect MiniBooNE NCE cross-section measurement.
The resulting NCE flux-averaged differential cross sec-tion on CH2 is shown in Fig. 5 as a function of Q2
QE. The
predicted distribution of the NCE-like background, whichhas been subtracted along with the rest of backgrounds, isalso shown in the figure. The NCE scattering is a sum ofthree different processes: scattering on free protons inhydrogen, bound protons in carbon, and bound neutronsin carbon. A detailed description of the contributions ofeach of these processes to the total MiniBooNE NCE crosssection is given in Appendix B.
Systematic uncertainties and their contribution to thetotal error have been studied. The normalization errorcan be represented by a single number, shown in Table I.The largest systematic error in the NC analysis, the opticalmodel, arises from the uncertainty on both Cherenkov andscintillation light production by charged particles in min-eral oil. Cherenkov light production has been calibrated oncosmic muons, Michel electrons, and neutral pions [10].An error of 20% on this amplitude of scintillation lightgenerated by sub-Cherenkov particles in the detector hasbeen assigned through a combination of benchtop mea-surements and in situ calibrations (see Appendix C ofRef. [43] for details).
E. Neutral-current elastic to charged-currentquasielastic cross-section ratio measurement
Given that MiniBooNE measures a CCQE differentialcross section [26] that is �30% higher than naive expec-
tations from the relativistic Fermi gas model [29], it isinteresting to compare those results with our NCE mea-surement. To facilitate such a comparison and, at the sametime, reduce flux uncertainties, we extract the NCE/CCQEratio as a function of Q2
QE. In the case of CCQE, Q2QE has
been defined from the outgoing muon kinematics only,assuming a stationary neutron target (see Ref. [26] fordetails). It should be pointed out that a significant differ-ence exists in how these cross sections are measured inMiniBooNE. As explained earlier, the NCE cross section iscalculated from the measured total kinetic energy of final
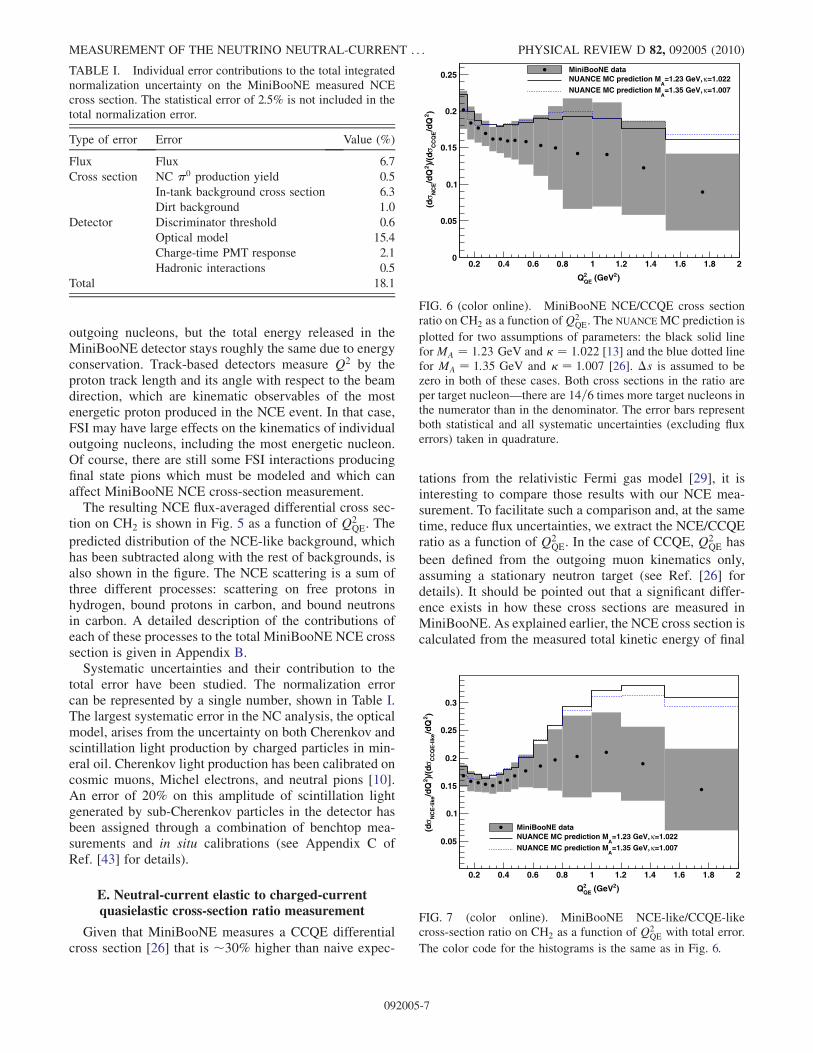
TABLE I. Individual error contributions to the total integratednormalization uncertainty on the MiniBooNE measured NCEcross section. The statistical error of 2.5% is not included in thetotal normalization error.
Type of error Error Value (%)
Flux Flux 6.7
Cross section NC �0 production yield 0.5
In-tank background cross section 6.3
Dirt background 1.0
Detector Discriminator threshold 0.6
Optical model 15.4
Charge-time PMT response 2.1
Hadronic interactions 0.5
Total 18.1)2 (GeVQE
2Q
0.2 0.4 0.6 0.8 1 1.2 1.4 1.6 1.8 2
)2/d
QC
CQ
Eσ
)/(d
2/d
QN
CE
σ(d
0
0.05
0.1
0.15
0.2
0.25MiniBooNE data
=1.022κ=1.23 GeV, A
NUANCE MC prediction M
=1.007κ=1.35 GeV, A
NUANCE MC prediction M
FIG. 6 (color online). MiniBooNE NCE/CCQE cross sectionratio on CH2 as a function ofQ
2QE. The NUANCE MC prediction is
plotted for two assumptions of parameters: the black solid lineforMA ¼ 1:23 GeV and � ¼ 1:022 [13] and the blue dotted linefor MA ¼ 1:35 GeV and � ¼ 1:007 [26]. �s is assumed to bezero in both of these cases. Both cross sections in the ratio areper target nucleon—there are 14=6 times more target nucleons inthe numerator than in the denominator. The error bars representboth statistical and all systematic uncertainties (excluding fluxerrors) taken in quadrature.
)2 (GeVQE2Q
0.2 0.4 0.6 0.8 1 1.2 1.4 1.6 1.8 2
)2/d
QC
CQ
E-l
ike
σ)/
(d2
/dQ
NC
E- l
ike
σ(d
0.05
0.1
0.15
0.2
0.25
0.3
MiniBooNE data=1.022κ=1.23 GeV,
ANUANCE MC prediction M
=1.007κ=1.35 GeV, A
NUANCE MC prediction M
FIG. 7 (color online). MiniBooNE NCE-like/CCQE-likecross-section ratio on CH2 as a function of Q2
QE with total error.
The color code for the histograms is the same as in Fig. 6.
MEASUREMENT OF THE NEUTRINO NEUTRAL-CURRENT . . . PHYSICAL REVIEW D 82, 092005 (2010)
092005-7
state nucleons and is mildly sensitive to FSI, whereas theCCQE is calculated entirely from the reconstructed muonand is not sensitive to FSI.
The measured ratio is shown in Fig. 6 together with theNUANCE MC prediction. The data/MC agreement is rea-
sonable within errors.Adding the MC NCE-like background prediction to the
numerator and the MC CCQE-like background predictionto the denominator produces a NCE-like to CCQE-likedifferential cross-section ratio, which is additionally shownin Fig. 7. This is an even more model-independent mea-surement, where we do not have to rely on modeling ofboth NCE-like and CCQE-like backgrounds and claimthem as a part of the signal.
The measured NCE/CCQE ratio is consistent with thatpredicted by the MC. This is an important point whenconsidering possible explanations of the larger than pre-dicted value of the CCQE cross section. The predicted MCratio is chosen for two values of MA and �: One is withMA ¼ 1:23 GeV and � ¼ 1:022 as measured in [13], andthe second with MA ¼ 1:35 GeV and � ¼ 1:007 is from amore recent MiniBooNE CCQE result [26], where � is aPauli blocking scaling factor parameter.
There is some disagreement between data and MC forthe NCE-like/CCQE-like ratio above Q2
QE > 1:0 GeV2,
but this is where the NCE-like backgrounds (predomi-nantly NC pion channels with pion absorption) become asignificant fraction of the signal.
F. Axial vector mass measurement usingthe NCE cross section
In Appendix B 1 the expression for the NCE differentialcross section on free nucleons is described. From there, onecan see that the NCE cross section is sensitive to the axialform factor. In fact, at low Q2, d�=dQ2 � ðFZ
AÞ2ðQ2Þ,where
FZAðQ2Þ ¼ 1
2ðgA�3 ��sÞ=ð1þQ2=M2AÞ2;
where gA ¼ 1:2671 is measured precisely from neutronbeta decay [46].
To first order, the MiniBooNE �N ! �N cross section isnot sensitive to �s, as the linear term in �s nearly cancels,while the quadratic term in �s remains but is small ifj�sj � gA. However, these data are still useful for probingMA.
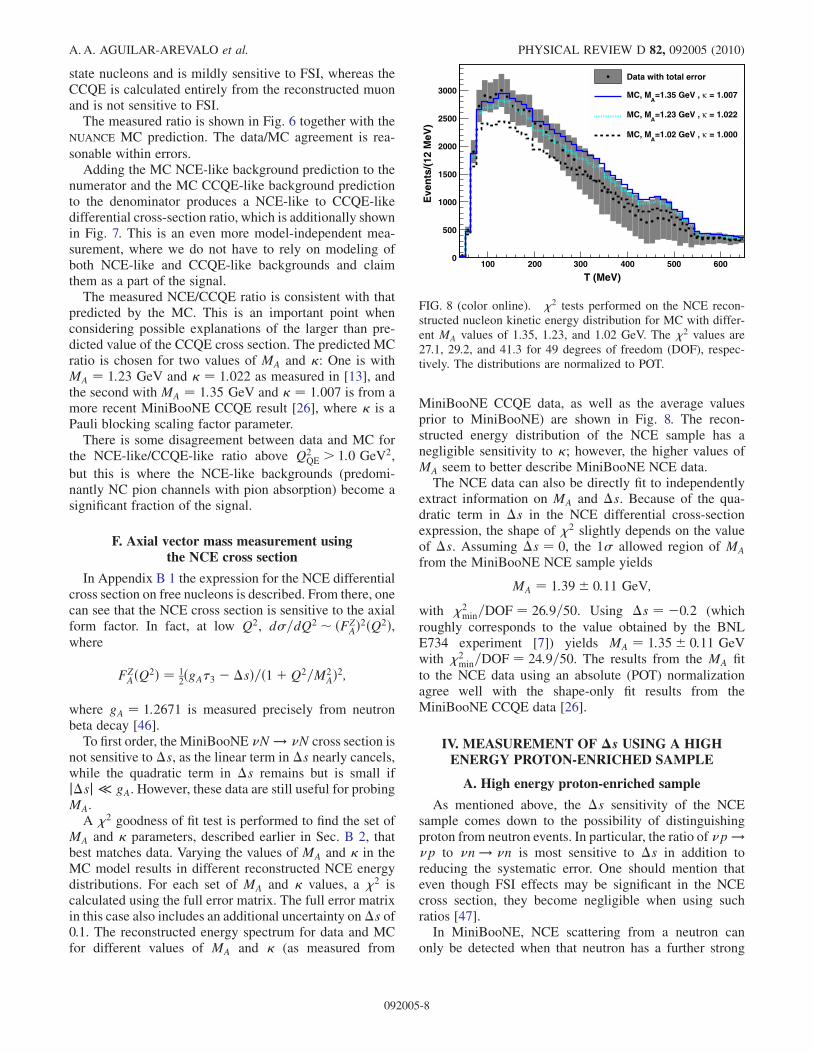
A �2 goodness of fit test is performed to find the set ofMA and � parameters, described earlier in Sec. B 2, thatbest matches data. Varying the values of MA and � in theMC model results in different reconstructed NCE energydistributions. For each set of MA and � values, a �2 iscalculated using the full error matrix. The full error matrixin this case also includes an additional uncertainty on�s of0.1. The reconstructed energy spectrum for data and MCfor different values of MA and � (as measured from
MiniBooNE CCQE data, as well as the average valuesprior to MiniBooNE) are shown in Fig. 8. The recon-structed energy distribution of the NCE sample has anegligible sensitivity to �; however, the higher values ofMA seem to better describe MiniBooNE NCE data.The NCE data can also be directly fit to independently
extract information on MA and �s. Because of the qua-dratic term in �s in the NCE differential cross-sectionexpression, the shape of �2 slightly depends on the valueof �s. Assuming �s ¼ 0, the 1� allowed region of MA
from the MiniBooNE NCE sample yields
MA ¼ 1:39� 0:11 GeV;
with �2min=DOF ¼ 26:9=50. Using �s ¼ �0:2 (which
roughly corresponds to the value obtained by the BNLE734 experiment [7]) yields MA ¼ 1:35� 0:11 GeVwith �2
min=DOF ¼ 24:9=50. The results from the MA fit
to the NCE data using an absolute (POT) normalizationagree well with the shape-only fit results from theMiniBooNE CCQE data [26].
IV. MEASUREMENT OF �s USING A HIGHENERGY PROTON-ENRICHED SAMPLE
A. High energy proton-enriched sample
As mentioned above, the �s sensitivity of the NCEsample comes down to the possibility of distinguishingproton from neutron events. In particular, the ratio of �p !�p to �n ! �n is most sensitive to �s in addition toreducing the systematic error. One should mention thateven though FSI effects may be significant in the NCEcross section, they become negligible when using suchratios [47].In MiniBooNE, NCE scattering from a neutron can
only be detected when that neutron has a further strong
T (MeV)100 200 300 400 500 600
Eve
nts
/(12
MeV
)
0
500
1000
1500
2000
2500
3000
Data with total error
= 1.007κ=1.35 GeV , A
MC, M
= 1.022κ=1.23 GeV , A
MC, M
= 1.000κ=1.02 GeV , A
MC, M
FIG. 8 (color online). �2 tests performed on the NCE recon-structed nucleon kinetic energy distribution for MC with differ-ent MA values of 1.35, 1.23, and 1.02 GeV. The �2 values are27.1, 29.2, and 41.3 for 49 degrees of freedom (DOF), respec-tively. The distributions are normalized to POT.
A. A. AGUILAR-AREVALO et al. PHYSICAL REVIEW D 82, 092005 (2010)
092005-8
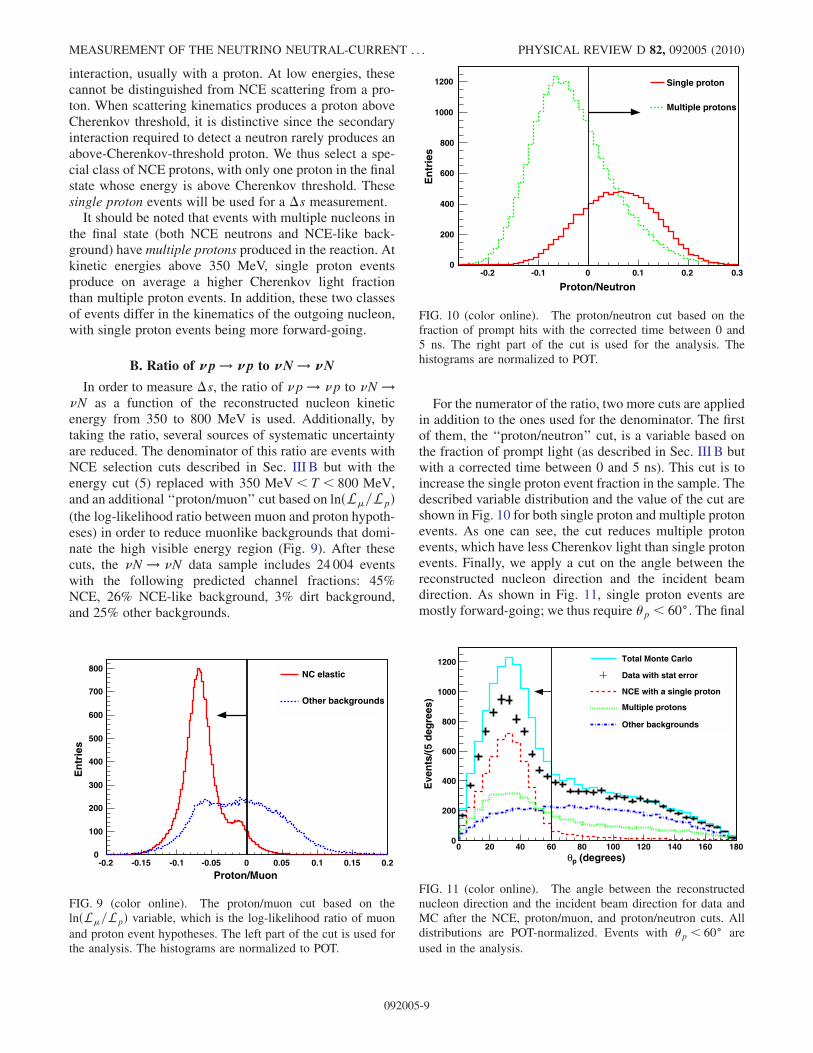
interaction, usually with a proton. At low energies, thesecannot be distinguished from NCE scattering from a pro-ton. When scattering kinematics produces a proton aboveCherenkov threshold, it is distinctive since the secondaryinteraction required to detect a neutron rarely produces anabove-Cherenkov-threshold proton. We thus select a spe-cial class of NCE protons, with only one proton in the finalstate whose energy is above Cherenkov threshold. Thesesingle proton events will be used for a �s measurement.
It should be noted that events with multiple nucleons inthe final state (both NCE neutrons and NCE-like back-ground) have multiple protons produced in the reaction. Atkinetic energies above 350 MeV, single proton eventsproduce on average a higher Cherenkov light fractionthan multiple proton events. In addition, these two classesof events differ in the kinematics of the outgoing nucleon,with single proton events being more forward-going.
B. Ratio of �p ! �p to �N ! �N
In order to measure �s, the ratio of �p ! �p to �N !�N as a function of the reconstructed nucleon kineticenergy from 350 to 800 MeV is used. Additionally, bytaking the ratio, several sources of systematic uncertaintyare reduced. The denominator of this ratio are events withNCE selection cuts described in Sec. III B but with theenergy cut (5) replaced with 350 MeV< T < 800 MeV,and an additional ‘‘proton/muon’’ cut based on lnðL�=LpÞ(the log-likelihood ratio between muon and proton hypoth-eses) in order to reduce muonlike backgrounds that domi-nate the high visible energy region (Fig. 9). After thesecuts, the �N ! �N data sample includes 24 004 eventswith the following predicted channel fractions: 45%NCE, 26% NCE-like background, 3% dirt background,and 25% other backgrounds.
For the numerator of the ratio, two more cuts are appliedin addition to the ones used for the denominator. The firstof them, the ‘‘proton/neutron’’ cut, is a variable based onthe fraction of prompt light (as described in Sec. III B butwith a corrected time between 0 and 5 ns). This cut is toincrease the single proton event fraction in the sample. Thedescribed variable distribution and the value of the cut areshown in Fig. 10 for both single proton and multiple protonevents. As one can see, the cut reduces multiple protonevents, which have less Cherenkov light than single protonevents. Finally, we apply a cut on the angle between thereconstructed nucleon direction and the incident beamdirection. As shown in Fig. 11, single proton events aremostly forward-going; we thus require p < 60�. The final
Proton/Muon-0.2 -0.15 -0.1 -0.05 0 0.05 0.1 0.15 0.2
En
trie
s
0
100
200
300
400
500
600
700
800NC elastic
Other backgrounds
FIG. 9 (color online). The proton/muon cut based on thelnðL�=LpÞ variable, which is the log-likelihood ratio of muon
and proton event hypotheses. The left part of the cut is used forthe analysis. The histograms are normalized to POT.
Proton/Neutron-0.2 -0.1 0 0.1 0.2 0.3
En
trie
s
0
200
400
600
800
1000
1200 Single proton
Multiple protons
FIG. 10 (color online). The proton/neutron cut based on thefraction of prompt hits with the corrected time between 0 and5 ns. The right part of the cut is used for the analysis. Thehistograms are normalized to POT.
(degrees)pθ0 20 40 60 80 100 120 140 160 180
Eve
nts
/(5
deg
rees
)
0
200
400
600
800
1000
1200 Total Monte Carlo
Data with stat error
NCE with a single proton
Multiple protons
Other backgrounds
FIG. 11 (color online). The angle between the reconstructednucleon direction and the incident beam direction for data andMC after the NCE, proton/muon, and proton/neutron cuts. Alldistributions are POT-normalized. Events with p < 60� are
used in the analysis.
MEASUREMENT OF THE NEUTRINO NEUTRAL-CURRENT . . . PHYSICAL REVIEW D 82, 092005 (2010)
092005-9
�p ! �p data sample includes 7616 events with the fol-lowing predicted channel fractions: 55% �p ! �p, 10%�n ! �n, 14% NCE-like background, 1% dirt back-ground, and 19% other backgrounds.
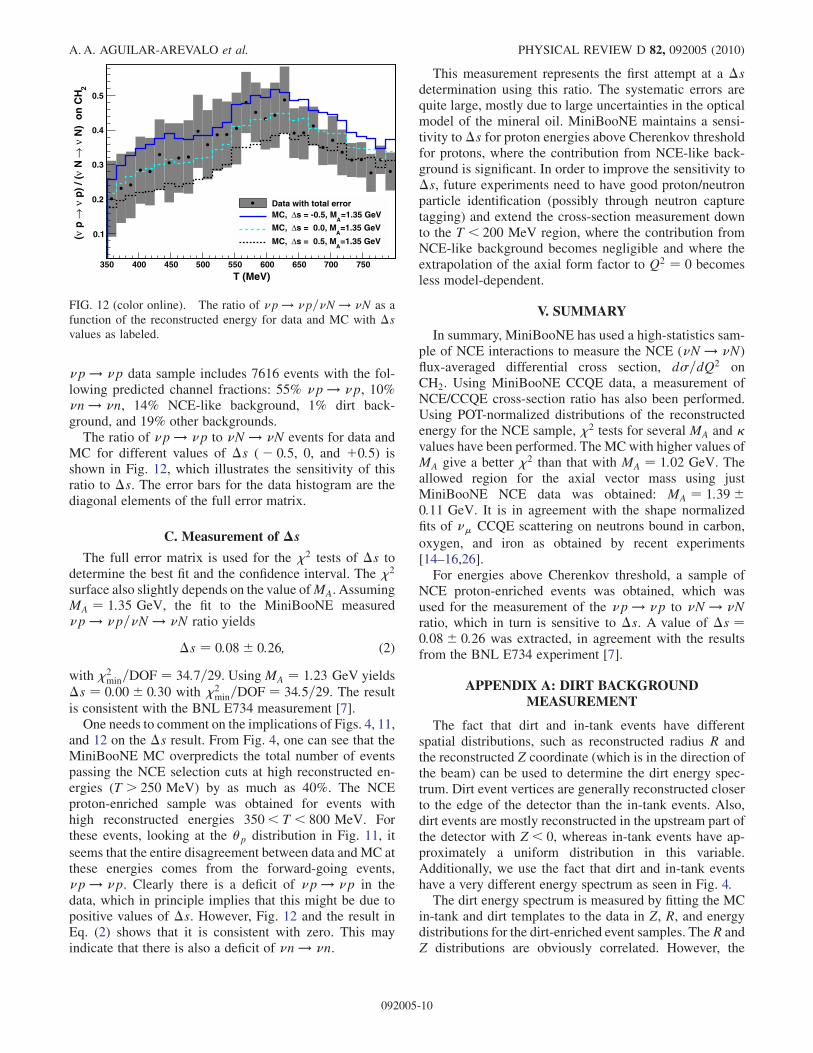
The ratio of �p ! �p to �N ! �N events for data andMC for different values of �s (� 0:5, 0, and þ0:5) isshown in Fig. 12, which illustrates the sensitivity of thisratio to �s. The error bars for the data histogram are thediagonal elements of the full error matrix.
C. Measurement of �s
The full error matrix is used for the �2 tests of �s todetermine the best fit and the confidence interval. The �2
surface also slightly depends on the value ofMA. AssumingMA ¼ 1:35 GeV, the fit to the MiniBooNE measured�p ! �p=�N ! �N ratio yields
�s ¼ 0:08� 0:26; (2)
with �2min=DOF ¼ 34:7=29. UsingMA ¼ 1:23 GeV yields
�s ¼ 0:00� 0:30 with �2min=DOF ¼ 34:5=29. The result
is consistent with the BNL E734 measurement [7].One needs to comment on the implications of Figs. 4, 11,
and 12 on the �s result. From Fig. 4, one can see that theMiniBooNE MC overpredicts the total number of eventspassing the NCE selection cuts at high reconstructed en-ergies (T > 250 MeV) by as much as 40%. The NCEproton-enriched sample was obtained for events withhigh reconstructed energies 350< T < 800 MeV. Forthese events, looking at the p distribution in Fig. 11, it
seems that the entire disagreement between data and MC atthese energies comes from the forward-going events,�p ! �p. Clearly there is a deficit of �p ! �p in thedata, which in principle implies that this might be due topositive values of �s. However, Fig. 12 and the result inEq. (2) shows that it is consistent with zero. This mayindicate that there is also a deficit of �n ! �n.
This measurement represents the first attempt at a �sdetermination using this ratio. The systematic errors arequite large, mostly due to large uncertainties in the opticalmodel of the mineral oil. MiniBooNE maintains a sensi-tivity to�s for proton energies above Cherenkov thresholdfor protons, where the contribution from NCE-like back-ground is significant. In order to improve the sensitivity to�s, future experiments need to have good proton/neutronparticle identification (possibly through neutron capturetagging) and extend the cross-section measurement downto the T < 200 MeV region, where the contribution fromNCE-like background becomes negligible and where theextrapolation of the axial form factor to Q2 ¼ 0 becomesless model-dependent.
V. SUMMARY
In summary, MiniBooNE has used a high-statistics sam-ple of NCE interactions to measure the NCE (�N ! �N)flux-averaged differential cross section, d�=dQ2 onCH2. Using MiniBooNE CCQE data, a measurement ofNCE/CCQE cross-section ratio has also been performed.Using POT-normalized distributions of the reconstructedenergy for the NCE sample, �2 tests for several MA and �values have been performed. The MCwith higher values ofMA give a better �2 than that with MA ¼ 1:02 GeV. Theallowed region for the axial vector mass using justMiniBooNE NCE data was obtained: MA ¼ 1:39�0:11 GeV. It is in agreement with the shape normalizedfits of �� CCQE scattering on neutrons bound in carbon,
oxygen, and iron as obtained by recent experiments[14–16,26].For energies above Cherenkov threshold, a sample of
NCE proton-enriched events was obtained, which wasused for the measurement of the �p ! �p to �N ! �Nratio, which in turn is sensitive to �s. A value of �s ¼0:08� 0:26 was extracted, in agreement with the resultsfrom the BNL E734 experiment [7].
APPENDIX A: DIRT BACKGROUNDMEASUREMENT
The fact that dirt and in-tank events have differentspatial distributions, such as reconstructed radius R andthe reconstructed Z coordinate (which is in the direction ofthe beam) can be used to determine the dirt energy spec-trum. Dirt event vertices are generally reconstructed closerto the edge of the detector than the in-tank events. Also,dirt events are mostly reconstructed in the upstream part ofthe detector with Z < 0, whereas in-tank events have ap-proximately a uniform distribution in this variable.Additionally, we use the fact that dirt and in-tank eventshave a very different energy spectrum as seen in Fig. 4.The dirt energy spectrum is measured by fitting the MC
in-tank and dirt templates to the data in Z, R, and energydistributions for the dirt-enriched event samples. TheR andZ distributions are obviously correlated. However, the
T (MeV)350 400 450 500 550 600 650 700 750
2 N
) o
n C
Hν
→ N
ν
p)
/ (ν
→ p
ν( 0.1
0.2
0.3
0.4
0.5
Data with total error=1.35 GeV
As = -0.5, M∆MC,
=1.35 GeVA
s = 0.0, M∆MC,
=1.35 GeVA
s = 0.5, M∆MC,
FIG. 12 (color online). The ratio of �p ! �p=�N ! �N as afunction of the reconstructed energy for data and MC with �svalues as labeled.
A. A. AGUILAR-AREVALO et al. PHYSICAL REVIEW D 82, 092005 (2010)
092005-10
samples used for the Z and R fits of the dirt have a largefraction of events that are present in one sample and not inthe other.
To measure the dirt background in the NCE event sam-ple, three additional dirt-enriched samples of events areused. For each of the variables (reconstructed Z, R, andenergy) different samples are used, based on cutting on theother of these variables; for example, if measuring dirtevents from the Z distribution, one would have an addi-tional cut on R.
The samples that are selected for these fits are defined inTable II. The following precuts are the same for each eventsample [cuts from (1)–(6) described in Sec. III B]:
precuts ¼ 1 subeventþ V hits< 6þ T hits> 24
þ 4400 ns< time< 6500 nsþ T
< 650 MeVþ lnðLe=LpÞ< 0:42:
These are the same as the NCE analysis cuts withthe removal of the radial cut. The dirt fraction in the
TABLE II. Event sample cuts, their respective purposes, and dirt events fractions. The dirt fractions are calculated from the initialMC simulation (before dirt fits), and NCE is the signal sample (cuts from 1 to 7), whereas the other three samples are the dirt-enrichedsamples for use in the dirt fits.
Sample name Purpose of the sample Cuts : Precutsþ Dirt fraction (%)
NCE NCE sample (dirt-reduced) RfiducialðTÞ [cut (7) in Sec. III B] 13.4
Dirt-Z Fit dirt from Z (dirt-enhanced) 3:8 m<R< 5:2 m 27.8
Dirt-R Fit dirt from R (dirt-enhanced) Z < 0 m 34.3
Dirt-E Fit dirt from energy (dirt-enhanced) 3:8 m<R< 5:2 m and Z < 0 m 37.6
Z (m)-4 -2 0 2 4
Eve
nts
/(0.
24m
)
0
100
200
300
400
500
600 67 MeV<T<95 MeV67 MeV<T<95 MeV
Z (m)-4 -2 0 2 4
Eve
nts
/(0.
24m
)
0
100
200
300
400
500
600150 MeV<T<178 MeV Data with stat error
Total MC before the fit
Total MC after the fit
Dirt backgrounds template
In-tank template
150 MeV<T<178 MeV
Z (m)-4 -2 0 2 4
Eve
nts
/(0.
24m
)
0
50
100
150
200
250
300
350
400 234 MeV<T<261 MeV234 MeV<T<261 MeV
Z (m)-4 -2 0 2 4
Eve
nts
/(0.
24m
)
0
20
40
60
80
100
120
140
160
180
200
220
240 345 MeV<T<372 MeV345 MeV<T<372 MeV
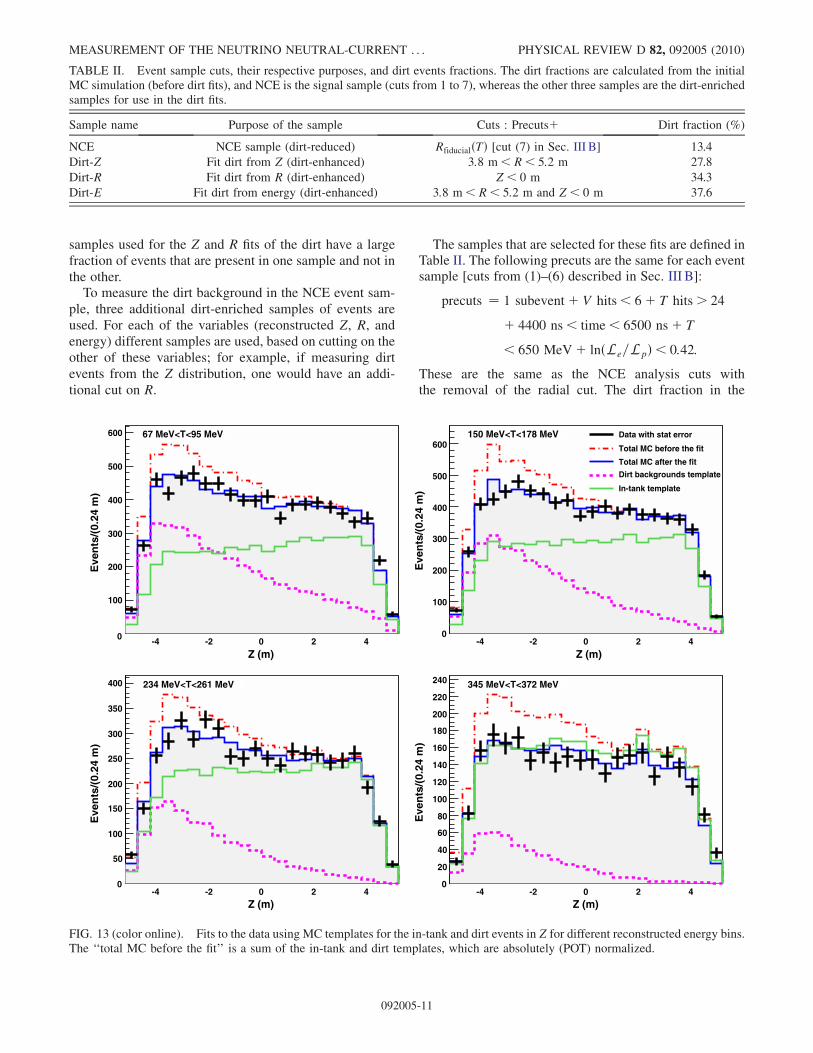
FIG. 13 (color online). Fits to the data using MC templates for the in-tank and dirt events in Z for different reconstructed energy bins.The ‘‘total MC before the fit’’ is a sum of the in-tank and dirt templates, which are absolutely (POT) normalized.
MEASUREMENT OF THE NEUTRINO NEUTRAL-CURRENT . . . PHYSICAL REVIEW D 82, 092005 (2010)
092005-11
dirt-enhanced samples is increased significantly, by afactor of 2–3 over the unenhanced sample.
1. Dirt rate measurement fromthe reconstructed Z distribution
To measure the dirt background from the Z distribution,the ‘‘dirt-Z’’ event sample from Table II is used. Theshapes (templates) of the Z distribution for the in-tankand dirt events in the MC are used to fit the shape of theZ distribution for the data. These fits are done in bins ofreconstructed energy T, so that in the end one obtains themeasured dirt background energy spectrum. From the fitsthe correction function
Corr dirti ¼ ðdatai=MCiÞdirtthat should be applied to the MC spectrum of the dirtevents is extracted, which is the ratio of the measured topredicted number of dirt events in the ith bin.
An example of the fit is shown in Fig. 13 for severalintervals of the reconstructed energy. The agreement be-tween the data and MC is much better after the fit.
2. Dirt rate measurement fromthe reconstructed R distribution
This procedure is essentially the same as for the dirtmeasurement using the Z distribution, but instead, the‘‘dirt-R’’ sample from Table II is used and the fitting isdone for the R variable. Again, from the fits, the correctionfunction for the dirt energy spectrum CorrDirt is extracted.
3. Dirt rate measurement from thereconstructed energy distribution
For this method, two event samples are used, the signal(NCE) and the dirt-enriched sample with the ‘‘dirt-E’’ cutsfrom Table II. For both samples, we look at both theMiniBooNE data and the MC prediction for NCE, dirt,and in-tank backgrounds.
Assuming that the fractions of signal and dirt events inboth samples are stable relative to MC variations, one canmeasure the spectrum of dirt events in the NCE samplefrom the data distribution for both of these samples. Wedefine the following histograms:
� Reconstructed energy spectrum for data
B Reconstructed energy spectrum for MC in-tank backgrounds
S Reconstructed energy spectrum for MC NCE
D Reconstructed energy spectrum for MC dirt,
which have upper indices describing the event sample,namely,
s NCE event sample
d Dirt-E event sample.
The new spectra for the dirt and signal events can bedetermined from fitting the data in both NCE and dirt-E
samples. In terms of the definitions that we have intro-duced, the condition that these spectra coincide in bothevent samples can be written as
Bsi þ Ssi þDs
i ¼ �si ; Bd
i þ Sdi þDdi ¼ �d
i :
For each reconstructed energy bin i there are 6 unknownson the left-hand side and 2 knowns on the right-hand side(the data in both NCE and dirt-E samples). Assuming areliable in-tank background prediction, one can fix Bs
i andBdi . Then, we introduce the fractions of signal and dirt
events in the two samples:
fi ¼ Ddi
Dsi
and gi ¼ SdiSsi
:
Because these variables are ratios, they are relatively stableto MC variations and independent of the dirt and NCEevents energy spectra. The functions f and g are deter-mined from the MC.Herewith, one can express Ds
i (the dirt energy spectrumin the NCE sample) in terms of the above definitions as
Dsi ¼
gið�si � Bs
i Þ � ð�di � Bd
i Þgi � fi
;
which is the measured spectrum of dirt events in the NCEevent sample.Finally, using all three methods, the combined dirt en-
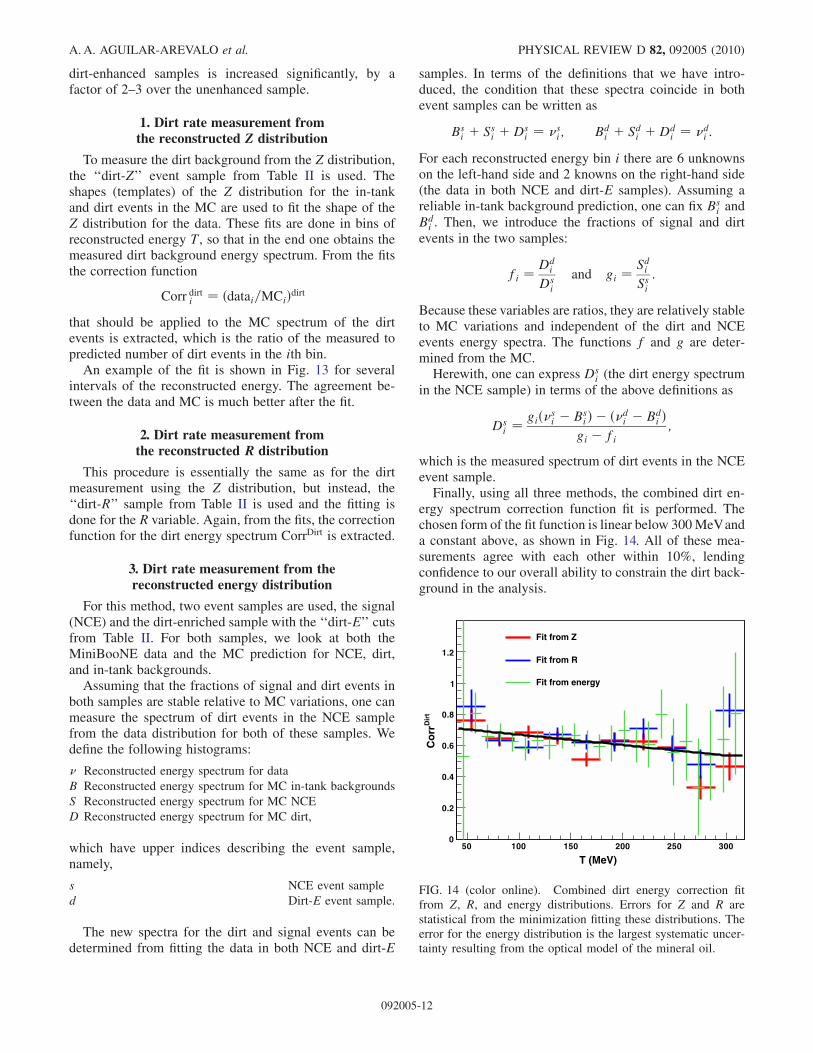
ergy spectrum correction function fit is performed. Thechosen form of the fit function is linear below 300MeVanda constant above, as shown in Fig. 14. All of these mea-surements agree with each other within 10%, lendingconfidence to our overall ability to constrain the dirt back-ground in the analysis.
T (MeV)50 100 150 200 250 300
Dir
tC
orr
0
0.2
0.4
0.6
0.8
1
1.2
Fit from Z
Fit from R
Fit from energy
FIG. 14 (color online). Combined dirt energy correction fitfrom Z, R, and energy distributions. Errors for Z and R arestatistical from the minimization fitting these distributions. Theerror for the energy distribution is the largest systematic uncer-tainty resulting from the optical model of the mineral oil.
A. A. AGUILAR-AREVALO et al. PHYSICAL REVIEW D 82, 092005 (2010)
092005-12
The new, measured reconstructed energy spectrum forthe dirt events in the NCE sample is calculated as a bin-by-bin correction of the initial MC dirt energy spectrummulti-plied by the measured correction function. The measurednumber of dirt events is determined to be�30% lower thanthe original MC prediction.
APPENDIX B: MINIBOONE NEUTRAL-CURRENTELASTIC CROSS-SECTION DESCRIPTION
1. Phenomenology
While MiniBooNE uses the relativistic Fermi gas modelof Smith and Moniz to describe NCE scattering, it isillustrative to write down the expression for the NCE crosssection in the case of a free nucleon target.
The neutrino-nucleon NCE differential cross section onfree nucleons can be written as [20]
d�
dQ2 ¼ G2FQ
2
2�E2�
ðAðQ2Þ � BðQ2ÞW þ CðQ2ÞW2Þ; (B1)
where the þ sign corresponds to neutrinos and the � signto antineutrinos, W ¼ 4E�=MN �Q2=M2
N , and AðQ2Þ,BðQ2Þ, and CðQ2Þ are form factors defined, respectively, as
AðQ2Þ ¼ 14½ðFZ
AÞ2ð1þ �Þ � ððFZ1 Þ2 � �ðFZ
2 Þ2Þð1� �Þþ 4�FZ
1FZ2 �;
BðQ2Þ ¼ 14F
ZAðFZ
1 þ FZ2 Þ;
CðQ2Þ ¼ M2N
16Q2½ðFZ
AÞ2 þ ðFZ1 Þ2 þ �ðFZ
2 Þ2�:
Here FZ1 , F
Z2 , and FZ
A are nucleon Dirac, Pauli, and axialweak neutral-current form factors, respectively, which ingeneral are real dimensionless functions of Q2, and � ¼Q2=4M2
N . Each of the nucleon form factors is different forproton and neutron targets. At low Q2 the CðQ2Þ term inEq. (B1) dominates (see Ref. [43]). Thus, the NCE crosssection has a significant contribution from axial vectorcurrents.
Under the conserved vector current [48], one can expressthe weak form factors through their electromagnetic equiv-alents:
FZi ¼ ð12� sin2WÞ½FEM;p
i �FEM;ni ��3
� sin2W½FEM;pi þFEM;n
i �� 12F
si ; i¼ 1;2; (B2)
where W is the weak mixing angle, �3 is a factor þ1 forprotons and �1 for neutrons, Fs
i are the isoscalar formfactors discussed later, and the Dirac and Pauli electro-magnetic form factors are
FEM1 ðQ2Þ ¼
GEðQ2Þ þ Q2
4M2N
GMðQ2Þ1þ Q2
4M2N
;
FEM2 ðQ2Þ ¼ GMðQ2Þ �GEðQ2Þ
1þ Q2
4M2N
;
where GE and GM are Sachs form factors [49]. Instead ofthe dipole approximation the Bodek-Budd-Arrington-2003form of the Sachs form factors [50] is used in this analysis,which better describes the electron-proton scattering data.The axial weak form factor by definition can be ex-
pressed through its isovector and isoscalar parts:
FZA ¼ �3
2FA � 1
2FsA: (B3)
The isovector axial form factor can be measured via weakcharged current. Usually it is assumed to have a dipoleform:
FAðQ2Þ ¼ gA
ð1þ Q2
M2A
Þ2; (B4)
where gA ¼ FAð0Þ ¼ 1:2671 [46] is measured preciselyfrom neutron beta decay.The isoscalar form factors Fs
1 and Fs2 in Eq. (B2) are
usually thought to be due to contributions from strangequarks to the electric charge and to the magnetic momentof the nucleon, whereas Fs
A in Eq. (B3) is their contributionto the nucleon spin. The Fs
A value at Q2 ¼ 0 is called �s.Fs1 and Fs
2 can be extracted from parity-violating electron-
scattering experiments. Recent results from the HAPPEXexperiment [51] show that these electric and magneticstrange form factors are consistent with zero. The exactexpression for the axial isoscalar form factor is unknown,but in analogy to the isovector axial form factor it is usuallyrepresented in the dipole form with the same value of the
)2 (GeVQE2Q
0.2 0.4 0.6 0.8 1 1.2 1.4 1.6
Eff
icie
ncy
co
rrec
tio
n
0
0.2
0.4
0.6
0.8
1
1.2
1.4
1.6
1.8p on Hydrogenν
p on Carbonν
n on Carbonν
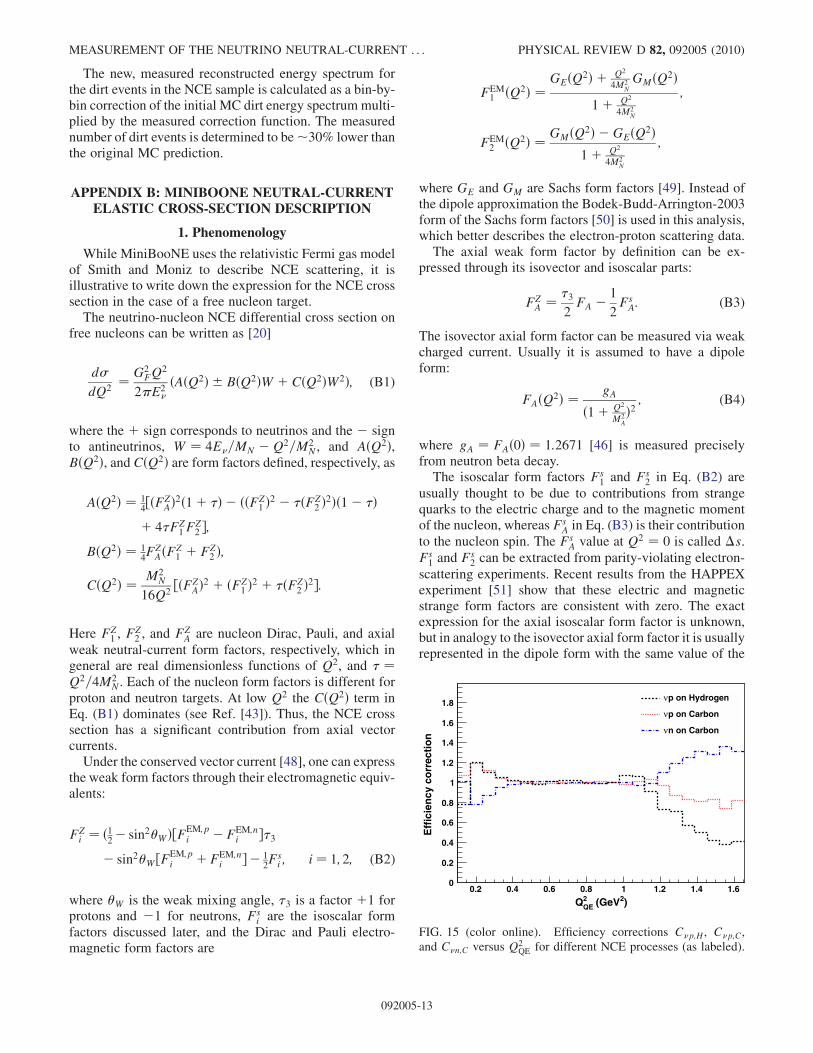
FIG. 15 (color online). Efficiency corrections C�p;H, C�p;C,and C�n;C versus Q2
QE for different NCE processes (as labeled).
MEASUREMENT OF THE NEUTRINO NEUTRAL-CURRENT . . . PHYSICAL REVIEW D 82, 092005 (2010)
092005-13
axial vector mass to minimize the number of free parame-ters in the model [19]:
FsAðQ2Þ ¼ �s
ð1þQ2
M2A
Þ2:
(B5)
2. MiniBooNE neutral-current elasticcross-section discussion
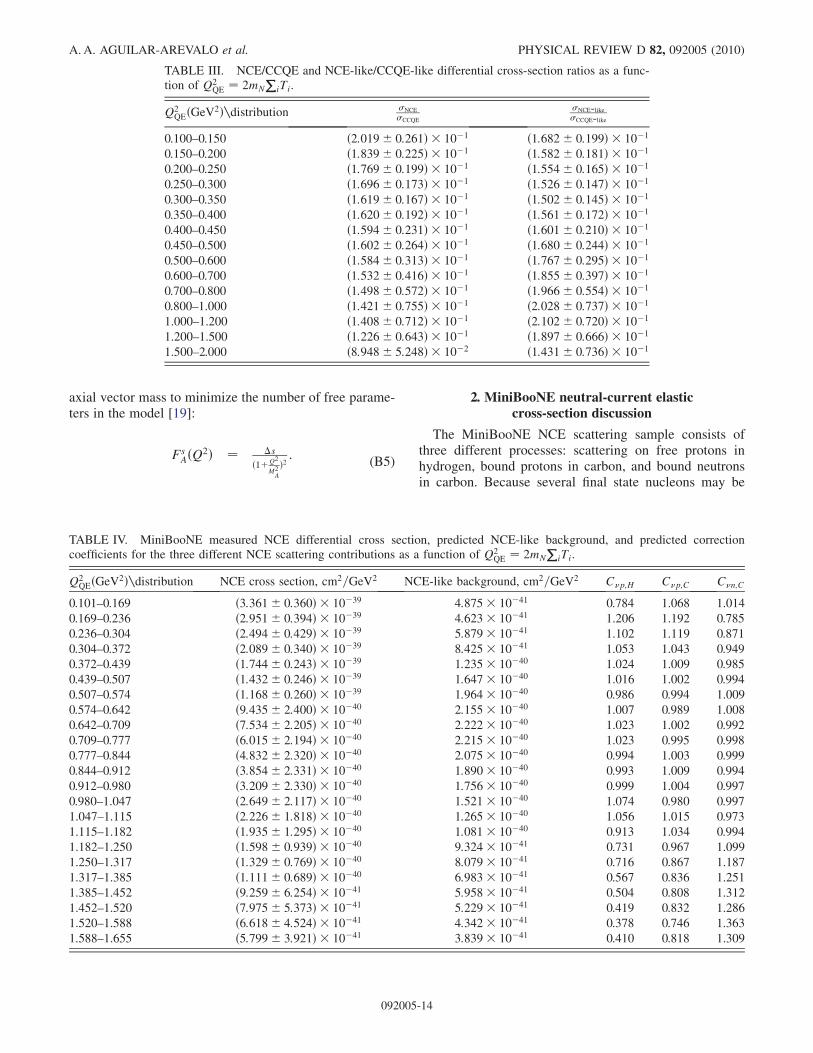
The MiniBooNE NCE scattering sample consists ofthree different processes: scattering on free protons inhydrogen, bound protons in carbon, and bound neutronsin carbon. Because several final state nucleons may be
TABLE III. NCE/CCQE and NCE-like/CCQE-like differential cross-section ratios as a func-tion of Q2
QE ¼ 2mN
PiTi.
Q2QEðGeV2Þndistribution �NCE
�CCQE
�NCE-like�CCQE-like
0.100–0.150 ð2:019� 0:261Þ � 10�1 ð1:682� 0:199Þ � 10�1
0.150–0.200 ð1:839� 0:225Þ � 10�1 ð1:582� 0:181Þ � 10�1
0.200–0.250 ð1:769� 0:199Þ � 10�1 ð1:554� 0:165Þ � 10�1
0.250–0.300 ð1:696� 0:173Þ � 10�1 ð1:526� 0:147Þ � 10�1
0.300–0.350 ð1:619� 0:167Þ � 10�1 ð1:502� 0:145Þ � 10�1
0.350–0.400 ð1:620� 0:192Þ � 10�1 ð1:561� 0:172Þ � 10�1
0.400–0.450 ð1:594� 0:231Þ � 10�1 ð1:601� 0:210Þ � 10�1
0.450–0.500 ð1:602� 0:264Þ � 10�1 ð1:680� 0:244Þ � 10�1
0.500–0.600 ð1:584� 0:313Þ � 10�1 ð1:767� 0:295Þ � 10�1
0.600–0.700 ð1:532� 0:416Þ � 10�1 ð1:855� 0:397Þ � 10�1
0.700–0.800 ð1:498� 0:572Þ � 10�1 ð1:966� 0:554Þ � 10�1
0.800–1.000 ð1:421� 0:755Þ � 10�1 ð2:028� 0:737Þ � 10�1
1.000–1.200 ð1:408� 0:712Þ � 10�1 ð2:102� 0:720Þ � 10�1
1.200–1.500 ð1:226� 0:643Þ � 10�1 ð1:897� 0:666Þ � 10�1
1.500–2.000 ð8:948� 5:248Þ � 10�2 ð1:431� 0:736Þ � 10�1
TABLE IV. MiniBooNE measured NCE differential cross section, predicted NCE-like background, and predicted correctioncoefficients for the three different NCE scattering contributions as a function of Q2
QE ¼ 2mN
PiTi.
Q2QEðGeV2Þndistribution NCE cross section, cm2=GeV2 NCE-like background, cm2=GeV2 C�p;H C�p;C C�n;C
0.101–0.169 ð3:361� 0:360Þ � 10�39 4:875� 10�41 0.784 1.068 1.014
0.169–0.236 ð2:951� 0:394Þ � 10�39 4:623� 10�41 1.206 1.192 0.785
0.236–0.304 ð2:494� 0:429Þ � 10�39 5:879� 10�41 1.102 1.119 0.871
0.304–0.372 ð2:089� 0:340Þ � 10�39 8:425� 10�41 1.053 1.043 0.949
0.372–0.439 ð1:744� 0:243Þ � 10�39 1:235� 10�40 1.024 1.009 0.985
0.439–0.507 ð1:432� 0:246Þ � 10�39 1:647� 10�40 1.016 1.002 0.994
0.507–0.574 ð1:168� 0:260Þ � 10�39 1:964� 10�40 0.986 0.994 1.009
0.574–0.642 ð9:435� 2:400Þ � 10�40 2:155� 10�40 1.007 0.989 1.008
0.642–0.709 ð7:534� 2:205Þ � 10�40 2:222� 10�40 1.023 1.002 0.992
0.709–0.777 ð6:015� 2:194Þ � 10�40 2:215� 10�40 1.023 0.995 0.998
0.777–0.844 ð4:832� 2:320Þ � 10�40 2:075� 10�40 0.994 1.003 0.999
0.844–0.912 ð3:854� 2:331Þ � 10�40 1:890� 10�40 0.993 1.009 0.994
0.912–0.980 ð3:209� 2:330Þ � 10�40 1:756� 10�40 0.999 1.004 0.997
0.980–1.047 ð2:649� 2:117Þ � 10�40 1:521� 10�40 1.074 0.980 0.997
1.047–1.115 ð2:226� 1:818Þ � 10�40 1:265� 10�40 1.056 1.015 0.973
1.115–1.182 ð1:935� 1:295Þ � 10�40 1:081� 10�40 0.913 1.034 0.994
1.182–1.250 ð1:598� 0:939Þ � 10�40 9:324� 10�41 0.731 0.967 1.099
1.250–1.317 ð1:329� 0:769Þ � 10�40 8:079� 10�41 0.716 0.867 1.187
1.317–1.385 ð1:111� 0:689Þ � 10�40 6:983� 10�41 0.567 0.836 1.251
1.385–1.452 ð9:259� 6:254Þ � 10�41 5:958� 10�41 0.504 0.808 1.312
1.452–1.520 ð7:975� 5:373Þ � 10�41 5:229� 10�41 0.419 0.832 1.286
1.520–1.588 ð6:618� 4:524Þ � 10�41 4:342� 10�41 0.378 0.746 1.363
1.588–1.655 ð5:799� 3:921Þ � 10�41 3:839� 10�41 0.410 0.818 1.309
A.A. AGUILAR-AREVALO et al. PHYSICAL REVIEW D 82, 092005 (2010)
092005-14
produced, we define the interaction in carbon using themost energetic final state nucleon. This means, for ex-ample, that it is possible for an event to be tagged as aNCE neutron, because it has a neutron as the most ener-getic final state nucleon, even though the original neutrinointeraction was on a proton. According to NUANCE, theprobability of this misidentification grows almost linearlyfrom about 8% at Q2
QE ¼ 0:1 GeV2 to 16% at Q2QE ¼
1:6 GeV2.The result shown in Fig. 5 is the flux-averaged NCE
differential cross section on CH2, averaged over theseprocesses. Herewith, the �N ! �N cross section isexpressed as
d��N!�N
dQ2 ¼ 1
7C�p;HðQ2
QEÞd��p!�p;H
dQ2þ 3
7C�p;CðQ2
QEÞ
� d��p!�p;C
dQ2þ 3
7C�n;CðQ2
QEÞd��n!�n;C
dQ2;
(B6)
where d��p!�p;H=dQ2 is the NCE cross section on free
protons (per free proton), d��p!�p;C=dQ2 is the NCE cross
section on bound protons (per bound proton), andd��n!�n;C=dQ
2 is the NCE cross section on bound neu-
trons (per bound neutron). The efficiency correction func-tions C�p;H,C�p;C, andC�n;C result from different selection
efficiencies for each type of NCE scattering process and
are estimated from the MC as functions ofQ2QE—as shown
in Fig. 15. They are defined as the ratios of the efficiencyfor a particular type of NCE event to the average efficiencyfor all NCE events in bins of Q2
QE.
As one can see from Fig. 15, the efficiency correctionfunctions are equal to unity in the region of Q2
QE from
0.4 to 1:2 GeV2. However, at higher Q2QE, NCE neutrons
have higher efficiency, thus having a higher probabilitythan NCE protons to pass the T < 650 MeV cut used in theselection. Similarly, at lower Q2
QE, NCE neutrons have lo-
wer probability than NCE protons to pass a T hits> 24cut.To calculate a cross section which is to be compared to
the MiniBooNE results (as in Fig. 5), one needs to applythese efficiency corrections to each predicted distribution.However, note that in the bulk of the measured region0:1<Q2
QE < 1:0 GeV2, they are all roughly equivalent to
unity.Finally, we present tables with the NCE/CCQE
differential cross-section ratios in Table III and the NCEdifferential cross section, NCE-like background, and cor-rection coefficients in Table IV. There is also an alternativemethod of reporting the results of this analysis, namely, interms of the reconstructed nucleon kinetic energy. Thetables for the latter can be found in [43,52]. In order tomake use of these results, one would have to follow theinstructions described in Appendix B of Ref. [43].
[1] D. Cline et al., Phys. Rev. Lett. 37, 252 (1976).[2] M. Pohl et al., Phys. Lett. 72B, 489 (1978).[3] H. Faissner et al., Phys. Rev. D 21, 555 (1980).[4] P. Coteus, M. Diesburg, R. Fine, W. Lee, P. Sokolsky, R.
Brown, S. Fuess, P. Nienaber, T. O’Halloran, and Y.Y.Lee, Phys. Rev. D 24, 1420 (1981).
[5] A. Entenberg et al., Phys. Rev. Lett. 42, 1198 (1979).[6] J. Horstkotte et al., Phys. Rev. D 25, 2743 (1982).[7] L. A. Ahrens et al., Phys. Rev. D 35, 785 (1987).[8] L. A. Ahrens et al., Phys. Rev. D 34, 75 (1986).[9] A. A. Aguilar-Arevalo et al. (MiniBooNE Collaboration),
Phys. Rev. D 79, 072002 (2009).[10] A. A. Aguilar-Arevalo et al. (MiniBooNE Collaboration),
Nucl. Instrum. Methods Phys. Res., Sect. A 599, 28(2009).
[11] D. C. Cox, FERMILAB-THESIS-2008-08.[12] V. Bernard, L. Elouadrhiri, and U.G. Meissner, J. Phys. G
28, R1 (2002).[13] A. A. Aguilar-Arevalo et al. (MiniBooNE Collaboration),
Phys. Rev. Lett. 100, 032301 (2008).[14] R. Gran et al. (K2K Collaboration), Phys. Rev. D 74,
052002 (2006).[15] X. Espinal and F. Sanchez (K2K Collaboration), AIP
Conf. Proc. 967, 117 (2007).
[16] M. E. Dorman, FERMILAB-THESIS-2008-72.[17] M. Martini, M. Ericson, G. Chanfray, and J. Marteau,
Phys. Rev. C 80, 065501 (2009).[18] O. Benhar, P. Coletti, and D. Meloni, Phys. Rev. Lett. 105,
132301 (2010).[19] G. T. Garvey, W.C. Louis, and D.H. White, Phys. Rev. C
48, 761 (1993).[20] G. Garvey, E. Kolbe, K. Langanke, and S. Krewald, Phys.
Rev. C 48, 1919 (1993).[21] W.M. Alberico et al., Nucl. Phys. A651, 277 (1999).[22] L. Bugel et al. (FINeSSE Collaboration), arXiv:hep-ex/
0402007.[23] S. Agostinelli et al. (GEANT4 Collaboration), Nucl.
Instrum. Methods Phys. Res., Sect. A 506, 250 (2003).[24] M. Catanesi et al. (HARP Collaboration), Eur. Phys. J. C
52, 29 (2007).[25] ‘‘Miniboone Flux Data Release,’’ http://www-boone.fnal
.gov/for_physicists/data_release/flux.[26] A. A. Aguilar-Arevalo et al. (MiniBooNE Collaboration),
Phys. Rev. D 81, 092005 (2010).[27] S. J. Brice et al., Nucl. Instrum. Methods Phys. Res., Sect.
A 562, 97 (2006).[28] D. Casper, Nucl. Phys. B, Proc. Suppl. 112, 161 (2002).
MEASUREMENT OF THE NEUTRINO NEUTRAL-CURRENT . . . PHYSICAL REVIEW D 82, 092005 (2010)
092005-15
[29] R. A. Smith and E. J. Moniz, Nucl. Phys. B43, 605 (1972);B101, 547(E) (1975).
[30] D. Rein and L.M. Sehgal, Nucl. Phys. B223, 29 (1983).[31] G.M. Radecky et al., Phys. Rev. D 25, 1161 (1982).[32] J. Campbell et al., Phys. Rev. Lett. 30, 335 (1973).[33] S. J. Barish et al., Phys. Rev. D 19, 2521 (1979).[34] T. Kitagaki et al., Phys. Rev. D 34, 2554 (1986).[35] G. P. Zeller, in Proceedings of the Third International
Workshop on NO-VE: Neutrino Oscillations in Venice:50 Years after the Neutrino Experimental Discovery,Venice, Italy, 2006, edited by Milla Baldo Ceolin(Edizioni Papergraf, Padua, 2006).
[36] D. Ashery, I. Navon, G. Azuelos, H. K. Walter, H. J.Pfeiffer, and F.W. Schleputz, Phys. Rev. C 23, 2173(1981).
[37] M.K. Jones, R. D. Ransome, V. R. Cupps, R.W.Fergerson, C. L. Morris, J. A. McGill, J. D. Zumbro, J. R.Comfort, B.G. Ritchie, J. R. Tinsley, P. C. Gugelot, andC. F. Moore, Phys. Rev. C 48, 2800 (1993).
[38] R. D. Ransome, C. L. Morris, M.K. Jones, B. G. Ritchie,D. L. Watson, J. A. McGill, K. Pujara, D. B. Clayton, I.Brown, P. Campbell, and C. F. Moore, Phys. Rev. C 46,273 (1992).
[39] R. Brun et al., CERN-DD/EE/84-1, 1987.
[40] C. Zeitnitz and T. A. Gabriel, Nucl. Instrum. MethodsPhys. Res., Sect. A 349, 106 (1994).
[41] A. Fasso et al., in Proceedings of the Workshop onSimulating Accelerator Radiation Environments, SantaFe, 1993 (unpublished).
[42] K. B.M. Mahn, FERMILAB-THESIS-2009-22.[43] D. Perevalov, FERMILAB-THESIS-2009-47.[44] H. Takei, FERMILAB-THESIS-2009-19.[45] G. D’Agostini, Nucl. Instrum. Methods Phys. Res., Sect.
A 362, 487 (1995).[46] C. Amsler et al. (Particle Data Group), Phys. Lett. B 667, 1
(2008).[47] A. Meucci, C. Giusti, and F. D. Pacati, Nucl. Phys. A773,
250 (2006).[48] E. Pachos, Electroweak Theory (Cambridge University
Press, Cambridge, England, 2007).[49] F. J. Ernst, R. G. Sachs, and K. C. Wali, Phys. Rev. 119,
1105 (1960).[50] H. Budd, A. Bodek, and J. Arrington, arXiv:hepex/
0308005.[51] A. Acha et al. (HAPPEX Collaboration), Phys. Rev. Lett.
98, 032301 (2007).[52] ‘‘Miniboone Neutral Current Elastic Data Release,’’ http://
www-boone.fnal.gov/for_physicists/data_release/ncel.
A. A. AGUILAR-AREVALO et al. PHYSICAL REVIEW D 82, 092005 (2010)
092005-16


![Arie Bodek, Univ. of Rochester1 [P13.011] Modeling Neutrino Quasi-elastic Cross Sections Using Up](https://img.pdfslide.us/doc/110x75/56649d7a5503460f94a5eb2f/arie-bodek-univ-of-rochester1-httpwwwapsorgmeetapr03bapsabss3530011html.jpg)