Embed Size (px)
Citation preview

Earth Syst. Sci. Data, 7, 87–92, 2015
www.earth-syst-sci-data.net/7/87/2015/
doi:10.5194/essd-7-87-2015
© Author(s) 2015. CC Attribution 3.0 License.
Measurement of the fracture toughness of polycrystalline
bubbly ice from an Antarctic ice core
J. Christmann1, R. Müller1, K. G. Webber2, D. Isaia2, F. H. Schader2, S. Kipfstuhl3, J. Freitag3, and
A. Humbert3
1Institute of Applied Mechanics, Technische Universität Kaiserslautern, 67663 Kaiserslautern, Germany2Institute of Materials Science, Technische Universität Darmstadt, 64287 Darmstadt, Germany
3Glaciology section, Alfred-Wegener-Institut, Helmholtz Zentrum für Polar- und Meeresforschung,
27570 Bremerhaven, Germany
Correspondence to: J. Christmann ([email protected])
Received: 18 July 2014 – Published in Earth Syst. Sci. Data Discuss.: 30 September 2014
Revised: 16 February 2015 – Accepted: 18 March 2015 – Published: 11 May 2015
Abstract. The critical fracture toughness is a material parameter describing the resistance of a cracked body
to further crack extension. It is an important parameter for simulating and predicting the breakup behavior of
ice shelves from the calving of single icebergs to the disintegration of entire ice shelves over a wide range of
length scales. The fracture toughness values are calculated with equations that are derived from an elastic stress
analysis. Additionally, an X-ray computer tomography (CT scanner) was used to identify the density as a function
of depth. The critical fracture toughness of 91 Antarctic bubbly ice samples with densities between 840 and
870 kg m−3 has been determined by applying a four-point bending technique on single-edge v-notched beam
samples. The examined ice core was drilled 70 m north of Kohnen Station, Dronnning Maud Land (75◦00′ S,
00◦04′ E; 2882 m). Supplementary data are available at doi:10.1594/PANGAEA.835321.
1 Introduction
In order to simulate and predict the calving of icebergs or
the disintegration and breakup of ice shelves, the deforma-
tion and stress states within ice shelves need to be identi-
fied and related to material properties. Both, deformation and
stress states, vary with location within an ice shelf. There-
fore, knowledge of material data is crucial for numerical sim-
ulations. Depending on the timescale under consideration,
one has to distinguish the material response of ice as vis-
cous or elastic. In the long term, ice reacts like a viscous
fluid. Frequently, a material model according to Glen is used,
in which the important parameters are the shear viscosity
and stress exponent; see Glen (1958) and Greve and Blat-
ter (2009). On the other hand, the elastic response is valid
on short timescales and the relevant parameters are fracture
and rupture. The measurement of fracture toughness is per-
formed at high deformation rates in order to trigger the brit-
tle response of ice. In this measurement regime the theory of
linear elastic fracture mechanics can be applied, ignoring the
viscous and plastic properties of ice; see Schulson and Duval
(2009). Traditionally, polar ice is assumed to be isotropic and
therefore requires the knowledge of Young’s modulus and
Poisson’s ratio. With an awareness of these model parame-
ters, simulations can be performed. Additionally, measured
velocity fields can be used to compute the strain and stress
state locally.
For linear elastic materials the stress intensity factor (SIF)
determines the criticality of a crack due to mechanical load-
ing on the basis of macroscopic behavior; it therefore pre-
dicts the stress intensity around the tip of the crack. The rea-
son for this is that, in a linear elastic model, the stress field
is singular at the crack tip; thus, stress-based criteria fail to
describe crack growth. In the presence of cracks, there are
three different possibilities for further crack opening. Mode
I describes symmetric crack opening perpendicular to the di-
rection of the largest tensile stress. Mode II characterizes the
sliding fracture mode, causing shear stresses, and mode III
denotes the tearing mode. In all loading cases, the asymptotic
Published by Copernicus Publications.

88 J. Christmann et al.: Measurement of fracture toughness of ice
behavior is given by the SIFs, usually denoted by KI, KII
or KIII. For details on fracture mechanical concepts and the
different fracture modes; see Gross and Seelig (2011). The
SIF depends on the loading, the elastic material properties
and the boundary conditions (geometry) under consideration.
Once the SIF is known, it is compared to a critical fracture
toughness value KIc, where we restrict attention to Mode I
crack scenarios, as they typically represent the worst-case
loading condition. For ice, the fracture toughness is influ-
enced by many factors, such as density, grain size, temper-
ature, microstructure, water content and salt content. Thus, it
is experimentally challenging to measure fracture toughness.
There are different techniques to measure the Mode I fracture
toughness of a material such as three- and four-point loaded
beams with a notch; see, for example, Goodman and Tabor
(1978), Timco and Frederking (1982), Wei et al. (1991), We-
ber and Nixon (1996a) and Weber and Nixon (1996b) for sea-
water and freshwater ice. Furthermore, different parameters
which have an influence on the critical fracture toughness are
analyzed in Nixon and Schulson (1987), Nixon (1988), and
Nixon and Schulson (1988) for tensile bars with a peripheral
notch. Previous investigations on the fracture toughness of
marine and glacier ice are found in Rist et al. (1999). These
results are used as reference values in the present investiga-
tion.
Mechanical testing was performed in the ice lab at the
Alfred-Wegener-Institut in Bremerhaven. The experimental
setup was designed and built at the Institute of Materials Sci-
ence at the Technische Universität Darmstadt.
The fracture toughness for ice cores from Antarctica has,
to date, been tested with two experimental setups. Rist et al.
(1996) utilized a three-point bend geometry for a chevron-
notched round-bar specimen; this was used to perform exper-
iments on Antarctic ice from one ice core. Rist et al. (1999)
determined the critical stress intensity factor dependency on
the density and porosity, also using a short-rod specimen ge-
ometry. The results from 18 different core samples were pre-
sented, in which controlled crack growth was obtained. The
tests cover densities from 560 to 871 kgm−3. For the case of
ceramics, Rice (2000) states that there is no unique method
to measure the fracture toughness of a given material. Ac-
cording to the ASTM standards, several experimental setups
are possible. In this investigation the ASTM standard for a
four-point bending technique on single-edge v-notched beam
samples was applied to ensure plane strain conditions. The
measured parameters, which determine the fracture tough-
ness, are assumed to be independent of the geometry and the
loading situation. The advantage of this method is that the
measured data of Sect. 2.2 (load-deflection curves) are not
sensitive to small changes in the alignment of the ice sam-
ple. In addition, the fracture toughness measurements show
a high amount of repeatability, verifying the insensitivity to
geometry variations.
94.6 94.8 95 95.2 95.4 95.6 95.8 96830
840
850
860
870
880
dens
ity (
kg m
−3 )
depth B34 (m)
mean density at the notch
Figure 1. Depth–density profile of the ice core part considered.
2 Experimental methodology
2.1 Sample preparation
Bar-shaped samples for fracture testing were obtained from
the B34 ice core, originally from a depth of between 94.6 m
and 96 m. This core was drilled at Kohnen station (75◦00′ S,
00◦04′ E; 2882 m) on the East Antarctic plateau, a site of low
accumulation rates and temperatures. Prior to testing, an X-
ray microfocus computer tomograph (ICE-CT) was used to
determine the density as a function of depth with a high ver-
tical resolution, as shown in Fig. 1. Freitag et al. (2013) pos-
tulate that the variability of the density measurements, using
two-dimensional X-ray scans, is less than other previously
used methods as the noise level is lower. During analysis
each 1 m long ice core was weighed to estimate the mean
density from the ratio of weight to volume; this is the so-
called volumetric method. This density is used as a calibra-
tion parameter for the two-dimensional X-ray scans. Regions
of anomalies, conditioned by, for example, breaks or notches
in the ice, are automatically detected and removed; see the
missing parts in Fig. 1. For a detailed description of the con-
struction and practical application of such an X-ray scan;
see Freitag et al. (2013). The density profile shows that for
greater depth the density increases slightly, whereas the den-
sity variability decreases, including standard deviations rang-
ing from 5.15 to 9.25 kgm−3. The ice core was then cut into
12.6 cm long cylinders. The average density of the middle
section of each disc, near the location of the fracture notch,
was characterized; this is shown as red circles in Fig. 1. The
accurate position of the notch was determined by taking into
account the material loss due to the cutting process and the
loss of waste ice. The mean density was calculated as an av-
erage, considering 2 cm of the surrounding density values.
Antarctic ice from an ice core was chosen, as we intended
to have a sample that best represents the ice in situations to
which the observational data will be applied (e.g., simula-
tions of ice-shelf crack evolution). Artificially created sam-
ples would neither contain the impurities found in nature nor
Earth Syst. Sci. Data, 7, 87–92, 2015 www.earth-syst-sci-data.net/7/87/2015/

J. Christmann et al.: Measurement of fracture toughness of ice 89
��������������������������������������������������������������������������������������������������������������������������������������������������������������������������������������������������������������������������������������������������������������������������������������������������������������������������������������������������������������������������������������������
��������������������������������������������������������������������������������������������������������������������������������������������������������������������������������������������������������������������������������������������������������������������������������������������������������������������������������������������������������������������������������������������
a b c d
ihgfe j
lk
Figure 2. Cross section of ice core showing the sample location
pattern.
would it represent the grain size distribution. As the porosity
of the material, and hence the density, is the key parameter
that determines the critical fracture toughness, the sample se-
lection was performed by choosing a suitable density range.
As the main aim was to increase the estimations of KIc at
specific densities with sufficient statistics, one part of the ice
core with nearly constant density was selected in order to
obtain a large amount of samples. This could in future be ex-
tended by performing the same experiments with samples of
other densities.
Because the aim was not to obtain the fracture toughness
over a wide range of densities, representative of breaking ice
shelves, ice from just below the firn–ice transition at a depth
of 88 m (Freitag et al., 2013) was used. The accumulation
rate at Kohnen Station is 65 mm of water equivalent (WE)
or ≈ 72 mm of ice. A 12.6 cm long bar contains the accu-
mulation of almost 2 years. The accumulation on ice shelves
is generally much higher, with > 200 mma−1 WE and up to
more than 500 mm.
Therefore, during the testing of the critical fracture tough-
ness, it was important to minimize the density variation be-
tween samples. For this purpose, the core was cut into 9
cylinders with 12 samples each. Each cylinder was a 12.6 cm
long section, resulting in samples cut at a 1.4 m depth interval
for the B34 ice core. The ice core had a radius of r = 50 mm.
Thus the experiments could be performed with 12 samples
with nearly identical mean densities. The bar-shaped samples
were cut with a band saw at −20 ◦C from the B34 ice core.
Figure 2 shows a schematic cross section of an ice core with
the sample location pattern. The location of the sample in
one cross section of the ice core had no identifiable influence
on the measured critical fracture toughness. Each specimen
had a final thickness W = 14.30 mm, a width B = 27.55 mm
and a length L= 126 mm. The width B of the sample is
important to ensure that the crack tip is in a state of plane
strain. This is proportional to the critical fracture toughness
J. Christmann, et al.: Fracture Toughness of Ice 5
Figure 2. TEXT
Figure 3. Location of the examined ice core B34.
94.6 94.8 95 95.2 95.4 95.6 95.8 96830
840
850
860
870
880
dens
ity (
kg m
−3 )
depth B34 (m)
mean density at the notch
Figure 4. Depth-density profile of the considered ice core part.
�������������������������������������������������������������������������������������������������������������������������������������������������������������������������������������������������������������������������������������������������������������������������������������������������������������������������������������������������������������������������
�������������������������������������������������������������������������������������������������������������������������������������������������������������������������������������������������������������������������������������������������������������������������������������������������������������������������������������������������������������������������
a b c d
ihgfe j
lk
Figure 5. Cross section of ice core showing the sample locationpattern.
Figure 6. Representative microstructure of theB34 ice core show-ing air bubbles (black inclusions), grain boundaries (black lines)and the examplary white line, where the grain size was measured.
a
ice sample
W
L
So
Si
F,u
Figure 7. Schematic of four-point bending arrangement used to de-termine the critical fracture toughness.
Figure 8. Representative force and displacement data as a functionof time during a fracture experiment. The vertical thin black linereprents the time at failure.
Figure 3. Representative microstructure of the B34 ice core show-
ing air bubbles (black inclusions), grain boundaries (black lines)
and the white line indicating where the grain size was measured.
value and the inverse of the material’s yield stress. In order to
maximize the plane strain condition, within the possibilities
given by the ice core geometry, B was taken to be larger than
W to ensure that the crack face cut through a minimum of
six grains. As part of the widely accepted ASTM standards,
the crack length-to-sample height ratio should ideally be be-
tween 0.25 and 0.65. Ratios outside of this window introduce
very minor errors due, in part, to the proximity of the crack
tip plastic zone to the sample edge. In this study, however,
due to the very low fracture toughness of ice, the crack was
shortened slightly to increase the maximum force Pmax re-
quired to cause failure. It was expected that a higher value
would help reduce error or premature breakage during sam-
ple handling. Due to the nature of the preparation process the
sample thickness and width were found to vary, with a stan-
dard deviation of 0.16 and 0.27 mm, respectively. The minor
variations in sample size were not found to influence the frac-
ture toughness measurements. Prior to testing, a notch was
milled into each sample with a custom-built milling machine
to ensure repeatability. The milling procedure was performed
at −15 ◦C, and a notch of approximately 2.5 mm depth was
cut into each sample. The final notch radius was approxi-
mately ra ≈ 100 µm, which was determined by the fixed ra-
dius of the cutting tool. Following the milling procedure, the
cutting tool was analyzed with a light microscope with 100x
magnification and the radius of the tool tip was determined.
Although, it is known that the notch radius can influence the
observed fracture toughness values, depending on the mate-
rial’s grain size; see Nishida et al. (1994); Rist et al. (2002)
found that the grain size has no effect on the fracture tough-
ness of ice at different depths of the Ronne Ice Shelf.
Figure 3 shows a representative microstructure of the
tested ice. It is apparent that there is a distribution of grain
sizes as well as significant porosity, indicated by the dark
regions. The grain size was determined along the white
line, which extends along the entire length of the sample
www.earth-syst-sci-data.net/7/87/2015/ Earth Syst. Sci. Data, 7, 87–92, 2015
90 J. Christmann et al.: Measurement of fracture toughness of ice
J. Christmann, et al.: Fracture Toughness of Ice 5
Figure 2. TEXT
Figure 3. Location of the examined ice core B34.
94.6 94.8 95 95.2 95.4 95.6 95.8 96830
840
850
860
870
880
dens
ity (
kg m
−3 )
depth B34 (m)
mean density at the notch
Figure 4. Depth-density profile of the considered ice core part.
�������������������������������������������������������������������������������������������������������������������������������������������������������������������������������������������������������������������������������������������������������������������������������������������������������������������������������������������������������������������������
�������������������������������������������������������������������������������������������������������������������������������������������������������������������������������������������������������������������������������������������������������������������������������������������������������������������������������������������������������������������������
a b c d
ihgfe j
lk
Figure 5. Cross section of ice core showing the sample locationpattern.
Figure 6. Representative microstructure of theB34 ice core show-ing air bubbles (black inclusions), grain boundaries (black lines)and the examplary white line, where the grain size was measured.
a
ice sample
W
L
So
Si
F,u
Figure 7. Schematic of four-point bending arrangement used to de-termine the critical fracture toughness.
Figure 8. Representative force and displacement data as a functionof time during a fracture experiment. The vertical thin black linereprents the time at failure.
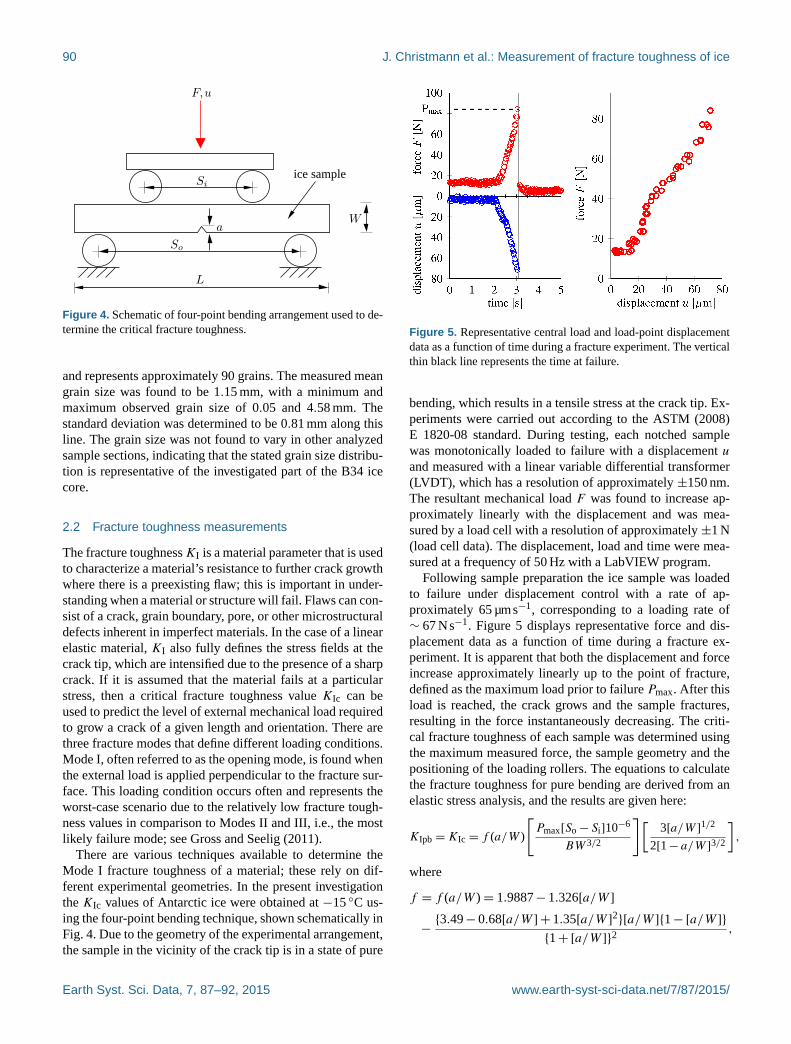
Figure 4. Schematic of four-point bending arrangement used to de-
termine the critical fracture toughness.
and represents approximately 90 grains. The measured mean
grain size was found to be 1.15 mm, with a minimum and
maximum observed grain size of 0.05 and 4.58 mm. The
standard deviation was determined to be 0.81 mm along this
line. The grain size was not found to vary in other analyzed
sample sections, indicating that the stated grain size distribu-
tion is representative of the investigated part of the B34 ice
core.
2.2 Fracture toughness measurements
The fracture toughness KI is a material parameter that is used
to characterize a material’s resistance to further crack growth
where there is a preexisting flaw; this is important in under-
standing when a material or structure will fail. Flaws can con-
sist of a crack, grain boundary, pore, or other microstructural
defects inherent in imperfect materials. In the case of a linear
elastic material, KI also fully defines the stress fields at the
crack tip, which are intensified due to the presence of a sharp
crack. If it is assumed that the material fails at a particular
stress, then a critical fracture toughness value KIc can be
used to predict the level of external mechanical load required
to grow a crack of a given length and orientation. There are
three fracture modes that define different loading conditions.
Mode I, often referred to as the opening mode, is found when
the external load is applied perpendicular to the fracture sur-
face. This loading condition occurs often and represents the
worst-case scenario due to the relatively low fracture tough-
ness values in comparison to Modes II and III, i.e., the most
likely failure mode; see Gross and Seelig (2011).
There are various techniques available to determine the
Mode I fracture toughness of a material; these rely on dif-
ferent experimental geometries. In the present investigation
the KIc values of Antarctic ice were obtained at −15 ◦C us-
ing the four-point bending technique, shown schematically in
Fig. 4. Due to the geometry of the experimental arrangement,
the sample in the vicinity of the crack tip is in a state of pure
Figure 5. Representative central load and load-point displacement
data as a function of time during a fracture experiment. The vertical
thin black line represents the time at failure.
bending, which results in a tensile stress at the crack tip. Ex-
periments were carried out according to the ASTM (2008)
E 1820-08 standard. During testing, each notched sample
was monotonically loaded to failure with a displacement u
and measured with a linear variable differential transformer
(LVDT), which has a resolution of approximately ±150 nm.
The resultant mechanical load F was found to increase ap-
proximately linearly with the displacement and was mea-
sured by a load cell with a resolution of approximately ±1 N
(load cell data). The displacement, load and time were mea-
sured at a frequency of 50 Hz with a LabVIEW program.
Following sample preparation the ice sample was loaded
to failure under displacement control with a rate of ap-
proximately 65 µms−1, corresponding to a loading rate of
∼ 67 Ns−1. Figure 5 displays representative force and dis-
placement data as a function of time during a fracture ex-
periment. It is apparent that both the displacement and force
increase approximately linearly up to the point of fracture,
defined as the maximum load prior to failure Pmax. After this
load is reached, the crack grows and the sample fractures,
resulting in the force instantaneously decreasing. The criti-
cal fracture toughness of each sample was determined using
the maximum measured force, the sample geometry and the
positioning of the loading rollers. The equations to calculate
the fracture toughness for pure bending are derived from an
elastic stress analysis, and the results are given here:
KIpb =KIc = f (a/W )
[Pmax[So− Si]10−6
BW 3/2
][3[a/W ]1/2
2[1− a/W ]3/2
],
where
f = f (a/W )= 1.9887− 1.326[a/W ]
−{3.49− 0.68[a/W ] + 1.35[a/W ]2}[a/W ]{1− [a/W ]}
{1+ [a/W ]}2,
Earth Syst. Sci. Data, 7, 87–92, 2015 www.earth-syst-sci-data.net/7/87/2015/

J. Christmann et al.: Measurement of fracture toughness of ice 91
Figure 6. (a) Comparison to results from Rist et al. (1999) and the average of the measured fracture toughness values. (b) Detail magnification
of the measured range.
Pmax is the maximum applied force, So the span of the outer
rollers (So = 102.8 mm) and Si the span of the inner rollers
(Si = 51.4 mm). The dimension B is perpendicular to the
crack depth, W is the dimension parallel to the crack depth
and a is the notch depth. For details see ASTM (2007).
3 Results and discussion
During experimental characterization, 108 samples were
measured. Of these samples, 91 failed due to a crack em-
anating from the notch; the other samples broke at another
position away from the notch, most likely due to a local de-
fect that resulted in a higher stress intensity factor than at
the notch. During analysis, only the samples that failed at
the notch were used to calculate the fracture toughness. Wei
et al. (1991) studied the influence of crack (or notch) radii for
freshwater columnar ice produced with six different methods
for single-edge notched-bend specimens and analyzed the
impact of notch acuity. In this investigation, the average stan-
dard deviation was 33.95 % using a four-point bending ex-
perimental arrangement, which is comparable to the current
setup. The average critical fracture toughness, shown based
on our measurements, was found to be 95.35 kPam1/2, with
an average standard deviation of ±16.69 kPam1/2 for densi-
ties ranging from 844.5 to 870.3 kgm−3 (Fig. 6). In Fig. 6,
each red circle represents an individual measurement; the av-
erage toughness for each density from the middle section of
the nine cylinders (see Fig. 1) is depicted by green squares
with error bars that correspond to a 10 % deviation. The new
results derived for Antarctic inland ice are compared in Fig. 6
with the results obtained by Rist et al. (1999), shown as blue
diamonds. The temperature of −15 ◦C was prescribed due
to the conditions in the ice lab. Rist et al. (1999) measured
the critical fracture toughness in an ice lab at −20 ◦C and
stated “we believe that within experimental error, tempera-
ture would have no significant effect on our measured values
of fracture toughness for shelf ice” (Rist et al., 1999). There-
fore, it is possible to compare those results to the one ob-
tained by the four-point bending technique presented here. It
can be clearly observed that the critical stress intensity values
from the results measured previously are approximately 30–
50 % larger than the average values determined by the four-
point bending experiments. This could be due to a higher
loading rate, a larger notch radius or differences in the type
of ice tested. The average standard deviation for a four-point
bending technique is assumed in the literature to be between
2 and 7 % for homogeneous ceramics; see Gogotsi (2003).
This spread will be much larger if the material is relatively
heterogeneous or full of defects (like ice-core ice). The stan-
dard deviation of the critical fracture toughness for the cur-
rent measurements was approximately 17.5 %. Nevertheless,
the maximum absolute variation of 16.69 kPam1/2 for frac-
ture toughness measurements of any sort is relatively small
when compared to, for example, materials such as structural
ceramics, where an absolute deviation of several MPam1/2 is
possible; see Gogotsi (2003). The absolute value of the crit-
ical fracture toughness for ice, here 95.35 kPam1/2, is small
compared to other materials, but the absolute distribution of
40 % is nevertheless significant. However, the larger number
of samples tested, with a comparable distribution in the liter-
ature of critical fracture toughness variations for a given scat-
tering for ice, demonstrates the repeatability of the current
measurements. It should also be considered that (i) the mea-
surements were performed on natural materials with various
www.earth-syst-sci-data.net/7/87/2015/ Earth Syst. Sci. Data, 7, 87–92, 2015

92 J. Christmann et al.: Measurement of fracture toughness of ice
impurities and (ii) that a relatively small number of grains
were tested in each sample due to the grain size. Both of
these factors can lead to an increased sample-to-sample vari-
ation. Additionally, the investigation of the sample thickness,
the sample width and the location of the sample reveal that
their influence on the results were negligibly small.
4 Conclusions
The critical stress intensity factor was experimentally deter-
mined for bubbly ice from Antarctica. During testing, single-
edge v-notch beam samples in a four-point loading config-
uration were utilized and monotonically loaded to failure.
The investigated density range was too small to conclusively
observe a density-dependent change in the fracture tough-
ness. In total, 91 samples were investigated, allowing for
the determination of an average critical stress intensity and
a standard deviation, determined to be 95.35 kPa m1/2 and
±16.69 kPa m1/2, respectively. Comparison to previous ex-
perimental results (Rist et al., 1999) shows good agreement,
particularly when the variations in the ice sample and differ-
ent testing conditions are considered. The samples are sawed
and tested in only 3 days, and, due to the small dimension
of a sample, the loss of material is minimized. The distribu-
tion of the critical fracture toughness was shown to be very
small in comparison with other materials. In further research,
the density interval should be extended by analyzing different
depths in one or more drill cores. This would provide a better
statistical evaluation of the possible critical fracture tough-
ness values. Different locations, such as ice from Greenland
firn cores with different impurities or regions where the ice is
known to be more anisotropic, could give further indications
of the possible variation in fracture toughness values.
Acknowledgements. This work was supportd by DFG priority
program SPP 1158, project numbers HU 1570/5-1; MU 1370/7-1.
Edited by: D. Carlson
References
ASTM C1421-01b: Standard Test Methods for Determination of
Fracture Toughness of Advanced Ceramics at Ambient Tempera-
ture, Annual Book of Standards, Vol. 15.01, ASTM International,
West Conshohocken, doi:10.1520/C1421-10, 2007.
ASTM E1820-08: Standard Test Methods for Measurement of Frac-
ture Toughness, Annual Book of Standards, Vol. 03.01, ASTM
International, West Conshohocken, doi:10.1520/E1820, 2008.
Dempsey, J. P.: The fracture toughness of ice, Ice-Structure Inter-
action, IUTAM Proceeding, Springer-Verlag, Berlin Heidelberg,
109–145, 1991.
Freitag, J., Kipfstuhl, S., and Laepple, T.: Core-scale radioscopic
imaging: a new method reveals density-calcium link in Antarctic
firn, J. Glaciol., 59, 1009–1014, 2013.
Gogotsi, G. A.: Fracture toughness of ceramics and ceramic com-
posites, Ceramics International, 29, 777–784, 2003.
Goodman, D. J. and Tabor, D.: Fracture toughness of ice: a prelimi-
nary account of some new experiments, J. Glaciol., 21, 651–660,
1978.
Glen, J. W.: The flow law of ice, a discussion of the assumptions
made in glacier theory, their experimental foundations and con-
sequences, IAHS-AISH P., 47, 171–183, 1958.
Greve, R. and Blatter, H.: Dynamics of Ice Sheets and Glaciers,
Springer, Berlin, 2009.
Gross, D. and Seelig, T.: Fracture Mechanics with an Introduction
to Micromechanics, Springer, Berlin, 2011.
Nishida, T., Hanaki, Y., and Pezzotti, G.: Effect of notch-root ra-
dius on the fracture toughness of a fine-grained alumina, J. Am.
Ceram. Soc., 77, 606–608, 1994.
Nixon, W. A.: The effect of notch depth on the fracture toughness
of freshwater ice, Cold Reg. Sci. Technol., 15, 75–78, 1988.
Nixon, W. A. and Schulson, E. M.: A micromechanical view of the
fracture toughness of ice, J. Phys., 48, 313–319, 1987.
Nixon, W. A. and Schulson, E. M.: Fracture toughness of ice over
a range of grain sizes, J. Offshore Mech. Arct., 110, 192–196,
1988.
Rice, R. W.: Mechanical Properties of Ceramics and Composites:
Grain and Particle Effects, Marcel Dekker, New York, 2000.
Rist, M. A., Sammonds, P. R., Murrell, S. A. F., Meredith, P. G.,
Oerter, H., and Doake, C. S. M.: Experimental fracture and me-
chanical properties of Antarctic ice: preliminary results, Ann.
Glaciol., 23, 284–292, 1996.
Rist, M. A., Sammonds, P. R., Murrell, S. A. F., Meredith, P. G.,
Doake, C. S. M., Oerter, H., and Matsuki, K.: Experimental and
theoretical fracture mechanics applied to Antarctic ice fracture
and surface crevassing, J. Geophys. Res., 104, 2973–2987, 1999.
Rist, M. A., Sammonds, P. R., Oerter, H., and Doake, C. S. M.:
Fracture of Antarctic shelf ice, J. Geophys. Res.-Sol. Earth, 107,
ECV2-1–ECV2-13, 2002.
Schulson, E. M. and Duval, P.: Creep and Fracture of Ice, Cam-
bridge University Press, Cambridge, 2009.
Timco, G. W. and Frederking, R. M. W.: Flexural strength and frac-
ture toughness of sea ice, Cold Reg. Sci. Technol., 8, 35–41,
1982.
Weber, L. J. and Nixon, W. A.: Fracture toughness of freshwater ice
– Part I: Experimental technique and results, J. Offshore Mech.
Arct., 135–140, 1996a.
Weber, L. J. and Nixon, W. A.: Fracture toughness of freshwater
ice – Part II: Analysis and micrography, J. Offshore Mech. Arct.,
118, 141–147, 1996b.
Wei, Y., DeFranco, S. J., and Dempsey, J. P.: Crack-fabrication tech-
niques and their effect on the fracture toughness and CTOD for
fresh-water columnar ice, J. Glaciol., 37, 270–280, 1991.
Earth Syst. Sci. Data, 7, 87–92, 2015 www.earth-syst-sci-data.net/7/87/2015/