Embed Size (px)
Citation preview
HAL Id: halshs-01806496https://halshs.archives-ouvertes.fr/halshs-01806496
Submitted on 3 Jun 2018
HAL is a multi-disciplinary open accessarchive for the deposit and dissemination of sci-entific research documents, whether they are pub-lished or not. The documents may come fromteaching and research institutions in France orabroad, or from public or private research centers.
L’archive ouverte pluridisciplinaire HAL, estdestinée au dépôt et à la diffusion de documentsscientifiques de niveau recherche, publiés ou non,émanant des établissements d’enseignement et derecherche français ou étrangers, des laboratoirespublics ou privés.
Measurement of the displaced commercial risk in IslamicBanks
Kaouther Toumi, Jean-Laurent Viviani, Zeinab Chayeh
To cite this version:Kaouther Toumi, Jean-Laurent Viviani, Zeinab Chayeh. Measurement of the displaced commercialrisk in Islamic Banks. Quarterly Review of Economics and Finance, Elsevier, 2019, 74, pp.18-31.�10.1016/j.qref.2018.03.001�. �halshs-01806496�
1
Measurement of the displaced commercial risk in Islamic Banks Kaouther TOUMIa, Jean-Laurent VIVIANIb, Zeinab CHAYEHc a University of Toulouse 3, France LGCO - EA 7416 31077 Toulouse - France [email protected] b University of Rennes, CNRS, CREM - UMR 6211, F-35000 Rennes, France
[email protected] c University of Paris 6 75005 Paris - France [email protected] Highlights
We identify the displaced commercial risk DCR exposure of Islamic banks. We identify the scenarios of displaced commercial risk exposure to compute the DCR
Profits and Losses to Islamic banks shareholders. Scenarios of risk depend on the actual rate of return on investment accounts, the
benchmark rate of return and level of existing reserves to mitigate the DCR. We assess the capital charge needed to cover the displaced commercial risk using the
Value-at-risk measure of risk, DCR-VaR. We assess the coefficient alpha α CAR-VaR for the capital adequacy ratio for Islamic
banks. We consider three methods, the Historical non-parametric VaR, the parametric-VaR and
the Extreme Value Theory-VaR. Abstract The objective of the research is to quantify the displaced commercial risk (DCR) based on quantitative finance techniques. We develop an internal model based on the Value-at-risk (VaR) measure of risk to assess the DCR-VaR and the alpha coefficient in the capital adequacy ratio of Islamic banks. We identify first the scenarios of exposure of Islamic banks to DCR that depend on the actual return on unrestricted profit sharing investment accounts (PSIAU), the benchmark return as well as the level of the existing profit equalization reserve (PER) and investment risk reserve (IRR). Second, we quantify the DCR-VaR and the alpha coefficient for a given holding period and for given confidence level. We illustrate the DCR-VaR model on selected Islamic banks from Bahrain. Our model helps to better assess the needed equity to cover the DCR and an accurate capital adequacy ratio for Islamic banks. The model has also policy implications for regulators and the IFSB to develop better guidance on good practices in managing this risk.
ACCEPTED MANUSCRIPT
of Islamic bof Islamic baask exposure tsk exposure t
of returnof return onong reservesg reserve to
cover the dispcover the disaRR..
α α CARCAR-VaRVaR forfor
, the Historica the Historicaoryry--VaR.VaR.
f f theth researchresearchfinance technfinance techn
easureeasur of riskriskuacy ratio of Iacy ratio of I
CR that hat depenepe(PSIAPSIAUA )), the, the(PER)ER anan
ffiffi
2
JEL G21, G28, G31, Z12 Abbreviations AAOIFI: Accounting and Auditing Organization of Islamic Financial Institutions CBs: Conventional banks CBB: Central Bank of Bahrain DCR: Displaced commercial risk DCR-VaR: The Value-at-Risk measure of the displaced commercial risk DCR P&L: Displaced commercial risk Profit and Loss series EVT: Extreme Value Theory IBs: Islamic banks IFSB: Islamic Financial Services Board IRR: Investment Risk Reserve PSIAU: Unrestricted Profit Sharing Investment Accounts PER: Profit Equalization Reserve VaR: Value-at-Risk
: alpha coefficient in the capital adequacy ratio for IBs needed by the central bank of Bahrain (as recommended by the IFSB)
: alpha coefficient in the capital adequacy ratio for IBs calculated based on Value at risk tool. Keywords: Displaced commercial risk; Value-at-risk; Extreme value theory; Profit equalization reserve; Investment risk reserve, capital adequacy ratio.
1. Introduction Managing risks has always been at the heart of any bank’s activity. The goal of a prudent
financial risk management is crucial to maximize the bank value and to ensure its stability and profitability (Abedifar et al., 2013; Mollah et al., 2016). Risk management in Islamic banks (hereafter, IBs) deserves special attention as they present specific aspects such as the intermediation scheme, the financial instruments and the governance which expose these institutions to a new breed of risks that have to be managed (Abedifar et al., 2013). Whereas IBs are different from conventional banks (hereafter, CBs), these institutions are nevertheless subject to a similar framework and procedures for analyzing and assessing their exposure to risks (Mokni et al., 2014; Rosman, 2009). The Islamic Financial Services Board (IFSB), the standard setting body for the Islamic banking industry, recommends IBs to have adequate systems to identify measure, evaluate, monitor, report and mitigate risks in the banking book on a timely basis (IFSB-17, 2015).
Our research focuses on the risk management process of a specific risk to IBs named the displaced commercial risk (hereafter, DCR) resulting from the management of profit distributions on Unrestricted Profit Sharing Investment Accounts (hereafter, PSIAU) governed
ACCEPTED MANUSCRIPT
ratioatio for IBsfor IBs n
quacy ratioquacy ratio fofo
sk; Valuesk; Va -atatrisk reserve, crisk reserve
always been always been ement is crucement is cruc
edifar et al., 2edifar et al.,s)s) deservedeservess spsp
tionio schemeemeionsons to a new to a new
are differe ent esubject to a simubject to a sirisksks (Mok(Mok
andarda
3
on the Mudarabah basis in which the PSIAs holders act as fund providers (Rabb-ul-mal) and the IB acts as a fund manager (Mudarib). The IB invests PSIAU funds on behalf of PSIAU holders and as a Mudarib, the Islamic bank is entitled to a Mudarib share which is a share of profits (and not losses) earned on the PSIAU funds managed. The contractual obligations of Mudarabah stipulate that profits are shared in a pre-agreed ratio between the IB and the PSIAU depositors while losses are to be borne only by depositors except in the case of misconduct, negligence or breach of contracted terms by the IB (AAOIFI, 2015a). Theoretically, the Mudarabah contract works under the banner « Profit sharing and loss bearing » unlike the contract Musharakah which is under the banner « Profit and loss sharing ».However, the original theoretical framework of the profit sharing and loss bearing principles that governs the PSIAU deposits under Mudarabah is not practiced under special market conditions. Recent studies highlight the divergence between the treatment of PSIAU in practice and the theoretical conception (Archer and Karim, 2009, 2006; El-Hawary et al., 2007; Karim, 2001; Toumi and Viviani, 2013). Another set of studies provide systematic evidence that most IBs manage profit distributions to PSIAU depositors and smooth returns paid to them (Farook et al., 2012; Taktak, 2011; Zoubi and Al-Khazali, 2007).
The DCR arises when the actual rate of return on PSIAU deposits under Mudarabah is lower than the expectations of PSIAU holders that follow current market expectations, generally equivalent to the rate of returns offered on an alternative investment with similar risk (Toumi and Viviani, 2013). In case of a low actual rate of return PSIAU holders will be tempted to withdraw PSIAU funds to place them in other institutions offering better returns (Aysan et al., 2016). This massive withdrawal risk threatens the bank's commercial position as well as the stability of the financial system and may cause systemic risk. The competition may force IBs and their shareholders to forego part of their profits to pay comparable and competitive rates of return to PSIA depositors resulting in them having to bear losses in cases when the returns fall short. Supervisors may require also a profit payout mechanism to PSIAU that provides some protection in order to avoid a systemic risk. A necessary consequence of the smoothing practices adopted by IBs to match market expectations is that a portion (or all) of the risk arising from assets managed on behalf of PSIAU holders is effectively transferred to the IB capital, a phenomenon known as the displaced commercial risk DCR. The DCR affects thus the IB capital and requires an additional capital charge.
This new risk in the banking sector adds considerable challenges to regulators and IBs in
assessing the actual risk borne by the shareholders. In most jurisdictions, the frameworks for the measurement of DCR in IBs still rare despite the efforts of the IFSB in this area which published in March 2011 guidance note on the determination of a DCR measurement framework. The IFSB has already provided a mechanism to measure the DCR for IBs and reflects it with the alpha α coefficient in the supervisory discretion formula of calculation of the capital adequacy ratio CAR for IBs (IFSB-2, 2005; IFSB-GN 4, 2011). The alpha “ ” coefficient reflects the proportion of the risk weighted assets funded by PSIAU to be displaced from PSIAU holders to shareholders. IFSB suggests to measure alpha “ ” by the ratio of actual exposure to DCR to the maximum exposure to DCR (IFSB-GN 4, 2011). The formula of DCR and thus alpha “ ” are calculated based on the measure of the variability of
ACCEPTED MANUSCRIPTverns the verns the
Recent Recent the theoreticahe theoretic
2001; Toum2001; Toumi aimost most IBs managIBs mana
rook et al., 20ok et al., 20
deposits undedeposits undnt market expemarket exp
ive investmenve investmereturn PSIAeturn PSIAU
nstitutions offnstitutions offens the bank's he bank's
y cause systemause systemof their profitof their profi
g in them havg in them halso a profit also a profit
d a systemic ria systemic ris to match mato match ma
managed on bemanaged on bemenon known menon know
d requires an arequires an a
s s new new risk ri in tinessing the actuing the a
he measuremhe measurempublished iblished
amewmew
4
shareholders returns on equity given by the standard deviation measure of variability (or variance). The relation between alpha “ ” and the actual exposure to DCR is positive. Higher actual returns smoothing on PSIAU imply higher actual risk transfer to shareholders increasing thus the alpha “ ” that the highest value is 1. In some jurisdictions, the value of alpha “ ” still being subject to supervisory discretion and does not take into consideration the specificities of each IB's own practices in terms of smoothing (Daher et al., 2015; Toumi and Viviani, 2013) (i.e, 50% in Bahrain, etc.).
Currently, the estimation of the DCR as recommended by the IFSB as well as the coefficient alpha “ ” presents some weaknesses. First, it is mainly because it is based on a simple formula of risk measure based on the standard deviation (or variance) of shareholders returns on equity that gives a measure of the volatility of returns about their mean. Nevertheless, using such a classical and simple volatility formula has two shortcomings. In one side, the average return may not represent the true mean of the return distribution. In the other side, the problem relates to the arbitrary choice of the length of the historical returns sample (Saita, 2007). Second, the measure suggested by IFSB ignores the extreme scenario where the PSIAs holders occur losses and their investment returns are negative. However, this issue is important mainly in jurisdictions when depositors are highly protected by the governments and central banks for strategic reasons. The capital adequacy ratio for IBs is highly sensitive to changes in the value of DCR and alpha “ ” An inaccurate assessment might lead to IBs being significantly undercapitalized which therefore threatens financial stability. Conversely, carrying excess amounts of capital could impair their ability to compete (Daher et al., 2015). Capital is a key resource for both shareholders and managers who are interested in a bank’s ability to survive while offering an attractive return for shareholders. At the same time, capital is important for financial system supervisors who are interested in safeguarding the stability of the system by reducing the risk of bank failures (Berger et al., 1995). Therefore, in banking systems where the DCR is a significant factor, the volume of PSIAU deposits is therefore vitally important and consequently raises questions on an appropriate measure to assess the DCR as well as the required and the economic capital more precisely.
As a less sophisticated measure of DCR and the coefficient alpha “ ” exists
currently, the objective of the research is to suggest an appropriate DCR measure based on advanced quantitative finance methods instead of that of the standard deviation (or variance) suggested by the IFSB. The standard mathematical and quantitative finance approach to modelling risks uses the language of probability theory. Risks are random variables mapping unforeseen future states of the world into values representing profits and losses. The potential values of a risk have also a probability distribution.
An IB should quantify the amount of capital needed to face potential losses deriving
from the DCR the IB is running. The Value-at-risk (hereafter, VaR) is the typical tool used by most banks for this purpose. We develop an internal model based on it to assess the amount of the capital charge needed; we note the DCR-VaR. The needed equity level is obtained for a given probability level, α, and a given time horizon. For this purpose, we identify the different scenarios of transfer of risk from PSIAU holders to shareholders. The identified scenarios take
ACCEPTED MANUSCRIPTed oned o a a
rreeholdersholdean.
hortcomingsortcomings.. IItribution.ribution. In thIn th
storical storic returnturnextrxtreme scenaeme scen
gative.ative. HowevHowey protecty prot ed byed by
ratio for IBs atio for IBs accurate assesccurate ass
re threatens e threatens fir their abilityr their ability
ders and manaers and manactive return fove return fo
ervisors who ervisors who f bank failuresbank failu
ignificant factignificant facty raises y raises questques
d the economithe economi
sophisticated sophisticateobjectiveobjective of of t
quantitative fiuantitative fted by the IFSted by the IF
delling risks uling riskunforeseen funforeseen fuvalues of alues of a
5
into consideration the return smoothing policies specific to each IB and the level of existing prudential reserves, the profit equalization reserve (hereafter, PER) and the investment risk reserve (hereafter, IRR). Furthermore, we give a measure of the coefficient alpha “ ” based on VaR approach. For case studies, we consider IBs from the Bahrain banking system to measure the DCR-VaR. Only IBs that collect PSIAU deposits under Mudarabah contract and disclose minimum financial information about their DCR exposure are retained. The lack of transparency on DCR management in IBs annual reports constraints us to select only three IBs. To assess DCR-VaR, we conduct two data selection methods. The first is based on financial statement data. The second is based on market data in which we perform an advanced analysis and we make some assumptions on the IBs investment and benchmark portfolios because the available historical data of the selected banks are few.
Our study adds to the growing literature on regulation and risk management in IBs (Archer et al., 2010; Archer and Karim, 2009; Daher et al., 2015; El-Hawary et al., 2007; Farook et al., 2012; Fiennes, 2007; Mejia et al., 2014; Toumi et al., 2011) and makes a number of important contributions. First, our paper differs from the previous descriptive theoretical studies that exploring PSIAU as a unique nature of liabilities in the Islamic banking industry and highlightening the necessity to pay sufficient attention in manage risks arising from it. Second, our research contributes in computing the DCR based on advanced quantitative finance methodologies using the Value-at-risk tool, a well-known in financial mathematics that becomes a standard risk measure for financial risk management and regulation due to its conceptual simplicity and ease of computation (Kaplanski and Levy, 2007). We extend our analysis to the Extreme Value Theory (EVT) VaR, one of the most accurate and important frameworks to the Value-at-risk concept. In our knowledge, no previous studies apply the VaR-Extreme Value Theory to quantify the DCR. Third, our research may have implications for the IBs under internal model approach for Pillar 2 risks estimation. The DCR-VaR framework might be considered as alternative method to that suggested by IFSB which is based on a simple formula to measure the risk, the standard deviation (or variance). We note that the IFSB allows for an internal model approach. The DCR-VaR framework could thus help IBs to better assess the risk and thus the required economic capital for an effective risk management purposes. Fourth, our models have also policy implications for the IFSB as well as for regulators of Islamic financial institutions who want to develop better guidance on good practices in managing the DCR. The phenomenon of profit management on PSIAU is relevant and may occur either in a dual banking system environment or in a fully Islamic banking context (Toumi and Viviani, 2013). An important regulatory challenge is to ensure that PSIAU deposits at IBs are treated in a manner that is consistent with financial stability (Kammer et al., 2015).
The rest of the paper is organized as follows: section 2 presents the IFSB approach and the
DCR-VaR we suggest in quantifying the DCR and the coefficient alpha “ ”, section 3 presents case studies of IBs in Bahrain and section 4 concludes the paper.
2. DCR measurement frameworks
ACCEPTED MANUSCRIPTlysis lysis
use se thethe
gement in IBsgement in IBswary et al., 200wary et al., 200
011)011) and makemakeus s descriptivedescriptive
the Islamic bahe Islamic bn n managemanage riskisk
based on ased on advaadvanown in financown in fina
managementmanagemen(K(Kaplanski ananski an
T) VaRaR, one o, one o. In our knowIn our know
e DCR.e DC Thirdhirdh for Pillar 2 rh for Pillar
tiveive method method ttthethe risk, therisk, the
model approachdel approachhusus the the requireuir
, oour ur modelsmod hslamic slamic financfinanc
n managing thmanaging thay occur eithery occur eithe
ext xt (Toumi a(Toumdeposits at IBeposits at IB2015)15).
6
The competition may force IBs shareholders to forego part of their profits to smooth the payout to PSIAU holders in order to match market expectations and pay comparable and competitive rates of return, exposing them to DCR. IBs use various techniques to smooth returns on PSIAU (Archer et al., 2010; Archer and Karim, 2009; IFSB-17, 2015). IBs can adjust the Mudarib share that consists of temporarily reducing the bank Muḍarib share below the contractual share which tends in practice to be set at a maximum level (even if the institution is not contractually obliged to do so) (IFSB-15, 2013; IFSB-17, 2015). The share actually distributed is liable to vary from period to period depending on the actual rate of return on assets portfolio financed by PSIAU funds. IBs can furthermore transfer from shareholders income to PSIAU holders (IFSB-15, 2013; IFSB-17, 2015). The mechanism consists of donating some portion of the shareholders' income to PSIAU holders on the basis of Hibah, with the shareholders’ approval, to offer a level of return close to the market benchmark. The shareholders' decision to agree to give up a part (or all) of their income means that they accept that the risk related to assets portfolio returns financed by PSIAU funds (partly or wholly) is displaced and to be borne largely by themselves.
To avoid transferring the risk to shareholders, IBs may establish two specific prudential reserves, the Profit Equalization Reserve (hereafter, PER) and the investment risk reserve (hereafter, IRR), as recommended by the IFSB (IFSB-15, 2013; IFSB-17, 2015; IFSB-2, 2005) and AAOIFI (AAOIFI, 2015b, 2015c). The volume of the retained PER and IRR for each period is positively correlated to the gross returns generated by assets financed by PSIAU funds (Sundararajan, 2007). The use of PER and IRR has similarities with the use of conventional revenue reserves to smooth dividend payouts to shareholders. Whereas in case of conventional reserves that belong only to shareholders and are reflected in their share value, PSIA holders have no right to vote for or against the use of these reserves decided by the IB (Archer and Karim, 2006; Sundararajan, 2008). Farook et al. (2012) find a significant positive relationship between the magnitude of profit distribution management in IBs and the existence of discretionary PER and IRR reserves. The ability to manage profit smoothing is increased with the creation of dedicated discretionary reserves to that effect. Return smoothing using reserves could be conducted under regulatory pressure in addition to commercial pressure. In several jurisdictions, regulators take the view that IBs should not allow PSIAU holders to suffer from a loss or a major fall in their returns (Archer and Karim, 2009; El-Hawary et al., 2007; Mejia et al., 2014). The regulator could assimilate PSIA holders as conventional depositors who bear no risk or as partially risk absorbent depositors (instead of being investors who bear all risks of losses) (Toumi and Viviani, 2013). Return smoothing becomes thus obligatory instead of being voluntary. Considering these practices, when the accumulated PER and IRR are insufficient to smooth the PSIAU holder returns, the IBs adjust the Mudarib share if obliged, and reduce it below the level determined in the contract.
2.1. DCR-IFSB approach
IFSB identifies the DCR as the extent of additional risk by IBs shareholders compared to the situation where PSIAs holders assume all commercial risks (IFSB-GN 4, 2011). The transfer of risk from PSIAU holders to shareholders induces the volatility of shareholders return on equity, rE, which is the starting point to DCR-IFSB approach to measure the risk. The
ACCEPTED MANUSCRIPTf
HibahHibah,h with hark. k The The
ns that they acs that they acpartly or whollpartly or whol
blish two speclish two spnd the invend the investmstm
, 2013; IFSB2013; IFSBf thethe retained retaine
generated by aenerated byhas similaritihas similarit
ts to shareholdsharehols and are refleand are refle
he use of thesee use of thes).. Farook et alFarook e
fit distributionfit distributionreservesreserve . TheThe
d discretdiscre ionarnarunder regulatounder regulato
ulators take thulators taker fall in their rr fall in their
The regulatoThe regulatoaass partially rispartially r
es) (Toumi an(Toumvoluntary. oluntary. ConCosmooth themooth theelow tow
7
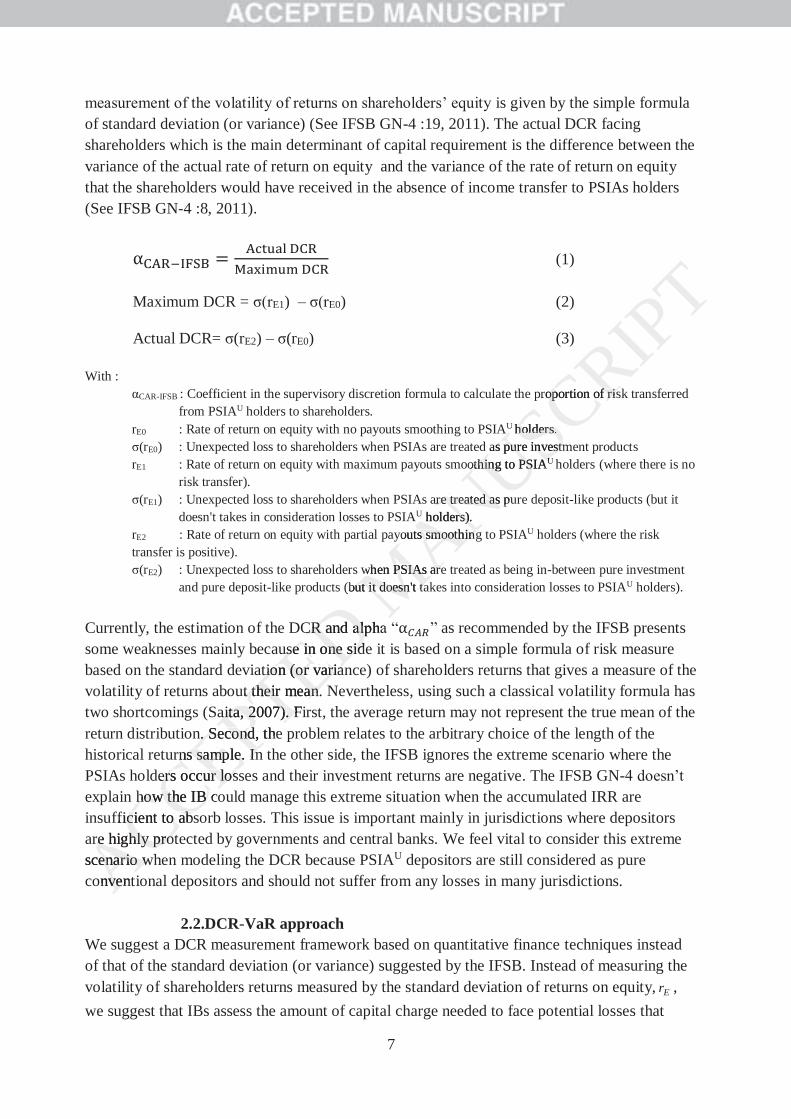
measurement of the volatility of returns on shareholders’ equity is given by the simple formula of standard deviation (or variance) (See IFSB GN-4 :19, 2011). The actual DCR facing shareholders which is the main determinant of capital requirement is the difference between the variance of the actual rate of return on equity and the variance of the rate of return on equity that the shareholders would have received in the absence of income transfer to PSIAs holders (See IFSB GN-4 :8, 2011).
(1) Maximum DCR = σ(rE1) – σ(rE0) (2) Actual DCR= σ(rE2) – σ(rE0) (3)
With : αCAR-IFSB : Coefficient in the supervisory discretion formula to calculate the proportion of risk transferred
from PSIAU holders to shareholders. rE0 : Rate of return on equity with no payouts smoothing to PSIAU holders. σ(rE0) : Unexpected loss to shareholders when PSIAs are treated as pure investment products rE1 : Rate of return on equity with maximum payouts smoothing to PSIAU holders (where there is no
risk transfer). σ(rE1) : Unexpected loss to shareholders when PSIAs are treated as pure deposit-like products (but it
doesn't takes in consideration losses to PSIAU holders). rE2 : Rate of return on equity with partial payouts smoothing to PSIAU holders (where the risk transfer is positive). σ(rE2) : Unexpected loss to shareholders when PSIAs are treated as being in-between pure investment
and pure deposit-like products (but it doesn't takes into consideration losses to PSIAU holders). Currently, the estimation of the DCR and alpha “ ” as recommended by the IFSB presents some weaknesses mainly because in one side it is based on a simple formula of risk measure based on the standard deviation (or variance) of shareholders returns that gives a measure of the volatility of returns about their mean. Nevertheless, using such a classical volatility formula has two shortcomings (Saita, 2007). First, the average return may not represent the true mean of the return distribution. Second, the problem relates to the arbitrary choice of the length of the historical returns sample. In the other side, the IFSB ignores the extreme scenario where the PSIAs holders occur losses and their investment returns are negative. The IFSB GN-4 doesn’t explain how the IB could manage this extreme situation when the accumulated IRR are insufficient to absorb losses. This issue is important mainly in jurisdictions where depositors are highly protected by governments and central banks. We feel vital to consider this extreme scenario when modeling the DCR because PSIAU depositors are still considered as pure conventional depositors and should not suffer from any losses in many jurisdictions.
2.2.DCR-VaR approach We suggest a DCR measurement framework based on quantitative finance techniques instead of that of the standard deviation (or variance) suggested by the IFSB. Instead of measuring the volatility of shareholders returns measured by the standard deviation of returns on equity, Er , we suggest that IBs assess the amount of capital charge needed to face potential losses that
ACCEPTED MANUSCRIPT
proportion of risoportion of ris
AU holdersholders..d as pure investmas pure investm
othing to PSIAothing to PSIAUU
are treated as puare treated as holders).rs).
youts smoothings smoothing
when PSIAs arewhen PSIAs are(but it doesn't taut it doesn't ta
CR and CR a alpha alpuse in one sideuse in one sid
tiontion (or varian(or variaut their mean. t their mean.
aita, 2007)aita, 2007). Fi. Fn. Second, then. Second
rns sample.ns sample. InIners occers oc ur lossur los
how the IB cohow the IB fficientc to abso abs
re highly protre highly proscenario whenario wonventven
8
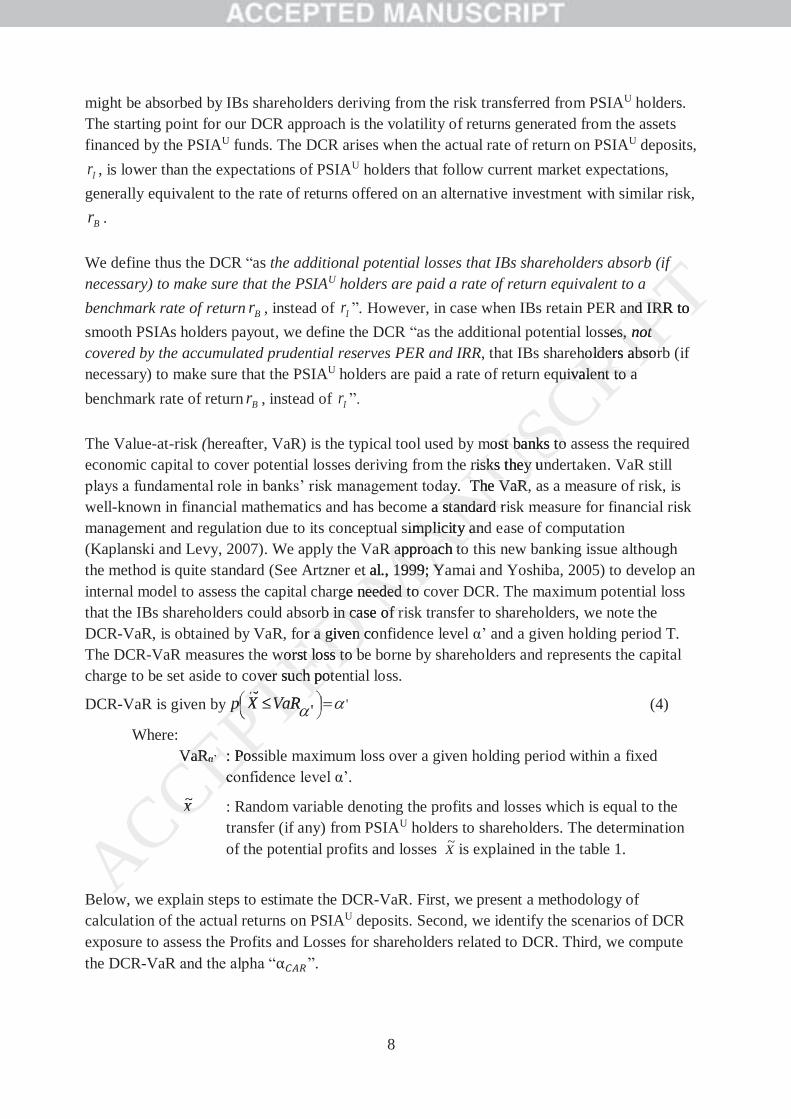
might be absorbed by IBs shareholders deriving from the risk transferred from PSIAU holders. The starting point for our DCR approach is the volatility of returns generated from the assets financed by the PSIAU funds. The DCR arises when the actual rate of return on PSIAU deposits,
Ir , is lower than the expectations of PSIAU holders that follow current market expectations, generally equivalent to the rate of returns offered on an alternative investment with similar risk,
Br . We define thus the DCR “as the additional potential losses that IBs shareholders absorb (if necessary) to make sure that the PSIAU holders are paid a rate of return equivalent to a benchmark rate of return Br , instead of Ir ”. However, in case when IBs retain PER and IRR to smooth PSIAs holders payout, we define the DCR “as the additional potential losses, not covered by the accumulated prudential reserves PER and IRR, that IBs shareholders absorb (if necessary) to make sure that the PSIAU holders are paid a rate of return equivalent to a benchmark rate of return Br , instead of Ir ”. The Value-at-risk (hereafter, VaR) is the typical tool used by most banks to assess the required economic capital to cover potential losses deriving from the risks they undertaken. VaR still plays a fundamental role in banks’ risk management today. The VaR, as a measure of risk, is well-known in financial mathematics and has become a standard risk measure for financial risk management and regulation due to its conceptual simplicity and ease of computation (Kaplanski and Levy, 2007). We apply the VaR approach to this new banking issue although the method is quite standard (See Artzner et al., 1999; Yamai and Yoshiba, 2005) to develop an internal model to assess the capital charge needed to cover DCR. The maximum potential loss that the IBs shareholders could absorb in case of risk transfer to shareholders, we note the DCR-VaR, is obtained by VaR, for a given confidence level α’ and a given holding period T. The DCR-VaR measures the worst loss to be borne by shareholders and represents the capital charge to be set aside to cover such potential loss.
DCR-VaR is given by ''~ VaRXp (4)
Where: VaRα’ : Possible maximum loss over a given holding period within a fixed
confidence level α’.
X~ : Random variable denoting the profits and losses which is equal to the transfer (if any) from PSIAU holders to shareholders. The determination of the potential profits and losses X~ is explained in the table 1.
Below, we explain steps to estimate the DCR-VaR. First, we present a methodology of calculation of the actual returns on PSIAU deposits. Second, we identify the scenarios of DCR exposure to assess the Profits and Losses for shareholders related to DCR. Third, we compute the DCR-VaR and the alpha “ ”.
ACCEPTED MANUSCRIPT
f f
and IRR tond IRR to sses, ses, not ot
holders absorbholders absorquivalent to a quivalent to a
most banks to aost banks to risks they unrisks they un
ay. The VaR,The VaR, a standard ria standard r
simplicity andmplicity anR approach toR approach to
t al., 1999; Yat al., 1999; Yge neededneeded to to
b in caseb in ca ofof rfor a givor a g en n con
worst loss to bworst loss to bover such potever such pot~~ VaRVaRXXpp
VaRVaRαα’’ : P: Possoscoco
XX~
9
2.2.1. Distribution of profits between PSIAU holders and shareholders and calculation of the actual returns attributed to PSIAU holders, IR .
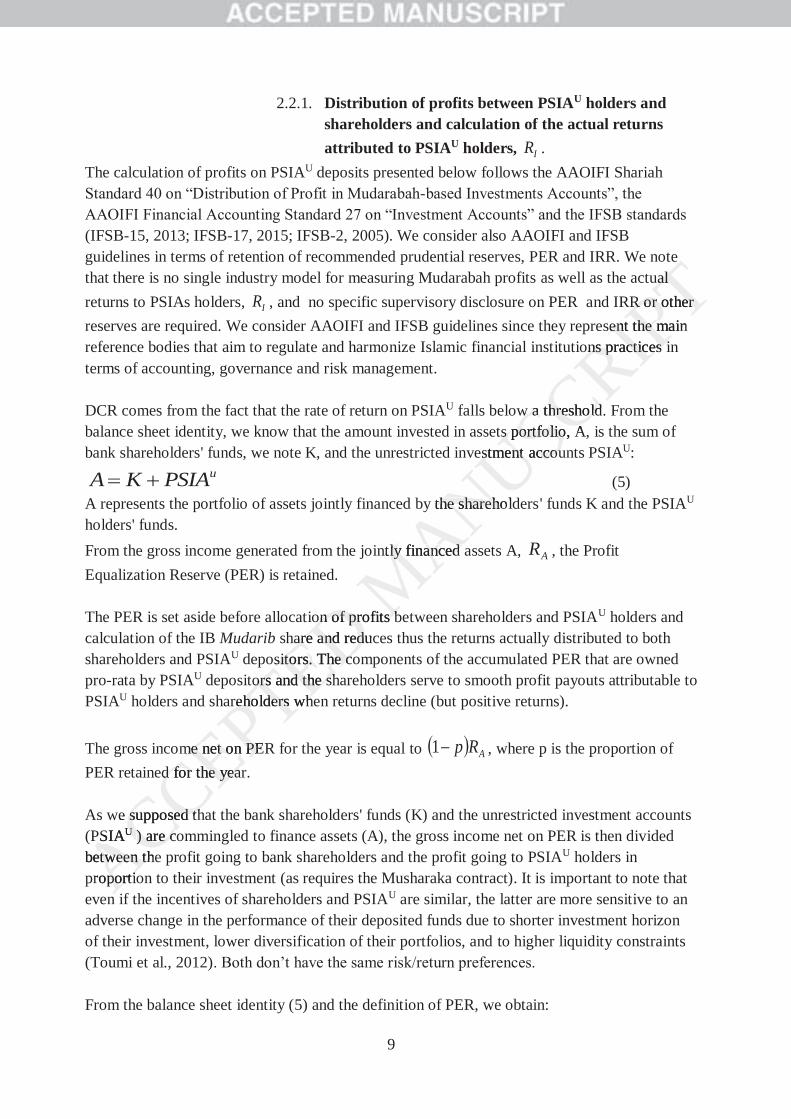
The calculation of profits on PSIAU deposits presented below follows the AAOIFI Shariah Standard 40 on “Distribution of Profit in Mudarabah-based Investments Accounts”, the AAOIFI Financial Accounting Standard 27 on “Investment Accounts” and the IFSB standards (IFSB-15, 2013; IFSB-17, 2015; IFSB-2, 2005). We consider also AAOIFI and IFSB guidelines in terms of retention of recommended prudential reserves, PER and IRR. We note that there is no single industry model for measuring Mudarabah profits as well as the actual returns to PSIAs holders, IR , and no specific supervisory disclosure on PER and IRR or other reserves are required. We consider AAOIFI and IFSB guidelines since they represent the main reference bodies that aim to regulate and harmonize Islamic financial institutions practices in terms of accounting, governance and risk management. DCR comes from the fact that the rate of return on PSIAU falls below a threshold. From the balance sheet identity, we know that the amount invested in assets portfolio, A, is the sum of bank shareholders' funds, we note K, and the unrestricted investment accounts PSIAU:
uPSIAKA (5) A represents the portfolio of assets jointly financed by the shareholders' funds K and the PSIAU holders' funds. From the gross income generated from the jointly financed assets A, AR , the Profit Equalization Reserve (PER) is retained. The PER is set aside before allocation of profits between shareholders and PSIAU holders and calculation of the IB Mudarib share and reduces thus the returns actually distributed to both shareholders and PSIAU depositors. The components of the accumulated PER that are owned pro-rata by PSIAU depositors and the shareholders serve to smooth profit payouts attributable to PSIAU holders and shareholders when returns decline (but positive returns). The gross income net on PER for the year is equal to ARp1 , where p is the proportion of PER retained for the year. As we supposed that the bank shareholders' funds (K) and the unrestricted investment accounts (PSIAU ) are commingled to finance assets (A), the gross income net on PER is then divided between the profit going to bank shareholders and the profit going to PSIAU holders in proportion to their investment (as requires the Musharaka contract). It is important to note that even if the incentives of shareholders and PSIAU are similar, the latter are more sensitive to an adverse change in the performance of their deposited funds due to shorter investment horizon of their investment, lower diversification of their portfolios, and to higher liquidity constraints (Toumi et al., 2012). Both don’t have the same risk/return preferences. From the balance sheet identity (5) and the definition of PER, we obtain:
ACCEPTED MANUSCRIPT
e ual al
R or otherR or other sent the main sent the m
ons practices ions practices i
w a w a thresholdhresholdts portfolio, As portfolio, A
estmentestment accouccou
y the shareholthe shareho
ntly financed aly financed
on of profits bon of profits bare and are and reducd
ositors.sitors. The coThe cotorsors and the shand the sh
reholderseholders whewh
me net on PERme net on PEed for the yeard for the year
we supposed thsupposed thPSIAUUA ) are co) are c
between thetween thproportiopor
10
ARpAxARpAxARpA
uPSIAARp
AK
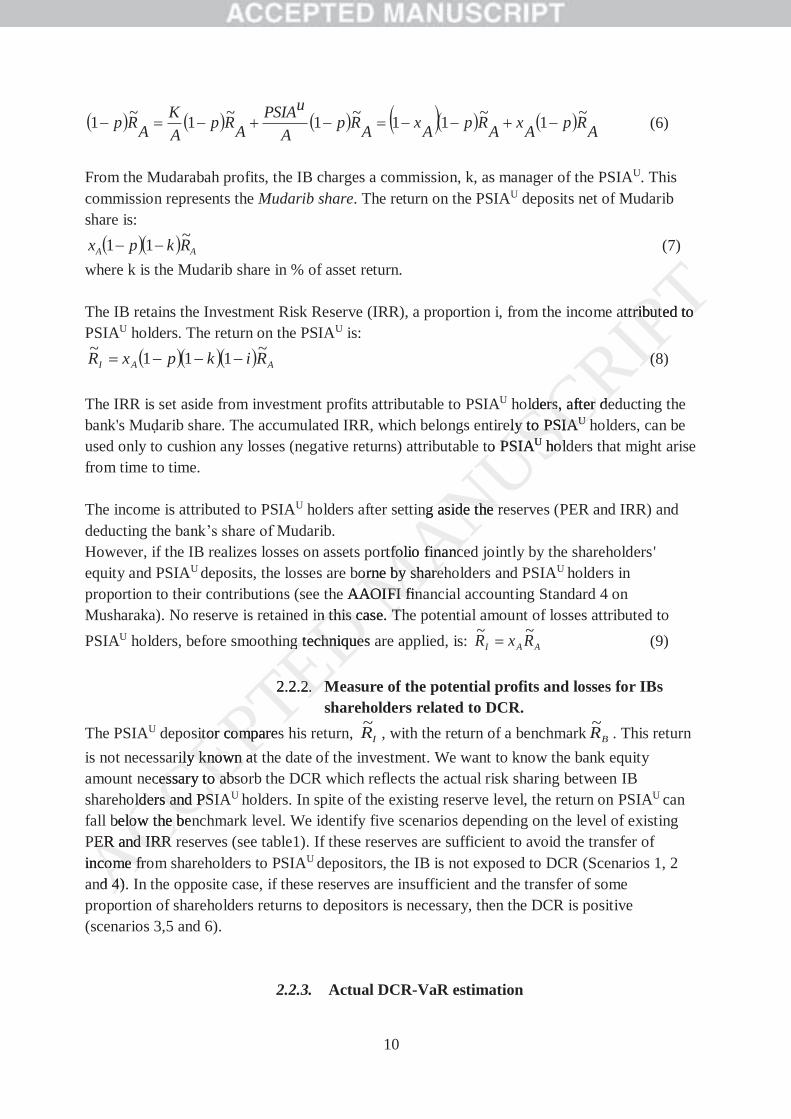
ARp ~1~11~1~1~1 (6)
From the Mudarabah profits, the IB charges a commission, k, as manager of the PSIAU. This commission represents the Mudarib share. The return on the PSIAU deposits net of Mudarib share is:
AA Rkpx ~11 (7) where k is the Mudarib share in % of asset return. The IB retains the Investment Risk Reserve (IRR), a proportion i, from the income attributed to PSIAU holders. The return on the PSIAU is:
AAI RikpxR ~111~ (8) The IRR is set aside from investment profits attributable to PSIAU holders, after deducting the bank's Muḍarib share. The accumulated IRR, which belongs entirely to PSIAU holders, can be used only to cushion any losses (negative returns) attributable to PSIAU holders that might arise from time to time. The income is attributed to PSIAU holders after setting aside the reserves (PER and IRR) and deducting the bank’s share of Mudarib. However, if the IB realizes losses on assets portfolio financed jointly by the shareholders' equity and PSIAU deposits, the losses are borne by shareholders and PSIAU holders in proportion to their contributions (see the AAOIFI financial accounting Standard 4 on Musharaka). No reserve is retained in this case. The potential amount of losses attributed to PSIAU holders, before smoothing techniques are applied, is: AAI RxR ~~ (9)
2.2.2. Measure of the potential profits and losses for IBs shareholders related to DCR.
The PSIAU depositor compares his return, IR~ , with the return of a benchmark BR~ . This return is not necessarily known at the date of the investment. We want to know the bank equity amount necessary to absorb the DCR which reflects the actual risk sharing between IB shareholders and PSIAU holders. In spite of the existing reserve level, the return on PSIAU can fall below the benchmark level. We identify five scenarios depending on the level of existing PER and IRR reserves (see table1). If these reserves are sufficient to avoid the transfer of income from shareholders to PSIAU depositors, the IB is not exposed to DCR (Scenarios 1, 2 and 4). In the opposite case, if these reserves are insufficient and the transfer of some proportion of shareholders returns to depositors is necessary, then the DCR is positive (scenarios 3,5 and 6).
2.2.3. Actual DCR-VaR estimation
ACCEPTED MANUSCRIPTattributed to attributed to
((8
lderslders, after de, after deely toely to PSIAPSIAUU hh
to PSIAPSI UUA holdhol
ng aside the reaside the r
ortfolio financtfolio financorne by shareorne by share
e AAOIFIAOIFI ffinfn this case.n this c TT
ngg techniquestechnique
2.2.2.2. MM
itor comparesitor comprily known at rily known at
cessary to absessary to abslderslders and an PSIPS
below the benlow the PER and IRRER and IRRincome frocome frond 44))
11
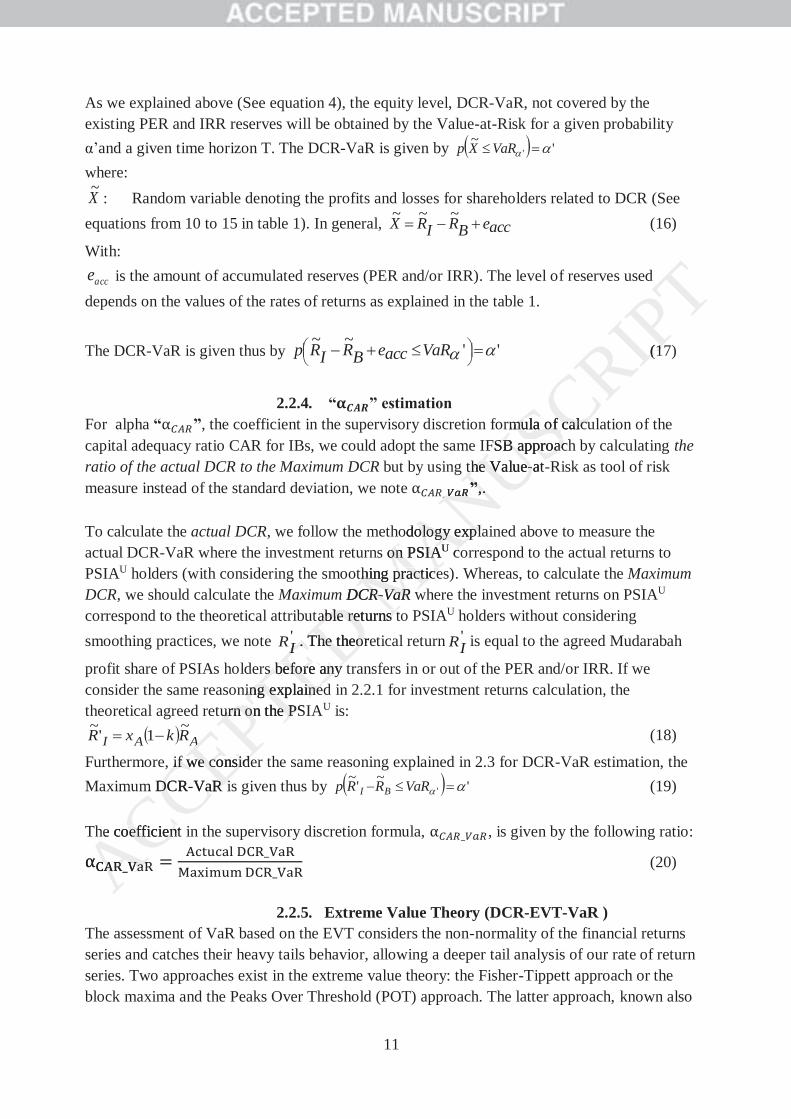
As we explained above (See equation 4), the equity level, DCR-VaR, not covered by the existing PER and IRR reserves will be obtained by the Value-at-Risk for a given probability α’and a given time horizon T. The DCR-VaR is given by '~
'VaRXp where: X~ : Random variable denoting the profits and losses for shareholders related to DCR (See equations from 10 to 15 in table 1). In general, acceBRIRX ~~~ (16)
With:
acce is the amount of accumulated reserves (PER and/or IRR). The level of reserves used depends on the values of the rates of returns as explained in the table 1.
The DCR-VaR is given thus by ''~~ VaRacceBRIRp (17)
2.2.4. “ ” estimation
For alpha “ ”, the coefficient in the supervisory discretion formula of calculation of the capital adequacy ratio CAR for IBs, we could adopt the same IFSB approach by calculating the ratio of the actual DCR to the Maximum DCR but by using the Value-at-Risk as tool of risk measure instead of the standard deviation, we note ”,. To calculate the actual DCR, we follow the methodology explained above to measure the actual DCR-VaR where the investment returns on PSIAU correspond to the actual returns to PSIAU holders (with considering the smoothing practices). Whereas, to calculate the Maximum DCR, we should calculate the Maximum DCR-VaR where the investment returns on PSIAU correspond to the theoretical attributable returns to PSIAU holders without considering smoothing practices, we note '
IR . The theoretical return 'IR is equal to the agreed Mudarabah
profit share of PSIAs holders before any transfers in or out of the PER and/or IRR. If we consider the same reasoning explained in 2.2.1 for investment returns calculation, the theoretical agreed return on the PSIAU is:
AAI RkxR ~1'~ (18)
Furthermore, if we consider the same reasoning explained in 2.3 for DCR-VaR estimation, the Maximum DCR-VaR is given thus by '~'~
'VaRRRp BI (19) The coefficient in the supervisory discretion formula, , is given by the following ratio:
(20)
2.2.5. Extreme Value Theory (DCR-EVT-VaR )
The assessment of VaR based on the EVT considers the non-normality of the financial returns series and catches their heavy tails behavior, allowing a deeper tail analysis of our rate of return series. Two approaches exist in the extreme value theory: the Fisher-Tippett approach or the block maxima and the Peaks Over Threshold (POT) approach. The latter approach, known also
ACCEPTEDII D MANUSCRIPT
(1(17
rmula of calcurmula of calcuFSB approachFSB approac
the Vthe Valuee--at””,..
odology explaology explas onon PSIAIAUA coco
thing practicething practicem DCRCR--VaRVaR w
able returns table returns t. The theore. The theor
rs before any trs before any ning ing explainedexplained
urn on the PSurn on the PS
AA
if we conside if we considem DCRDC -VaR iaR i
he coefficient oefficien
12
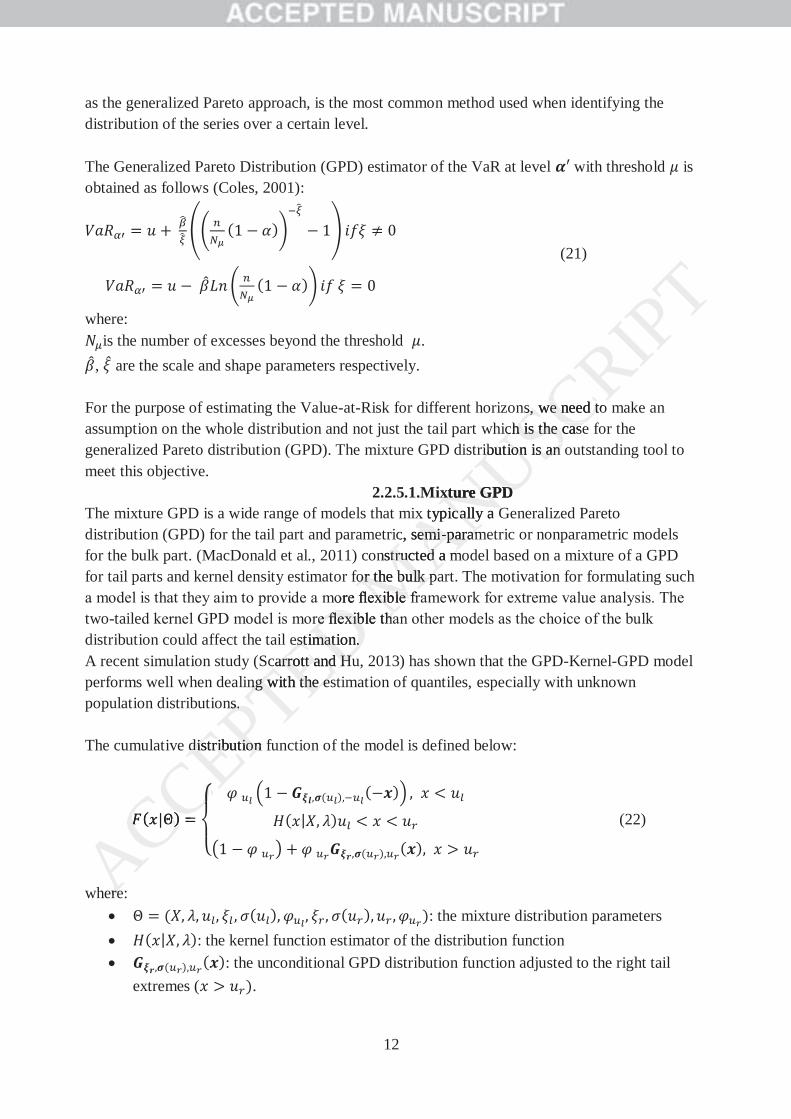
as the generalized Pareto approach, is the most common method used when identifying the distribution of the series over a certain level. The Generalized Pareto Distribution (GPD) estimator of the VaR at level with threshold is obtained as follows (Coles, 2001):
(21)
where: is the number of excesses beyond the threshold .
, are the scale and shape parameters respectively. For the purpose of estimating the Value-at-Risk for different horizons, we need to make an assumption on the whole distribution and not just the tail part which is the case for the generalized Pareto distribution (GPD). The mixture GPD distribution is an outstanding tool to meet this objective.
2.2.5.1.Mixture GPD The mixture GPD is a wide range of models that mix typically a Generalized Pareto distribution (GPD) for the tail part and parametric, semi-parametric or nonparametric models for the bulk part. (MacDonald et al., 2011) constructed a model based on a mixture of a GPD for tail parts and kernel density estimator for the bulk part. The motivation for formulating such a model is that they aim to provide a more flexible framework for extreme value analysis. The two-tailed kernel GPD model is more flexible than other models as the choice of the bulk distribution could affect the tail estimation. A recent simulation study (Scarrott and Hu, 2013) has shown that the GPD-Kernel-GPD model performs well when dealing with the estimation of quantiles, especially with unknown population distributions. The cumulative distribution function of the model is defined below:
(22)
where:
: the mixture distribution parameters : the kernel function estimator of the distribution function : the unconditional GPD distribution function adjusted to the right tail
extremes ( .
ACCEPTED MANUSCRIPT
s,s, we need to we need toch is the casech is the case
ribution is an oibution is an
xture GPDxture GPDx typicx typically a Gally a G
c, semic, semi--paramparamnstructed a mstructed a m
for the bulk pafor the bulk pmore flexible frexible
re flexible thare flexible thaestimation.estimation.
carrott and Hucarrott and Hung with the esng with the es
ns.ns.
distribution fdistribution
erere
13
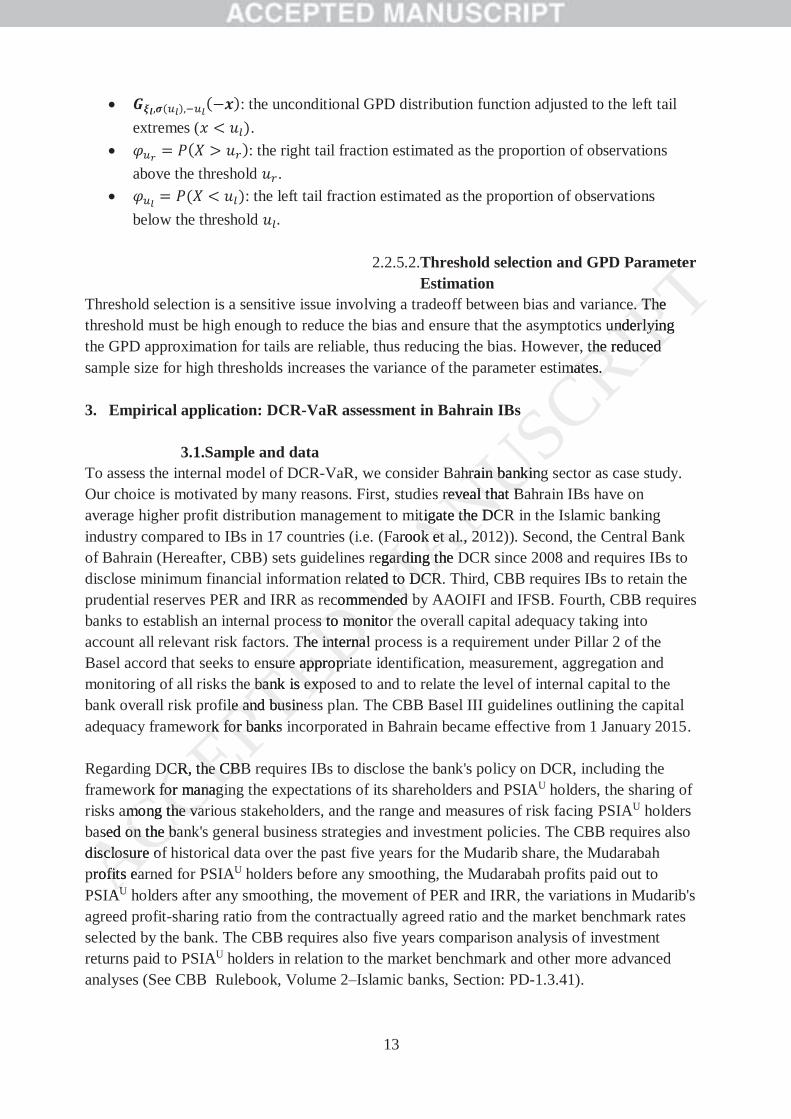
: the unconditional GPD distribution function adjusted to the left tail extremes ( .
: the right tail fraction estimated as the proportion of observations above the threshold .
: the left tail fraction estimated as the proportion of observations below the threshold
2.2.5.2.Threshold selection and GPD Parameter
Estimation Threshold selection is a sensitive issue involving a tradeoff between bias and variance. The threshold must be high enough to reduce the bias and ensure that the asymptotics underlying the GPD approximation for tails are reliable, thus reducing the bias. However, the reduced sample size for high thresholds increases the variance of the parameter estimates. 3. Empirical application: DCR-VaR assessment in Bahrain IBs
3.1.Sample and data
To assess the internal model of DCR-VaR, we consider Bahrain banking sector as case study. Our choice is motivated by many reasons. First, studies reveal that Bahrain IBs have on average higher profit distribution management to mitigate the DCR in the Islamic banking industry compared to IBs in 17 countries (i.e. (Farook et al., 2012)). Second, the Central Bank of Bahrain (Hereafter, CBB) sets guidelines regarding the DCR since 2008 and requires IBs to disclose minimum financial information related to DCR. Third, CBB requires IBs to retain the prudential reserves PER and IRR as recommended by AAOIFI and IFSB. Fourth, CBB requires banks to establish an internal process to monitor the overall capital adequacy taking into account all relevant risk factors. The internal process is a requirement under Pillar 2 of the Basel accord that seeks to ensure appropriate identification, measurement, aggregation and monitoring of all risks the bank is exposed to and to relate the level of internal capital to the bank overall risk profile and business plan. The CBB Basel III guidelines outlining the capital adequacy framework for banks incorporated in Bahrain became effective from 1 January 2015. Regarding DCR, the CBB requires IBs to disclose the bank's policy on DCR, including the framework for managing the expectations of its shareholders and PSIAU holders, the sharing of risks among the various stakeholders, and the range and measures of risk facing PSIAU holders based on the bank's general business strategies and investment policies. The CBB requires also disclosure of historical data over the past five years for the Mudarib share, the Mudarabah profits earned for PSIAU holders before any smoothing, the Mudarabah profits paid out to PSIAU holders after any smoothing, the movement of PER and IRR, the variations in Mudarib's agreed profit-sharing ratio from the contractually agreed ratio and the market benchmark rates selected by the bank. The CBB requires also five years comparison analysis of investment returns paid to PSIAU holders in relation to the market benchmark and other more advanced analyses (See CBB Rulebook, Volume 2–Islamic banks, Section: PD-1.3.41).
ACCEPTED MANUSCRIPT
eteete
e. Thee. Theunderlying underlyin
the reduced the reduced mates.mates.
ahrain bankingahrain bankirevealreveal that Bthat B
itigate the DCitigate thearook et al., 2arook et al., 2
regarding the Darding the elated to elated to DCRDCR
commended bended ssss to monitor to monitor
The internal The internansure approprisure appropri
e bank is expoe bank is expoile and businele and busine
ork for banks irk for banks i
DCR, the CBBDCR, the CBBrk for managirk for manag
among the varmong the vaased on the baon the b
disclosure ofsclosure oprofits eafits ea
AAUUA
14
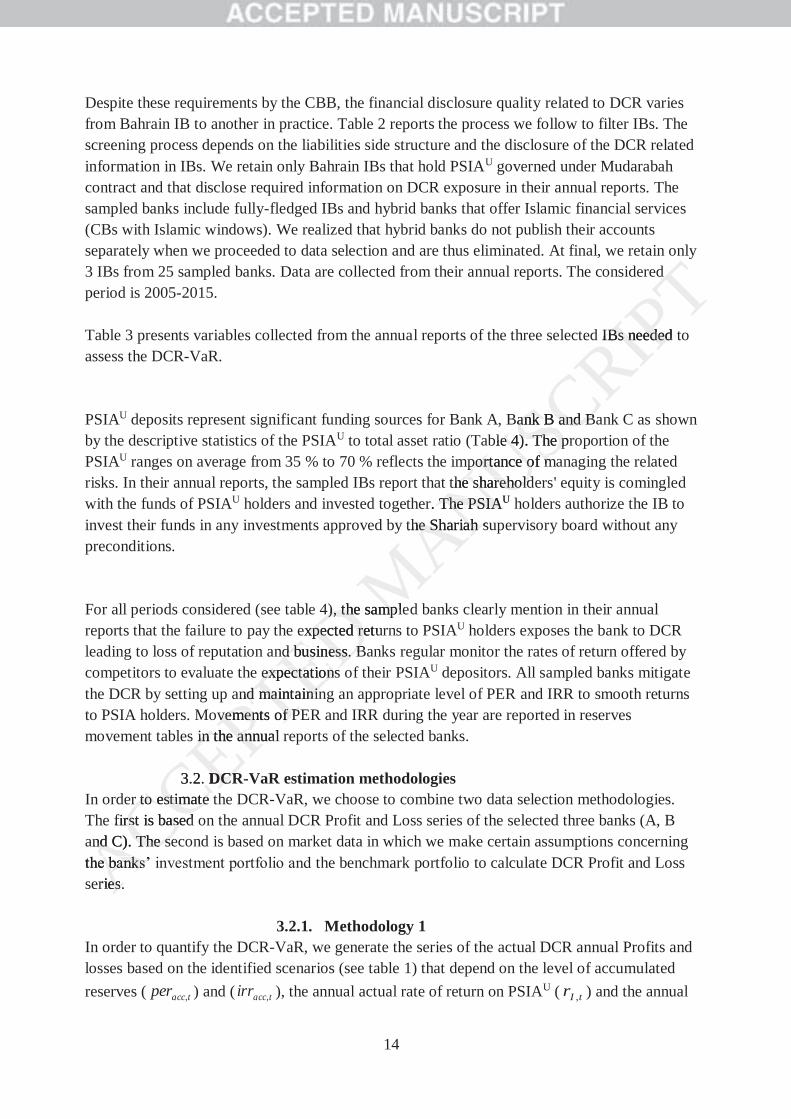
Despite these requirements by the CBB, the financial disclosure quality related to DCR varies from Bahrain IB to another in practice. Table 2 reports the process we follow to filter IBs. The screening process depends on the liabilities side structure and the disclosure of the DCR related information in IBs. We retain only Bahrain IBs that hold PSIAU governed under Mudarabah contract and that disclose required information on DCR exposure in their annual reports. The sampled banks include fully-fledged IBs and hybrid banks that offer Islamic financial services (CBs with Islamic windows). We realized that hybrid banks do not publish their accounts separately when we proceeded to data selection and are thus eliminated. At final, we retain only 3 IBs from 25 sampled banks. Data are collected from their annual reports. The considered period is 2005-2015. Table 3 presents variables collected from the annual reports of the three selected IBs needed to assess the DCR-VaR. PSIAU deposits represent significant funding sources for Bank A, Bank B and Bank C as shown by the descriptive statistics of the PSIAU to total asset ratio (Table 4). The proportion of the PSIAU ranges on average from 35 % to 70 % reflects the importance of managing the related risks. In their annual reports, the sampled IBs report that the shareholders' equity is comingled with the funds of PSIAU holders and invested together. The PSIAU holders authorize the IB to invest their funds in any investments approved by the Shariah supervisory board without any preconditions. For all periods considered (see table 4), the sampled banks clearly mention in their annual reports that the failure to pay the expected returns to PSIAU holders exposes the bank to DCR leading to loss of reputation and business. Banks regular monitor the rates of return offered by competitors to evaluate the expectations of their PSIAU depositors. All sampled banks mitigate the DCR by setting up and maintaining an appropriate level of PER and IRR to smooth returns to PSIA holders. Movements of PER and IRR during the year are reported in reserves movement tables in the annual reports of the selected banks.
3.2. DCR-VaR estimation methodologies In order to estimate the DCR-VaR, we choose to combine two data selection methodologies. The first is based on the annual DCR Profit and Loss series of the selected three banks (A, B and C). The second is based on market data in which we make certain assumptions concerning the banks’ investment portfolio and the benchmark portfolio to calculate DCR Profit and Loss series.
3.2.1. Methodology 1 In order to quantify the DCR-VaR, we generate the series of the actual DCR annual Profits and losses based on the identified scenarios (see table 1) that depend on the level of accumulated reserves ( taccper , ) and ( taccirr , ), the annual actual rate of return on PSIAU ( tIr , ) and the annual
ACCEPTED MANUSCRIPTd
d IBs needed tBs needed
Bank B and Bank B and Bble 4)le 4). The pr. The p
portanceportance of mof mthe shareholdhe sharehold
r. The PSIAThe PSIAU
the Shariah he Shariah su
4)), t, the samplehe samplexpected returxpected re
nd business. Bnd business. Bexpectations expectations
and maintaininnd maintaininvementsvemen ofof PP
in the annual in the annu
3.2. DCRDCRr to estimate tr to estimate
first is based rst is basand C). The send C). The sethe banks’ e banks’erieses
15
benchmark rate of return ( tBr , ). We compare tIr , to tBr , and the existing taccper , and taccirr , . If a
scenario of loss is identified and the exposure to DCR is positive, the DCR-Loss is calculated from the equations 12, 13, 14 or 15. Contrary, if no exposure to DCR is detected, the DCR- Profit is calculated from the equations 10 or 11. We generate also the series of the Maximum DCR annual Profits and Losses by calculating the difference between the annual theoretical rate of return on PSIAU ( tIr ,' ) and the annual benchmark rate of return ( tBr , ).
3.2.1.1. Summary statistics:
Descriptive statistics of the annual actual rate of return before smoothing ( Ir ), the annual
theoretical rate of return on PSIAU ( tIr ,' ), the annual benchmark rate of return ( Br ), the annual DCR Profit and Loss in % of PISAU (DCR P&L % PSIAU) and the Maximum annual DCR Profit and Loss in % of PISAU (Max DCR P&L % PSIAU) are presented respectively in tables 5 and 6. From table 5 we observe that Bank B depicts an actual rate of return sufficiently high in comparison with the benchmark value leading to a safe position according to the DCR. Bank A’s actual rate of return is close to the benchmark value on average but remains greater. Bank C's actual rate of return seems to be the most volatile rate in comparison with its peers. We see from table 6 that on average banks A and B are not exposed to the DCR, unlike bank C. As far as the actual rate of return on the PSIAU is positive, only the accumulated PER is involved in the smoothing process of the distributed profit to the PSIAU holders. In the case of bank C, these reserves seem insufficient to make the smoothed return reach the benchmark rate.
3.2.1.2. DCR-VaR and alpha estimation The average analysis of the bank DCR profile needs to be completed by an advanced analysis based on the extreme risk analysis. To assess extreme quantiles with samples of small size, which is the case for our annual report data; we need to fit a continuous distribution to the empirical distribution. Since the Shapiro Wilk test (SW.P-Value in table 6), do not reject the null hypothesis at significance level 1 %, we assume a normal distribution for our DCR P&L rate data. Table 7 presents the values of DCR-VaR and those based on IFSB and CBB requirements. Column 2 of table 7 gives the minimum capital required for DCR-IFSB in Bahrain calculated from the annual report of 2015. The required equity for DCR is calculated by the formula of 12,5%*50%*risk weighted assets financed by PSIAU(credit risk + market risk). Columns (3-8) of table 7 present the one year actual Parametric-DCR-VaR for each bank for different levels (5 %, 1 % and 0.5 %). The volume of equity needed for each level of risk is given by multiplying the actual DCR-VaR in % PSIAU by the volume of PSIAU in 2015. We see that for bank B the extreme exposure at a level of 5 % presents a profit on the DCR and not
ACCEPTED MANUSCRIPTal
), ), the annualthe anannual DCR annual DCR
espespectively in ctively in
e of return suf of return suposition accoposition acco
value on averaalue on alatile rate in coatile rate in c
are not exposenot exposes positive, onlpositive, onl
ed profit to theit to thmake the smake the momo
of the bank of the bank DDme risk analysme risk analys
se for our annse for our annstributionstribution. SinSin
othesis at signothesis at signata.ata
Table 7 presable 7 preColumn 2lumn
m tm
16
a loss. The extreme risk analysis via the actual DCR-VaR measure draws a comparative DCR profile: it seems that Bank B is farther from the DCR extreme exposure, unlike its counterpart Bank C. Furthermore, the comparative analysis of the required DCR-IFSB with the actual DCR-VaR shows that, for bank A, the values are close unlike for Bank C. This result reveals that the value of 50% (alpha) required by CBB in the capital adequacy ratio does not reflect the actual exposure of IBs to DCR since it doesn’t take into consideration the specificities of each IB's own practices in terms of smoothing practices. This result is confirmed by the comparison between the with . Columns (9-14) of table 7 give the one year parametric maximum DCR-VaR for each bank for different levels (5 %, 1 % and 0.5 %) that we need to estimate the for each bank. The
value of is given by the ratio (see columns 16-18). We calculated
for different level of risk. The comparative analysis of values of each bank with that of recommended by CBB, (column 15), reveals the great disparity between the required alpha coefficient by the CBB (50%) and the actual alpha coefficient that should be considered by IBs to calculate an adequate capital adequacy ratio. It is important to note that the capital adequacy ratio is highly sensitive to changes in the value of alpha coefficient . Employing a non-reasonably realistic value will not provide an adequately accurate measure of IBs capital adequacy. An inaccurate assessment might lead to IBs being significantly undercapitalized which therefore threatens financial stability. Conversely, carrying excess amounts of capital would negatively affect the economic efficiency of IBs and could impair their ability to compete. For these reasons, regulators should ensure that capital requirement should reflect as accurately as possible the actual DCR exposure of IBs. When we compare
with our results on , banks A and C seem to be undercapitalized while bank B seems to be highly capitalized in terms of minimum capital requirement to DCR.
3.2.2. Methodology 2 We consider a second methodology to assess the actual DCR-VaR based on market data because the historical data on returns offered on PSIAU are available only for few years. The majority of IBs publish annual information. Selected IBs don’t’ disclose sufficient monthly or quarterly financial information to better assess the DCR-VaR. Following classical financial theory, we assume that the IBs invest in a diversified portfolio A. The benchmark portfolio is also a diversified portfolio B. So we assume that sampled banks invest in the S&P Bahrain Shariah index as a proxy of a Shariah compliant portfolio, noted A. We define the S&P Bahrain index as a benchmark portfolio, noted B. Daily indexes prices are extracted from the DataStream database for the period 18/02/2010 to 31/12/2015. The studied series correspond to the indexes daily prices. The rates of returns, Ar~ , are the logarithmic daily rates of returns of S&P Bahrain Shariah index and represent proxies of the daily gross rates of return on portfolio investment before allocation between the shareholders and the PSIAU holders and calculation of the IB Mudarib share.
ACCEPTED MANUSCRIPTk for k for
ankank. TheThe
e calculate calcula ed
lueslues of each each beateat disparity bdisparity b
coefficientefficient thathat is important t is important
alue of alpha alue of alphan adequatelyan adequately
ad to IBs beingd to IBs beintability. Conveability. Con
nomic efficienomic efficiulators should lators should
ctual al DCRDCR exebankbankss A and A and
in terms of min terms of
3.2.2.3.2.2. MeMe
d methodologd methodological data on rical data
s publishs publish annuanninancial informnancial inform
ing classical fiing classical benchmark poenchmark p
nnvest in the S&vest in the SWe define te definextracteract
17
The actual returns on PSIAU, Ir~ , are calculated as the product of Ar~ and the distribution factor f
where: assetsfinancedlyjofromincomeGross
tIRf
int, (see equation 8)
We note that the profit distribution factor f is equal to 1 in case of negative rate of return on assets Ar~ (see equation 9).
From the Ir~ time series, we obtain the actual DCR Profit and Loss time series (Actual DCR
P&L) depending on level of Ir~ (in comparison with Br~ ) and the level of existing reserves peracc
and irracc, as explained in the development model. We consider equations (10) to (15) to calculate the actual DCR P&L for each scenario.
3.2.2.1.Summary statistics Although the asset rate of return is on average higher than the benchmark value, we see from table 9 that the actual rate of return before smoothing for our sampled banks is on average lower than the benchmark value. This is because we apply a factor <1 when rA is positive and equal to 1 when it is negative, causing the mean to move more to the negative side. Bank B actually has the highest actual return rate as its distribution factor is the highest (see table 8). Table 10 shows the descriptive statistics of the actual DCR P&L per bank. From an average analysis, the three sampled banks are exposed to the DCR. It also appears that from an average risk adjusted return, bank B is the least exposed to the DCR risk. These results agree with our first empirical methodology based on the annual financial report data. From table 10, we see that the skewness is positive for the different banks, which means that the histogram for daily DCR P&L is skewed right with a longer right tail and a concentration of the distribution mass on the left. The kurtosis is significantly greater than 3 for the three-series revealing a leptokurtic distribution with fat tails compared with the normal distribution. Jarques Bera statistics reject the null hypothesis and suggest that the distribution deviates strongly from normal. [Insert FIG 1] FIG 1 sets out the Q-Q plot for the DCR P&L rate for each bank. We observe that the empirical distribution tails draw significantly away from the line of the theoretical values of the normal distribution quantiles. This feature argues for the use of advanced risk measure methods which consider this stylized fact of our rate of returns series. In the following section, we propose the extreme value theory as one of the most accurate and important frameworks to the value at risk framework.
ACCEPTED MANUSCRIPTCR CR
ervesrves perp acc r((1515) to ) to
csshmark value, hmark value,
mpled banks mpled bank ifactor <1 whefactor <1 whe
more to the nemore to the nution factor istion factor
the actual DCRactual DCposed to the Dosed to the D
st exposed to st exposed tod on the annuaon the an
he skewness he skewness DCR P&L is sDCR P&L is s
on the left. Ton the left. Tkurtic distributkurtic dist
reject the nulreject the nul
ert FIG 1t FIG 1]
IGG 11 se
18
3.2.2.2. DCR-VaR estimation In order to estimate the actual DCR-VaR, we consider three methods: the historical non-parametric approach, the Gaussian VaR and the Extreme Value Theory EVT- VaR. We aim to compute the VaR based on these three methods for different horizons. This is motivated by the existence of different investment horizons or holding periods for the PSIAU which in general are longer than the one-day or 10-day horizons used in the banking regulatory contexts. Threshold selection and GPD Parameter Estimation: To obtain the optimal threshold, we combine two threshold selection approaches: a graphical approach via the mean excess function plot and an automated selection threshold approach based on the multiple ordered null hypothesis test (Brian et al., 2016). According to the mean excess function plot, the range of the plausible threshold starts when the sample mean excess function has a positive slope. In fact, the estimated mean excess function is an up linear function in u. The automated selection threshold approach is based on an ordered goodness of fit test which tests the fitting of the GPD for a window of ordered thresholds. The best is that which minimizes the distance (Anderson-Darling, Cramer Von-Mises test) between the empirical and the fitted GPD. This test is subjected to two stopping rules developed by G’Sell et al. (2015) capable of controlling the false discovery rate (FDR) or the expected proportion of incorrectly rejected null hypotheses among all rejections at the alpha test significance level. The results of the threshold selection process are presented in table 11. The Anderson-Darling test does not reject the adjustment of the GPD on the series tail. These results consolidate graphical adjustment of the GPD distribution on the series rate of return (See FIG 2). The shape parameters are positive for both tails. This means that the series exhibits a fat tail on both sides. The ratio ) is greater than 1, which means that the frequency of occurrence of daily substantial loss is less than extreme gain for the three banks. [Insert FIG 2] Assessment of the T-hold period Value-at-Risk: The issue with long term VaR consists in the fact that the desired forecast horizon deviates from the observation frequency of the data. Three methods exist to calculate long-term VaR. The first is based on measuring the value changes that occur during the entire holding period. This approach induces a significant reduction in the number of observations. Using a moving window may alter the series dynamic by creating an artificial linear dependence (Mittnik, 2011). The second approach, relevant only in an i.i.d Gaussian context, allows time scaling by means of the square-root-of-T rule (Danielsson and Zigrand, 2006). The third, which remains the most suitable for a non – Gaussian framework, is based on the Monte Carlo methods, especially the bootstrap techniques which use repeated random sampling procedures to estimate the sampling risk factor distribution over time (Murphy, 2012), from which we can estimate the VaR for different horizons. The bootstrap can be non-parametric based on random sampling with replacement from the empirical distribution. This type of bootstrap is used to assess the historical VaR for different horizons. The parametric bootstrap assumes a parametric family of
ACCEPTED MANUSCRIPTical cal
oach oacho th the mean e me
mean excess mean excesan up linearn up linear
ordered goodordered goodsholds. The bolds. The b
seses testtest) betw) betwping rules devping rules d
FDR) or the eFDR) or the eat the the alpha alpha tet
ented in table nted in tablthee series tail. series tail
n the series ran the series ra
r both tails. Thr both tails. T)
ily substantialily substantia
he Te T--TTT hold periold peh long term Vh long term V
bservation freservation frest is based on st is based on
s approach indpproachwindow may aindow may a2011)11). The. Themeans oans
19
distributions for the risk factor and uses the estimated parameters to simulate samples. The two kinds of bootstrap require the same iteration steps, the difference is that for the non-parametric bootstrap, the samples are not simulated by means of a random number generator, but generated directly from the observed historical data and do not require any statistical assumption beyond the stationarity of the historical series. We summarize below the bootstrap algorithm used to estimate the sampling distribution and assess the Value at Risk for T-hold period:
1. Generate a sample of the daily return of size T, the horizon of the hold period. The sampling generation can be based on a parametric or non-parametric bootstrap.
2. Compute for this random bootstrap sample based on the following compound return formula:
(23)
3. Repeat steps 1 and 2 K times until sufficient accuracy is obtained. Hence, we end up with bootstrap values ( , , …, ). We will use these sampling distribution values to assess the value at risk. Actual DCR-VaR estimation Table 12 presents the estimated 1 day, 1 month and 1 year VaR based on the historical simulation, bootstrap Gaussian and mixture GPD methods giving the potential extreme losses related to the portfolio of three banks (A, B and C) (expressed in % of PSIAU) for different levels (5 %, 1 % and 0.5 %). The table 13 presents the amount of equity needed to cover losses on PSIAU (by multiplying the DCR-VaR rate by the volume of PSIAU). We observe that the risk model is very important mainly for the 1 day horizon. In fact, making a gaussian assumption underestimates the extreme losses. This underestimation increases with the level of the VaR, which is logical as the normal distribution underestimates the moments of higher order. For a long-term VaR, the risk diminishes. This can be explained in part by the fact that the one-year VaR forecast based on daily returns implied a high horizon forecast that could significantly affect the forecast performance. The difference in the extreme DCR exposure between banks is increasingly pronounced with the prediction horizon. These results stemmed from the ability of bank B to generate the highest level of actual return rate on the year. To summarize this section, results on table 13 provide the DCR-VaR calculated based on daily data where we make assumptions on IBs investments. It illustrates a second methodology to estimate DCR-VaR in absence of sufficient specific bank data. We add to this approach a measure of the extreme risk under extreme event via the extreme value theory. Extreme event risk is present in all areas of risk management. One of the greatest challenges to the risk manager is to implement risk management models which allow for rare but damaging events, and permit the measurement of their consequences.
ACCEPTED MANUSCRIPTd. The d. The
rap.rap.ompound returmpound retu
btainedained. .
). We will us). We will us
h and 1 year Vand 1 year Ve GPD methoe GPD metho
A, B and C) (eand C) (eble 13 presentble 13 present
CRCR-VaR rate bVaR rat
model is veodel is very iry underestimateunderestimat
R, which is log, which is logr a longr a long-term term
year VaR foreyear VaR forently affect the y affect the
en banks is inen banks is inm the ability ohe abilit
To summasummta ww
20
We find different results from table 7 in terms of the needed equity to DCR. Multiple quantitative finance and mathematical methods exist for risk management purposes; the parametric-VaR and Extreme value theory-VaR are one of them. Different models under different assumptions give different results. Our results highlight the importance for regulators and risk managers in IBs to implement an adequate method to measure the needed equity to cover the DCR because the amount could have great impact in the capital adequacy ratio of the IB. 4. Conclusion
A necessary consequence of the market constraints to ensure the competitiveness of the Islamic banking system is a potential transfer of risk to IBs shareholders, a phenomenon known as the displaced commercial risk (DCR). The main objective of the research is to provide a measure of the DCR based on quantitative finance tool, the value-at-risk (VaR). The equity level to cover the DCR, we note the DCR-VaR, is obtained for a given probability level and a given time horizon. We choose the VaR since it represents a reference in the banking sector and widely used as a tool of risk measurement. To conduct our analysis, we first identified the scenarios of DCR exposure of an IB to assess the DCR profits and losses for IB shareholders. The identified scenarios include setting up situations that the IB identifies as the most adverse based on its investment portfolio characteristics. Second, we develop an internal model based on Value-at-Risk to compute the risk which has the advantage of being developed in a manner that is consistent with the activity characteristics and the organization set up in the IB. Added to the parametric VaR, we performed an advanced analysis based on the extreme risk analysis using the Extreme Value Theory (VaR–EVT). The comparative analysis of values of our DCR-VaR equity with that of required by CBB and IFSB reveals great differences in values. The results point the necessity to consider IBs specificities in managing the DCR to assess the risk exposure and the related coefficient of alpha in the capital adequacy ratio. Our methodology would be an alternative way to measure the needed capital charge to cover the DCR of the IFSB especially that its capital framework directive allows for an internal model approach. Our methodology has the advantages that, first it takes into consideration the IBs PSIAU returns smoothing policies in terms of reserves retention; second it employs a better measure of risk than the standard deviation suggested by the IFSB; and third it considers the extreme losses via the Extreme Value Theory-VaR approach. Our research findings suggest that in practice there is a significant absorption of risk by IBs shareholders even the risk profiles of sampled IBs diverge. Given that many IBs operate in very competitive dual banking environments, the ability to maximize risk-adjusted returns on investment and sustain stable and competitive returns to PSIAU holders is an important element in ensuring the competitiveness of the Islamic banking system in the whole financial system. Managing DCR is also important to avoid liquidity and withdrawal risk with its systemic characteristics. Our research would be an interesting addition to the literature and has potential to offer new perspective to the DCR issue. For future development, we highlight the importance of
ACCEPTED MANUSCRIPTIslamicslami
wn as thewn as the
ed on quantitaed on quantitaR, we note the we note the
on.on. We choosWe choosed as a tool osed as a tool o
scenarios scenarios of of DDs.. TheThe identifiidenti
dverse based odverse based oel based on Ved
in a mannerin a manner he IBe IB. AddedAdded
the extreme rthe extreme ranalysis of vasis of v
greagreat different differennaging the DCnaging the D
the capital adehe capital ade
uld be an alteruld be an alterSBB especially especially
h.h. Our methodOur methoeturns smeturns smoothoot
of risk thanof risk than ththme losses via me losses via
at in practice tpracticeprofiles of sarofiles of senvironmvironm
coco

21
optimizing the asset management to generate sufficient profit in order to outperform the benchmark portfolio and set aside sufficient reserves to cover extreme losses. We highlight also the importance of choice of the benchmark return because it mainly impacts the amount of equity needed to cover the DCR. As a work in progress on DCR, we recommend also replicating our research at larger sample and different jurisdictions to ensure the consistency of our findings and implications.
ACCEPTED MANUSCRIPT
22
References AAOIFI, 2015a. Shari ‘ah Standards - SS 13 on Mudharaba. AAOIFI, 2015b. Shari ‘ah Standards - SS 40 on Profit distribution in Mudarabah-based
Investments Accounts. AAOIFI, 2015c. Accounting Auditing and Governance Standards - FAS 27 on investment
accounts. Abedifar, P., Molyneux, P., Tarazi, A., 2013. Risk in islamic banking. Review of Finance 17,
2035–2096. Archer, S., Karim, R.A.A., 2009. Profit-sharing investment accounts in Islamic banks:
Regulatory problems and possible solutions. Journal of Banking Regulation 10, 300–306. Archer, S., Karim, R.A.A., 2006. On capital structure, risk sharing and capital adequacy in
Islamic banks. International Journal of Theoretical & Applied Finance 9, 269–280. Archer, S., Karim, R.A.A., Sundararajan, V., 2010. Supervisory, regulatory, and capital
adequacy implications of profit-sharing investment accounts in Islamic finance. Journal of Islamic Accounting and Business Research 1, 10–31.
Artzner, P., Delbaen, F., Eber, J., Heath, D., 1999. Coherent Measures of Risk. Mathematical Finance 9, 203–228.
Aysan, A.F., Disli, M., Duygun, M., Ozturk, H., 2016. Islamic Banks, Deposit Insurance Reform, and Market Discipline: Evidence from a Natural Framework. Journal of Financial Services Research 1–26.
Berger, A., Herring, R., Szegö, G., 1995. The role of capital in financial institutions. Journal of Banking and Finance 19, 393–430. doi:10.1016/0378-4266(95)00002-X
Brian, B., Yan, J., Zhang, X., 2016. Automated Threshold Selection for Extreme Value Analysis via Goodness-of-Fit Tests with Application to Batched Return Level Mapping.
Coles, S., 2001. An Introduction to Statistical Modeling of Extreme Values, Springer Series in Statistics.
Daher, H., Masih, M., Ibrahim, M., 2015. The unique risk exposures of Islamic banks’ capital buffers: A dynamic panel data analysis. Journal of International Financial Markets, Institutions and Money 36, 36–52.
Danielsson, J., Zigrand, J.-P., 2006. On time-scaling of risk and the square-root-of-time rule. Journal of Banking & Finance 30, 2701–2713.
El-Hawary, D., Grais, W., Iqbal, Z., 2007. Diversity in the regulation of Islamic Financial Institutions. Quarterly Review of Economics and Finance 46, 778–800.
Farook, S., Hassan, M.K., Clinch, G., 2012. Profit distribution management by Islamic banks: An empirical investigation. Quarterly Review of Economics and Finance 52, 333–347.
Fiennes, T., 2007. Supervisory Implications of Islamic banking: A supervisor’s perspective., in: Archer, S., Karim, R.A.A. (Eds.), Islamic Finance: The Regulatory Challenge.
G’Sell, M.G., Wager, S., Chouldechova, A., Tibshirani, R., 2015. Sequential selection procedures and false discovery rate control. Journal Of The Royal Statistical Society 2.
IFSB-15, 2013. Revised Capital Adequacy Standard for Institutions Offering [Excluding Islamic Insurance Institutions and Islamic Collective Investment Schemes].
IFSB-17, 2015. Core principles for islamic finance regulation. IFSB-2, 2005. Capital adequacy standard for institutions (other than insurance institutions)
offering only islamic financial services. IFSB-GN 4, 2011. Guidance note in connection with the IFSB capital adequacy standard: the
determination of alpha in the capital adequacy ratio for institutions (other than insurance institutions) offering only Islamic financial services.
Kammer, A., Norat, M., Piñón, M., Prasad, A., Towe, C., 2015. Islamic Finance : Opportunities , Challenges , and Policy Options. IMF Working Papers 1–38.
ACCEPTED MANUSCRIPT00––306.06.
uacy in uacy in 99––280.280.
nd capital nd capital c finance. Jouc finance. Jou
s of Risk. Mats of Risk. Ma
Banks, Deposianks, Depoal Frameworkal Framework
apital in financapital in financ/0378378--4266(94266(9
hreshold Seleeshold SeleApplApp ication toation to
al Modeling oModeling
015. The uniqu15. The uniqa analysis. Jouanalysis. Jou
3636–52.52. 2006. On tim2006. On tim
& Finance 30, 2& Finance 30, W., Iqbal, Z., 2., Iqbal, Z.,
arterly Reviewarterly Reviewn, M.K., Clincn, M.K.,
ical incal investigatvestigat2007. Superv2007. Superv
her, S., Karimher, S., Kariml, M.G.,, M.G., WageWage
procedures rocedureFSBFSB-15, 20135, 201
IslamiIslamFSBB-17
BB
23
Kaplanski, G., Levy, H., 2007. Basel’s value-at-risk capital requirement regulation: An efficiency analysis. Journal of Banking and Finance 31, 1887–1906.
Karim, R.A.A., 2001. International Accounting Harmonization, Banking Regulation, and Islamic Banks. The International Journal of Accounting 36, 169–193.
MacDonald, A.E., Scarrott, C.J., Lee, D.S., Darlow, B., Reale, M., Russell, G., 2011. A flexible extreme value mixture model. Computational Statistics & Data Analysis 55, 2137–2157.
Mejia, A.L., Aljabrin, S., Awad, R., Norat, M., Song, I., 2014. Regulation and supervision of Islamic banks, IMF Working Papers.
Mittnik, S., 2011. Solvency II Calibrations: Where Curiosity Meets Spuriosity. Working paper. Center for Quantitative Risk Analysis. University of Munich.
Mokni, R.B.S., Echchabi, A., Azouzi, D., Rachdi, H., 2014. Risk management tools practiced in Islamic banks: evidence in MENA region. Journal of Islamic Accounting and Business Research 5, 77–97.
Mollah, S., Hassan, K., Al Farroque, O., Mobarek, A., 2016. The Governance , Risk-taking , and Performance of Islamic Banks. Journal of Financial Services Research 0–29.
Murphy, K.P., 2012. Machine Learning: A Probabilistic Perspective.. The MIT Press. Rosman, R., 2009. Risk Management Practices and Risk Management Processes of Islamic
Banks : A Proposed Framework. International Review of Business Research Papers 5, 242–254.
Saita, F., 2007. Value at risk and bank capital management, Academic P. ed. Scarrott, C., Hu, Y., 2013. Extreme Value Mixture Modelling: evmix Package and Simulation
Study. Joint NZSA and ORSNZ Conference. Sundararajan, V., 2008. Issues in managing profit equalization reserves and investment risk
reserves in Islamic banks. Journal of Islamic Economics, Banking and Finance 1–12. Sundararajan, V., 2007. Risk measurement and disclosure in Islamic finance and the
implications of profit sharing investment accounts. Islamic Economics and Finance. Taktak, N., 2011. The nature of smoothing returns practices: the case of Islamic banks. Journal
of Islamic Accounting and Business Research 2, 142–152. Toumi, K., Louhichi, W., Viviani, J.-L., 2012. Alternative Financial Decision Principles:
Theoretical Foundations of Islamic Banks’ Capital Structure. Recent Developments in Alternative Finance:Empirical Assessments and Economic Implications 22, 157–172.
Toumi, K., Viviani, J.-L., 2013. Le risque lié aux comptes d’investissement participatifs : un risque propre aux banques islamiques. Revue des sciences de gestion 48, 131–142.
Toumi, K., Viviani, J.-L., Belkacem, L., 2011. Actual Risk Sharing Measurement in Islamic Banks, in: Sun, W., Louche, C., Pérez, R. (Eds.), Finance and Sustainability: Towards a New Paradigm? A Post-Crisis Agenda. Critical Studies on Corporate Responsibility, Governance and Sustainability. Emerald Group Publishing Ltd, pp. 325–347.
Yamai, Y., Yoshiba, T., 2005. Value-at-risk versus expected shortfall: A practical perspective. Journal of Banking and Finance 29, 997–1015.
Zoubi, T., Al-Khazali, O., 2007. Empirical testing of the loss provisions of banks in the GCC region. Managerial Finance 33, 500–511.
ACCEPTED M
ANUSCRIPTcticed ticed d Business Business
RiskRisk--taking ,taking rch 0rch 0––29.
e MIT Press.e MIT Press.Processes of rocesses of
ness Researchness Research
Academic P. edcademic P. eding: evmix Pang: evmix P
ualization resealization resEconomics, Bconomics,
disclosure in disclosure innt accounts. Isccounts.
g returns pracg returns pracess Research 2search
--L., 2012. AlL., 2012. AlIslamic BanksIslamic Ban
irical Assessmirical Assessm2013. Le risqu013. Le risqu
anques islamianques islami-L., BelkacemL., Belkace
n, W., Louchen, W., Louchedigm? A Postdigm? A Post
ance and Sustance and Sust., Yoshiba, T.Yoshiba, T.
urnal of Bankurnal of Banbi, T., AlT --KhaKharegion. Mgion. M
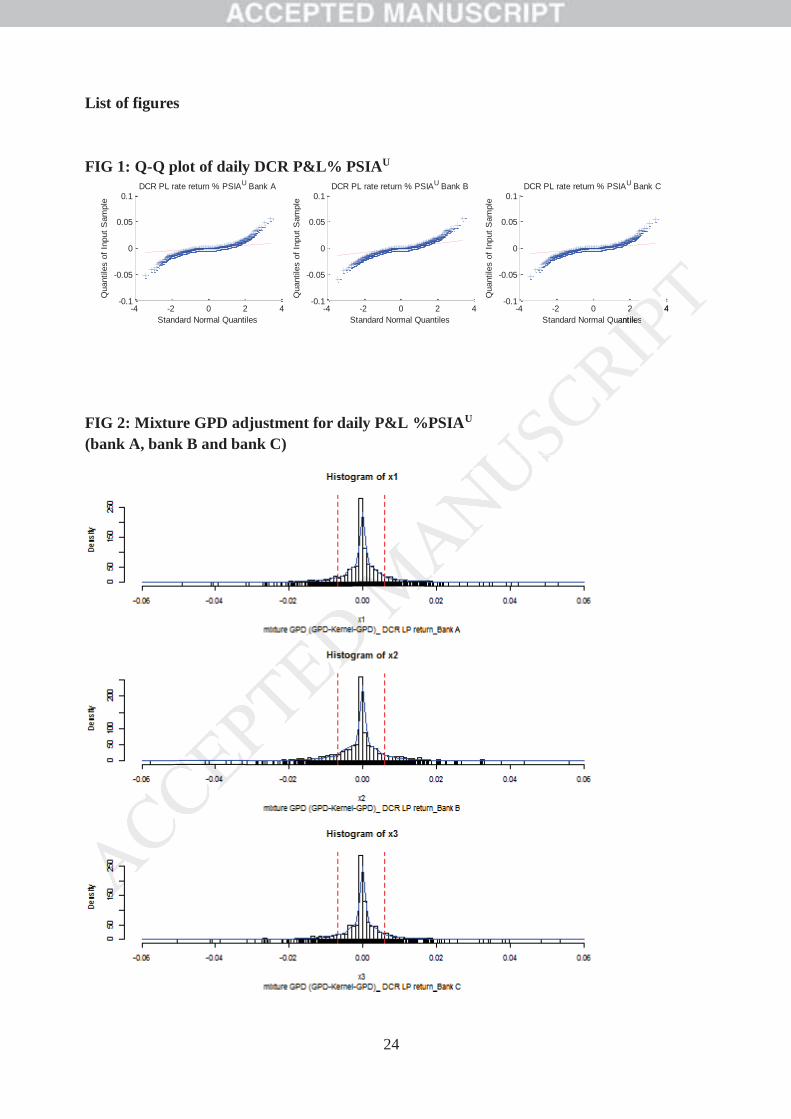
24
List of figures FIG 1: Q-Q plot of daily DCR P&L% PSIAU
FIG 2: Mixture GPD adjustment for daily P&L %PSIAU
(bank A, bank B and bank C)
-4 -2 0 2 4-0.1
-0.05
0
0.05
0.1
Standard Normal Quantiles
Qua
ntile
s of
Inpu
t Sam
ple
DCR PL rate return % PSIAU Bank A
-4 -2 0 2 4-0.1
-0.05
0
0.05
0.1
Standard Normal Quantiles
Qua
ntile
s of
Inpu
t Sam
ple
DCR PL rate return % PSIAU Bank B
-4 -2 0 2 4-0.1
-0.05
0
0.05
0.1
Standard Normal Quantiles
Qua
ntile
s of
Inpu
t Sam
ple
DCR PL rate return % PSIAU Bank C
ACCEPTED MANUSCRIPTPTPTPTPT22 PTPT4
uantilesuantiles
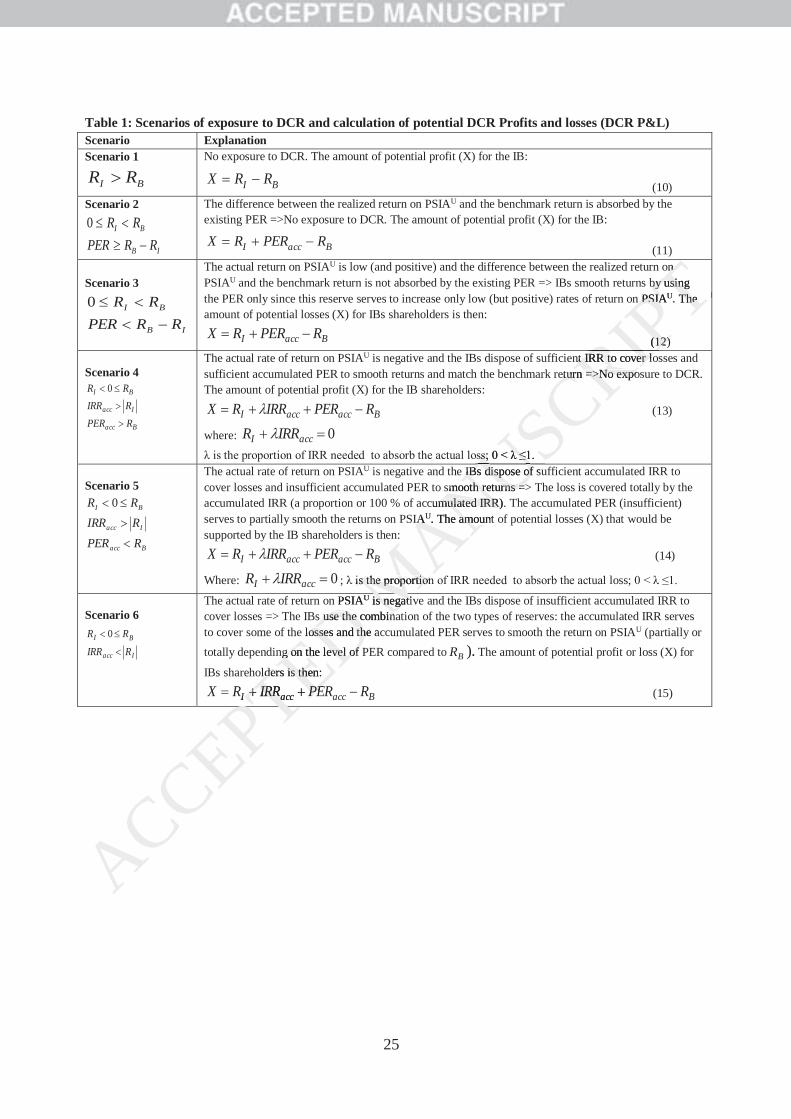
25
Table 1: Scenarios of exposure to DCR and calculation of potential DCR Profits and losses (DCR P&L) Scenario Explanation Scenario 1
BI RR
No exposure to DCR. The amount of potential profit (X) for the IB:
BI RRX (10) Scenario 2
IB
BI
RRPERRR0
The difference between the realized return on PSIAU and the benchmark return is absorbed by the existing PER =>No exposure to DCR. The amount of potential profit (X) for the IB:
BaccI RPERRX (11)
Scenario 3
IB
BI
RRPERRR0
The actual return on PSIAU is low (and positive) and the difference between the realized return on PSIAU and the benchmark return is not absorbed by the existing PER => IBs smooth returns by using the PER only since this reserve serves to increase only low (but positive) rates of return on PSIAU. The amount of potential losses (X) for IBs shareholders is then:
BaccI RPERRX (12)
Scenario 4
Bacc
Iacc
BI
RPERRIRR
RR 0
The actual rate of return on PSIAU is negative and the IBs dispose of sufficient IRR to cover losses and sufficient accumulated PER to smooth returns and match the benchmark return =>No exposure to DCR. The amount of potential profit (X) for the IB shareholders:
BaccaccI RPERIRRRX (13)
where: 0accI IRRR λ is the proportion of IRR needed to absorb the actual loss; 0 < λ ≤1.
Scenario 5
Bacc
Iacc
BI
RPERRIRRRR 0
The actual rate of return on PSIAU is negative and the IBs dispose of sufficient accumulated IRR to cover losses and insufficient accumulated PER to smooth returns => The loss is covered totally by the accumulated IRR (a proportion or 100 % of accumulated IRR). The accumulated PER (insufficient) serves to partially smooth the returns on PSIAU. The amount of potential losses (X) that would be supported by the IB shareholders is then:
BaccaccI RPERIRRRX (14)
Where: 0accI IRRR ; λ is the proportion of IRR needed to absorb the actual loss; 0 < λ ≤1.
Scenario 6
Iacc
BI
RIRR
RR 0
The actual rate of return on PSIAU is negative and the IBs dispose of insufficient accumulated IRR to cover losses => The IBs use the combination of the two types of reserves: the accumulated IRR serves to cover some of the losses and the accumulated PER serves to smooth the return on PSIAU (partially or totally depending on the level of PER compared to BR ). The amount of potential profit or loss (X) for
IBs shareholders is then:
BaccaccI RPERIRRRX (15)
ACCEPTED Mn PSIAU is negativs negatis use the combinause the combina
losses and the aclosses and thng on the level of g on the level of
lders ders is then:is th
accaI PEPEIRRIRR
MANUIBIBs dispose of sudispose ofsmooth returnsth returns =>=>
cumulated IRR). Tumulated IRR)USCRIPTnn
by using by usingn PSIAn PSIAU. TheThe
((1212))
Tnt IRR to cover lont IRR to cover lo
eturntur =>No expo=>No expo
ss; 0 < λ ≤1.ss; 0 < λ ≤1
RIP
IAAU. The amount amou
B
is the proportionis the proportion
U
M
PT
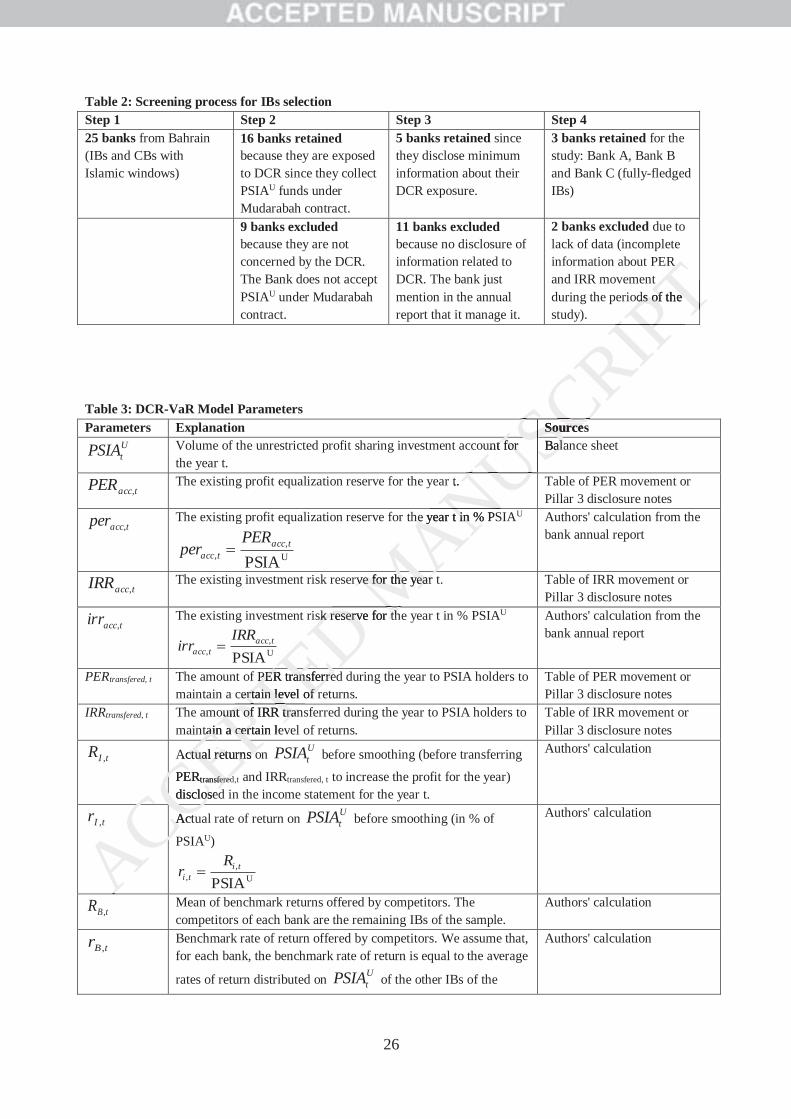
26
Table 2: Screening process for IBs selection Step 1 Step 2 Step 3 Step 4 25 banks from Bahrain (IBs and CBs with Islamic windows)
16 banks retained because they are exposed to DCR since they collect PSIAU funds under Mudarabah contract.
5 banks retained since they disclose minimum information about their DCR exposure.
3 banks retained for the study: Bank A, Bank B and Bank C (fully-fledged IBs)
9 banks excluded because they are not concerned by the DCR. The Bank does not accept PSIAU under Mudarabah contract.
11 banks excluded because no disclosure of information related to DCR. The bank just mention in the annual report that it manage it.
2 banks excluded due to lack of data (incomplete information about PER and IRR movement during the periods of the study).
Table 3: DCR-VaR Model Parameters Parameters Explanation Sources
UtPSIA Volume of the unrestricted profit sharing investment account for
the year t. Balance sheet
taccPER , The existing profit equalization reserve for the year t. Table of PER movement or Pillar 3 disclosure notes
taccper , The existing profit equalization reserve for the year t in % PSIAU
U,
, PSIAtacc
tacc
PERper
Authors' calculation from the bank annual report
taccIRR , The existing investment risk reserve for the year t. Table of IRR movement or Pillar 3 disclosure notes
taccirr , The existing investment risk reserve for the year t in % PSIAU
U,
, PSIAtacc
tacc
IRRirr
Authors' calculation from the bank annual report
PERtransfered, t The amount of PER transferred during the year to PSIA holders to maintain a certain level of returns.
Table of PER movement or Pillar 3 disclosure notes
IRRtransfered, t The amount of IRR transferred during the year to PSIA holders to maintain a certain level of returns.
Table of IRR movement or Pillar 3 disclosure notes
tIR , Actual returns on UtPSIA before smoothing (before transferring
PERtransfered,t and IRRtransfered, t to increase the profit for the year) disclosed in the income statement for the year t.
Authors' calculation
tIr , Actual rate of return on UtPSIA before smoothing (in % of
PSIAU)
U,
, PSIAti
ti
Rr
Authors' calculation
tBR , Mean of benchmark returns offered by competitors. The competitors of each bank are the remaining IBs of the sample.
Authors' calculation
tBr , Benchmark rate of return offered by competitors. We assume that, for each bank, the benchmark rate of return is equal to the average
rates of return distributed on UtPSIA of the other IBs of the
Authors' calculation
ACCEPActual returns oActual returns o
PER EPTED MANUSCRIPT
R R t
ods of the ds of the
IPTSourcesSourcesSSSC
USunt for t for Balanala
USUSUSUSt.
NUhe year t in % PShe year t in
ANrve for the year rve for the yearMA
sk reserve for thsk reserve for th
DM
PER transferredPER transferreertain level of rertain level of rTED
ount of IRR tranount of IRR trantain a certain levtain a certPT
transferedsferedRdisclosedosedEP
CCCCCCCCActuACCCCA
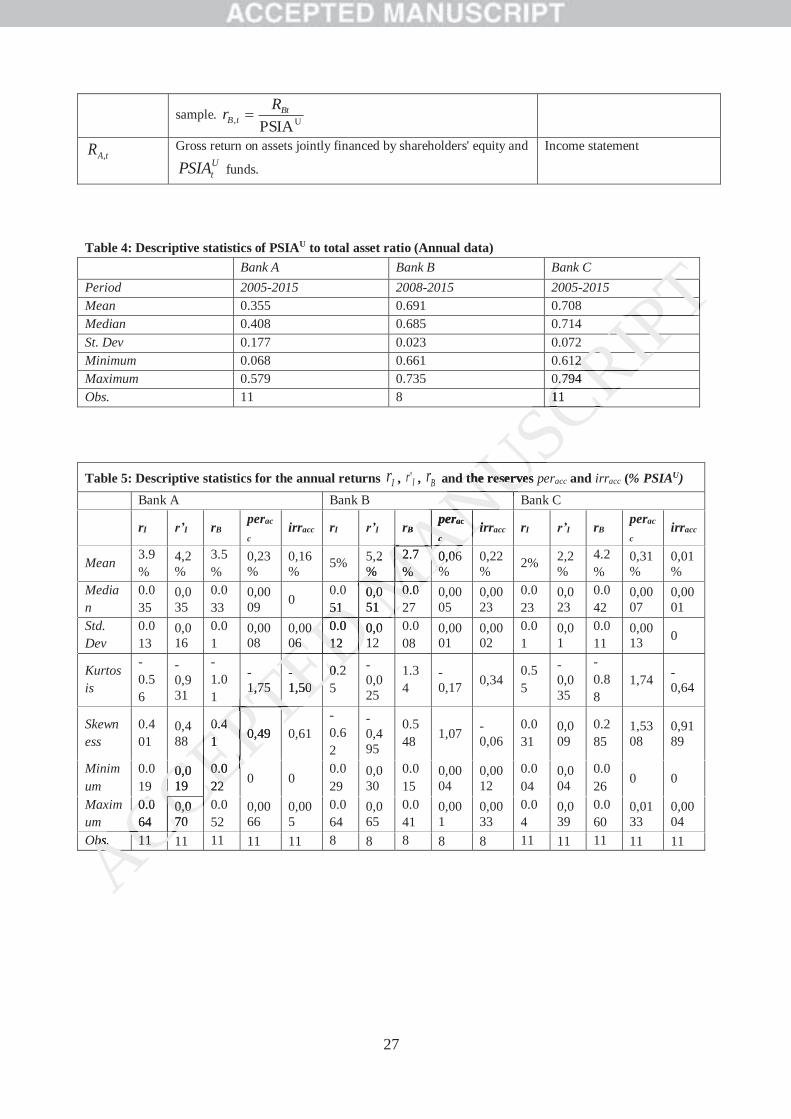
27
sample. U, PSIABt
tBRr
tAR , Gross return on assets jointly financed by shareholders' equity and UtPSIA funds.
Income statement
Table 4: Descriptive statistics of PSIAU to total asset ratio (Annual data) Bank A Bank B Bank C Period 2005-2015 2008-2015 2005-2015 Mean 0.355 0.691 0.708 Median 0.408 0.685 0.714 St. Dev 0.177 0.023 0.072 Minimum 0.068 0.661 0.612 Maximum 0.579 0.735 0.794 Obs. 11 8 11 Table 5: Descriptive statistics for the annual returns Ir , Ir ' , Br and the reserves peracc and irracc (% PSIAU) Bank A Bank B Bank C
rI r’I rB perac
c irracc rI r’I rB perac
c irracc rI r’I rB perac
c irracc
Mean 3.9%
4,2%
3.5%
0,23%
0,16% 5% 5,2
% 2.7%
0,06%
0,22% 2% 2,2
% 4.2%
0,31%
0,01%
Median
0.035
0,035
0.033
0,0009 0
0.051
0,051
0.027
0,0005
0,0023
0.023
0,023
0.042
0,0007
0,0001
Std. Dev
0.013
0,016
0.01
0,0008
0,0006
0.012
0,012
0.008
0,0001
0,0002
0.01
0,01
0.011
0,0013 0
Kurtosis
-0.56
-0,931
-1.01
-1,75
-1,50
0.25
-0,025
1.34
-0,17 0,34
0.55
-0,035
-0.88
1,74 -0,64
Skewness
0.401
0,488
0.41 0,49 0,61
-0.62
-0,495
0.548 1,07 -
0,06 0.031
0,009
0.285
1,5308
0,9189
Minimum
0.019
0,019
0.022 0 0
0.029
0,030
0.015
0,0004
0,0012
0.004
0,004
0.026 0 0
Maximum
0.064
0,070
0.052
0,0066
0,005
0.064
0,065
0.041
0,001
0,0033
0.04
0,039
0.060
0,0133
0,0004
Obs. 11 11 11 11 11 8 8 8 8 8 11 11 11 11 11 ACCEPTED M
ANUSCRIPTTTTPTTTPTIP22 RI0.7940.794
CR111 CRSCSCSCSC
d the reservesd the reservesUNUUUUBr peraccr
cciriAAANNN
MMAN2
%2.72%%
0,066%%MMMAMAMAMMMA
05151
0,00,051
0.00.02MMMMM
DDMM
0000606
0.01212
0,01DDDM
DM
DM
EDDM
1,751,75-1,5050
0.20.2EDEDEDPTEED
0.40 411 0,490PPPTTT
CEEPT9
0,00 019
0.00.222CECECEEE
CCCEE0.00 064
0,00,070CCCCCCCC
ACCCCObs.bs 1111
ACACACCCACACACACC
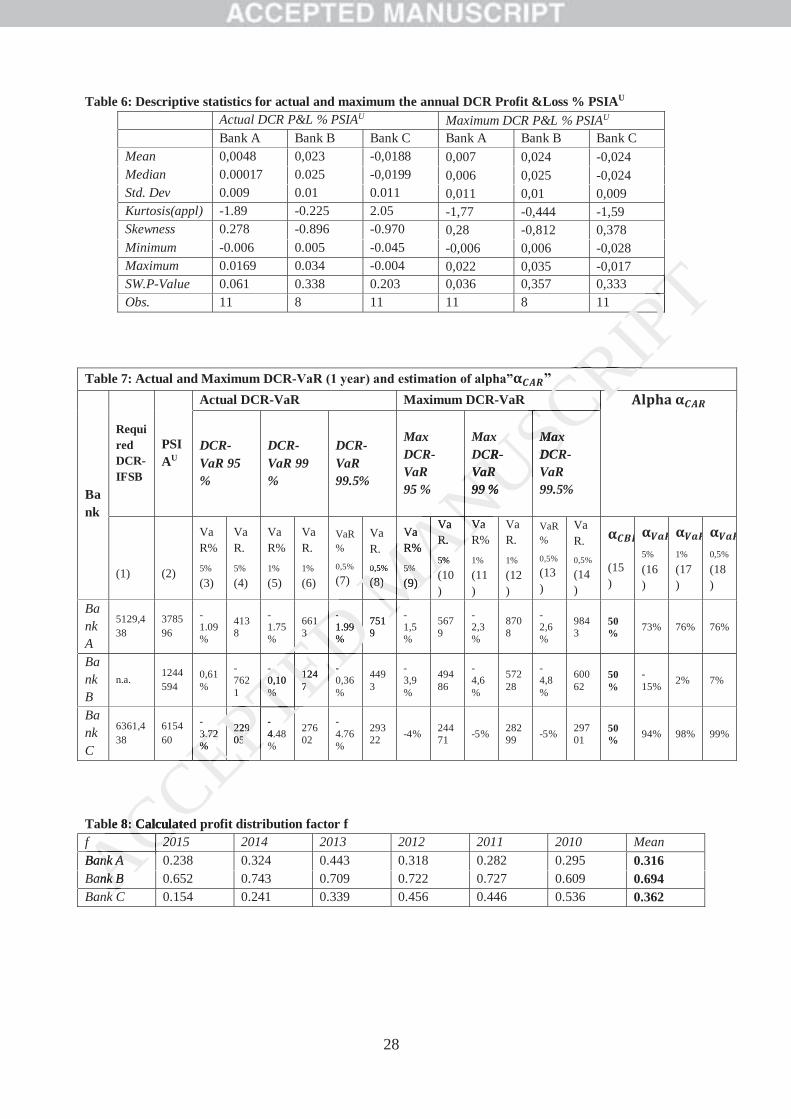
28
Table 6: Descriptive statistics for actual and maximum the annual DCR Profit &Loss % PSIAU Actual DCR P&L % PSIAU Maximum DCR P&L % PSIAU Bank A Bank B Bank C Bank A Bank B Bank C Mean 0,0048 0,023 -0,0188 0,007 0,024 -0,024 Median 0.00017 0.025 -0,0199 0,006 0,025 -0,024 Std. Dev 0.009 0.01 0.011 0,011 0,01 0,009 Kurtosis(appl) -1.89 -0.225 2.05 -1,77 -0,444 -1,59 Skewness 0.278 -0.896 -0.970 0,28 -0,812 0,378 Minimum -0.006 0.005 -0.045 -0,006 0,006 -0,028 Maximum 0.0169 0.034 -0.004 0,022 0,035 -0,017 SW.P-Value 0.061 0.338 0.203 0,036 0,357 0,333 Obs. 11 8 11 11 8 11
Table 7: Actual and Maximum DCR-VaR (1 year) and estimation of alpha” ”
Bank
Required DCR-IFSB
PSIAU
Actual DCR-VaR Maximum DCR-VaR
DCR-VaR 95 %
DCR-VaR 99 %
DCR-VaR 99.5%
Max DCR-VaR 95 %
Max DCR-VaR 99 %
Max DCR-VaR 99.5%
(1)
(2)
VaR% 5% (3)
VaR. 5% (4)
VaR% 1% (5)
VaR. 1% (6)
VaR%
0,5% (7)
VaR. 0,5% (8)
VaR% 5% (9)
VaR. 5% (10)
VaR% 1% (11)
VaR. 1% (12)
VaR%
0,5% (13)
VaR. 0,5% (14)
(15)
5% (16)
1% (17)
0,5% (18)
Bank A
5129,438
378596
-1.09 %
4138
-1.75 %
6613
-1.99 %
7519
-1,5%
5679
-2,3%
8708
-2,6%
9843
50% 73% 76% 76%
Bank B
n.a. 1244594
0,61%
-7621
-0,10%
1247
-0,36%
4493
-3,9%
49486
-4,6%
57228
-4,8%
60062
50%
-15% 2% 7%
Bank C
6361,438
615460
-3.72 %
22905
-4.48 %
27602
-4.76 %
29322 -4% 244
71 -5% 28299 -5% 297
01 50% 94% 98% 99%
Table 8: Calculated profit distribution factor f f 2015 2014 2013 2012 2011 2010 Mean Bank A 0.238 0.324 0.443 0.318 0.282 0.295 0.316 Bank B 0.652 0.743 0.709 0.722 0.727 0.609 0.694 Bank C 0.154 0.241 0.339 0.456 0.446 0.536 0.362
Ak CkABank Bk BACCEPTED MANUSCRIPTTTTPTPTPTPTPTPT
RCRCRCRCRDCRC -VaRVaR99 %99
Max MaxDCRDCRVSSSC
ANUS0,5%
(8)(8)
VaR%5%5%
(9)(9)
VaRR.5%%
(
VaVaRRAAANANAN
MMMAAN11
33
--1.99 9%D M751
9MMMMM
EEDDMM
-0,100 1%%
124177
-EEEDEDEDPTTEED
3.72 3.72 %%
2292290505
-4.4PTPTPTTT
CECECECEEPEEPTTle 88: Calculated: Calcula
f 2020
ACCCCBank Ank AACCCCAA
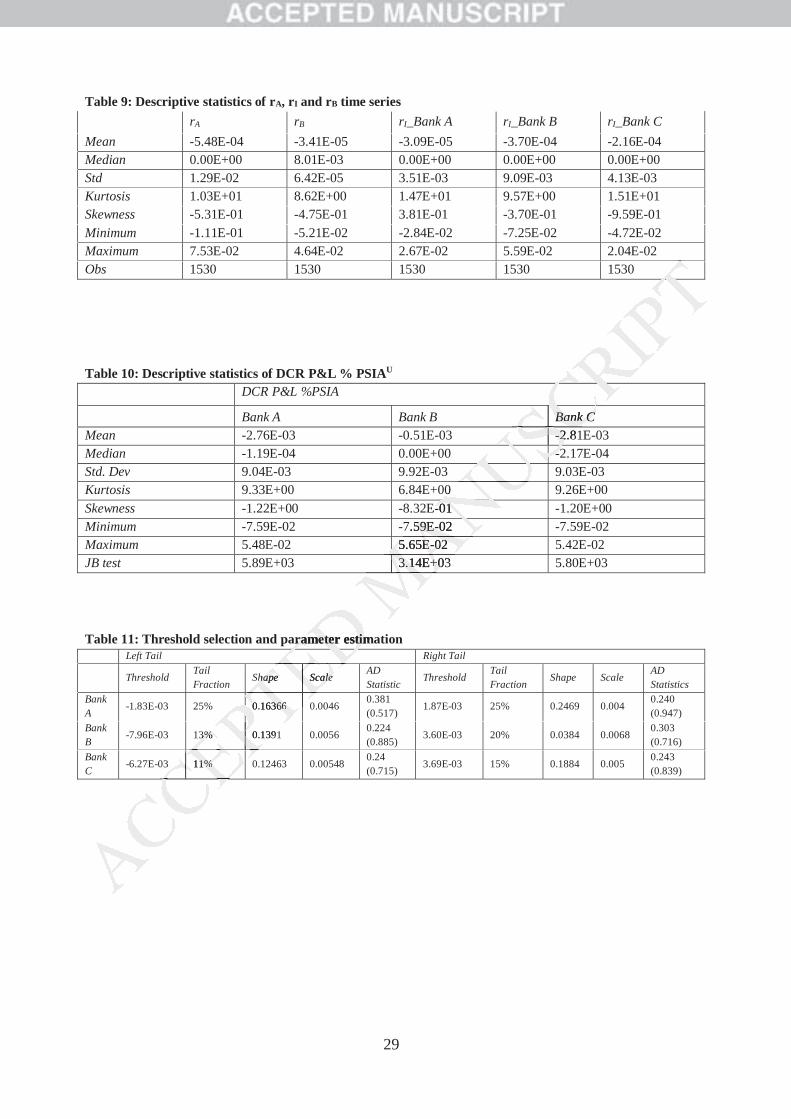
29
Table 9: Descriptive statistics of rA, rI and rB time series rA rB rI_Bank A rI_Bank B rI_Bank C Mean -5.48E-04 -3.41E-05 -3.09E-05 -3.70E-04 -2.16E-04 Median 0.00E+00 8.01E-03 0.00E+00 0.00E+00 0.00E+00 Std 1.29E-02 6.42E-05 3.51E-03 9.09E-03 4.13E-03 Kurtosis 1.03E+01 8.62E+00 1.47E+01 9.57E+00 1.51E+01 Skewness -5.31E-01 -4.75E-01 3.81E-01 -3.70E-01 -9.59E-01 Minimum -1.11E-01 -5.21E-02 -2.84E-02 -7.25E-02 -4.72E-02 Maximum 7.53E-02 4.64E-02 2.67E-02 5.59E-02 2.04E-02 Obs 1530 1530 1530 1530 1530
Table 10: Descriptive statistics of DCR P&L % PSIAU
DCR P&L %PSIA Bank A Bank B Bank C Mean -2.76E-03 -0.51E-03 -2.81E-03 Median -1.19E-04 0.00E+00 -2.17E-04 Std. Dev 9.04E-03 9.92E-03 9.03E-03 Kurtosis 9.33E+00 6.84E+00 9.26E+00 Skewness -1.22E+00 -8.32E-01 -1.20E+00 Minimum -7.59E-02 -7.59E-02 -7.59E-02 Maximum 5.48E-02 5.65E-02 5.42E-02 JB test 5.89E+03 3.14E+03 5.80E+03 Table 11: Threshold selection and parameter estimation Left Tail Right Tail
Threshold Tail Fraction
Shape Scale AD Statistic
Threshold Tail Fraction
Shape Scale AD Statistics
Bank A
-1.83E-03 25% 0.16366 0.0046 0.381 (0.517)
1.87E-03 25% 0.2469 0.004 0.240 (0.947)
Bank B
-7.96E-03 13% 0.1391 0.0056 0.224 (0.885)
3.60E-03 20% 0.0384 0.0068 0.303 (0.716)
Bank C
-6.27E-03 11% 0.12463 0.00548 0.24 (0.715)
3.69E-03 15% 0.1884 0.005 0.243 (0.839)
TTCR
Bank CBank CSCSCSCSC--2.812SCSCSCSC22USSSSU0 NU
E-0101 NU7.59E59E-020AN
5.65E5.65E-0202ANM
3.14E+033.14E+0
MMMAMMMMAarameter estimaarameter estim
EDShapeShape ScaleScaleEEEDTE
0.163660.16366TETETEPTTE
3%3% 0.1391PTPTPTEPT
11%1%EPEPEPCECECECEEP
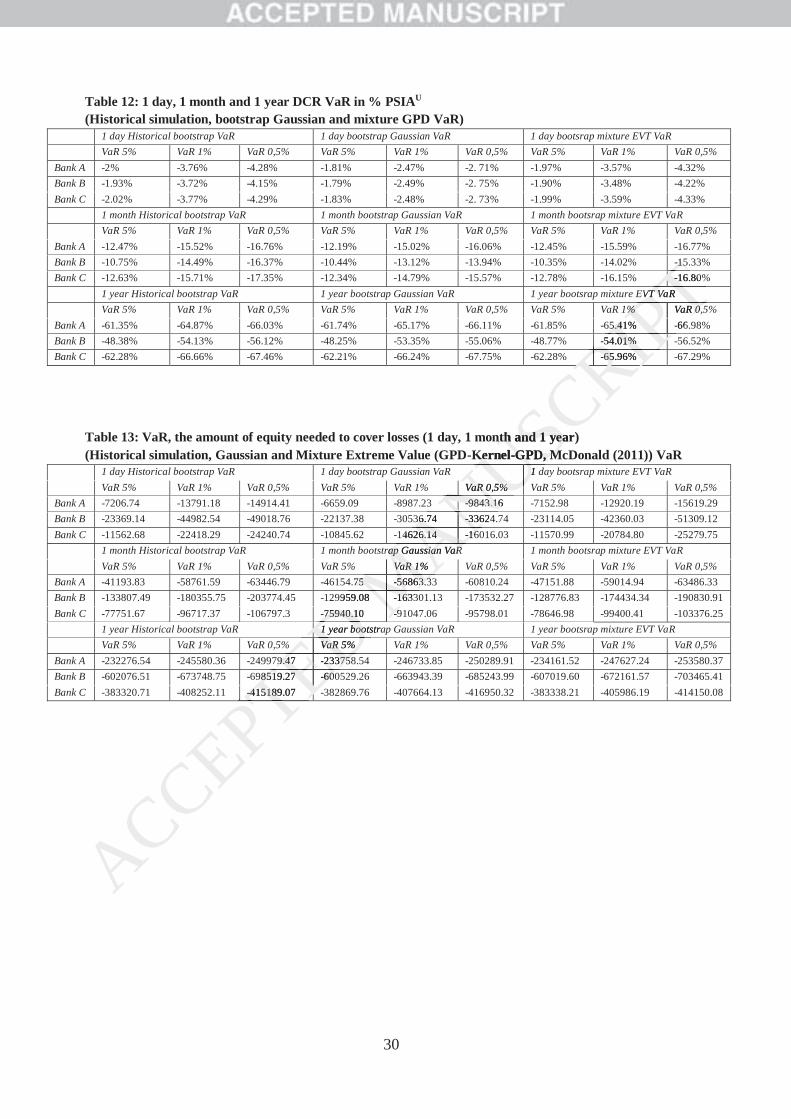
30
Table 12: 1 day, 1 month and 1 year DCR VaR in % PSIAU
(Historical simulation, bootstrap Gaussian and mixture GPD VaR) 1 day Historical bootstrap VaR 1 day bootstrap Gaussian VaR 1 day bootsrap mixture EVT VaR VaR 5% VaR 1% VaR 0,5% VaR 5% VaR 1% VaR 0,5% VaR 5% VaR 1% VaR 0,5% Bank A -2% -3.76% -4.28% -1.81% -2.47% -2. 71% -1.97% -3.57% -4.32% Bank B -1.93% -3.72% -4.15% -1.79% -2.49% -2. 75% -1.90% -3.48% -4.22% Bank C -2.02% -3.77% -4.29% -1.83% -2.48% -2. 73% -1.99% -3.59% -4.33% 1 month Historical bootstrap VaR 1 month bootstrap Gaussian VaR 1 month bootsrap mixture EVT VaR VaR 5% VaR 1% VaR 0,5% VaR 5% VaR 1% VaR 0,5% VaR 5% VaR 1% VaR 0,5% Bank A -12.47% -15.52% -16.76% -12.19% -15.02% -16.06% -12.45% -15.59% -16.77% Bank B -10.75% -14.49% -16.37% -10.44% -13.12% -13.94% -10.35% -14.02% -15.33% Bank C -12.63% -15.71% -17.35% -12.34% -14.79% -15.57% -12.78% -16.15% -16.80% 1 year Historical bootstrap VaR 1 year bootstrap Gaussian VaR 1 year bootsrap mixture EVT VaR VaR 5% VaR 1% VaR 0,5% VaR 5% VaR 1% VaR 0,5% VaR 5% VaR 1% VaR 0,5% Bank A -61.35% -64.87% -66.03% -61.74% -65.17% -66.11% -61.85% -65.41% -66.98% Bank B -48.38% -54.13% -56.12% -48.25% -53.35% -55.06% -48.77% -54.01% -56.52% Bank C -62.28% -66.66% -67.46% -62.21% -66.24% -67.75% -62.28% -65.96% -67.29%
Table 13: VaR, the amount of equity needed to cover losses (1 day, 1 month and 1 year) (Historical simulation, Gaussian and Mixture Extreme Value (GPD-Kernel-GPD, McDonald (2011)) VaR
1 day Historical bootstrap VaR 1 day bootstrap Gaussian VaR 1 day bootsrap mixture EVT VaR VaR 5% VaR 1% VaR 0,5% VaR 5% VaR 1% VaR 0,5% VaR 5% VaR 1% VaR 0,5% Bank A -7206.74 -13791.18 -14914.41 -6659.09 -8987.23 -9843.16 -7152.98 -12920.19 -15619.29 Bank B -23369.14 -44982.54 -49018.76 -22137.38 -30536.74 -33624.74 -23114.05 -42360.03 -51309.12 Bank C -11562.68 -22418.29 -24240.74 -10845.62 -14626.14 -16016.03 -11570.99 -20784.80 -25279.75 1 month Historical bootstrap VaR 1 month bootstrap Gaussian VaR 1 month bootsrap mixture EVT VaR VaR 5% VaR 1% VaR 0,5% VaR 5% VaR 1% VaR 0,5% VaR 5% VaR 1% VaR 0,5% Bank A -41193.83 -58761.59 -63446.79 -46154.75 -56863.33 -60810.24 -47151.88 -59014.94 -63486.33 Bank B -133807.49 -180355.75 -203774.45 -129959.08 -163301.13 -173532.27 -128776.83 -174434.34 -190830.91 Bank C -77751.67 -96717.37 -106797.3 -75940.10 -91047.06 -95798.01 -78646.98 -99400.41 -103376.25 1 year Historical bootstrap VaR 1 year bootstrap Gaussian VaR 1 year bootsrap mixture EVT VaR VaR 5% VaR 1% VaR 0,5% VaR 5% VaR 1% VaR 0,5% VaR 5% VaR 1% VaR 0,5% Bank A -232276.54 -245580.36 -249979.47 -233758.54 -246733.85 -250289.91 -234161.52 -247627.24 -253580.37 Bank B -602076.51 -673748.75 -698519.27 -600529.26 -663943.39 -685243.99 -607019.60 -672161.57 -703465.41 Bank C -383320.71 -408252.11 -415189.07 -382869.76 -407664.13 -416950.32 -383338.21 -405986.19 -414150.08
ACCEPTED MANUSCRIPT
--1515--16.80TTEVT VaRVT V TTT%% VaR 0,5 0,PTPTPTPT5.41%5.4 -66PTPTPTPT
-54.01%01%IPPPRP
--65.96%65.96%RRRIPRRRRInth and 1 year)nth and 1 yea
KernelKer -GPD, MGPD, M1 1 dUUUUVaR 0,5%aR 0,5%
NUUUNU--9843.169843.16NNNUAN36.7436 --336243
ANANANAN4626.146.14 -1616ANANANANtrap Gaussian VaRap Gaussian VaR
MAAAVaR 1%VaR 1
MMMAM7575 -56863.356863.3MMMM9959.08 -1633163MMMM75940.1075940.1 -99
DMMMM
1 year bootstra1 year booDEDVaR 5%VaR
EDEDEDED79.4779.47 -23375823375EDEDEDED98519.278519.27 -60060
TEEEE--415189.0741518TEEEPPPPTE