Embed Size (px)
Citation preview

1
MEASUREMENT OF THE BULK ACOUSTIC PROPERTIES
OF FIBROUS MATERIALS AT HIGH TEMPERATURES
Paul Williams
School of Engineering and Design,
Mechanical Engineering,
Brunel University,
Uxbridge, Middlesex, UB8 3PH, UK.
Ray Kirby*
School of Engineering and Design,
Mechanical Engineering,
Brunel University,
Uxbridge, Middlesex, UB8 3PH, UK.
Colin Malecki
AAF Ltd.,
Bassington Lane,
Cramlington, NE23 8AF
Northumberland, UK
James Hill
AAF Ltd.,
Bassington Lane,
Cramlington, NE23 8AF
Northumberland, UK
* Corresponding author.

2
ABSTRACT
It is common for fibrous porous materials to be used in high temperature applications such as
automotive and gas turbine exhaust silencers. Understanding the effect of temperature on the
acoustic properties of these materials is crucial when attempting to predict silencer
performance. This requires knowledge of the bulk acoustic properties of the porous materials
and so this article aims to quantify the effect of temperature on the bulk acoustic properties of
three fibrous materials: rock wool, basalt wool and an E-glass fibre. Measurements are
undertaken here using a standard impedance tube that has been modified to accommodate
temperatures of up to 500 °C. It is shown that measured data for the bulk acoustic properties
may be collapsed using a standard Delany and Bazley curve fitting methodology provided
one modifies the properties of the material flow resistivity and air to account for a change in
temperature. Moreover, by using a previously proposed power law describing the
dependence of the flow resistivity with temperature, one may successfully collapse data
measured at every temperature and obtain the Delany and Bazley coefficients in the usual
way. Accordingly, to predict the bulk acoustic properties of a fibrous material at elevated
temperatures it is necessary only to measure these properties at room temperature, and then to
apply the appropriate temperature corrections to the properties of the material flow resistivity
and air when using the Delany and Bazley formulae.
3
1. INTRODUCTION
The bulk acoustic properties of porous materials play a crucial role in determining how sound
propagates within a material. A knowledge of how sound propagates within a material is
essential in the study of those applications in which the material is considered to be bulk
reacting. Relevant applications include the study of dissipative silencers where it is widely
accepted that one must account for the propagation of sound within the material in order to
obtain satisfactory estimations of silencer performance. Examples of this approach include
automotive exhaust silencers [1-3], and those silencers found in ventilation and gas turbine
systems [4, 5]. In these applications fibrous materials are normally used and here it is
common for the material to be sourced in large quantities, a portion of which is then packed
into the silencer carcass. This results in many silencer applications containing relatively large
quantities of fibrous materials in which the fibres are randomly aligned, and with a significant
range in fibre diameters being common. Therefore, for this type of application the
identification of the bulk acoustic properties is challenging and one must rely on averaging
the acoustic behaviour over a number of material samples in order to deliver a reliable guide
to overall material behaviour. This makes it very difficult to realise a theoretically based
approach to identifying the bulk acoustic properties, and here it is common for a number of
empirical constants to be necessary in order to obtain good agreement between prediction and
measurement [6-8]. Furthermore, even a semi-empirical model developed using empirical
constants is unlikely to reproduce accurately experimental measurements taken over a wide
range of different material bulk densities and excitation frequencies. Therefore, for
dissipative silencers packed with fibrous materials it is usual practice to rely on experimental
measurements when identifying the bulk acoustic properties [1-5].

4
The bulk acoustic properties of fibrous materials are normally written in the form of the
propagation constant and characteristic impedance; these properties may be obtained
following measurements of surface impedance taken in an impedance tube. In order to
accommodate the random nature of a bulk fibrous material it is common practice to measure
many samples of a material - generally covering different bulk densities - and to obtain an
overall average behaviour through curve fitting. This can be achieved by plotting these
measurements using non-dimensional parameters and this was first demonstrated by Delany
and Bazley [9], who aggregated measurements taken for a number of different fibrous
materials and showed that data for the real and imaginary parts of the bulk acoustic properties
may be collapsed onto graphs using a non-dimensional parameter based on the flow
resistivity of the fibrous materials. A power law regression analysis then delivers eight
coefficients for the bulk acoustic properties, which are normally referred to as the Delany and
Bazley coefficients. The method of Delany and Bazley is widely used and forms the basis for
the majority of empirical models that quantify sound propagation within bulk fibrous
materials. Furthermore, this approach to specifying the bulk acoustic properties of a porous
material is almost exclusively used in theoretical models for dissipative silencers [1-5].
However, the data reported by Delany and Bazley, and the vast majority of the studies that
have followed, are limited to the measurement of the bulk acoustic properties at room
temperature. This presents a problem when attempting to predict dissipative silencer
performance at elevated temperatures, because there is little data available to indicate how
higher temperatures will affect the acoustic performance of these materials. This is
particularly problematic for high temperature silencer applications, such as automotive and
gas turbine exhaust silencers, and here it is noticeable that studies have yet to appear in the
literature that attempt to predict silencer performance at higher temperatures. A likely reason

5
for this is the absence of comprehensive and reliable data for the bulk acoustic properties of
fibrous materials at higher temperatures. Accordingly, this article seeks to address this by
reporting impedance tube measurements of the bulk acoustic properties of fibrous materials at
elevated temperatures.
Numerous studies are available that report the measurement of the bulk acoustic properties of
fibrous materials at room temperature, as well as their use in the design of dissipative
silencers [1-5]. It has also long been known that one must correct for errors in the Delany
and Bazley coefficients if one is attempting to extrapolate data to low frequencies [10, 11].
The bulk acoustic properties are normally obtained from surface impedance measurements
carried out according to the European Standard EN ISO 10534-2:2001 [12]. This standard
specifies details of the impedance tube and the transfer function measurements required to
find the surface impedance of the porous sample. The bulk acoustic properties are then found
from two separate impedance measurements, which may be achieved by using, for example,
two different air gaps behind the sample, or two different thicknesses [13]. It is this post
processing of the surface impedance measurements that delivers the bulk acoustic properties
of the material, which are very different to surface impedance, or absorption coefficient, often
quoted in the literature for porous materials [14]. Following the measurement of the flow
resistivity of the porous material [15] one may then obtain the Delany and Bazley coefficients
[9]. The influence of temperature on the bulk acoustic properties coefficients has, however,
yet to be explored in detail. This is, perhaps, not surprising given the challenge of
undertaking impedance tube measurements at high temperatures. However, Sun et al. [14]
recently introduced an experimental apparatus in which it was demonstrated that the surface
impedance measurements can be obtained reliably at higher temperatures. This approach is
also well suited to obtaining experimental measurements of the bulk acoustic properties, and

6
so the apparatus described by Sun et al. will form the basis of the experimental investigation
that follows.
There are very few studies in the literature that attempt to quantify the influence of elevated
temperatures on the acoustic properties of fibrous materials and, to the best of the authors’
knowledge, no studies that measure the bulk acoustic properties at high temperatures using an
ISO 10534-2 standard test rig [12]. The first study on the effect of high temperatures was
carried out by Christie [16], who measured the Delany and Bazley coefficients for mineral
wool at 19°C, 255°C and 490°C. Christie used a closed cavity experimental apparatus in
order to raise the temperature of the fibrous material, and here it is not entirely clear how
accurate this experimental apparatus is likely to be, and it does not, of course, comply with
later ISO standards. Christie also measured the flow resistivity of the material over a range
of temperatures up to and including 700°C, and here Christie found an increase in the flow
resistivity of the material proportional to the 0.6th power of the (absolute) temperature for
temperatures up to about 400°C. Above this temperature the rate of increase begins to slow
down and this power law no longer fits Christie’s experimental data. Christie then compared
values for the bulk acoustic properties measured at high temperatures with those predicted
using Delany and Bazley’s coefficients, after first modifying the flow resistivity to account
for the higher temperatures. Christie demonstrated reasonably good agreement between the
two results and concluded that the power law relationship for the flow resistivity was
successful, at least over the temperature range of the acoustic measurements. However,
Christie only measured data at two elevated temperatures and reports little data with which to
substantiate the final conclusions; agreement between data measured at high temperatures
and that predicted using the Delany and Bazley coefficients is also limited at certain
frequencies. Therefore, one cannot be certain that the discrepancies evident in Christie’s

7
results are not caused by a departure of the material properties from those measured by
Delany and Bazley, or by experimental error. Here, a question mark also remains over the
accuracy of the experimental methodology for the acoustic measurements, especially as the
design of the apparatus departs significantly from current practice [12]. Furthermore,
Christie does not measure a sufficient amount of data in order to obtain a representative
average behaviour for the material. Thus, the measurements provided by Christie are too
limited to provide confidence in the method used to extrapolate the data of Delany and
Bazley to higher temperatures. Nevertheless, Christie’s findings are interesting, especially as
there is a clear and obvious advantage to using the power law relationship proposed for the
material flow resistivity, as this would permit the Delany and Bazley coefficients measured at
room temperature to be used at higher temperatures without actually measuring the acoustic
properties at higher temperatures.
The power law profile for flow resistivity proposed by Christie [16] was later investigated by
Giese et al. [17], who used a microstructure model to investigate the influence of temperature
on the acoustic properties of a fibrous material. Giese et al. predict modifications to the
material flow resistivity that are similar to those proposed by Christie, although no
experimental data was obtained to support these conclusions. Recently, high temperature
measurements were also undertaken by Sun et al. [14], who used an ISO standard impedance
tube to obtain measurements of surface impedance up to a temperature of 500°C. Sun et al.
were interested in the surface impedance of a thin disk of steel wool and showed that the
absorption coefficient of this material decreased when the temperature increased, at least up
to a frequency of about 5 kHz. Sun et al. [14] also demonstrated good agreement between
measured and predicted absorption coefficient using a microstructure based theory. This
approach allowed Sun et al. to investigate the influence of temperature on those parameters
8
typically used in theoretical models for porous media. However, Sun et al. did not proceed to
measure the bulk acoustic properties of the porous material and here it is likely to be difficult
to extend their theoretical approach to the investigation of the propagation constant and
characteristic impedance. This is because it is likely to be more challenging to obtain good
agreement between prediction and measurement for the propagation of sound within random
bulk samples of a fibrous material, when compared to the surface impedance of a thin rigid
disk of material.
The experimental method of Sun et al. demonstrates that it is possible to build an impedance
tube based on an ISO standard design and to modify the tube to allow measurements to be
obtained at higher temperatures. Accordingly, their experimental methodology is adopted
here as a basis for undertaking the measurement of the bulk acoustic properties of fibrous
materials used in dissipative silencers. The aim of these measurements is to investigate the
validity of the temperature power law proposed by Christie for the material flow resistivity
[16], and its use in quantifying the bulk acoustic properties of fibrous materials at high
temperatures using Delany and Bazley coefficients. Accordingly, three fibrous materials
typically used in high temperature applications are measured here. These materials are rock
wool, basalt wool and a glass fibre, where the maximum operating temperature for these
materials is 800°C, 820°C and 500°C, respectively. In section 2, an impedance tube designed
according to EN ISO 10534-2:2001 [12] is described, with modifications made to allow the
temperature to be raised up to 500°C. In section 3, measured data is presented in the form of
the propagation constant and characteristic impedance for each material, and here the validity
of Christie’s modification to flow resistivity is investigated.

9
2. EXPERIMENT
The experiments undertaken here are based on the impedance tube methodology described in
EN ISO 10534-2:2001 [12], as well as the high temperature modifications to the tube
suggested by Sun et al. [14]. Accordingly, a steel impedance tube of inner diameter 102 mm
and length 1510 mm is used, see Fig. 1. This gives a nominal upper frequency limit of 1951
Hz at room temperature, and 3120 Hz at 500°C. Two GRAS type 40SA probe microphones
are used to measure sound pressure and these are placed 79 mm apart, with the first
microphone placed 201 mm from the sample face. The upper operating temperature of the
microphones is 70°C and so they are isolated from the high temperatures in the tube using a
160 mm long probe and a heat sink that has an upper operating limit of 800°C. The tube is
terminated with a plunger of depth 30 mm, which may be moved away from the back of the
sample material using a screw thread attached to a plunger. When the plunger is moved to
create an air gap the sample is held in position using a metallic wire mesh of high percentage
open area, with the mesh being slightly oversized to keep it in place. The maximum available
air gap is 225 mm, although the actual air gap chosen is varied according to the size and bulk
density of the sample material. The sound source is a Maplin Electronics Ltd 51/4” 60W
Shielded Loudspeaker, which is placed at the far end of the impedance tube.
Heating is provided by 11 Watlow Mineral Insulated Band Heaters, which have a width of
63.5 mm and are spaced equally over the tube so that they cover approximately 700 mm of
the tube starting at the back plate of the tube, see Fig 2. The maximum rated temperature of
each heater is 540°C, although in the experiments that follow the upper temperature is
restricted to 500°C due to electrical safety reasons. The temperature of each heater is

10
controlled by a set of three controllers so that individual heaters are grouped into three
sections, with 1 heater in the first group next to the back plate termination, 8 heaters in the
next group and 2 heaters in the final group furthest away from the sample. In order to
prevent thermal damage to the loudspeaker a water jacket with a length of 614 mm is used to
cool the air in the section of the tube closest to the loudspeaker.
The main challenge of operating the impedance tube at high temperatures is maintaining a
constant temperature along the length of the tube, including the material sample and the
plunger. The temperature of the heaters is set by the controllers and these have an inbuilt
feedback mechanism in order to maintain a specified temperature. This feedback depends on
temperature measurements obtained for each group of heaters and here three type K
thermocouples were fixed inside the tube, one for each group of heaters. In addition, the
temperature profile inside the tube was also independently investigated using a separate array
of five Type K thermocouples. These measurements were obtained prior to the acoustic tests,
which enabled the loudspeaker to be removed from the far end of the tube and replaced with
a steel plate. Each thermocouple was then threaded inside a narrow metal tube, which was
inserted through the steel plate and moved along the tube into one of 12 axial measurement
positions. At a chosen axial location the thermocouples were arranged so that they were
approximately 10mm, 30mm, 50mm, 70mm and 90mm away from the bottom of the
impedance tube, in order to measure the transverse temperature distribution at five points.
The thermocouples permitted the independent measurement of the performance of each
heater and following the setting of a desired temperature on the controller some oscillation
around this temperature took place and it took about 60 minutes for the temperature readings
to settle down. Initial temperature measurements inside the tube showed up large convection
currents and significant heat losses at the water jacket end, and it was found necessary to

11
place a thin cloth barrier between the heater and water jacket sections of the tube in order to
lower axial temperature gradients. A number of experimental measurements were undertaken
to ascertain the effect of this cloth barrier on the acoustic measurements and, provided one
chooses a relatively thin barrier, this material had a negligible influence on the acoustic
measurements. Following this design modification a significant improvement in the
temperature profile was realised, and in Figs 3a-3c this temperature distribution is shown at
temperatures of 300°C, 400°C and 500°C, respectively. It is evident in these figures that a
relatively constant temperature distribution has been achieved inside the tube, at least
between the face of the plunger and the last microphone. This region of the tube near the
plunger formed the main focus of efforts to maintain a uniform temperature profile in the
anticipation that any increase in the temperature gradients beyond the last microphone will
not significantly affect the acoustic measurements. For this region the maximum axial
temperature difference is Δ 3.4 at 300 °C, which occurs for a single radial location;
for all other radial locations and at other temperatures the maximum axial temperature
difference is closer to 2 °C, and here the average of these values is Δ 2.0 . In the
radial direction agreement between the measured temperatures improves, with Δ 2
at 300 °C, with most values closer to 1 °C, so that Δ 0.9 . For the entire set of data
measurements at each temperature, the standard deviation from the mean is SD 0.9 at
300 °C, SD 0.8 at 400 °C, and SD 0.6 at 500 °C. Thus, the measured temperature
distribution within the tube indicates that the temperature profile remains stable and errors
seen in the axial and transverse temperature profiles compare very well with the values
obtained by Sun et al. [14]. Accordingly, it is assumed here that this variation in temperature
is acceptable for undertaking acoustic measurements because the average variation in the
speed of sound will be less than 1 %, which means that the sound pressure distribution within
the tube will remain planar.

12
The experimental measurement of surface impedance follows the transfer function method
described in EN ISO 10534-2:2001 [12], with appropriate changes made to the fluid
constants when measuring at higher temperatures. In the measurements undertaken here a
single sample of fibrous material is maintained in place whilst testing is undertaken at all
temperatures of interest. Before testing at a given temperature, the temperature of the tube
was allowed to stabilise. Two surface impedance tests were then performed, one with a rigid
backing the other with an air gap behind the material. In each case, the temperature in the
tube was allowed to stabilise following the introduction of an air gap. The size chosen for the
air gap depended on the material measured, although it generally varied between 25 and 90
mm. Following the completion of two surface impedance tests at each temperature the bulk
acoustic properties are determined using the method described by Utsuno et al. [13], which is
amended here to accommodate the use of a rigid backing. The material sample was then
replaced with a sample of the same material but with a different bulk density and a number of
repetitive tests were undertaken, where the bulk density of the sample was varied between 60
and 130 kg/m3 and a sample thickness of less than 40 mm was maintained in order to avoid
high levels of attenuation within the sample material that may significantly lower the signal
to noise ratio. The testing of random samples of bulk fibrous materials does, however,
present some problems, especially when attempting to maintain a relatively uniform
distribution of the material across the sample. Accordingly, it is important to include a
sufficient amount of material to allow one to minimise large voids inside the material and
also to evenly distribute the material, but not too much so that high levels of attenuation
compromise the accuracy of the measurements. This approach required a significant amount
of trial and error when arranging the material sample and it was found that occasionally the
material settles in such a way that clearly erroneous data is obtained. Therefore, those sets of

13
data that significantly depart from the average expected behaviour have been discarded from
the results that follow.
3. RESULTS AND DISCUSSION
The measured bulk acoustic properties for rock wool, basalt wool and glass fibre are
presented here using the method of Delany and Bazley [9]. Accordingly, the bulk acoustic
properties written as
Γ , and , (1)
where Γ is the propagation constant and is the characteristic impedance, with √ 1.
The bulk acoustic properties are then written in terms of the Delany and Bazley coefficients
so that
Γ1 (2)
and
1 , (3)
where … . are the Delany and Bazley coefficients and ⁄ . Here, ⁄ ,
where is the radian frequency, is the speed of sound, is the density of air, is the flow
resistivity of the material and denotes frequency. Note that is assumed here to be a

14
function of temperature [16], and of course and also depend on temperature. Thus, in
order to obtain the Delany and Bazley coefficients at higher temperatures one must also
measure the temperature dependence of . It is, however, sensible first to investigate the
power law suggested by Christie [16] for the flow resistivity before deciding whether it is
necessary to incur the extra expense of commissioning a high temperature flow resistivity rig.
Accordingly, the flow resistivity for each material is measured here at room temperature
following EN ISO 29053:1993 [15]. The values obtained are expressed in the form [11],
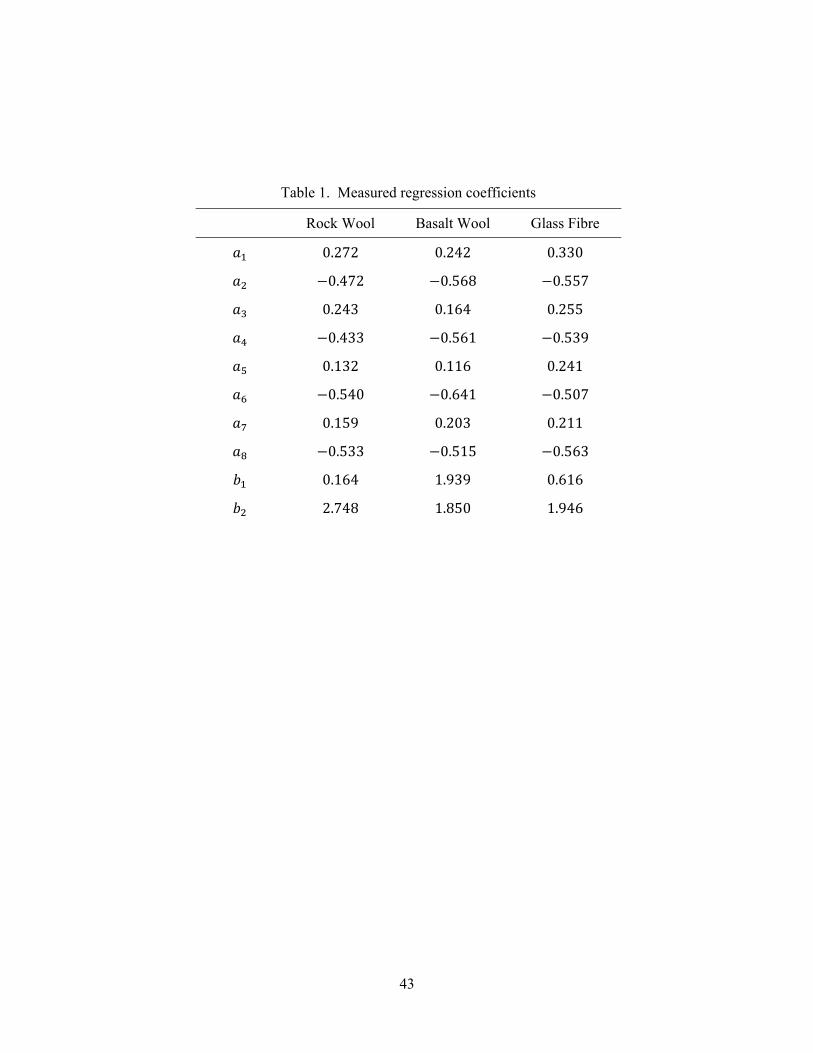
, where is the bulk density of the fibrous material and is the flow resistivity
at room temperature. The coefficients and are obtained following measurements taken
with a number of different bulk densities and these are given in table 1. To extrapolate the
flow resistivity to a higher temperature , Christie [16] proposes the following power law
relationship
0
.
, (4)
where is a room temperature of 20° C, and all temperatures in Eq. (4) are in degrees
Kelvin.
The bulk acoustic properties measured for rock wool are shown in Figs. 4a-d. Here, data was
obtained at 20°C, 200°C, 300°C, 400°C and 500°C. It is evident in Figs. 4b and 4c that a
certain amount of scatter is present, especially in the values for and . This is common in
measurements of the bulk acoustic properties taken at room temperature; see for example the
levels of scatter observed for these parameters by a number of authors [18-20]. Thus, the
scatter seen here is not necessarily caused by the increase in temperature, which is illustrated

15
by a comparison between data taken at room temperature and those at elevated temperatures.
Accordingly, it is concluded here that high temperatures do not affect the level of scatter seen
in the data and this scatter is merely a function of the measurement methodology. The scatter
has many possible sources and may be influenced by the accuracy of the transfer function
measurements, with lower frequencies being less accurate because of the increase in the
wavelength of sound; however, for fibrous materials it is likely that the scatter is dominated
by problems in obtaining a uniform sample of the material, as well as maintaining a flat and
uniform surface facing towards the sound source. Nevertheless, the scatter seen in the results
for rock wool is judged to be acceptable for the deduction of the bulk acoustic properties.
In Fig. 4, it is evident that if one adopts the power law in Eq. (4) then the data measured at
different temperatures collapses well. For example, when the temperature is increased the
data for , and are seen to “line up” very well. The only region of slight deviation is for
, however this is for one of the material properties that has the most scatter, and the level of
deviation seen here is not deemed to be significant in terms of the effect of temperature on
the acoustic properties of the material. In Figs. 5 and 6, the bulk acoustic properties for basalt
wool and glass fibre are presented. Here, the data is again seen to line up well, and it is
noticeable that the scatter for basalt wool is less than that seen for the other materials. This is
thought to be caused by the relative ease with which it was possible to arrange this material in
a uniform and consistent way. In Fig. 5 one can see that for and R the data at different
temperatures lines up well and so one may infer that those small discrepancies seen
previously for rock wool are probably a result of experimental uncertainties and not a
temperature related property of the material. For glass fibre in Fig. 6 similar behaviour is
observed to the other two materials, although there is an increase in scatter when compared to
basalt wool.

16
It is evident in Figs. 4-6 that the measured bulk acoustic properties obtained at high
temperatures generally collapse very well onto a standard Delany and Bazley plot. This was
made possible by compensating for the change in the flow resistivity of the material and the
properties of air when the temperature is increased. Accordingly, these figures provide
convincing evidence that the power law modification of Eq. (4), first suggested by Christie
[16], is correct, at least up to a temperature of 500°C. Therefore, it is possible to fit a
regression curve through this data and to identify the Delany and Bazley coefficients for each
material, and these are recorded here in Table 1. It is likely that any differences Christie
noticed between predicted values obtained with the corrected flow resistivity, and those
values measured at high temperatures, were caused by comparing a limited set of data for an
individual material with data averaged over many measurements and different materials taken
by Delany and Bazley. This effect is also evident in the regression constants in Table 1,
which do not match those of Delany and Bazley, and do not match one another. Christie also
noted a deviation in Eq. (4) when measuring the flow resistivity at temperatures above
400°C, but in Figs. 4-6 there is no evidence to suggest that this occurs for the materials
studied here. For example, those measurements taken at 500°C appear to collapse just as
well as those taken at lower temperatures and there is no evidence of any trend in the data
deviating away from that obtained at lower temperatures. Whilst it has not been possible to
obtain data at temperatures above 500°C, the data presented here provides evidence that one
may, at least as a first approximation, apply the power law relationship of Eq. (4) over the
entire temperature range of interest, which for gas turbine exhaust systems is up to 680°C.

17
In Delany and Bazley’s original article the absorption coefficient was also obtained,
which may readily be obtained from the bulk acoustic properties, so that
111
, (5)
where coth Γ ⁄ . Here, Eq. (5) permits a measured value for the absorption
coefficient to be calculated for a given depth of material using the bulk acoustic property
measurements. This permits comparison with the findings of Sun et al. [14] and in Fig. 7 the
effect of temperature on the absorption coefficient of rock wool is shown for a material depth
of 16mm, with 8.5 10 Ns/m4. Here, it is seen that the measured absorption
coefficient drops as the temperature is increased, at least over the frequency range covered
here and this behaviour is the same as that observed by Sun et al. [14]. The material studied
by Sun et al. is, however, very different from those studied here and so only a qualitative
comparison is possible, but the results do clearly demonstrate that a rise in temperature
significantly alters the absorption characteristics of a fibrous porous material.
4. CONCLUSIONS
The influence of temperature on the bulk acoustic properties of three fibrous materials was
investigated using an impedance tube designed to ISO 10534-2 standards [12] and adapted
for high temperatures following the methodology of Sun et al. [14]. It is shown that by using
band heaters it is possible to maintain an approximately linear temperature profile throughout
the tube for temperatures up to 500 °C. Through the use of probe microphones and a water
cooling jacket close to the loudspeaker, one may then use a two microphone method to

18
measure the surface impedance of a sample of fibrous material at high temperatures. The
bulk acoustic properties may then be found following the measurement of two different
surface impedances [13]. Measured data are presented here for rock wool, basalt wool and an
E-glass fibre, for temperatures between 20 °C and 500 °C. For each material it is shown that
one may collapse the data using the method of Delany and Bazley [9]; however, in order for
this to work it is necessary first to correct for the temperature dependence of the material flow
resistivity, as well as that of the properties of air. Here, it is shown that the 0.6 power law
relationship between temperature and the material flow resistivity proposed by Christie [16]
permits the data measured at each temperature to be collapsed onto standard Delany and
Bazley curves, at least up to a temperature of 500 °C. That is, if one wishes to obtain the
bulk acoustic properties of a fibrous material at high temperatures then it is necessary only to
measure these properties at room temperature, and then to correct the flow resistivity using
Christie’s power law given in Eq. (4), as well as modify the properties of air. Therefore the
measurements presented here demonstrate that it is not necessary to build an impedance tube
that will operate at high temperatures, at least if one is interested in the properties of fibrous
materials up to 500 °C. For temperatures above 500 °C it is proposed that, as a first
approximation, one retains the 0.6 power law, provided that the material remains
mechanically stable at such high temperatures. The results presented here also demonstrate
that high temperatures significantly affect the acoustic properties of a fibrous material and so
any computational models that seek to estimate dissipative silencer performance at higher
temperatures must account for this in their calculations.

19
ACKOWLEDGEMENTS
The authors would like to thank the UK Technology Strategy Board (TSB), through the
Knowledge Transfer Programme (KTP), for their support of the work reported in this article.

20
1. Kirby R, Denia FD. Analytic mode matching for a circular dissipative silencer containing
mean flow and a perforated pipe, Journal of the Acoustical Society of America
2007;122:3471-3482.
2. Selamet A, Xu MB, Lee IJ, Huff NT. Analytical approach for sound attenuation in
perforated dissipative silencer, Journal of the Acoustical Society of America
2004;115:2091-2099.
3. Kirby R. A comparison between analytic and numerical methods for modelling
automotive dissipative silencers with mean flow, Journal of Sound and Vibration
2009;325:565-582.
4. Cummings A, Sormaz N. Acoustic attenuation in dissipative splitter silencers containing
mean fluid flow, Journal of Sound and Vibration 1993;168:209-227.
5. Kirby R, Lawrie JB. A point collocation approach to modelling large dissipative
silencers, Journal of Sound and Vibration 2005;286:313-339.
6. Johnson DL, Køplik J, Dashen R. Theory of dynamic permeability and tortuosity in fluid-
saturated porous media, Journal of Fluid Mechanics 1987;176:379-402.
7. Allard JF. Propagation of sound in porous media, modelling sound absorbing materials.
New York. Elsevier Applied Science; 1993.
8. Bo Z, Tianning C. Calculation of sound absorption characteristics of porous sintered
fiber metal. Applied Acoustics 2009;70:337-346.
9. Delany ME, Bazley EN. Acoustical properties of fibrous materials. Applied Acoustics
1970;3:105-116.
10. Mechel FP. Ausweitung der absorberformel von Delany and Bazley zu tiefen frequenzen,
Acustica 1976;35:210-213.

21
11. Kirby R, Cummings A. Prediction of the bulk acoustic properties of fibrous materials at
low frequencies, Applied Acoustics 1999;56:101-125.
12. European Standard EN ISO 10534-2:2001, Determination of sound absorption coefficient
and impedance in impedance tubes. Transfer function method.
13. H. Utsuno, T. Tanaka, T. Fujikawa, A.F. Seybert, Transfer function method for
measuring characteristic impedance and propagation constant of porous materials, Journal
of the Acoustical Society of America 1989;86:637—643.
14. F. Sun, H. Chen, J. Wu, K. Feng, Sound absorbing characteristics of fibrous metal
materials at high temperatures, Applied Acoustics 2010;71:221-235.
15. European Standard EN ISO 29053:1993, Acoustics: Materials for acoustical applications.
Determination of airflow resistance.
16. Christie DRA. Measurement of the acoustic properties of a sound absorbing material at
high temperatures, Journal of Sound and Vibration 1976;46:347-355.
17. F. Giese, H.-C. Ries, C. Eigenbrod, On the performance of porous sound absorbent
material in high temperature applications, Journal of Engineering for Gas Turbines and
Power 2010;132: 121301-1--121301-6.
18. T. Komatsu, Improvement of the Delany-Bazley and Miki models for fibrous sound-
absorbing materials, Acoustical Science and Technology 2008;29:121-129.
19. P. Dunn, W.A. Davern, Calculation of Acoustic Impedance of Multi-layer Absorbers,
Applied Acoustics 1986;19:321-334.
20. A. Cummings and S.P. Beadle, Acoustic properties of reticulated plastic foams, Journal
of Sound and Vibration 1993;175:115-133.

22
FIGURE CAPTIONS
Figure 1. Experimental apparatus (all dimensions in mm).
Figure 2. Photograph of experimental apparatus.
Figure 3(a). Measured temperature inside tube at set temperature of 300°C and a distance y
from the bottom of the tube. , y = 10 mm; , y = 30 mm;
, y = 50 mm; , y = 70 mm; , y = 90mm.
Figure 3(b). Measured temperature inside tube at set temperature of 400°C and a distance y
from the bottom of the tube. , y = 10 mm; , y = 30 mm;
, y = 50 mm; , y = 70 mm; , y = 90mm.
Figure 3(c). Measured temperature inside tube at set temperature of 500°C and a distance y
from the bottom of the tube. , y = 10 mm; , y = 30 mm;
, y = 50 mm; , y = 70 mm; , y = 90mm.
Figure 4a. Real part of the propagation constant for rock wool. + , 20°C;
+ , 200°C; + , 300°C; + 400°C; + 500°C.

23
Figure 4(b). Imaginary part of the propagation constant for rock wool. + , 20°C;
+ , 200°C; + , 300°C; + 400°C; + 500°C.
Figure 4(c). Real part of the characteristic impedance for rock wool. + , 20°C;
+ , 200°C; + , 300°C; + 400°C; + 500°C.
Figure 4(d). Imaginary part of the characteristic impedance for rock wool. + , 20°C;
+ , 200°C; + , 300°C; + 400°C; + 500°C.
Figure 5(b). Imaginary part of the propagation constant for basalt wool. + , 20°C;
+ , 200°C; + , 300°C; + 400°C; + 500°C.
Figure 5(c). Real part of the characteristic impedance for basalt wool. + , 20°C;
+ , 200°C; + , 300°C; + 400°C; + 500°C.
Figure 5(d). Imaginary part of the characteristic impedance for basalt wool. + , 20°C;
+ , 200°C; + , 300°C; + 400°C; + 500°C.
Figure 6(a). Real part of the propagation constant for glass fibre. + , 20°C;
+ , 200°C; + , 300°C; + 400°C; + 500°C.

24
Figure 6(b). Imaginary part of the propagation constant for rock wool. + , 20°C;
+ , 200°C; + , 300°C; + 400°C; + 500°C.
Figure 6(c). Real part of the characteristic impedance for glass fibre. + , 20°C;
+ , 200°C; + , 300°C; + 400°C; + 500°C.
Figure 6(d). Imaginary part of the characteristic impedance for glass fibre. + , 20°C;
+ , 200°C; + , 300°C; + 400°C; + 500°C.
Figure 7. The absorption coefficient of basalt wool calculated from the derived Delany and
Bazley coefficients. , 20°C ; , 200°C; , 300°C;
, 400°C; , 500°C.

25
Figure 1. Experimental apparatus (all dimensions in mm).
Panasonic CF‐18 Soundbook
260 201 79 160 90 694
Plunger Heaters
Microphones
Water jacket
Loudspeaker Thermal barrier

26
Figure 2. Photograph of experimental apparatus.
Heating elements
Microphones
Temperature Controller
Water jacket
Loudspeaker
Sample holder

27
Figure 3(a). Measured temperature inside tube at set temperature of 300°C and a distance y
from the bottom of the tube. , y = 10 mm; , y = 30 mm;
, y = 50 mm; , y = 70 mm; , y = 90mm.
294
296
298
300
302
304
306
100 200 300 400 500 600 700
Tem
pera
ture
(°C
)
Distance from backplate (mm)
Sample Face
Mic. 1 Mic. 2(a)

28
Figure 3(b). Measured temperature inside tube at set temperature of 400°C and a distance y
from the bottom of the tube. , y = 10 mm; , y = 30 mm;
, y = 50 mm; , y = 70 mm; , y = 90mm.
398
400
402
404
406
408
410
100 200 300 400 500 600 700
Tem
pera
ture
(°C
)
Distance from backplate (mm)
Sample Face
Mic. 1 Mic. 2(b)

29
Figure 3(c). Measured temperature inside tube at set temperature of 500°C and a distance y
from the bottom of the tube. , y = 10 mm; , y = 30 mm;
, y = 50 mm; , y = 70 mm; , y = 90mm.
496
498
500
502
504
506
100 200 300 400 500 600 700
Tem
pera
ture
(°C
)
Distance from backplate (mm)
SampleFace
Mic. 1 Mic. 2(c)

30
Figure 4a. Real part of the propagation constant for rock wool. + , 20°C;
+ , 200°C; + , 300°C; + 400°C; + 500°C.
0.1
1
10
0.001 0.01 0.1 1
α/k
ξ
(a)

31
Figure 4(b). Imaginary part of the propagation constant for rock wool. + , 20°C;
+ , 200°C; + , 300°C; + 400°C; + 500°C.
0.1
1
10
0.001 0.01 0.1 1
β/k‐1
ξ
(b)

32
Figure 4(c). Real part of the characteristic impedance for rock wool. + , 20°C;
+ , 200°C; + , 300°C; + 400°C; + 500°C.
0.1
1
10
0.001 0.01 0.1 1
R/ρc‐1
ξ
(c)

33
Figure 4(d). Imaginary part of the characteristic impedance for rock wool. + , 20°C;
+ , 200°C; + , 300°C; + 400°C; + 500°C.
0.1
1
10
0.001 0.01 0.1 1
‐X/ρc
ξ
(d)

34
Figure 5(a). Real part of the propagation constant for basalt wool. + , 20°C;
+ , 200°C; + , 300°C; + 400°C; + 500°C.
0.1
1
10
0.001 0.01 0.1 1
α/k
ξ
(a)

35
Figure 5(b). Imaginary part of the propagation constant for basalt wool. + , 20°C;
+ , 200°C; + , 300°C; + 400°C; + 500°C.
0.1
1
10
0.001 0.01 0.1 1
β/k‐1
ξ
(b)

36
Figure 5(c). Real part of the characteristic impedance for basalt wool. + , 20°C;
+ , 200°C; + , 300°C; + 400°C; + 500°C.
0.1
1
10
0.001 0.01 0.1 1
R/ρc‐1
ξ
(c)

37
Figure 5(d). Imaginary part of the characteristic impedance for basalt wool. + , 20°C;
+ , 200°C; + , 300°C; + 400°C; + 500°C.
0.1
1
10
0.001 0.01 0.1 1
‐X/ρc
ξ
(d)

38
Figure 6(a). Real part of the propagation constant for glass fibre. + , 20°C;
+ , 200°C; + , 300°C; + 400°C; + 500°C.
0.1
1
10
0.01 0.1 1
α/k
ξ
(a

39
Figure 6(b). Imaginary part of the propagation constant for rock wool. + , 20°C;
+ , 200°C; + , 300°C; + 400°C; + 500°C.
0.1
1
10
0.01 0.1 1
β/k‐1
ξ
(b

40
Figure 6(c). Real part of the characteristic impedance for glass fibre. + , 20°C;
+ , 200°C; + , 300°C; + 400°C; + 500°C.
0.1
1
10
0.01 0.1 1
R/ρc‐1
ξ
(c)

41
Figure 6(d). Imaginary part of the characteristic impedance for glass fibre. + , 20°C;
+ , 200°C; + , 300°C; + 400°C; + 500°C.
0.1
1
10
0.01 0.1 1
‐X/ρc
ξ
(d)

42
Figure 7. The absorption coefficient of basalt wool calculated from the derived Delany and
Bazley coefficients. , 20°C ; , 200°C;
, 300°C; , 400°C; , 500°C.
0
0.2
0.4
0.6
0.8
1
0 1000 2000 3000 4000 5000
Absorption Coefficient
Frequency (Hz)
43
Table 1. Measured regression coefficients
Rock Wool Basalt Wool Glass Fibre
0.272 0.242 0.330
0.472 0.568 0.557
0.243 0.164 0.255
0.433 0.561 0.539
0.132 0.116 0.241
0.540 0.641 0.507
0.159 0.203 0.211
0.533 0.515 0.563
0.164 1.939 0.616
2.748 1.850 1.946