Embed Size (px)
Citation preview

N..'Vb Department ofVeterans Affairs
Journal of Rehabilitation Research andDevelopment Vol . 35 No . 3, July 1998Pages 314—326
Measurement of impaired muscle function of thegastrocnemius, soleus, and tibialis anterior muscles in spastichemiplegia: A preliminary study
Jules G. Becher, MD; Jaap Harlaar, MSc; Gustaaf J . Lankhorst, MD, PhD; Tanneke W. Vogelaar, PTDepartment of Rehabilitation Medicine, Vrije Universiteit, Amsterdam, The Netherlands
Abstract—Based on the results of several electrodiagnosticand biomechanical studies, the following classification ofmuscle dysfunction in spastic hemiplegia is proposed:changes in muscle activation (excess symptoms, e .g ., spastic-ity, and deficit symptoms, e .g ., paresis) ; changes in musclestiffness ; and changes in muscle length . The clinical signifi-cance of this classification is that different types of muscledysfunction might require specific treatment.
The authors have developed techniques to measurequantitatively each type of muscle dysfunction: free fre-quency repetitive movement (FFRM) and torque anglediagram (TAD). Surface EMGs of tibialis anterior, gastroc-nemius, and soleus muscle are recorded during active(FFRM) and passive (TAD) ankle movements . EMG data areconverted to parameters for abnormal muscle activation(excess and deficit symptoms) . Parameters for muscle stiff-ness and muscle length are derived from the hysteresis curveof the TAD.
This article describes the measurements and the resultsof a validation study . For the validation study, four hypoth-eses were formulated: 1) in nonimpaired control subjects,parameters expressing abnormal muscle activation are low ; 2)in hemiplegic subjects, differences between the affected andthe unaffected sides will be found for all types of parameters;3) after local anaesthesia of the tibial nerve on the hemiplegicside, excess symptoms will decrease, while muscle stiffnessremains unchanged; and 4) despite a uniform gait pattern,between-subject differences can be detected with regard tomuscle activation, stiffness, and length.
Address all correspondence and requests for reprints to : J.G . Becher,Department of Rehabilitation Medicine, Vrije Universiteit, PO Box 7057,1007 MB Amsterdam, The Netherlands ; email : jg .becher@azvu .nl .
The first hypothesis was tested and confirmed in twocontrols ; the remaining three were tested and confirmed in tenhemiplegic subjects (mean age 47 .7 yrs, mean time sinceonset 10 .7 yrs) . However, the level of co-contraction of thegastrocnemius muscle was low, probably indicating that theclinical significance of this phenomenon might be limited.
The results support the validity of the proposed classifi-cation and measurements.
Key words : hemiplegia, measurement, spasticity.
INTRODUCTION
The most widely accepted definition of spasticityis: "a motor disorder characterized by a velocity-dependent increase in tonic stretch reflexes with exag-gerated tendon jerks, resulting from hyperexcitability ofthe stretch reflex, as one component of the upper motorneuron syndrome" (1) . Until recently, subjective mea-sures such as the Ashworth scale, have been widelyused (2-4). However, objective measurement tech-niques, necessary for the evaluation of various modes oftreatment, are lacking.
For the objective measurement of changes inmuscle function in spasticity, electrodiagnostic andbiomechanical techniques have been developed.
A wide variety of electrodiagnostic measurementshas been used to quantify the level tof hyperexcitability
of the stretch reflex, as one component of the upper
motor neuron syndrome (UMNS) . Electrodiagnosticstudies have contributed to the knowledge about
314

315
BECHER et al . Measurement of Impaired Muscle Function
neuronal circuits in the spinal cord but, unfortunately,the results correlate poorly with clinical severity.Kinesiologic electromyographic studies, measuringchanges in muscle function, have shown that thefollowing factors contribute to the impairment ofmuscle function : increase in stretch reflex activity,inappropriate muscle activation (e .g ., co-contraction),and severity of paresis (5-7).
The enhanced stretch reflex during imposed move-ments can be present either in a dynamic way (onlyduring stretch) or in a tonic way, showing EMG activityas long as passive movement is imposed (8) . Thisresults in the clinical observation of stiffness duringpassive movement in a joint . In UMNS there is a typicaldistribution of spasticity in antigravity muscles.
During voluntary movements of the knee, co-contractions (simultaneous contractions of the agonistand antagonist of movement) were noticed in thehamstring muscles (9,10) . However, co-contractionswere not associated with the presence of increasedstretch reflexes during passive movements . Co-contractions were also found during gait analysis insome hemiplegic subjects (11,12).
In spastic hemiplegia, loss of recruitment ofagonist contraction, or reduced output paresis (ROP),plays a major role in the impairment of muscle function(13) . Based on these findings, motor dysfunction inUMNS can be classified as positive (excess) andnegative (deficit) symptoms (14) . Positive symptoms aremanifestations of enhanced stretch reflex activity andco-contractions, resulting in spasticity, spontaneousspasms, and clonus . Negative symptoms are deficits inmotor performance, resulting in decreased dexterity,paresis, and enhanced fatiguability.
Biomechanical investigations registered the torque,joint angle, and surface EMG recording of the musclescontrolling the joint during either imposed linear orsinusoidal movements . These studies have shown thatresistance to imposed movement is not only the result ofchanges in stretch reflex response, but also depends onthe passive properties of the tissues, such as elastic andviscous stiffness and friction (15-17) . These changes inbiomechanical properties also result in increased musclestiffness in passive movement during clinical examina-tion. Another change in passive properties is shorteningof the muscle-tendon complex, as has been demon-strated in patients with hemiplegia and in children withcerebral palsy (18-20).
Based on these findings, we propose the followingclassification of muscle dysfunction in UMNS :
1. changes in muscle activation : (a) positive orexcess symptoms : enhanced stretch reflex activity,clonus, spontaneous spasm, and co-contraction ; (b)negative or deficit symptoms: decreased dexterity,enhanced fatiguability, and paresis;
2.
changes in muscle stiffness;3.
changes in muscle length.
Measurement of these differences in muscle dys-function could well be relevant for clinical practice : ashortened muscle can be treated by surgical lengthening,excess symptoms with a spasmolytic drug increasingpresynaptic inhibition in the spinal cord, and increasedmuscle stiffness with dantrolene natrium (14).
Objective of the StudyThe aim of this study was twofold : to develop a
method to quantify these three aspects of muscledysfunction (changes in muscle activation, stiffness, andlength), and to study the construct validity of themethod . As many therapeutic interventions in personswith UMNS are aimed at improving walking capacityby improving ankle function, this study concentrated onmuscles controlling the ankle joint.
We hypothesized that:
1.
in nonimpaired control subjects, parameters ex-pressing abnormal muscle activation are low;
2.
in hemiplegic subjects, differences will be found inparameters of muscle activation (excess and defi-cit), muscle stiffness, and muscle length, whencomparing the hemiplegic with the unaffectedside;
3. after nerve-blocking on the hemiplegic side, pa-rameters expressing excess muscle activation willdecrease, while parameters expressing musclestiffness remain unchanged;
4. notwithstanding a uniform spastic gait pattern,significant between-subject differences can bedetected with regard to muscle activation, stiff-ness, and length.
As the method was intended for use in theevaluation of therapeutic interventions in clinical prac-tice, the following conditions were determined : Themeasurements must closely resemble the normal physi-cal examination of a patient by a physician in order tofacilitate comparison of laboratory findings with physi-cal examination data . The measurements must beapplicable in a clinical environment, which sets limits tothe complexity of instrumentation, the time required for

316
Journal of Rehabilitation Research and Development Vol . 35 No . 3 1998
the test and the method of interpretation of the results.The measurements must be based on a biomechanicalanalysis of human movements in terms of torque, rangeof motion (ROM), and angular velocity.
METHOD
Physical examination of muscle function in aperson with spastic hemiplegia is based on observationsof the quality of voluntary movement and the perfor-mance of passive motion in a joint . To objectify theseclinical observations, we developed a technique toexamine voluntary muscle function, the free frequencyrepetitive movement (FFRM) test, and a technique formeasuring passive muscle function during imposedmovements, which produced the torque angle diagram(TAD).
Free Frequency Repetitive MovementVoluntary muscle function was assessed by FFRM
in the ankle in a sitting position. The subject wasinstructed to move the foot alternately towardplantarflexion and dorsiflexion with a maximum ROMand at a maximum speed for 30 s . Synergistic move-ments in the knee and hip joint were allowed . Anklemovements were recorded with a potentiometer-basedgoniometer . Muscle activity was recorded by surfaceelectromyography (EMG) of the tibialis anterior muscle(TAM) and the medial head of the gastrocnemiusmuscle (GM) . For the bipolar lead-off, the electrodeswere placed in the direction of the muscle fibers, at thecenter of the palpable muscle belly . Rim-to-rim distanceof the two electrodes was 23 mm, and the effectivelead-off surface of the electrodes was 1 cm' .
The EMG was preamplified with a miniatureamplifier (gain : 100x, CMRR> 100 dB) mounted on thetwo electrodes. The differential signal was led away,high-pass filtered (at 20 Hz, 18 dB/oct) in order toremove residual movement artefacts, and amplified.This signal was fed to an oscilloscope to be checked.For recording purposes, the EMG was rectified andsmoothed out (low-pass filtering at 25 Hz, 18 dB/oct) toobtain the smoothed rectified EMG (SR-EMG, equal tothe integrated EMG) . The SR-EMG of the TAM and theGM, together with the goniometer signal of the anklewere stored online on a microcomputer using AIDconversion (sample frequency : 120 Hz).
Off-line, the movement was divided into cycles tocalculate the movement frequency . A cycle was defined
as the period between two dorsidirectional crossings ofthe signal with the median angle of the movement. TheSR-EMG was filtered through a digital low-pass filter ata frequency of 4 times the movement frequency of theankle (4th order Butterworth filter with no phase lag).Furthermore, as shown in Figure 1, the cycles wereensemble averaged for all signals in order to obtain theaverage movement and muscle activation patterns,together with the standard deviation, as a function of0—100 percent of the cycle phase (21) . In the plots,when the maximum value of the SR-EMG exceeds 40MV, it was normalized to a percentage of the recordedmaximum SR-EMG value of each muscle.
Torque Angle DiagramsIn order to assess the passive behavior of the ankle
joint, a standardized movement was imposed . It wasdecided that this movement should be sinusoidal, asthis is very similar to functional movements, such asgait, in contrast to isokinetics . Moreover, during con-stant velocity movements, very high decelerations andaccelerations occur at the reversal of movement direc-tion, which trigger the tendon stretch reflex in personswith UMNS.
For this study, a special dynamometer capable ofdriving the ankle joint was constructed (Figure 2); itsfrequency and ROM could be programmed . The foot ofthe subject was fixed in an exchangeable shoe, firmlysecured to the footplate of the dynamometer . The axisof rotation of the footplate could be adjusted, in order toobtain alignment with the closest approximation of thesingle axis of rotation of the ankle (22) . The alignmentwas checked by minimizing the shift of the tibia duringankle movement through the full ROM . The footplatewas rotated by an electrical motor with tachocontrol,via a crank-linkage mechanism . On one side, a torquetransducer, based on strain gauges (23), was inter-posed between the crank and the footplate . On theother side of the axis, a potentiometer-based goni-ometer measured the angular position of the foot-plate . The SR-EMG of the TAM, the medial head of theGM and the soleus muscle (SM) were also recordedusing the same instruments used for the FFRM . Thesignals of torque, angle, and SR-EMG were stored for3—5 cycles (depending on the frequency of the move-ment).
Off-line, the signals were divided into two phases,dorsal and plantarflexion, each ensemble averaged . Inthis way, an X-Y plot of the angle versus the net torquecould be generated, showing a typical curve of hyster-

317
BECHER et al . Measurement of Impaired Muscle Function
Figure 1.Report of a free frequency repetitive movement test of the ankle of acontrol subject : illustration of the parameters . TAM=tibialis anteriormuscle ; GM=gastrocnemius muscle ; SEGM=number of segments ofmovement ; FREQ=frequency ; ROM=range of motion;Score=product score ; CC=co-contraction ; VMA=voluntary muscleactivity ; MMA=minimal muscle activity . X-axes : One and a halfcycles of movement (dorsiflexion–plantarflexion–dorsiflexion) . Y-axes : top, the ankle movement in degrees ; mean values of 50 cyclesare calculated, 1 SD plotted. Middle, the integrated (smoothedrectified) EMG of the TAM is represented . The mean maximal EMGactivity of that muscle (174 pV) is used for normalization to 100percent. Bottom, the IEMG activity of the medial head of the GM isshown.
Figure 2.The ankle dynamometer with surface EMG registration of the tibialisanterior, soleus, and gastrocnemius muscles.
esis (Figure 3) . The SR-EMG of the muscles was alsoexpressed as a function of the joint angle for eachseparate phase of the movement . The net torque wascorrected for the gravitational influence of footplate andfoot .
ProceduresThe subject was seated in a stable chair, with 90°
of flexion in hip and knee . The FFRM in the ankle wasperformed, as described, after which TAD was mea-
sured with the ankle dynamometer . After fixation of thefoot, the ankle axis was carefully aligned. The ROM
was defined as the range limited by the net torquevalues of 8 Nm (dorsiflexion) and -5 Nm (plantar-flexion) . The frequency of the imposed sinusoidalmovement was set at a maximum angular velocity of 30°/s . The procedure was repeated after adjustment of thesitting position of the subject to 110° flexion of the hipand full extension of the knee.
The tests were performed three times at weeklyintervals : in the first session, measurements wereperformed on the hemiplegic side, in the second, on thehemiplegic side after local anaesthesia of the tibialnerve (TN), and in the third on the unaffected(nonhemiplegic) side.
Local anaesthesia of the TN was achieved with 10ml xylocain 2 percent solution in the fossa poplitea afterlocalization with a stimulation-needle (Labaz® ). Theinnervation of the GM and SM was blocked to eliminateany involuntary muscle activity . The success of thenerve-blocking could be determined by loss of sensitiv-ity in the heel . All measurements were performedbetween 1400 and 1600 hours.
Converting the Measurements into ParametersThe following parameters were defined (see Table
1):
Muscle ActivationPositive or excess signs include reflex release
phenomena and inappropriate muscle activation . In aTAD procedure, the GM and SM are stretched duringpassive dorsiflexion, so the increase of the mean levelof EMG activity in µV during the second half ofdorsiflexion is used as a parameter of dynamic stretchreflex activity (DSR) . In the first half of the dorsiflexionmovement, the GM and SM are relaxed, so the meanlevel of EMG activity in µV is used as a parameter fortonic stretch reflex activity (TSR) of the GM and SM(Figure 3).
Inappropriate muscle activation can also be traced
during FFRM . In voluntary movements, the threshold toelicit a stretch reflex is elevated, compared withimposed movements (24), but reciprocal excitation (atonic activation of the antagonist of movement) isrecorded in some subjects with UMNS (25) . TSR of a
10o%o —T
TAM -MAX : 174 uVMIN
: 34 uVCC
: 34 uV
VMA —
MMA%0
100io
0
SR-EMG 1
SEGM :50FRED :1 .72±,14 HzROM : 24 ± 2 deg
- i .
_
SCORE : 2417 deg

318
Journal of Rehabilitation Research and Development Vol. 35 No . 3 1998
Table 1.Parameters.
Free Frequency Repetitive Movement Test:Excess parametersMMA = Minimal Muscle Activity % = [minimal (MIN)
EMG activity/maximal (MAX) EMG activity]100.
CC
= Co-contraction in pV : Maximal EMG activity ofthe antagonist of movement - minimal EMGactivity.
RC
= Reciprocal Coefficient % : (the increase of EMGactivity of the antagonist/the increase of EMGactivity of the agonist of movement) • 100 .
— SM k stretch
Y50 ®/®
vJ`'w''W TAM : relaxation
8—_
-4 -
plantar flexion
6 —_
6--
dorsal flexion
20
110
100
90
80
70ANGLE (DEG)
Deficit parametersFREQ
= Frequency (in Hz)ROM
= Range Of Motion (in degrees)PS
= Product Score : (FREQ) . (ROM) during 30seconds.
VMA
= Voluntary Muscle Activity in pV:Maximum (MAX) - Minimum (MIN).
ROP
= Reduced Output Paresis % : ratio (VMAhemiplegic side/VMA unaffected side) • 100.
Torque Angle DiagramsExcess parametersDSR
= Torque-Angle-Diagram Dynamic Stretch Reflex:mean EMG activity during the stretching phase ofa muscle.
TSR
= Torque-Angle-Diagram Tonic Stretch Reflex:mean EMG activity during the shortening phaseof a muscle.
Muscle stiffness:STIFF
= The shift of the hysteresis curve over the axis oftorque in Nm.
Muscle length:LENGTH = The shift of the hysteresis curve over the axis of
angle in degrees.
muscle is reflected as continuous muscle activationduring stretching (26) . To quantify the TSR level, theaverage minimal muscle EMG activity of a muscle isused, indicating the impairment of relaxation of amuscle. This is converted into the parameter minimalmuscle activity (MMA), expressing the minimal level ofEMG activity as a percentage of the maximal EMGactivity during voluntary movement (Figure 1).
Co-contraction of the antagonist is probably also asign of a self-induced stretch reflex, and can be tracedduring FFRM (9,27,28) . The increase in EMG activityof a muscle at the moment of lengthening is defined as
co-contraction (CC in tiV ; see Figure 1) . A relativeparameter is the reciprocal coefficient : (the increase in
-6 -
50@/0
*stretch
pre-stretch
Figure 3.Torque angle diagram of the ankle during passive dorsal-plantarflexion with simultaneous registration of surface EMG activity onthe hemiplegic side. GM=gastrocnemius muscle ; SM=soleus muscle;TAM=tibialis anterior muscle . Top : registration of surface EMGduring dorsiflexion : stretch of the GM and SM, relaxation of theTAM ; Bottom: registration of surface EMG during plantar flexion:relaxation of the GM and SM, stretch of the TAM . EMG activity isrepresented in the direction of action on the torque.
EMG activity of the antagonist/the increase in EMGactivity of the agonist of movement) : 100.
Negative or deficit signs of muscle activationinclude loss of dexterity, paresis, and enhanced fatigu-ability . When the hemiplegic side is compared with theunaffected side, these properties of muscle function areexpressed as the performance during FFRM . This isdefined as product score in degrees : frequency ofmovement (Hz)•ROM (degrees) during a period of 30 s.The increase in EMG activity in .tV of the agonist ofmovement is expressed as the voluntary muscle activity(VMA) in pV (Figure 1) . The level of ROP is definedas the ratio (VMA hemiplegic side/VMA unaffectedside)- 100.
Muscle Stiffness
The S-shape of the hysteresis curve in a TAD isdetermined by the stiffness of the TAM and the GM orSM. When there is no EMG activity present in themuscles, the shift of the hysteresis curve over the axis
-8 —GM relaxationSMTAM : stretch

319
BECHER et al . Measurement of Impaired Muscle Function
Table 2.
Subject characteristics.
SUB DIAGN AGE SEX DUR ASHW
1 STROKE 55 M 12 32 STROKE 67 M 10 33 CC 26 M 18 24 STROKE 38 M 10 25 STROKE 59 M 8 26 CC 28 M 1.0 27 STROKE 66 F 10 38 STROKE 56 F 6 29 CP 25 F BIRTH 3
10 STROKE 57 M 12 3
1 i
t i I140
130
120
110
100 90
80
70ANGLE (DEG)
10-
6-
6-
4-
z 2-W -0 0-
-2-
-4-
-6 -
-6-
Figure 4.Torque angle diagrams of the ankle of a hemiplegic patient . Thinline=unaffected side ; thick line=affected side; dotted line=affectedside after local anaesthesia of the Tibial Nerve. No EMG activitywas recorded. A=difference in muscle length (TAD-LENGTH);B=difference in muscle stiffness (TAD-STIFF).
of torque in Nm (STIFF) is to be considered as thedifference in stiffness (Figure 4 : shift B).
Muscle LengthThis parameter can also be derived from a
comparison of the TADs of the hemiplegic and theunaffected side . The shift of the hysteresis curve overthe angle axis represents the decrease in muscle length.By fitting the neutral position of the S-shape on theangle axis, the level of muscle shortening can bemeasured in degrees (LENGTH, see Figure 4 : shift A).For a left-right comparison of the curves, absence ofEMG activity is required . All parameters are summa-rized in Table 1.
Validation StudyTwo nonimpaired control subjects (male, 36 yrs;
female, 45 yrs) were measured by means of FFRM andTAD.
Ten subjects with a spastic hemiplegia wereincluded in the study. Inclusion criteria were: 1)voluntary movement of the lower limb using flexor andextensor synergies, as on stage 3 on the Fugl-MeyerMotor Assessment Scale (29) ; 2) involuntary extensorsynergy in supine position in the hemiplegic lower limb;3) equinus position of the foot in barefoot walkingduring the swing phase ; 4) ability to walk outdoors ; 5) aminimum of 12 mo since the onset of the spastichemiplegia. The use of a walking aid and/or an
SUB=subject; DIAGN=diagnosis ; STROKE=first ischemic or hemorrhagicstroke of a cerebral hemisphere; CC=contusio cerebri ; CP=cerebral palsy;DUR=duration since onset in years ; ASHW=Ashworth score.
ankle-foot orthosis was allowed . Full consent, accordingto the declaration of Helsinki, was obtained from thesubjects . Their characteristics and medical diagnoses aresummarized in Table 2. Their mean age was 47 .7 yrs(range 25-67), and the average time from onset to thefirst session was 10 .6 yrs (range 6-18).
RESULTS
Characteristics of the Apparatus and MeasurementProcedure
After a period of training, the staff were easily ableto perform both FFRM and TAD measurements within30 min.
Free Frequency Repetitive MovementTable 3 gives a summary of the results of
measurements of 15 sessions (5 sessions a day at 1-wkintervals) in the 2 controls . As plantarflexion of theankle in a sitting position occurs with the aid of gravity,the VMA levels of the GM are low . No learning effectswere noticed . The left side showed a lower productscore than the right side (the subjects were dextral), butthe VMA of the TAM was slightly higher . Differencesbetween the right and the left side are also indicated inthe table.
Torque Angle DiagramInitially, measurements were carried out to estab-
lish the accuracy of the instrument . With an emptyfootplate, after correcting for the effect of gravity, a flat

320
Journal of Rehabilitation Research and Development Vol . 35 No . 3 1998
Table 3.Free frequency repetitive movement data from nonimpaired control subjects.
Right Side Left SideVariable Mean (SD) Mean (SD) P
SUB AFREQ Hz 2 .55 0 .35 2 .31 0 .15 **ROM 31 .07 3 .77 32 .27 6 .13 NSPS 4268 .53 619 .73 4127 .47 564 .35 NSTAM.VMA MV 261 .47 29 .66 273 .00 22 .87 NSROP % 97 .06 9 .16TAM.CC MV 0.00 0 .00 0 .00 0 .00 NS
TAM.MMA % 8 .79 2 .37 2 .52 0 .89 **
GM.VMA MV 55 .20 11 .37 14 .40 5 .73 **
GM.RC % 3 .39 1 .17 2 .98 0 .29 NSGM .CC MV 9 .87 3 .87 8 .33 1 .05 NSGM.MMA % 16 .82 4 .57 28 .09 7 .97 **
SUB BFREQ Hz 1 .92 0.06 1 .85 0.10 *
ROM 29 .13 4.03 24 .07 4.99 **
PS 3268 .40 448 .96 2617 .07 526.37 **
TAM .VMA MV 142 .53 15 .40 157 .40 22.35 *
ROP % 92 .38 16.63TAM .CC MV 0 .00 0.00 0 .00 0.00 NSTAM .MMA % 3 .97 0.68 3 .10 1 .96 NSGM .VMA MV 16 .07 1 .94 14 .73 5 .27 NSGM.RC % 10 .94 1 .75 8 .94 2.27 *GM.CC MV 16 .07 1 .94 14 .73 5 .27 NSGM.MMA % 17 .84 7 .36 16 .60 8 .54 NS
Each subject (SUB) underwent 15 sessions ; TAM=tibialis anterior muscle ; GM=gastrocnemius muscle ; P=P-valuepaired T.-test : *=P<0 .05 ; **=P=<0 .01 . Explanation of variables : see Table 1.
horizontal line was recorded . With a weight of 1 kg,similar to that of an average foot, the effect of inertiawas studied. Within the range of 0 .09-0.83 Hz and aROM of 51°, a maximum variation of 0 .5 Nm wasrecorded . Online recordings (with corrections for grav-ity) revealed a noise of 1 .5° and 0 .5 Nm caused by theAID-conversion of the signals in the microcomputer.The influence of the subject's sitting position and thealignment of the ankle axis were also determined : onlyserious misalignment of the ankle axis influenced therecordings.
Subsequently, experiments were conducted withcontrols . No difference in TAD was found between theright and left side (Figure 5 as compared with Figure4) . In measurements on 5 different days at an angle of70° (i .e ., 20° dorsiflexion), a maximum difference of 1Nm was recorded (within-subject variance and error ofmeasurement) . No effect of the frequency of movementon the hysteresis curve (range 0 .08-0.80 Hz), represent-
ing the viscous stiffness, was found in this range offrequencies (16).
Measurements in ControlsOur first hypothesis was that parameters expressing
abnormal muscle activation would be low innonimpaired subjects . This was confirmed in the twocontrols (Table 3) for all excess parameters . EMGactivity could only be recorded in shortening muscles.No signs of abnormal muscle activation (DSR or TSR)were found (Figure 3).
Measurements in Hemiplegic SubjectsComparison of the Affected and the Unaffected Sides
The second hypothesis assumes that differences areexpected to be found between the hemiplegic andunaffected side.
Excess symptoms : both the hemiplegic and theunaffected side showed some TSR completely absent in

321
BECHER et al. Measurement of Impaired Muscle Function
the controls (Table 4) . Minimal muscle activity waselevated, as expected . The level of co-contraction wasunexpectedly low, and did not exceed the values ofcontrols (15+'5 µV).
Deficit symptoms : as expected, a deficit in perfor-mance and voluntary muscle activation during FFRMwas found for all parameters on the hemiplegic side(p<0.01, see Table 5).
Table 4.Muscle activation in 10 subjects with : hemiplegia excesssymptoms .
t
1
I t140
130
120
110
100
90
80
70ANGLE (DEG)
10_
8_
6_
4-
z 2-W -O 0-
-2_
-4 -
-6 -
-8-
TAD HSmean
(SD)HS .A US
mean
(SD)mean (SD)
FKGM DSR pV 0.1 (0 .6) 0 .2 (0 .4) 1 .1 (1 .7)GM TSR pV 1 .9 (0 .7) 1 .1 (0.6) 1 .5 (0 .7)SM DSR µV 0.8 (0 .8) 0 .3 (0.9) 1 .0 (1 .8)SM TSR
EK
0V 4 .4 (6.5) 1 .6 (0 .6) 5 .6 (5 .4)
GM DSR pV 0 .2 (1 .2) 0 .1 (0 .7) 0.7 (1 .1)GM TSR pV 4 .7 (7 .7) 2.8 (3 .7) 3 .3 (4.2)SM DSR p.V 0 .9 (1 .2) 0.1 (0 .3) 0.1 (0 .7)SM TSR
FFRM
0V 5 .6 (9 .7) 2.9 (4 .0) 3 .8 (2 .7)
GM MMA % 18 .7* (28) 2 .9 (8 .6) 10 .5 (6 .3)GM RC % 30.0 (83) 6 .4 (10.8) 7 .1 (5 .3)GM CC 0V 2 .6* (2 .8) 3 .6 (6 .3) 11 .3 (7 .9)TAM MMA % 33 .8* (26.3) 35 .4 (19 .9) 10 .6 (7 .0)TAM CC pV 5 .1* (7 .4) 3 .4 (6 .1) 13 .3 (9 .5)
FK=flexed knee ; EK=extended
knee ; HS=hemiplegic side ;HS .A=hemiplegic side after anaesthesia ; US=unaffected side ; TAD=torqueangle diagram ; FFRM=free frequency repetitive movement . Explanation ofthe parameters ; see Table I . *=P <0.05 paired T-Test : HS/US . Limitationsin the capacity of the computer made it impossible to make FFRMrecordings of the soleus muscle as well.
Table 5.Muscle activation in 10 subjects with : hemiplegia deficitsymptoms.
HS HS .A USFFRM mean
(SD) mean (SD) mean (SD)
PS 1038 (788) 971 (887) 2980 (1029)FREQ Hz 0 .80 (0 .15) 0.78 (0 .28) 1 .08 (0 .32)ROM 21 (14) 21 (12) 50 (20)TA VMA pV 53 (45) 58 (61) 166 (26)ROP % 25 (15) 28 (33)
HS=hemiplegic side; HS .A=hemiplegic side after tibial nerve anaesthesia;US=unaffected side; FFRM=free frequency repetitive movements.Parameters : see Table 1 .
Figure 5.Torque angle diagrams of the ankle of a nonimpaired subject ; nosurface EMG activity was recorded.
Muscle StiffnessDifferences in muscle stiffness (STIFF) between
the hemiplegic and unaffected sides were not significantand showed a large between-subject variance (Table 6).However, in subjects 2, 4, 7, 9, and 10, a significantincrease (>2 SD) in stiffness on the hemiplegic side wasfound. Furthermore, stiffness was significantly increasedin the group of subjects with an Ashworth spasticityscore of 3, compared to those with an Ashworth scoreof 2.
Muscle LengthA shortened SM on the hemiplegic side, compared
with the unaffected side, was found in nine subjects(mean 9.8°) and both a shortened SM and a shortenedGM (mean 6.8°) in eight (Table 7). The presence of ashortened muscle showed no correlation with theparameters of muscle stiffness, excess symptoms, orAshworth score . The second hypothesis was thusconfirmed for all four groups of parameters, except forthe parameter of co-contraction.
Comparison of Muscle Function before and afterLocal Anaesthesia of the Tibial Nerve
The third hypothesis assumes a decrease in excessparameters of muscle activation, while muscle stiffnessremains unchanged . This hypothesis has been con-firmed: after local anaesthesia of the TN, all excesssymptoms decreased, as was expected (Table 4) . Withregard to deficit symptoms, seven subjects deterioratedin performance, and two improved (Table 8).
322
Journal of Rehabilitation Research and Development Vol . 35 No . 3 1998
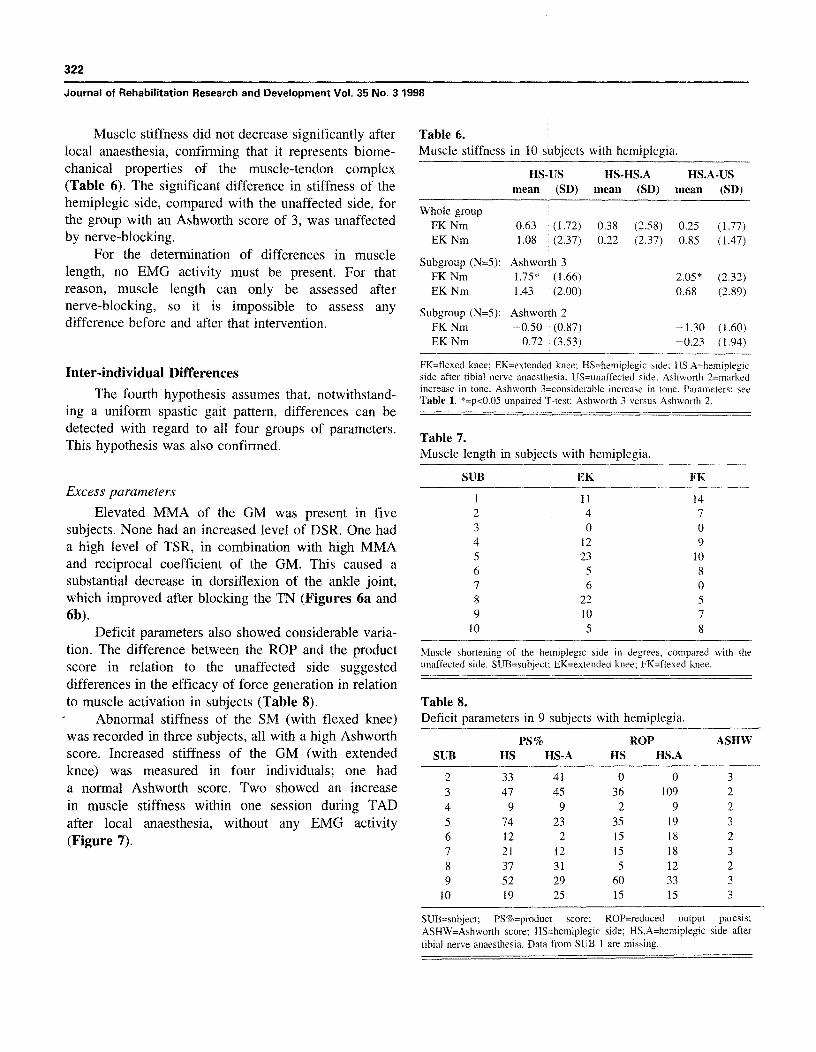
Muscle stiffness did not decrease significantly after
Table 6.local anaesthesia, confirming that it represents biome-
Muscle stiffness in 10 subjects with hemiplegia.chanical properties of the muscle-tendon complex(Table 6) . The significant difference in stiffness of thehemiplegic side, compared with the unaffected side, forthe group with an Ashworth score of 3, was unaffectedby nerve-blocking.
For the determination of differences in musclelength, no EMG activity must be present . For thatreason, muscle length can only be assessed afternerve-blocking, so it is impossible to assess anydifference before and after that intervention.
Inter-individual Differences
The fourth hypothesis assumes that, notwithstand-ing a uniform spastic gait pattern, differences can bedetected with regard to all four groups of parameters.This hypothesis was also confirmed.
Excess parameters
Elevated MMA of the GM was present in fivesubjects . None had an increased level of DSR . One hada high level of TSR, in combination with high MMAand reciprocal coefficient of the GM. This caused asubstantial decrease in dorsiflexion of the ankle joint,which improved after blocking the TN (Figures 6a and6b) .
Deficit parameters also showed considerable varia-
HS-US
HS-HS .A HS .A-USmean (SD)
mean
(SD) mean (SD)
Whole groupFK Nm 0 .63 (1 .72)
0 .38
(2 .58) 0 .25 (1 .77)EK Nm 1 .08 (2 .37)
0 .22
(2.37) 0 .85 (1 .47)
subgroup (N=5) :
Ashworth 32 .05* (2 .32)FK Nm 1 .75* (1 .66)
EK Nm 1 .43 (2 .00) 0 .68 (2 .89)
Subgroup (N=5):FK Nm
Ashworth 2-1 .30 (1 .60)-0.50 (0 .87)
EK Nm 0.72 (3 .53) -0.23 (1 .94)
FK=flexed knee ; EK=extended knee ; HS=hemiplegic side ; HS .A=hemiplegicside after tibial nerve anaesthesia ; US=unaffected side . Ashworth 2=markedincrease in tone. Ashworth 3=considerable increase in tone . Parameters : seeTable 1 . *=p<0 .05 unpaired T-test: Ashworth 3 versus Ashworth 2.
Table 7.Muscle length in subjects with hemiplegia.
SUB EK FK
1 11 142 4 73 0 04 12 95 23 106 5 87 6 08 22 59 10 7
10 5 8
tion. The difference between the ROP and the product
Muscle shortening of the hemiplegic side in degrees, compared with the
score in relation to the unaffected side suggested
unaffected side . SUB=subject ; EK=extended knee; FK=flexed knee.
differences in the efficacy of force generation in relationto muscle activation in subjects (Table 8) .
Table 8.Abnormal stiffness of the SM (with flexed knee)
Deficit parameters in 9 subjects with hemiplegia.
PS% ROP ASHWSUB HS HS-A HS HS.A
2 33 41 0 0 33 47 45 36 109 24 9 9 2 9 25 74 23 35 19 36 12 2 15 18 27 21 12 15 18 38 37 31 5 12 29 52 29 60 33 3
10 19 25 15 15 3
SUB=subject ; PS%=product score;; ROP=reduced output paresis;ASHW=Ashworth score; HS=hemiplegic side ; HS .A=hemiplegic side aftertibial nerve anaesthesia . Data from SUB I are missing.
was recorded in three subjects, all with a high Ashworthscore . Increased stiffness of the GM (with extendedknee) was measured in four individuals ; one hada normal Ashworth score . Two showed an increasein muscle stiffness within one session during TADafter local anaesthesia, without any EMG activity(Figure 7) .

323
BECHER et al . Measurement of Impaired Muscle Function
Muscle LengthThe SM was shortened in nine subjects, the GM in
eight (Table 7) . A shortened GM was always accompa-nied by a shortened SM . No correlation was foundbetween muscle shortening and excess symptoms .
100%
soSEGM : 18
- FRED : .75 f .19 HzROM : 7±2degSCORE : 252 deg
o-
I
DISCUSSIONTAM
MAX : 20 uVMIN
: 17 uV
aw
We formulated four hypotheses . The first assumesthat parameters expressing abnormal muscle activationwould be low in nonimpaired subjects . This hypothesiswas confirmed. The second hypothesis assumes thatdifferences between the hemiplegic and the unaffectedside are expected to be found in all four groups ofparameters (i .e ., excess symptoms, deficit symptoms,muscle stiffness, and muscle length) . This hypothesiswas confirmed for most parameters . Unexpectedly, boththe hemiplegic and the unaffected sides showed someTSR. Also unexpected was the low level of co-contraction of the GM, probably indicating that theclinical significance of this phenomenon is limited.
The third hypothesis was also confirmed : afternerve-blocking, parameters expressing abnormal muscleactivation decreased, while parameters expressingmuscle stiffness remained unchanged. Only excesssymptoms were influenced by TN local anaesthesia.
The fourth hypothesis assumes that between-subject differences are to be expected. Differences werefound with regard to disturbed muscle activation,muscle stiffness, and muscle length . This supports theproposed classification of muscle dysfunction inUMNS . No signs were found of an increased level ofDSR. Undoubtedly, this was due to the conditions of themeasurements : the maximal angular velocity of 30°/sand the sinusoidal shape of the imposed movements(30) .
The results are discussed according to the proposedclassification:
Changes in Muscle ActivationThe excess parameters, derived from the measure-
ments, showed specific and coherent changes after localanaesthesia of the TN . The parameters expressing TSRin TAD and MMA in FFRM were elevated on thehemiplegic side, and diminished after nerve-blocking.However, the product score improved slightly in onlytwo subjects . This raises the question of whether thenegative influence of stretch reflexes on voluntarymuscle function has been overrated .
0
I
t I I I I 4 I
100% —
7 J
GM
MAX
: 110 uVMIN
: 94 uV
i
I
I
I I
Figure 6a.Report of an FFRM test of a subject on the hemiplegic side beforelocal anaesthesia of the TN . TAM=tibialis anterior muscle;GM=gastrocnemius muscle ; SEGM=number of segments of move-ment ; FREQ=frequency ; ROM=range of motion ; Score=productscore; X-axes : One and a half cycles of movement (dorsiflexion-plantarflexion—dorsiflexion) . Y-axes : top, ankle movement in de-grees . Mean values of 18 cycles calculated, 1 SD plotted : only 7degrees of movement present ; middle, the integrated (smoothedrectified) EMG of the TAM is represented : 100 percent mean IEMGactivity is set to 40 p.V ; almost continuous activation of the TAM ispresent ; bottom, the IEMG activity of the medial head of the GM isshown : 100 percent is the mean maximal IEMG activity ; a high levelof continuous activation of the GM is present.
Deficit symptoms, expressed in ROP and theproduct score, were responsible for low performanceduring FFRM. Although all subjects were scored atstage 3 of the Fugl-Meyer Motor Assessment Scale,there was a remarkable difference between the perfor-mance of subjects during FFRM . The FFRM testtherefore seems to be a sensitive method of measuringvoluntary muscle performance . Differences between theROP and the product score, both expressed as apercentage of the value of the unaffected side (Table 8),support the assumption that the EMG-force relationshipin some subjects is disturbed (5,31,32).
After local anaesthesia of the TN, the meanproduct score of the hemiplegic side during FFRMshowed a slight decrease . However, the individualscores showed either an increase or a decrease inproduct score performance, which was related in oneperson with an elevated reciprocal coefficient of theGM. This parameter might be able to predict the effect
0S7
W
0

324
Journal of Rehabilitation Research and Development Vol . 35 No . 3 1998
isor
0
100%
SEGM :23- EREO :1 .07± .29 Hz
ROM : 15 ± 3 degSCORE 1742 deg
0
i t t
TAMMAX : 49 uVMIN
: 19 uV
GMMAX : 21 uVMIN
: 18 uV
Figure 6b.Report of an FFRM test of a subject on the hemiplegic side afterlocal anaesthesia of the TN . TAM=tibialis anterior muscle;GM=gastrocnemius muscle; SEGM=number of segments of move-ment ; FREQ=frequency ; ROM=range of motion ; Score=productscore ; X-axes : one and a half cycles of movement (dorsiflexion-plantarflexion–dorsiflexion) ; Y-axes : top, ankle movement in de-grees ; mean values of 23 cycles calculated: 15 degrees of movementregistered ; middle, the integrated {smoothed rectified) EMG of theTAM : 100 percent mean IEMG activity is set to the mean maximalactivity (49 pV) ; a decrease in continuous activation of the TAM ispresent, and now phasic activity is present ; bottom, the IEMGactivity of the medial head of the GM is shown in the same way(100 percent is set to 40 0V) : also, a decreased continuous activationof the GM is present.
of nerve-blocking in the treatment of spasticity of theGM and the SM.
Muscle Stif less
Muscle stiffness, measured by comparing theposition of the hysteresis curve on the torque axis of theaffected side with the unaffected side, showed a goodrelationship with the clinical Ashworth score . As musclestiffness remained unchanged after blocking the TN, thepathophysiological origins of spasticity and elevatedmuscle stiffness are likely to be different.
Increased stiffness without EMG activity afterlocal nerve-blocking, and the absence of dorsiflexion ofthe foot in gait, in spite of EMG activity of the TAMand without co-activation of the SM and GM, have alsobeen reported in other studies (3,6) . The initial decreasein muscle stiffness immediately after nerve-blocking(Figure 7) suggests, nevertheless, an influence of neuralactivity . However, muscle stiffness seems to be inde-
Figure 7.Torque angle diagram of the ankle in the hemiplegic side 30 minafter local anaesthesia of the TN. GM=gastrocnemius muscle;SM=soleus muscle ; TAM=tibialis anterior muscle ; solid lines : beforenerve-blocking ; dotted lines : after nerve-blocking ; Increase in torquelevel is found after local anaesthesia without surface EMG activity.
pendent of muscle activation, recorded with surfaceEMG. The nature of this phenomenon is not clear.
Muscle ShorteningAs was expected, the measurements objectified the
presence of a shortened SM and/or GM in most, but notall subjects . This finding is in accordance with clinicalexperience . The method of measurement, comparing thehysteresis curve of the affected side with that of theunaffected side, allows only an estimation of the degreeof shortening, as the level of applied external forceinfluences the measurement of muscle shortening whenthere is a combination of elevated stiffness and shorten-ing of a muscle.
In accordance with the literature, we found aconsiderable between-subject variance of TAD in theankle, associated with age and sex (33) . No relationshipwas found between excess parameters, muscle stiffness,and muscle shortening . As all subjects had a stablehemiplegia for at least 6 years, spasticity could haveoccurred in the first years after any stroke, causing themuscle shortening . It remains unclear why muscleshortening occurs in some subjects an not in others.
Measuring differences in muscle dysfunction inhemiplegic persons may offer an indication for the
325
BECHER et al . Measurement of Impaired Muscle Function
selection of therapy . Spasmolytic drugs to enhancepresynaptic inhibition in the spinal cord, such asbaclofen, are effective in those with excess symptoms.Elevated muscle stiffness could be influenced bydantrolene natrium . When muscle shortening is alreadypresent, high-heeled walking or surgical lengthening ispossible . The results of this study show that it ispossible to measure different types of muscle dysfunc-tion, which offers a potential for the objective evalua-tion of therapy.
However, no definite conclusions can be drawnfrom this study . Only a small number of persons wasstudied, and although their clinical characteristics weresimilar, their spastic hemiplegia had different causes.Larger groups of subjects with a homogeneous medicalbackground need to be studied to confirm the assumedheterogeneity in muscle impairments.
REFERENCES
Lance JW. Symposium synopsis . In : Feldman RG, Young RR,
Koella WP, editors . Miami : Symposia Specialists ; 1980. p.
485—500.2.
Ashworth B . Preliminary trial of carisoprodol in multiple
sclerosis . Practitioner 1964 ;192 :540—2.
3.
Sloan RL, Sinclair E, Thompson J, Taylor S, Pentland B.Inter-rater reliability of the modified Ashworth Scale forspasticity in hemiplegic patients . Int J Rehabil Res1992 ;15 :158—61.
4. Bohannon RW, Smith MB . Interrater reliability of a modified
Ashworth scale of muscle spasticity . Phys Ther 1987;
67 :206—7.S . Fellows SJ, Kaus C, Ross HF, Thilmann AF . Agonist and
antagonist EMG activation during isometric torque develop-ment at the elbow in spastic hemiparesis . ElectroencephalogrClin Neurophysiol 1994 ;93 :106—12.
6. Thilmann AF, Fellows Si . The time-course of bilateral
changes in the reflex excitability of relaxed triceps suraemuscle in human hemiparetic spasticity . J Neurol 1991;
238 :293—8.7. Thilmann A, Fellows SJ . The mechanism of spastic muscle
hypertonus . Brain 1991 ;114 :233—44.
8. Sahrmann SA, Norton B .I . The relationship of voluntary
movement to spasticity in the upper motor neuron syndrome.Ann Neurol 1977 ;2:460—5.
9. McLellan DL . Co-contraction and stretch reflexes in spasticity
during treatment with baclofen . J Neurol Neurosurg Psychiatr
1977,40 :1—30.
10. Knutsson E, Martensson A . Dynamic motor capacity in
spastic paresis and its relation to prime motor dysfunction,spastic reflexes and antagonist co-activation . Scand J Rehabil
Med 1980 ;12 :93—106 .
11. Knutsson E, Richards C . Different types of disturbed motor
control in gait of hemiparetic patients . Brain 1979 ;102 :405—
30.12. Levin MF, Hui-Chan C. Ankle spasticity is inversely corre-
lated with antagonist voluntary contraction in hemiparetic
subjects . Electromyogr Clin Neurophysiol 1994 ;34 :415—25.
13. Bohannon RW, Smith MB . Assessment of strength deficits ineight paretic upper extremity muscle groups of stroke patients
with hemiplegia. Phys Ther 1987 ;67 :522—5.
14. Katz RT . Rymer WZ. Spastic hypertonia : mechanisms and
measurement . Arch Phys Med Rehabil 1989 ;70 :144—55.
15. Thilmann AF, Fellows Si, Ross HF . Biomechanical changes
at the ankle joint after stroke . J Neurol Neurosurg Psychiatr
1991 ;54 :134—9.
16. Lehmann IF, Price R, deLateur BJ, Hinderer S, Traynor C.
Spasticity : quantitative measurements as a basis for assessingeffectiveness of therapeutic intervention. Arch Phys Med
Rehabil 1989 ;70 :6—15.17. Sinkjaer T, Magnussen I. Passive, intrinsic and reflex-
mediated stiffness in the ankle extensors of hemiparetic
patients . Brain 1994 ;117 :355—63.18. Halar EM, Stolov WC . Gastrocnemius muscle belly and
tendon length in stroke patients and able-bodied persons . ArchPhys Med Rehabil 1978 ;59 :476—84.
19. Hillstrom HI, Perlberg G, Siegler S, Sanner WH. Objective
identification of ankle equinus deformity and resultingcontracture . J Am Podiatric Med Assoc 1991 ;81 :519—24.
20. Tardieu G, Tardieu C, Colbeau-Justin P, Lespargot A . Muscle
Hypoextensibility in children with cerebral palsy : II. therapeu-
tic implications . Arch Phys Med Rehabil 1982 ;63 :103—7.
21. Shiavi R, Green N. Ensemble averaging of locomotor
electromyographic patterns using interpolation . Med Biol Eng
Comput 1983 ;21 :573—8.22. Inman VT. The joints of the ankle . Baltimore : Williams &
Wilkins ; 1976.23. Fronk C, Niesing R . Apparatus for measuring the functional
capacity of the knee extensors and flexors . Med Biol EngComp 1983 ;21 :764—7.
24 Gottlieb GL . Hyper-reflexia and disordered voluntary move-ment. In: Thilmann AF, Burke DJ, Rymer WZ, editors.Spasticity : mechanisms and management . Berlin : Springer-
Verlag ; 1993 . p . 155—66.
25. Ibrahim IK, Berger W, Trippel M, Dietz V . Stretch-inducedelectromyographic activity and torque in spastic elbowmuscles ; differential modulation of reflex activity in passiveand active motor tasks . Brain 1993 ;116 :971—89.
26. Gottlieb G, Agerwal GC . Dynamic relationship betweenisometric muscle tension and the electromyogram . J ApplPhysiol 1971 ;30 :345—51.
27. Gottlieb GL, Mykiebust BM, Penn RD, Agarwal GC.Reciprocal excitation of muscle antagonists by the primaryafferent pathway . Exp Brain Res 1982 ;46 :454—6.
28. Dewald JP, Pope PS, Given JD, Buchanan TS, Rymer WZ.Abnormal muscle coactivation patterns during isometrictorque generation at the elbow and shoulder in hemipareticsubjects . Brain 1995 ;118 :495—510.
29. Fugl-Meyer AR, Jaasko LLI. The post-stroke hemiplegic
patient: I . a method for evaluation of physical performance.
Scand J Rehabil Med 1975 ;7 :13—31 .

326
Journal of Rehabilitation Research and Development Vol . 35 No . 3 1998
30 . Rack P, Ross Hl^ IF . Ankle stretch reflexes in normal and 33 . Sepic S, Murray P, Mollinger LA . Strength and range ofspastic subjects . Brain 1984 ;107 :637—54 . motion in the ankle in two age groups of men and women.
31 . Berger W, Horstmann GA, Dietz V . Spastic paresis : impairedspinal reflexes and intact motor programs . J Neurol Neurosurg
Am J Phys Med 1986 ;65 :75—84.
Psychiatr 1988 ;51 :568—71 .
Submitted for publication February 27, 1997 . Accepted in
32 . Dietz V, Trippel MBW . Reflex activity and muscle toneduring elbow movements in patients with spastic paresis . AnnNeurol 1991 ;30 :767—79 . revised form September 30, 1997 .