Embed Size (px)
Citation preview
NASA
Technical Memorandum 107279
j //
Army Research Laboratory
Technical Report ARL-TR-1165
Measurement of Gear Tooth Dynamic Friction
Brian Rebbechi
DSTO, Aeronautical and Maritime Research Laboratory
Melbourne, Australia
Fred B. Oswald and Dennis E Townsend
Lewis Research Center
Cleveland, Ohio
Prepared for the
Seventh International Power Transmission and Gearing Conference
sponsored by the American Society of Mechanical Engineers
San Diego, California, October 6-9, 1996
National Aeronautics and
Space Administration
U.S. ARMY
RESEARCH LABORATORY
https://ntrs.nasa.gov/search.jsp?R=19970001588 2018-06-20T20:10:48+00:00Z

MEASUREMENTOF GEARTOOTHDYNAMICFRICTION
BrianRebbechiDSTO,AeronauticalandMaritime Research Laboratory
Melbourne, Australia 3207
Fred B. Oswald and Dennis P.Townsend
National Aeronautics and Space AdministrationLewis Research Center
Cleveland, Ohio 44135
ABSTRACT
Measurements of dynamic friction forces at the gear tooth con-
tact were undertaken using strain gages at the root fillets of two
successive teeth. Results are presented from two gear sets over a
range of speeds and loads. The results demonstrate that the friction
coefficient does not appear to be significantly influenced by the
sliding reversal at the pitch point, and that the friction coefficient
values found are in accord with those in general use. The friction
coefficient was found to increase at low sliding speeds. This agrees
with the results of disc machine testing.
INTRODUCTION
Friction between sliding surfaces at the gear tooth contact is usu-
ally the major source of power loss in gear transmissions. The coef-
ficient of friction is important for predicting scoring resistance and
surface durability of gears, and it is a critical parameter in the
design of traction drives.
The type of contact which exists in long-wearing gear systems is
termed elastohydrodynamic lubrication, where a thin film of lubri-
cant separates elastically deformed solids, and there is minimal sur-
face asperity contact. The existence of this film is possible because
of the very large increase in viscosity with pressure of the lubricant.
In the heavily loaded lubricated elastohydrodynamic contacts of
gear teeth the lubricant can undergo a rapid rise of pressure from
atmospheric to over one Giga Pascal (200 000 psi) in as little as
0. l millisecond. Atthe same time the fluid undergoes shearing which
leads to heat generation. Temperatures can reach several hundred
degrees Celsius. In addition, there are rapid variations in sliding
velocity and load as teeth pass along the line of contact. The very
complex rheoiogical behaviour of the fluid in these extreme condi-
tions precludes the use of steady-state (static) measurements for the
evaluation of fluid properties. Nearly all of the studies of this con-
tact phenomenon have been based on disc machines, where most of
the conditions existing at the tooth contact, other than the rapid varia-
tion of sliding speed and load, can be simulated by rolling discs
against each other with a speed mismatch to simulate gear tooth
sliding and rolling.
Comprehensive accounts of earlier experimental studies in
elastohydrodynamic lubrication are given by Dowson (1967) and
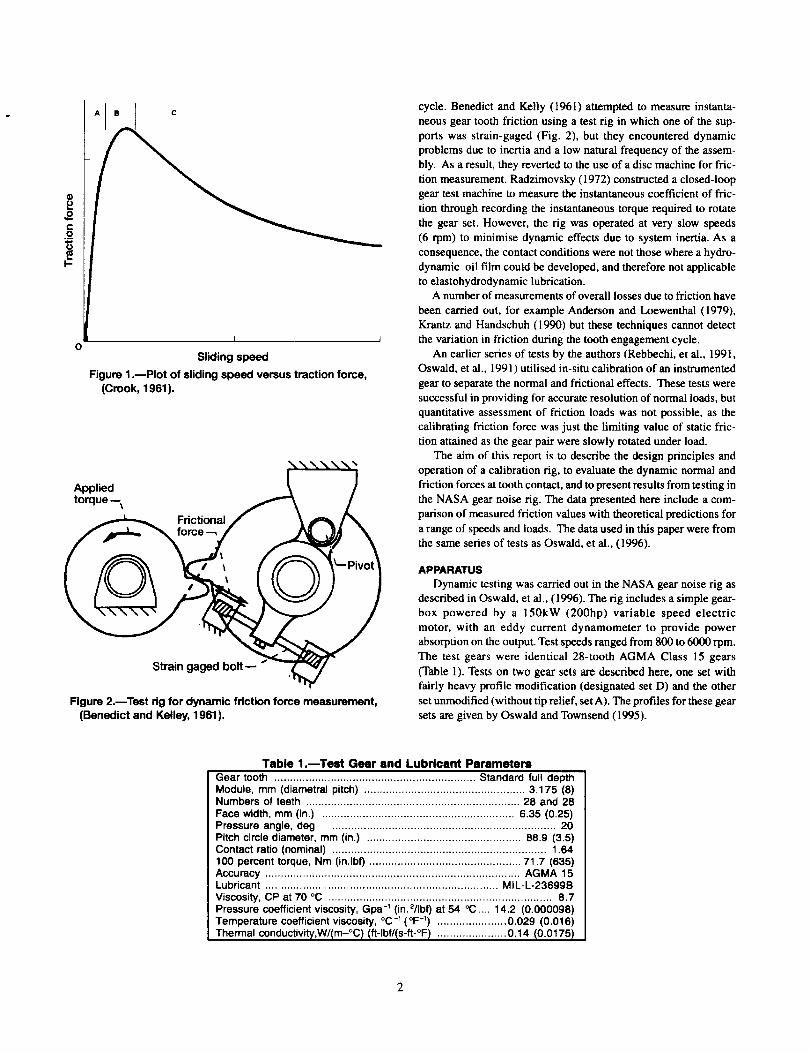
Dowson and Higginson (1966). Crook (1961 ) theoretically analysed
the friction and temperatures in the oil film, and derived the friction
versus sliding speed characteristic curve (Fig. l ). This curve shows
the dependence of friction on sliding velocity. This analysis assumed
that the oil film behaves as a Newtonian fluid with a viscosity
dependent only on pressure and temperature. He assumed the vis-
cosity variation with both temperature and pressure to be exponen-
tial with constant exponent coefficients.
The tests of Crook (196 l) were carried out at comparatively low
contact pressures (less than 0.59 GPa, 85 000 Ibf/in2). It soon
became apparent (Johnson and Cameron, 1967) that at high
pressures and low speeds, the assumption of an exponential increase
in viscosity predicted impossibly high tractions. Johnson and
Cameron (1967) identified two critical features -- a large reduction
in the rate of increase of viscosity with pressure above 0.7 GPa
(100 000 lbf/in.2), and a ceiling to the traction coefficient largely
independent of contact pressure, rolling speed and disc tempera-
ture. They advanced a hypothesis of plastic shear when a critical
stress was reached. Townsend 0968) summarised similar findings
by other researchers, and stated that without such reductions in the
viscosity coefficient, that the lubricant would become stronger than
the bearing material.
Tevaarwerk (1985a) describes the development of a constitutive
lubricant friction model for traction drives that incorporates a vis-
coelastic and plastic-like dissipative element. For conditions of high
slide-roll ratios such as gear contacts this model was simplified by
the omission of the elastic response of the fluid (Tevaarwerk, 1985b).
Data from rig tests were used to determine the lubricant parameters.
The experimental measurement of friction has usually utilised
disc machines, or in some instances, ball-testing. There have been
several attempts to measure the friction coefficient through the mesh
oP
oe-._O
I-
V
O
B C
I
Sliding speed
Figure 1 .mPIot of sliding speed versus traction force,(Crook, 1961).
Applied
torque--_ _ lFrictional f _/=%/\
Strain gaged bolt-- "
Figure 2.--Test rig for dynamic friction force measurement,(Benedict and Kelley, 1961 ).
cycle. Benedict and Kelly (1961) attempted to measure instanta-
neous gear tooth friction using a test rig in which one of the sup-
ports was strain-gaged (Fig. 2), but they encountered dynamic
problems due to inertia and a low natural frequency of the assem-
bly. As a result, they reverted to the use of a disc machine for fric-
tion measurement. Radzimovsky (1972) constructed a closed-loop
gear test machine to measure the instantaneous coefficient of fric-
tion through recording the instantaneous torque required to rotate
the gear set. However, the rig was operated at very slow speeds
(6 rpm) to minimise dynamic effects due to system inertia. As a
consequence, the contact conditions were not those where a hydro-
dynamic oil film could be developed, and therefore not applicable
to elastohydrodynamic lubrication.
A number of measurements of overall losses due to friction have
been carded out, for example Anderson and Loewenthal (1979),
Krantz and Handschuh (1990) but these techniques cannot detect
the variation in friction during the tooth engagement cycle.
An earlier series of tests by the authors (Rebbechi, et al., 1991,
Oswald, et al., 1991 ) utilised in-situ calibration of an instrumented
gear to separate the normal and frictional effects. These tests were
successful in providing for accurate resolution of normal loads, but
quantitative assessment of friction loads was not possible, as the
calibrating friction force was just the limiting value of static fric-
tion attained as the gear pair were slowly rotated under load.
The aim of this report is to describe the design principles and
operation of a calibration rig, to evaluate the dynamic normal and
friction forces at tooth contact, and to present results from testing in
the NASA gear noise rig. The data presented here include a com-
parison of measured friction values with theoretical predictions for
a range of speeds and loads. The data used in this paper were from
the same series of tests as Oswald, et al., (1996).
APPARATUS
Dynamic testing was carried out in the NASA gear noise rig as
described in Oswald, et al., (1996). The rig includes a simple gear-
box powered by a 150kW (200hp) variable speed electric
motor, with an eddy current dynamometer to provide power
absorption on the output. Test speeds ranged from 800 to 6000 rpm.
The test gears were identical 28-tooth AGMA Class 15 gears
(Table 1). Tests on two gear sets are described here, one set with
fairty heavy profile modification (designated set D) and the other
set unmodified (without tip relief, set A). The profiles for these gear
sets are given by Oswald and Townsend (1995).
Table 1.---Test Gear end Lubricant Parameters
Gear tooth ................................................................ Standard full depthModule, mm (diametral pitch) ................................................... 3.175 (8)Numbers of teeth .................................................................... 28 and 28Face width, mm (in.) ............................................................. 6.35 (0.25)Pressure angle, deg ....................................................................... 20Pitch circle diameter, mm (in.) ................................................. 88.9 (3.5)Contact ratio (nominal) .................................................................... 1.64100 percent torque, Nm (in.lbf) ................................................ 71.7 (635)Accuracy ................................................................................. AGMA 15Lubricant .......................................................................... MIL-L-23699BViscosity, CP at 70 °C ....................................................................... 8.7Pressure coefficient viscosity, Gpa -1 (in.2/Ibf) at 54 °C .... 14.2 (0.000098)Temperature coefficient viscosity, °C-1 (OF-1) ...................... 0.029 (0.016)Thermal conductivi_,W/Irn-°C I Ift-lbf/Is-ft-°F/ ...................... 0.14 10.01751
The lubricant used for the tests was synthetic turbine engine oil
(MIL-L-23699B) which at the mean temperature used in these tests
of 70 deg Celsius has an absolute viscosity of 8.7 cE
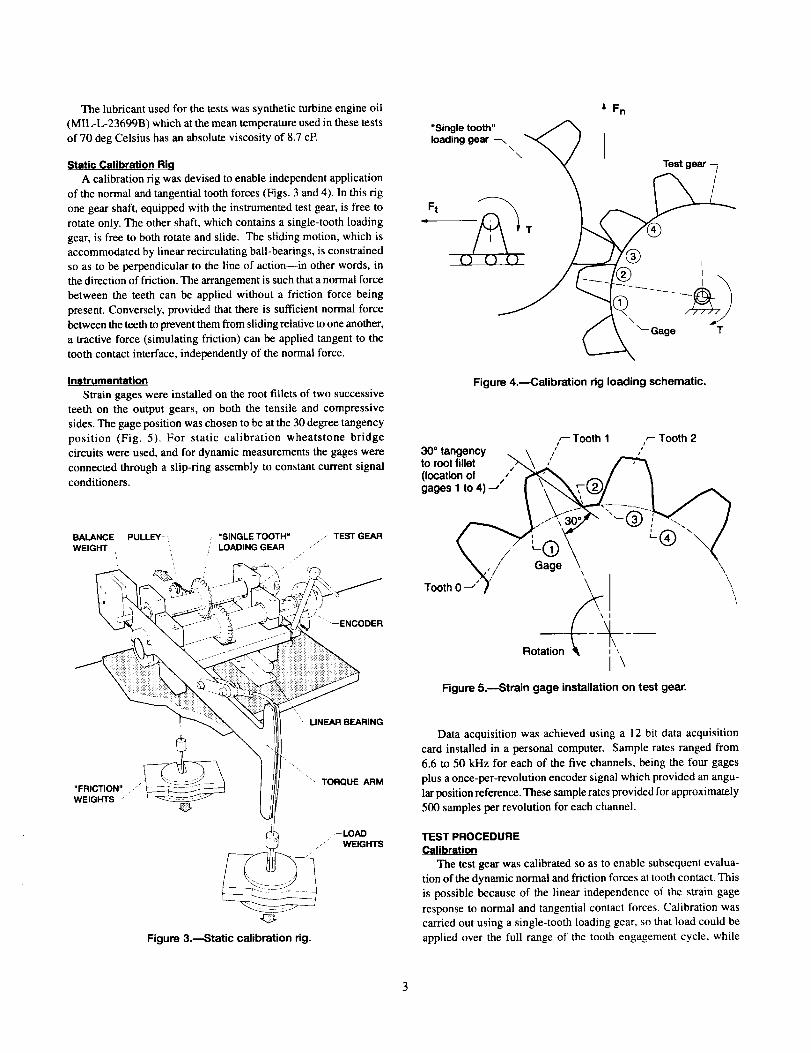
Static Calibration Riq
A calibration rig was devised to enable independent application
of the normal and tangential tooth forces (Figs. 3 and 4). In this rig
one gear shaft, equipped with the instrumented test gear, is free to
rotate only. The other shaft, which contains a single-tooth loading
gear, is free to both rotate and slide. The sliding motion, which is
accommodated by linear recirculating ball-bearings, is constrained
so as to be perpendicular to the line of action--in other words, in
the direction of friction. The arrangement is such that a normal force
between the teeth can be applied without a friction force being
present. Conversely, provided that there is sufficient normal force
between the teeth to prevent them from sliding relative to one another,
a tractive force (simulating friction) can be applied tangent to the
tooth contact interface, independently of the normal force.
Instrumentation
Strain gages were installed on the root fillets of two successive
teeth on the output gears, on both the tensile and compressive
sides. The gage position was chosen to be at the 30 degree tangency
position (Fig. 5). For static calibration wheatstone bridge
circuits were used, and for dynamic measurements the gages were
connected through a slip-ring assembly to constant current signal
conditioners.
BALANCE
WEIGHT
PULLEY r "SINGLE TOOTH"LOADING GEAR
•_ TEST GEAR/
, /L
--ENCODER
'- LINEAR BEARING
__-TORQUE ARM
__ _7 LOAD
./ EIGHTS
Figure 3._tatic calibration rig.
Ft
Fn
"Single tooth"
loading gear --_\
\
Test gear _
'Figure 4.--Calibration rig loading schematic.
,--Tooth 1 ,- Tooth 2i i
30 ° tangency . \ ,' ,'
to root fillet _-"_,.\ _
(;aOCaget;Ionof ,/ _X -- ' _
Rotation _ ,
I\Figure 5.---Strain gage installation on test gear.
Data acquisition was achieved using a 12 bit data acquisition
card installed in a personal computer. Sample rates ranged from
6.6 to 50 kHz for each of the five channels, being the four gages
plus a once-per-revolution encoder signal which provided an angu-
lar position reference. These sample rates provided for approximately
500 samples per revolution for each channel.
TEST PROCEDURE
Calibration
The test gear was calibrated so as to enable subsequent evalua-
tion of the dynamic normal and friction forces at tooth contact. This
is possible because of the linear independence of the strain gage
response to normal and tangential contact forces. Calibration was
carried out using a single-tooth loading gear, so that load could be
applied over the full range of the tooth engagement cycle, while
avoiding indeterminate load sharing from an adjacent tooth. The
torque loading was applied in four increments; 0, 57, 85 and
113 percent of 71.7 Nm torque. This procedure was carried out at
roll angle increments of 2 degrees from 10 to 32 degrees. One extra
reading was taken at 21 degrees because this is approximately the
pitch point of the gears. Once this "frictionless" calibration was
complete, the procedure was repeated using a constant torque load-
ing to prevent slip, and 2 traction (friction) loads of 100 and 190 N
(22.3 and 42.4 lbf).
The data were used to generate a tooth force influence coeffi-
cient matrix as described in the following section. This procedure is
similar to that described by Rebbechi, et al. 1991, but a significant
improvement is now possible in that the calibration rig described
here enables quantitative assessment of friction force in addition tonormal force.
An inverse check of the calibration procedure was then carried
out by engaging a conventional gear with the test gear, so that load
sharing between adjacent teeth was present.
Dynamic load measurement
Dynamic strains were recorded for the set A and set D gears
over 9 torque levels and four speeds (800, 2000, 4000, 6000 rpm).
After acquisition, the data were digitally resampled using linear
interpolation, at 1000 samples per revolution, and then synchro-
nously averaged to minimise non-synchronous components. The
resample rate is greater than the acquisition rate to prevent the
introduction of additional aliasing errors. The synchronously aver-
aged strain data were used to compute dynamic tooth forces.
The direct measurement of tractive and normal force using these
strain gages is expected to avoid the dynamic effects such as found
by Benedict and Kelley (1961). The limiting factor here will be the
natural frequency of the tooth itself in bending. A simple calcula-
tion shows this to be in excess of 10 kHz, well above the tooth
engagement frequency of 2,800 Hertz at the maximum test speed,
6000 rpm. Another possible dynamic effect is the interesting fea-
ture remarked on by Johnson and Cameron, (1967) and Tevaarwerk
(1985b) where the elastic compliance at the tooth contact in the
direction of the tractive force, can result in tangential elastic com-
pliance of similar order to that of the film itself. While this will
modify the apparent lubricant viscosity, it is not expected to affect
the measurement of friction force.
ANALYTICAL PROCEDURECalibration
The analytical procedure is an extension of the procedure
described in Rebbechi, et al., 1991. Measuring the strain outputs Sc
and S t of the gages mounted on the compressive and tensile sides
respectively enables resolution of the normal (Fn) and tractive (Ff)
tooth forces (Fig. 4), provided that the gage responses are linearly
independent. Using as an example the situation where one tooth is
loaded, the response of the compressive and tensile gages S c and S tcan be written as:
S c = allF n + al2Ff (1)
S t = a21F n + a22Ff (2)
or alternatively as:
{S} = [a]{F} (3)
where
and
{Sc}= (4){s} s,
{ Fn } (5){F}= Ff
the aij are then the influence coefficients. For example, a II is the
compressive strain due to a unit normal force F n and a12 is the com-
pressive strain due to a unit friction force Ff.
The strain influence coefficients are then evaluated by setting F n
and Ff in equations 1 and 2 alternately to zero. This is achieved in
the calibration rig (Figs. 3 and 4) by either applying a torque in the
absence of a tractive load (Ff = 0, Fig. 4), or by applying a constant
torque, sufficient to prevent slip, and then a tractive load. In the
latter case, it is assumed that the strain response of the tooth to the
applied loads is linear, and the torque results in a constant offset.The strains due to this offset are subtracted from the incremental
strains due to the tractive loading.
In the calibration rig the single-tooth gear was engaged with each
instrumented tooth on the test gear, and strains from all four gages
recorded. In this way the coefficients of a 4x4 matrix of ceefficients
can be constructed. By numerically simulating an additional instru-
mented tooth (Rebbechi, et al., 1991) the matrix becomes 6x6. The
inclusion of effects from the adjacent tooth is an essential prerequi-
site of evaluating tooth loads where there is load-sharing. This is
necessary because of the stress field in a gear, which is such that an
applied load on one tooth will result in strains not only on that tooth,
but also adjacent teeth. This effect wilt be more marked in the case
of thin-rim gears.
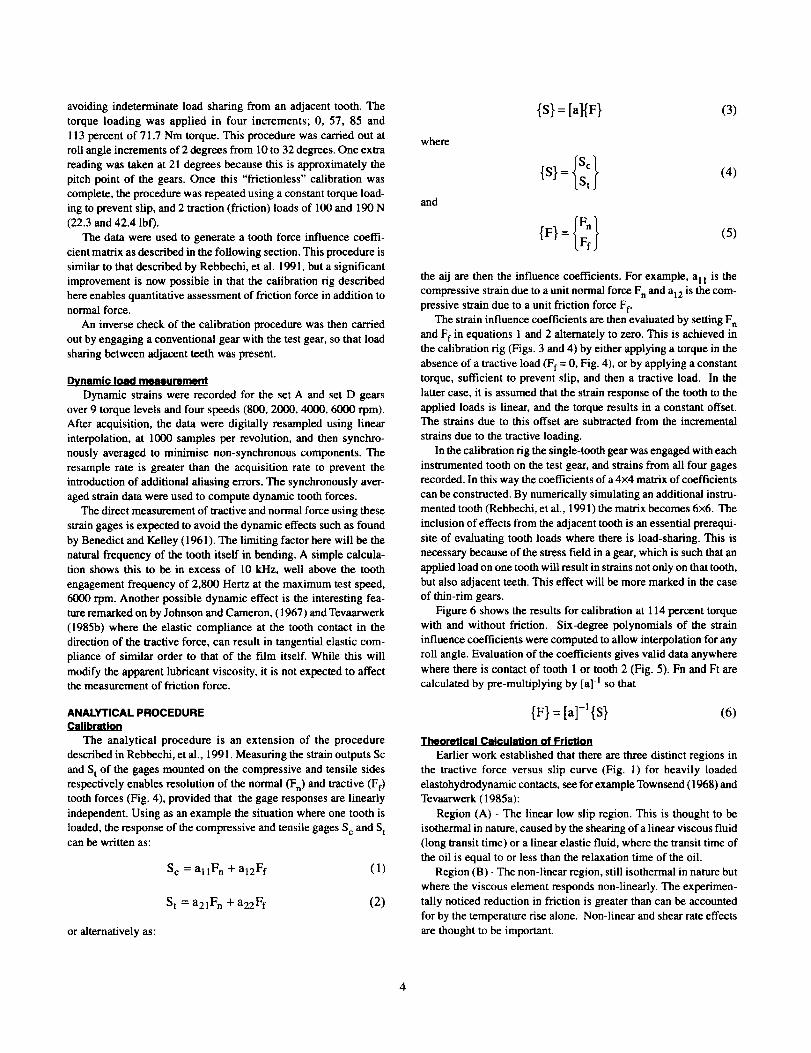
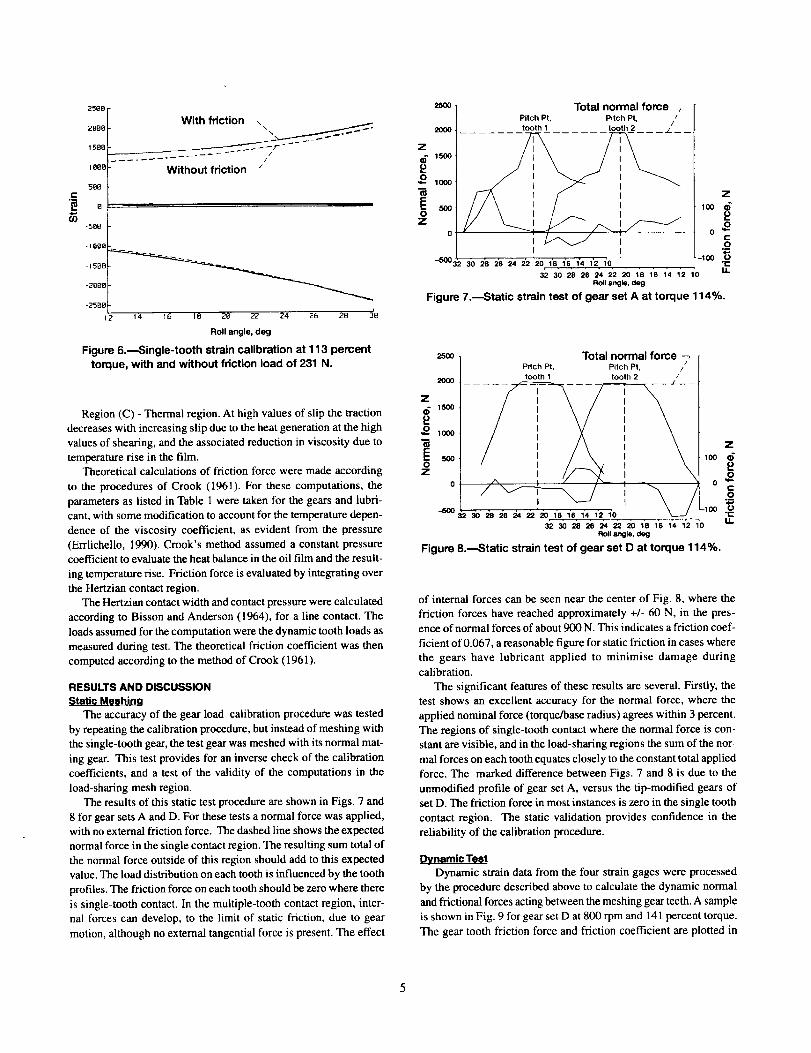
Figure 6 shows the results for calibration at 114 percent torque
with and without friction. Six-degree polynomials of the strain
influence coefficients were computed to allow interpolation for any
roll angle. Evaluation of the coefficients gives valid data anywhere
where there is contact of tooth 1 or tooth 2 (Fig. 5). Fn and Ft are
calculated by pre-multiplying by [a] -I so that
{F} = [a] -t {S} (6)
Theoretical Calculation of Friction
Earlier work established that there are three distinct regions in
the tractive force versus slip curve (Fig. 1) for heavily loaded
elastohydrodynamic contacts, see for example Townsend (1968) and
Tevaarwerk (1985a):
Region (A) - The linear low slip region. This is thought to be
isothermal in nature, caused by the shearing of a linear viscous fluid
(long transit time) or a linear elastic fluid, where the transit time of
the oil is equal to or less than the relaxation time of the oil.
Region (B) - The non-linear region, still isothermal in nature but
where the viscous element responds non-linearly. The experimen-
tally noticed reduction in friction is greater than can be accounted
for by the temperature rise alone. Non-linear and shear rate effects
are thought to be important.
4
C
25G8
2eee With fdction , __--'''_"1588 _ _ _f - _ _
i eee Without fdction /
588
0
-580
-16_0
-1588 __
-28_8
-25BB
12 t 4 16 18 28 22 24 26 28 Jb8
Roll angle, deg
Figure 6._Single-tooth strain calibration at 1 13 percenttorque, with and without fnction load of 231 N.
Region (C) - Thermal region. At high values of slip the traction
decreases with increasing slip due to the heat generation at the high
values of shearing, and the associated reduction in viscosity due to
temperature rise in the film.
Theoretical calculations of friction force were made according
to the procedures of Crook (1961). For these computations, the
parameters as listed in Table 1 were taken for the gears and lubri-
cant, with some modification to account for the temperature depen-
dence of the viscosity coefficient, as evident from the pressure
(Errlichello, 1990). Crook's method assumed a constant pressure
coefficient to evaluate the heat balance in the oil film and the result-
ing temperature rise. Friction force is evaluated by integrating over
the Hertzian contact region.
The Hertzian contact width and contact pressure were calculated
according to Bisson and Anderson (1964), for a line contact. The
loads assumed for the computation were the dynamic tooth loads as
measured during test. The theoretical friction coefficient was then
computed according to the method of Crook (1961).
RESULTS AND DISCUSSIONStatic Meshina
The accuracy of the gear load calibration procedure was tested
by repeating the calibration procedure, but instead of meshing with
the single-tooth gear, the test gear was meshed with its normal mat-
ing gear. This test provides for an inverse check of the calibration
coefficients, and a test of the validity of the computations in the
load-sharing mesh region.
The results of this static test procedure are shown in Figs. 7 and
8 for gear sets A and D. For these tests a normal force was applied,
with no external friction force. The dashed line shows the expected
normal force in the single contact region. The resulting sum total of
the normal force outside of this region should add to this expected
value. The load distribution on each tooth is influenced by the tooth
profiles. The friction force on each tooth should be zero where there
is single-tooth contact. In the multiple-tooth contact region, inter-
nal forces can develop, to the limit of static friction, due to gear
motion, although no external tangential force is present. The effect
25oo Total normal force /Pitch Pt, Pitch PL //tooth 1......... tooth 2 -- -- -- j_
I
0
I I-60°32 _ 2s 2'e 24 _. '_ t's 1'8 1'4 t'2 1'0
32 30 28 26 24 22 20 18 16 14 12 10
Roll angle, deg
Figure 7.---Static strain test of gear set A at torque 1 14%.
20o0
z1soo
O_- 1000
eO
Oz
z100 Q,_
t-
O
.e-
2s0o Total normal force _ rPftch Pt, Pilch Pt, // /
2000 tooth 1 tooth 2 /
_ooo iI Z
z o o o
1_ -e-
U.32 30 28 26 24 22 20 18 16 14 12 10
Roll angle, deg
Figure 8._tatic strain test of gear set D at torque 1 14%.
of internal forces can be seen near the center of Fig. 8, where the
friction forces have reached approximately +/- 60 N, in the pres-
ence of normal forces of about 900 N. This indicates a friction coef-
ficient of 0.067, a reasonable figure for static friction in cases where
the gears have lubricant applied to minimise damage during
calibration.
The significant features of these results are several. Firstly, the
test shows an excellent accuracy for the normal force, where the
applied nominal force (torque/base radius) agrees within 3 percent.
The regions of single-tooth contact where the normal force is con-
stant are visible, and in the load-sharing regions the sum of the nor-
mal forces on each tooth equates closely to the constant total applied
force. The marked difference between Figs. 7 and 8 is due to the
unmodified profile of gear set A, versus the tip-modified gears of
set D. The friction force in most instances is zero in the single tooth
contact region. The static validation provides confidence in the
reliability of the calibration procedure.
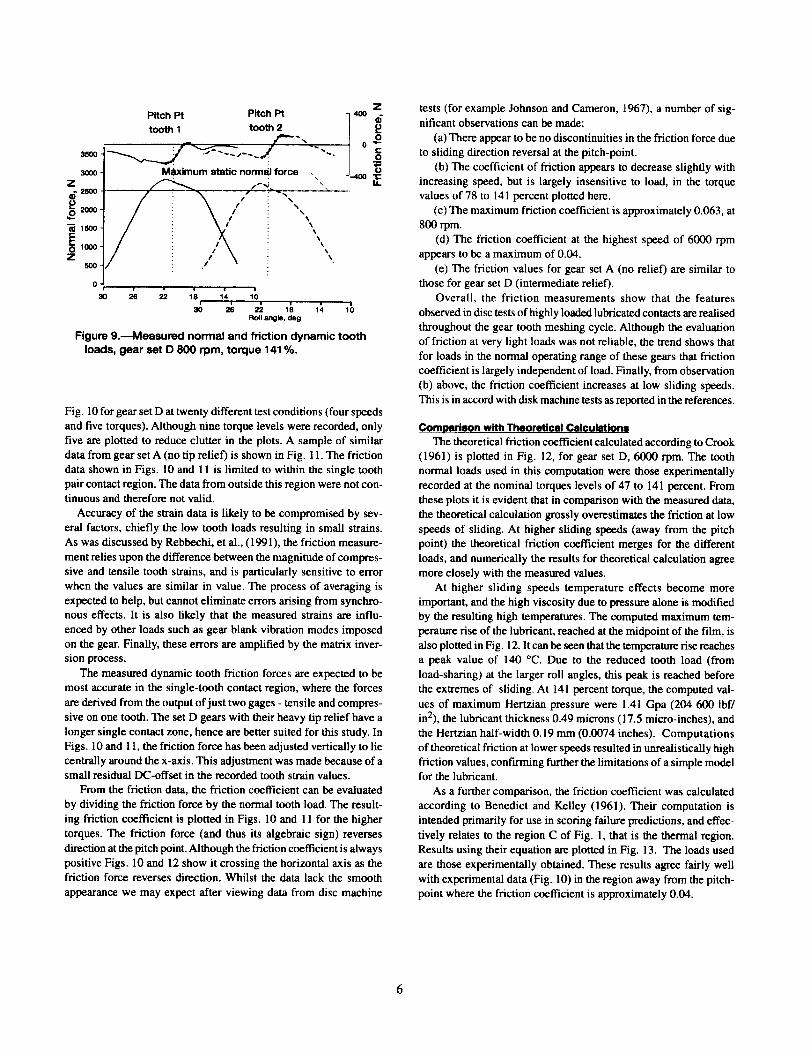
Dynamic Test
Dynamic strain data from the four strain gages were processed
by the procedure described above to calculate the dynamic normal
and frictional forces acting between the meshing gear teeth. A sample
is shown in Fig. 9 for gear set D at 800 rpm and 141 percent torque.
The gear tooth friction force and friction coefficient are plotted in
Pitch Pt Pitch Pt 1 4oo Z
tooth 1 tooth 2 /
aooo-I M_ximumstati-" c normal force _ ]_
':oJ/ . ,,,,aa £ d li 1;, lb
Roll al_lle, deg
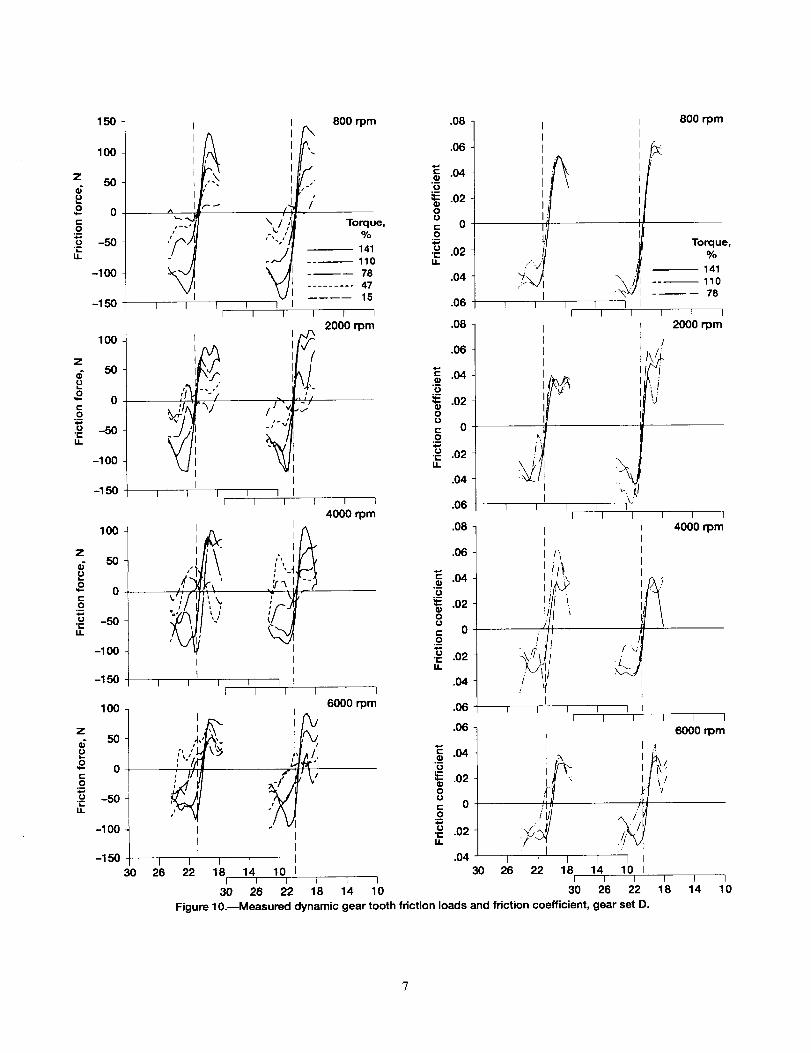
Figure 9.---Measured normal and friction dynamic toothloads, gear set D 800 rpm, torque 141%.
Fig. 10 for gear set D at twenty different test conditions (four speeds
and five torques). Although nine torque levels were recorded, only
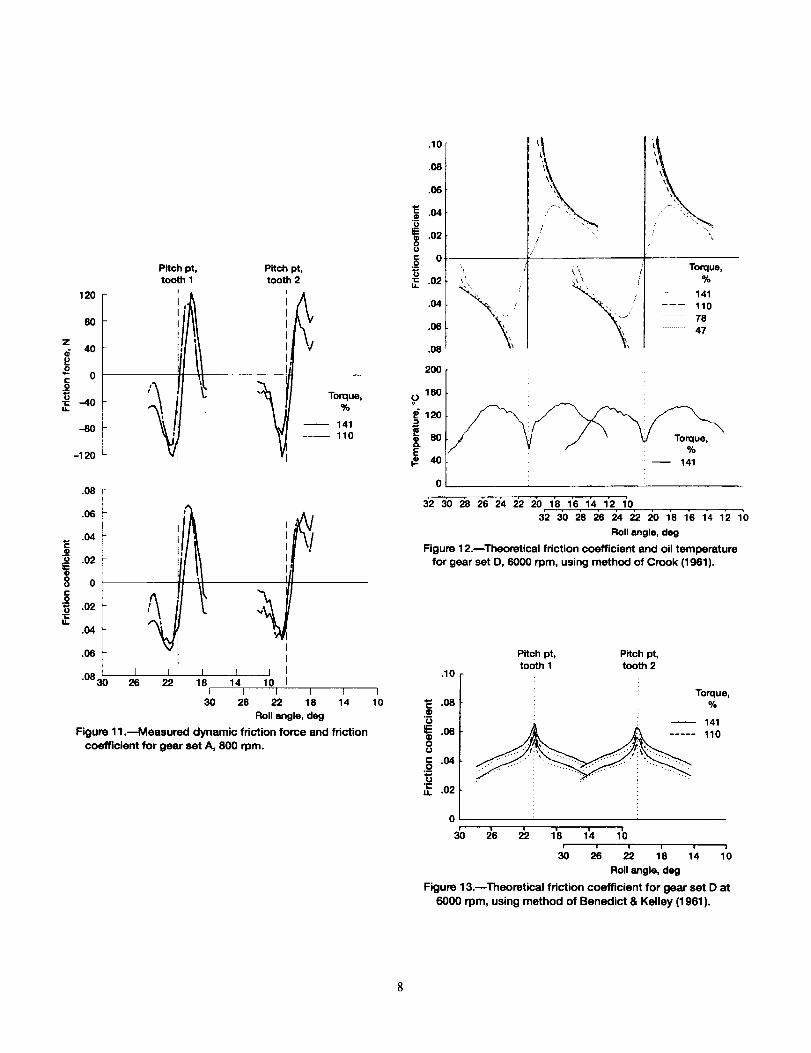
five are plotted to reduce clutter in the plots. A sample of similar
data from gear setA (no tip relief) is shown in Fig. I 1. The friction
data shown in Figs. i0 and 11 is limited to within the single tooth
pair contact region. The data from outside this region were not con-
tinuous and therefore not valid.
Accuracy of the strain data is likely to be compromised by sev-
eral factors, chiefly the low tooth loads resulting in small strains.
As was discussed by Rebbechi, et al., (1991), the friction measure-
ment relies upon the difference between the magnitude of compres-
sive and tensile tooth strains, and is particularly sensitive to error
when the values are similar in value. The process of averaging is
expected to help, but cannot eliminate errors arising from synchro-
nous effects. It is also likely that the measured strains are influ-
enced by other loads such as gear blank vibration modes imposed
on the gear. Finally, these errors are amplified by the matrix inver-
sion process.
The measured dynamic tooth friction forces are expected to be
most accurate in the single-tooth contact region, where the forces
are derived from the output of just two gages - tensile and compres-
sive on one tooth. The set D gears with their heavy tip relief have a
longer single contact zone, hence are better suited for this study. In
Figs. 10 and 11, the friction force has been adjusted vertically to lie
centrally around the x-axis. This adjustment was made because of asmall residual DC-offset in the recorded tooth strain values.
From the friction data, the friction coefficient can be evaluated
by dividing the friction force by the normal tooth load. The result-
ing friction coefficient is plotted in Figs. 10 and 11 for the higher
torques. The friction force (and thus its algebraic sign) reverses
direction at the pitch point. Although the friction coefficient is always
positive Figs. 10 and 12 show it crossing the horizontal axis as thefriction force reverses direction. Whilst the data lack the smooth
appearance we may expect after viewing data from disc machine
tests (for example Johnson and Cameron, 1967), a number of sig-
nificant observations can be made:
(a) There appear to be no discontinuities in the friction force due
to sliding direction reversal at the pitch-point.
(b) The coefficient of friction appears to decrease slightly with
increasing speed, but is largely insensitive to load, in the torque
values of 78 to 141 percent plotted here.
(c) The maximum friction coefficient is approximately 0.063, at
800 rpm.
(d) The friction coefficient at the highest speed of 6000 rpm
appears to be a maximum of 0.04.
(e) The friction values for gear set A (no relief) are similar to
those for gear set D (intermediate relief).
Overall, the friction measurements show that the features
observed in disc tests of highly loaded lubricated contacts are realised
throughout the gear tooth meshing cycle. Although the evaluation
of friction at very light loads was not reliable, the trend shows that
for loads in the normal operating range of these gears that friction
coefficient is largely independent of load. Finally, from observation
(b) above, the friction coefficient increases at low sliding speeds.
This is in accord with disk machine tests as reported in the references.
ComParison with Theoretical CalouIIItiono
The theoretical friction coefficient calculated according to Crook
(1961) is plotted in Fig. 12, for gear set D, 6000 rpm. The tooth
normal loads used in this computation were those experimentally
recorded at the nominal torques levels of 47 to 141 percent. From
these plots it is evident that in comparison with the measured data,
the theoretical calculation grossly overestimates the friction at low
speeds of sliding. At higher sliding speeds (away from the pitch
point) the theoretical friction coefficient merges for the different
loads, and numerically the results for theoretical calculation agree
more closely with the measured values.
At higher sliding speeds temperature effects become more
important, and the high viscosity due to pressure alone is modified
by the resulting high temperatures. The computed maximum tem-
perature rise of the lubricant, reached at the midpoint of the film, is
also plotted in Fig. 12. It can be seen that the temperature rise reaches
a peak value of 140 °C. Due to the reduced tooth load (from
load-sharing) at the larger roll angles, this peak is reached before
the extremes of sliding. At 141 percent torque, the computed val-
ues of maximum Hertzian pressure were 1.41 Gpa (204 600 lbf/
in2), the lubricant thickness 0.49 microns (17.5 micro-inches), and
the Hertzian half-width 0.19 mm (0.0074 inches). Computations
of theoretical friction at lower speeds resulted in unrealistically high
friction values, confirming further the limitations of a simple modelfor the lubricant.
As a further comparison, the friction coefficient was calculated
according to Benedict and Kelley (1961). Their computation is
intended primarily for use in scoring failure predictions, and effec-
tively relates to the region C of Fig. 1, that is the thermal region.
Results using their equation are plotted in Fig. 13. The loads used
are those experimentally obtained. These results agree fairly well
with experimental data (Fig. 10) in the region away from the pitch-
point where the friction coefficient is approximately 0.04.
150
1 O0
z 50
_ 0C0.--
o -50L.
U.
-1 O0
-150
100
z5O
o 00
-50It.
-1 O0
-15O
1O0
z5O
o 0t-o
o -50.i-Ll.
-1 O0
-150
100
z=; 5OP,2° or,o
.- -50LL
-1 O0
-150
/
P,
I
',,,/,,,
.,J
I I
I I I
I I
I
800 rpm
Torque,%
-- 141---- 110----- 78......... 47
15
r I
/ J""
Ii I I
I I I
I \ ,',," I : ',.4i
,.. ' ,,/.,,,t" ":,,'/f
t i /F J/
I I I t I
2000 rpm
I I
4000 rpm
I I I I I I6000 rpm
)
J7IIi
I I I I I
30 26 22 18 14 10I I L I t I
30 26 22 18 14 10
.O8 800 rpm
.O6
.040
.02G)0(3
c 00
<d
.o .02
,04
.06
.08
.O6
.04G)
_: .0200
c 00
o--4-J
o .02.r"I.I.
.04
.06
.08
.O6
i .040°_
¢: .0200
c 0._o
-_ .02
.04
.06
.06
.040
_: .o2ID00
c 00
u .02-e"U.
.04
I
I I I
I I I
I
i i I
Torque,%
-- 141---- 110
78
i . (
II
I I I I I _
I I I
"t
I i
/'1• I[,
I 2000 rpmIt i
I I I
4000 rpm
I I I I II I I I I I
6000 rpm
i
ilv
I I30 26 22 18 14 10
I I I I I I
30 26 22 18 14 10
Figure lO._Measured dynamic gear tooth friction loads and friction coefficient, gear set D.
12O
8O
z40
o 0C
._o
-_ -4oU.
-80
-120
Pitch pt,
tooth IPitch pt,tooth 2
Torque,
%
141
---- 110
o
0o
t-O
U
U.
.08
.06
.04
.02
0
.02
.04
.08
.08 30J I L
26 22 18I
30
II
i J I14 10 I
I I I I I26 22 18 14 10
Roll angle, deg
Figure 11 ._Measured dynamic friction force and friction
coefficient for gear set A, 800 rpm.
.10
.08
.08
_.04u
.02O
._g 0
;,= .o2
.04
.08
.O8
200
160o__12o:3
E,_ 40
\
/
Torque,%
141
---- 110
78
............ 47
/ ' / i %
i - 141
32 30 28 26 24 22 20 18 16 1'4 1'2 1'0
32 30 28 26 24 22 20 18 16 14 12 10
Roll angle, dog
Figure 12.--Theoretical friction coefficient and oil temperature
for gear set D, 6000 rpm, using method of Crook (1961).
.10
.08._e(J
_.08oo¢= .04
.o
_: .02
0
3O
Pitch pt, Pitch pt,tooth 1 tooth 2
Torque,%
141
- 110
2'6 22. 1'8 1_4 1_)
30 18
Roll angle, dog
J
14 10
Figure 13.--Theoretical friction coefficient for gear set D at
6000 rpm, using method of Benedict & Kelley (1 961 ).
SUMMARY AND CONCLUSIONS
Gear tooth normal and frictional forces were measured using
strain gages mounted in the fillets of the gear teeth. The measured
forces were used to compute the dynamic coefficient of friction
existing between contacting teeth. The following conclusions were
obtained:
1. The measured dynamic friction loads show friction coefficients
of approximately of 0.04 to 0.06. Friction coefficients increase at
low sliding speeds. These results are in accord with disk machine
tests as reported in the references.
2. The results show that the reversal of sliding which occurs at the
pitch-point does not cause a discontinuity in the friction coefficient,which shows a smooth transition as the friction force reverses direction.
3. The technique described here offers the potential to study the
variation in friction coefficient throughout the gear tooth meshing
cycle, and examples of this variation for a range of loads and speeds
are presented.
4. The measured data are more accurate at higher loads and in the
single-tooth contact region.
REFERENCES
Anderson, N.E., and Loewenthal, S.H., 1979, "Part and Full Load
Spur Gear Efficiency," NASA TP-1622.
Benedict, G.H., and Kelley, B.W., 1961, "Instantaneous Coeffi-
cients of Gear Tooth Friction," ASLE Transactions, Vol. 4, No. 1,
pp 59-70.Bisson, E.E., and Anderson, W.J., 1964, Advanced Bearing Tech-
nology, NASA SP-38, pp 150-153.
Crook, A.W., !961, '_he Lubrication of Rollers III, A Theoreti-
cal Discussion of Friction and the Temperatures in the Oil Film,"
Philosophical Transactions of the Royal Society of London, Ser A,
Vol 254, pp 237-258.
Downson, D., 1967, "Elastohydrodynamics", Proceedings, Con-
ference on Lubrication and Wear, Inst. Mech Engrs, Vol 182, part
3A, pp 151-167.
Dowson, D., and Higginson, G.R., 1966, Elastohydrodynamic
Lubrication, Permagon, Oxford, pp 139-181.
Errichello, R., 1990, "Lubrication of Gears", Lubrication Engi-
neering, March 1990, p 182.
Johnson, K.L., and Cameron, R., 1967, "Shear Behaviour of
Elastohydrodynamic Oil Films at High Rolling Contact Pressures",
Proceedings oflnstn. Mech. Engrs, Vol. 182, Part 1, No. 14.
Kelley, B.W., and Lemanski, A.J., 1967, "Lubrication of Invo-
lute Gearing", Proceedings, Conference on Lubrication and Wear,
Inst. Mech Engrs, Vol 182, Part 3A, pp 173-184.
Krantz, T.L., and Handschuh, R.E, 1990, "Efficiency Study Com-
paring Two Helicopter Planetary Reduction Stages," A1AA paper
90-2156, NASA TM-103106.
Oswald, F.B.. Rebbechi, B., Zakraj sek, J.J., Townsend, D.P., 1991,
"Comparison of Analysis and Experiment for Dynamics of Low
Contact Ratio Spur Gears," NASA TM-103232.
Oswald, EB., Townsend, D.P., Rebbechi, B., Lin, H.H., 1996,
"Dynamic Forces in Spur Gears - Measurement, Prediction and Code
Validation", Proceedings. ASME 7th lnt PTG Conf., Paper
070PTG96, NASA TM-103106.
Radzimovsky, E.I., Mirarefi, A., Broom, W.E., 1973, "Instanta-
neous Efficiency and Coefficient of Friction of an Involute Gear
Drive", ASME Journal of Engineering for Industry, Nov. 1973,
pp. 1131-1138.
Rebbechi, B., Oswald, F.B., Townsend, D.P., 1991, "Dynamic
Measurements of Gear Tooth Friction and Load," AGMA report
91-FTM-10, NASA TM-103281.
Tevaarwerk, J.L., 1985a, "Thermal Traction Contact Performance
Evaluation Under Fully Flooded and Starved Conditions" NASA
CR-168173.
Tevaarwerk, J.L., 1985b, "Constitutive Modelling of Lubricants
in Concentrated Contacts at High Slide-To-Roll Ratios", NASA
CR-175029.
Townsend, D.P., 1968, '_l'he Application of Elastohydrodynamic
Lubrication in Gear Tooth Contacts", NASA TM X_i8142.
Form Approved
REPORT DOCUMENTATION PAGE OMB No. 0704-0188
Public reportingburdenfor this collectionof informationis estimatedto average 1 hourper response, including the timefor reviewinginstructions,searchingexistingdata sources,gatheringand maintaining the data needed, and completingand reviewing the collectionof information. Send comments regardingthis burdenestimateor any other aspect of thiscollectionof information,including suggestionsfor reducing this burden, to WashingtonHeadquartersServices, Directoratefor InformationOperations and Report.s,1215 JeffersonDavis Highway, Suite 1204, Arlington,VA 22202-4302, and to the Office of Management and Budget,Paperwork ReductionProject (0704-0188), Washington,DC 20503.
1. AGENCY USE ONLY (Leave blank) 2. REPORT DATE
September 1996
4. TITLE AND SUBTITLE
Measurement of Gear Tooth Dynamic Friction
6. AUTHOR(S)
Brian Rebbechi, Fred B. Oswald, and Dennis P. Townsend
7. PERFORMING ORGANIZATION NAME(S) AND ADDRESS(ES)NASA Lewis Research Center
Cleveland, Ohio 44135-3191
and
Vehicle Propulsion Directorate
U.S. Army Research Laboratory
Cleveland, Ohio 44135-3191
9. SPONSORING/MONITORING AGENCY NAME(S) AND ADDRESS(ES)
National Aeronautics and Space Administration
Washington, D.C. 20546-0001
and
U.S. Army Research Laboratory
Adelphi, Maryland 20783-1145
3. REPORT TYPE AND DATES COVERED
Technical Memorandum
S. FUNDING NUMBERS
WU-505-62-36
1L162211A47A
8. PERFORMING ORGANIZATION
REPORT NUMBER
E-10350
10. SPONSORING/MONITORINGAGENCY REPORT NUMBER
NASA TM-107279
ARL-TR-1165
11. SUPPLEMENTARY NOTES
Prepared for the Seventh International Power Transmission and Gearing Conference sponsored by the American Society
of Mechanical Engineers, San Diego, California, October 6-9, 1996. Brian Rebbechi, DSTO, Aeronautical and Maritime
Research Laboratory, Melbourne, Australia 3207; Fred B. Oswald and Dennis P. Townsend, NASA Lewis Research
Center. Responsible person, Fred B. Oswald, organization code 2730, (216) 433-3957.
12a. DISTRIBUTION/AVAILABILITY STATEMENT
Unclassified - Unlimited
Subject Category 37
This publication is available from the NASA Center for AeroSpace Information, (301) 621_)390
12b. DISTRIBUTION CODE
13. ABSTRACT (Maximum 200 words)
Measurements of dynamic friction forces at the gear tooth contact were undertaken using strain gages at the root fillets of
two successive teeth. Results are presented from two gear sets over a range of speeds and loads. The results demonstrate
that the friction coefficient does not appear to be significantly influenced by the sliding reversal at the pitch point, and that
the friction coefficient values found are in accord with those in general use. The friction coefficient was found to increase
at low sliding speeds. This agrees with the results of disc machine testing.
14. SUBJECT TERMS
Gears; Spur gears; Friction; Strain gage
17. SECURITY CLASSIFICATION 18. SECURITY CLASSIFICATION
OF REPORT OF THIS PAGE
Unclassified Unclassified
NSN 7540-01-280-5500
19. SECURITY CLASSIFICATION
OF ABSTRACT
Unclassified
15. NUMBER OF PAGES
]]
16. PRICE CODE
A03
20. LIMITATION OF ABSTRACT
Standard Form 298 (Rev. 2-89)
Prescribed by ANSI Std. Z39-18298-102