Embed Size (px)
Citation preview

Measurement of Cryogenic LNG Class # 2285
Alastair McLachlan
Applications Manager - UK Cameron Measurement Systems
Caldon Ultrasonics Technology Centre Pittsburgh, PA USA
Introduction
With depletion of conventional oil reserves, natural gas is becoming an increasingly important source of energy for many countries, including the USA. While some of the demand for natural gas can be met by domestic production or pipeline imports, many countries are becoming increasingly dependent on natural gas imports in the form of LNG. One county which is very a potent example of the importance of LNG, is Japan, which currently imports about 97% of its gas in the form of LNG. LNG imports to Japan represent the majority of global trade in the product and are supplied mainly from Indonesia and Malaysia, the world’s top two LNG exporters.
Figure 1 below shows the growth in world trade in LNG from 1990 and forecast to 2020, with the majority LNG being imported by the USA and the Asia Pacific region.
Figure 1
LNG Measurement Scenarios
The LNG liquefaction process involves cooling natural gas to a temperature of approximately -161ºC at atmospheric pressure. Liquefaction reduces the fluid volume to about 1/600th of the volume of gas at standard temperature and pressure. This reduction in volume makes it cost effective to transport, allowing LNG tankers to be used in situations where transportation by pipeline is not economically feasible.
LNG is produced and stored in tanks onshore prior to ship loading and sea transportation. Custody transfer is performed on board the ship by means of tank gauging systems. Conventionally, in-line or ‘dynamic’ metering would only be performed with the fluid in the gaseous for the custody transfer measurement into the LNG plant (see Figure 2 below). Similarly, at the receiving terminal, the custody transfer will be performed using the shipboard measurements and then the natural gas would be measured once re-gasified for pipeline transportation.

Figure 2 A conventional measurement configuration at an LNG plant
In some cases, LNG produced from different sources with different ownership will share storage and transportation facilities as illustrated in Figure 3. This is the approach that has been adopted for the Qatar Common LNG Project, which comprises five separate joint ventures. Project cost savings achieved by adoption of the common facilities approach in that case are estimated to be in the region of 1 Billion US dollars ($1,000,000,000). In such cases, allocation of production is necessary and as the plants are producing continuously, this requires in-line measurement of LNG in its cryogenic liquid state.
Figure 3 LNG production with shared storage and loading facilities
From the preceding paragraphs, it would appear that there is a clear requirement for allocation measurement using in-line flowmeters but that in-line metering is not required for custody transfer, owing to the established use of tank gauging systems. However, owing to the comparable levels of uncertainty estimated for both tank gauging and in-line measurement systems, it may in future be common to use in-line meters as check meters for the tank gauging systems, or vice versa, as illustrated by the inclusion of a meter on the loading line in Figure 3.
There are also other situations that exist that may require in-line metering of cryogenic LNG. For example, Figure 4 below illustrates the process of extracting natural gas liquids from an LNG feedstock (NGLs are longer chain hydrocarbons that make up a relatively small percentage of the LNG, which is mainly methane). In this example, the NGL recover plant is owned and operated independently of the LNG receiving terminal and hence custody transfer measurement of the LNG entering and leaving the plant is required.

Figure 4 NGL extraction from a LNG feedstock
Tank Gauging Based Custody Transfer Measurement
Tank gauging based measurement is currently the recognized method to be used when performing a custody transfer of LNG. Guidelines for this measurement exist in the form of the GIIGNL LNG Custody Transfer Handbook, Third Edition (2010). The custody transfer quantity is calculated on an energy basis and the measurements will be made at either the loading or unloading port, depending on the nature of the contract.
The energy value of LNG is determined as follows:
Energy of LNG transferred = (Volume x Density x Gross Calorific Value) – Energy value of gas displaced
The volume of the LNG loaded or unloaded is determined by tank gauging comprising:
Calibration tables specific to each tank
Equipment for level measurement
Temperature measurement distributed over the height of the tanks
Measurements of trim and list
Calibration tables
The calibration tables for a vessel are normally produced by an independent surveyor during the building of the LNG carrier. Various methods, e.g. laser surveying, may be used to establish the tables and these methods are covered by ISO standards. Correction tables are also developed to account for the effects of thermal expansion/contraction of the tanks and list and trim variations.
Level measurement
The level measurement is normally performed by one of the following methods:
Float gauge
Capacitance gauge
Microwave radar gauge
Float gauge measurements are made by a float attached to a tape or ribbon. As the level in the tanks changes the float is displaced and the tape rolls up or unrolls. With float gauges it is necessary to correct the measurement for the effects of density on the buoyancy of the float, and the effects of temperature on the length of the tape.
Capacitance measurements are made using concentric aluminum tubes that span the height of the tank and are separated into segments by insulating spacers. Hence each segment forms a capacitor, with the fluid in the annulus forming the dielectric. Hence, as the liquid level changes, so the electronically measured capacitance will change, giving a measure of the height of the liquid in the tank.
Microwave radar gauges operate by emitting microwaves down towards the surface of the liquid (usually down a guide pipe). The emitted signal is reflected back towards the antenna by the surface of the liquid and the height of the liquid related to the round-trip travel time of the microwaves.
Various levels of accuracy are claimed for level measurement devices. The GIIGNL handbook quotes achievable uncertainty in the range of 4 to 8 mm.
Temperature measurement
Temperature measurement is performed by the use of 3-wire or 4-wire platinum resistance thermometers, of which there are typically 5 per tank. These are used to determine the average temperature in the liquid and in the gas above the liquid, and hence to apply appropriate corrections to the level and tank volume measurements.
Volume calculation uncertainty
The overall uncertainty in volume measurement is a function of the accuracy of the calibration tables and the level and temperature measurements. The example in the GIIGNL handbook results in an uncertainty estimate of +/- 0.21% in the LNG volume.
Sampling
The sample probe is located either on the main loading pipe after the LNG pumps, or on the main unloading pipe after the unloading arms. The LNG is sampled throughout the transfer process (excepting the start and finish of the transfer) and is vaporized prior to collection or analysis.
Sampling of LNG is a subject worthy of its own paper. For the purposes of this paper is it will have to suffice to say that great care has to be taken in obtaining, conditioning and collecting the sample gas prior to analysis.
Density and Gross Calorific Value
For LNG measurement, both density and gross calorific value (GCV) are required. Current practice involves taking LNG samples throughout the transfer and vaporizing these for analysis by a gas chromatograph. Once the component composition has been determined the component fractions are used along with tables of physical constants as inputs to density and GCV calculations.
Various methods can be used for density measurement but the method selected in the GIIGNL handbook is the Revised Klosek-McKinley method, which requires only the LNG temperature and composition to be taken into account. For butane and nitrogen content not exceeding 5%, this method has an uncertainty of 0.1%.
The GVC by mass is normally calculated as follows:
ii
ii
MXmolGCVX
massGCV
)()(
Where Xi is the component mol fraction, GCVi(mol) is the molar gross calorific value of the component and Mi is the molecular mass of the component. The values of GCVi(mol) and Mi are obtained from an appropriate standard, such as ISO 6976, ASTM 3588, GPA 2145, GPA 2172 or IP 251.
Energy calculation uncertainty
The GIIGNL handbook gives an estimated uncertainty of +/- 0.23% for LNG density by the revised Klosek-McKinley method and an estimated uncertainty of +/- 0.30% for the Gross Calorific Value. Combing these with the value of +/- 0.21% for the volume results in an overall uncertainty of +/- 0.43% for the energy value of the custody transfer.
In-Line (Dynamic) Measurement of LNG
As custody transfer measurement of LNG is normally performed by onboard tank measurements, limited research has been conducted regarding the performance of in-line LNG metering systems for custody transfer or allocation duties. In addition to the general shortage of information about in-line LNG metering, there is the added complication that conventional proving systems used for liquid metering cannot be used on typical LNG applications. For these reasons, be used for in-line LNG measurement, the following attributes are considered desirable:
No rotating parts
No wetted sensors
Advanced diagnostics
Proven reliability in other applications
Proven accuracy for liquid custody transfer
Proven performance in (other) extreme temperature applications
Ability to perform accurately in cryogenic conditions
High reliability at cryogenic temperatures
High reliability through large temperature cycles (-161 to +60 ºC)
Low pressure drop to avoid vaporization
Both Coriolis meters and ultrasonic meters meet many of the above requirements. Coriolis meters have the attractive feature of being direct mass devices, therefore eliminating the need for a separate density determination. On the other hand, ultrasonic meters are more suited to large volume transfers as they are available in larger sizes and have much lower pressure drop.
Coriolis meters have been show to be able to perform acceptably at cryogenic temperatures if sufficient care is taken to compensate the influence of the temperature change on the mechanical properties of the tubes. As the device is mass flow based, and relatively insensitive to fluid properties, calibration is expected to transfer from ambient conditions with normal fluids such as water or oil to cryogenic LNG without too much additional uncertainty. Data has been published showing cryogenic performance of Coriolis meters with errors less than +/- 0.2 to +/- 0.45 %.
Ultrasonic meters are covered in more detail in the following sections.
Multipath Ultrasonic Meters for LNG
The first multipath ultrasonic meters were developed by Westinghouse for high accuracy measurement of liquid flows in the late 60’s and were the trade name LEFM for Leading Edge Flow Meter. From around 1980 onwards

over 70 LEFM systems have been installed in nuclear power plants around the world. These meters are used to measure feedwater flows at temperatures of up to +235ºC.
Operation of ultrasonic meters at cryogenic temperatures requires that the materials that are used in the meter body must perform reliably at low temperatures of around -161 ºC and be able to withstand large changes in temperature. Furthermore, changes in temperature should not affect the accuracy of the flow rate measurement. The most critical parts of the ultrasonic meter in this respect are the ultrasonic transducers.
When designing an ultrasonic flowmeter for operation at low temperatures the designer must choose between placing the transducers close to the fluid or placing them at the end of some form of temperature buffer rod. Placing the transducers close to the fluid eliminates the buffer but demands that the transducers must produce good quality signals at low temperatures and be robust when subjected to changes in temperature. Using a buffer places lower demands on the transducers themselves but has the disadvantage of influencing the transit time measurements as a consequence of the long transit times in the buffer rods. Furthermore, the thermal gradients in the buffer rods can introduce uncertainties in the transit time measurements.
The approach adopted for Caldon ultrasonic meters is to place the transducers behind a stainless steel window in a welded stainless steel housing. No temperature buffer is used and the window, which is less than half an inch thick, serves as a pressure boundary and is in direct contact with the cryogenic liquid. Importantly, this arrangement allows Caldon LNG meters to use the same physical design and path configurations as the standard range of Caldon liquid custody transfer meters.
During the development of the transducers, various designs were evaluated by constructing and testing large batches of transducers. The testing included initial cryogenic measurements of signal strength on a large batch of transducers followed by cyclic temperature sample testing to cryogenic temperatures.
In addition to measuring the signal strength during factory acceptance tests, further tests have been carried out to ensure that the signal strength will not degrade if the meters are subjected to multiple thermal cycles. In these tests, the transducers were subjected to a rapid cycle from –191ºC to +60ºC by placing them in a test cell and submerging them in liquid nitrogen. Once submerged and cooled the signal strength was measured in terms of the gain applied to a transducer pair by the automatic gain control in the flowmeter electronics. The nitrogen was then allowed to boil off and the samples were then transferred into an oven at 60 ºC. Once the temperature had stabilized at 60 ºC the process was repeated.
Figure 5 below shows the results from three transducer pairs subjected to 70 thermal cycles. It can be observed that there is no significant change in the gain levels over the duration of the test. The thermal cycle test is extreme relative to the expected operating conditions for the meter in service for LNG. In general LNG lines will be kept cold to prevent boil-off, and even if the meter does experience temperature cycles the rate of change should be much less than in the lab tests.
30
35
40
45
50
55
60
65
70
75
80
0 10 20 30 40 50 60 70
Thermal Cycle Number
Gai
n d
B
TRANSDUCER PAIR B
TRANSDUCER PAIR C
TRANSDUCER PAIR A
Figure 5 Transducer gain at cryogenic temperature during each thermal cycle
Calibration of Multipath Ultrasonic Meters for LNG
For LNG applications it seems highly unlikely that typically sized ultrasonic meters will ever be calibrated in-situ, owing to the probable cost and complexity of engineering and operating field calibration equipment for LNG. Therefore, the calibration must be performed in the factory or at a third-party calibration laboratory. This presents a challenge as currently there are no test facilities using LNG or other cryogenic liquids as the calibration fluid that can achieve the flowrates typically required for ultrasonic meters. For example, the NIST cryogenic calibration facility in the USA has a maximum flow limitation of around 45 m3/hr (or around 14% of the nominal maximum of a 4-inch ultrasonic meter).
To overcome this limitation Cameron has adopted a methodology that allows calibration of LEFM ultrasonic meters using another working fluid. The basis of this methodology is a rigorous analysis of the factors affecting the acoustic signals, and a process that accounts for variations in hydraulic conditions.
The influence of different fluid properties on the acoustic signals can be shown to be relatively small and can be included in the uncertainty budget for the final application. Geometry changes are compensated as a function of temperature, which is measured in the meter body, and again the uncertainty in these corrections can be included in the overall uncertainty budget. This leaves one parameter, the hydraulic calibration factor, to be accounted for.
The hydraulic calibration factor is analogous to the discharge coefficient of a differential pressure flow meter. Ultrasonic meters are velocity measuring devices that sample the velocity on a discrete number of paths. Therefore the ‘discharge coefficient’ of the ultrasonic meter is a function of the velocity profile of the fluid as it passes through the meter body.
The shape of the velocity profile is affected by the flowrate, the pipe diameter, the fluid viscosity and the proximity of upstream fittings such as bends and valves. The effects of flowrate, diameter and viscosity are characterized by Reynolds number (Re), which is a dimensionless quantity that represents the balance of inertial to viscous forces in the flow. Owing to the low viscosity of LNG, the Reynolds numbers experienced in LNG applications tend to be high (Re of 500,000 to 30,000,000 could be expected). At these high values of Re the boundary layer is relatively thin and velocity profile is flatter than experienced with a more ‘normal’ liquid such as a crude oil. It is not possible to achieve such high Reynolds numbers in liquid calibration facilities (or at least it is not possible to achieve the top end of the application Reynolds number range), owing to the fact that typical calibration fluids, such as water, have higher viscosity. Unfortunately achieving a higher Reynolds number by using a gas as the calibration fluid is not appropriate as the acoustic properties of liquids and gasses are too widely different.
However, the important fact is that the calibration of the ultrasonic meter is dependent on the time averaged velocity profile and not some other property of the high Reynolds number flow.
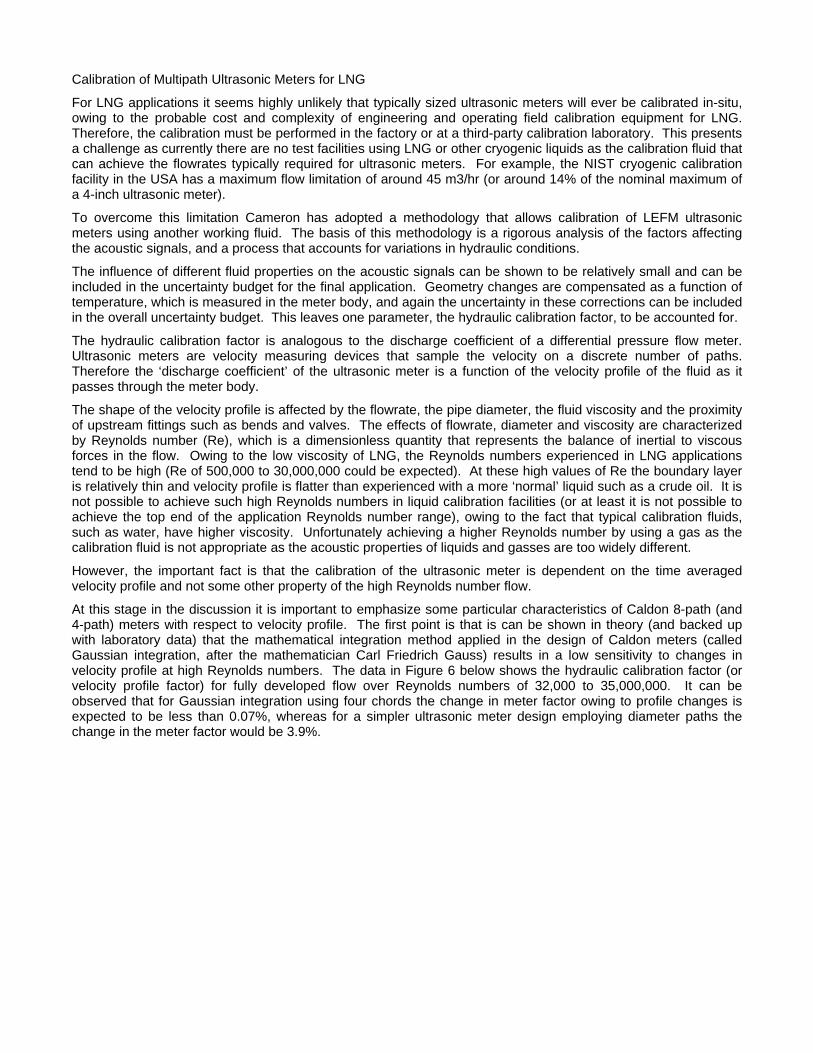
At this stage in the discussion it is important to emphasize some particular characteristics of Caldon 8-path (and 4-path) meters with respect to velocity profile. The first point is that is can be shown in theory (and backed up with laboratory data) that the mathematical integration method applied in the design of Caldon meters (called Gaussian integration, after the mathematician Carl Friedrich Gauss) results in a low sensitivity to changes in velocity profile at high Reynolds numbers. The data in Figure 6 below shows the hydraulic calibration factor (or velocity profile factor) for fully developed flow over Reynolds numbers of 32,000 to 35,000,000. It can be observed that for Gaussian integration using four chords the change in meter factor owing to profile changes is expected to be less than 0.07%, whereas for a simpler ultrasonic meter design employing diameter paths the change in the meter factor would be 3.9%.

0.92
0.93
0.94
0.95
0.96
0.97
0.98
0.99
1.00
10,000 100,000 1,000,000 10,000,000 100,000,000
Reynolds Number
Ve
loci
ty P
rofi
le F
acto
r
Gauss-Legendre integration with 4 chords
One or more Diametric paths
Figure 6 Hydraulic calibration factor vs. Reynolds numbers for two different path configurations
The second important point about the Caldon chordal meter design is that the meter itself can characterize the shape of the velocity profile as a ‘flatness ratio’, which is the sum of the outside path velocities divided by the sum of the inside path velocities. This allows the meter factor to be determined as a function of flatness ratio, as illustrated in Figure 7 below, which shows the flatness ratio and hydraulic calibration factor data for Reynolds numbers from 234,000 to 35,724,000. It should be noted that if two-path diametric or mid-radius designs are used it is not possible for the meter to calculate a flatness ratio, and the correction must rely on inference of Reynolds number, which in turn needs some method of fluid viscosity measurement.
0.9940
0.9945
0.9950
0.9955
0.9960
0.9965
0.9970
0.8 0.81 0.82 0.83 0.84 0.85 0.86 0.87 0.88 0.89 0.9
Flatness Ratio
Vel
oci
ty P
rofi
le F
acto
r
Figure 7 Hydraulic calibration factor vs. flatness ratio for the Gaussian configuration
The shape of the velocity profile can be altered not only by changing Reynolds number but also by varying upstream pipe conditions. For example, out-of-plane bends and reducers tend to thin the boundary layer and flatten the velocity profile. Although such profiles are not identical to fully developed profiles at higher Re, they do produce analogous variations in profile flatness and can be used to validate the calibration method over a range of velocity profile conditions that will encompass the high flatness ratio values seen in LNG applications. It should

be noted that this process generates data that includes variation in upstream conditions and therefore also encompasses lab-to-site variations in axial velocity profile. This is in contrast to the limited capabilities of simpler single-path or two-path ultrasonic systems.
The calibration methodology applied to Caldon meters is well supported by theory and an extensive database of laboratory test results obtained with different meter sizes and different pipe configurations. NMi, the Dutch weights and measures authority, have recently reviewed this information in the process of performing an independent assessment of this calibration methodology for Caldon LNG flowmeters. The assessment included reviewing uncertainty contributions for the effects of operation at cryogenic temperatures on the dimensional and acoustic aspects of the measurements. NMi’s evaluation estimates the uncertainty in volumetric measurement of LNG using Caldon meters to be +/- 0.2% for the case of interpolation using flatness ratio and +/- 0.22% if extrapolation is used.
Swirl Effects on Ultrasonic Meters
When flow is forced to change direction, the fluid then travels with forward motion parallel to the pipe axis and motion at an angle to the pipe axis. ‘Swirl’ is the name generally used for these non-axial components of velocity that are produced downstream of bends and similar pipe fittings.
The means by which swirl interferes with the performance of ultrasonic meters is by introducing an unwanted non-axial component of velocity in the measurement paths. This unwanted component of velocity can be additive or subtractive. If the non-axial flow velocity is going in same the direction as the ultrasound when it travels from the upstream transducer to the downstream transducer then the effect will be to increase the measured velocity. If the non-axial velocity is opposite in direction to the downstream travel of the ultrasound then the effect will be to decrease the measured velocity.
Multipath meters have some in-built tolerance to swirl, but as we will see later, some designs are limited in terms of which forms of swirl they can tolerate without error.
Most ultrasonic meter designs are unaffected by swirl if the swirl takes the form of a single vortex centered perfectly in the middle of the pipe. However, if the swirl is slightly off-centre or has a more complex pattern containing multiple vortices, then potentially large errors can occur. Good illustrations of complex off-centered swirl downstream of bends can be found in studies where Computational Fluid Dynamics has been used to visualize flow downstream of out of plane bends. A fairly typical off-centre swirl pattern is shown in Figure 8 below.
Figure 8 Off-centre swirl
In terms of the magnitude of effect on various meter configurations, the swirl pattern shown above would result in the errors given in Table 1 below.
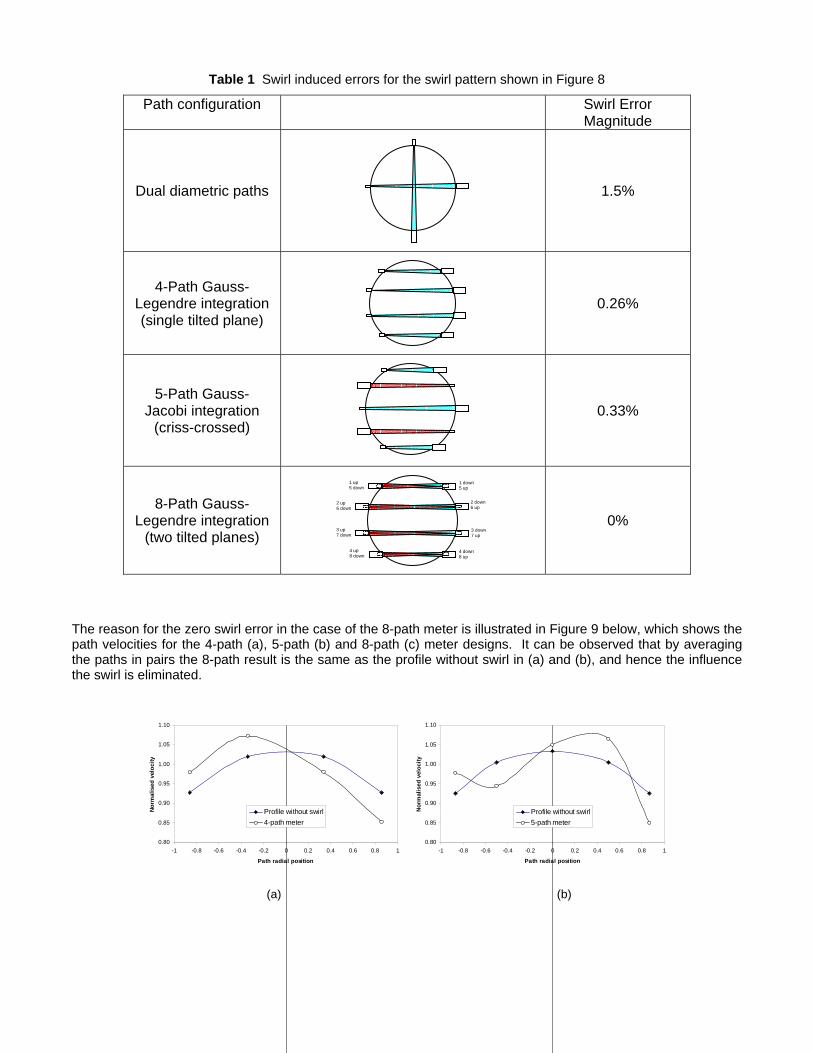
Table 1 Swirl induced errors for the swirl pattern shown in Figure 8
Path configuration Swirl Error Magnitude
Dual diametric paths
1.5%
4-Path Gauss-Legendre integration (single tilted plane)
0.26%
5-Path Gauss- Jacobi integration
(criss-crossed)
0.33%
8-Path Gauss-Legendre integration
(two tilted planes)
0%
The reason for the zero swirl error in the case of the 8-path meter is illustrated in Figure 9 below, which shows the path velocities for the 4-path (a), 5-path (b) and 8-path (c) meter designs. It can be observed that by averaging the paths in pairs the 8-path result is the same as the profile without swirl in (a) and (b), and hence the influence the swirl is eliminated.
0.80
0.85
0.90
0.95
1.00
1.05
1.10
-1 -0.8 -0.6 -0.4 -0.2 0 0.2 0.4 0.6 0.8 1
Path radial position
No
rmal
ised
vel
oci
ty
Profile without swirl
4-path meter
0.80
0.85
0.90
0.95
1.00
1.05
1.10
-1 -0.8 -0.6 -0.4 -0.2 0 0.2 0.4 0.6 0.8 1
Path radial position
No
rmal
ised
vel
oci
ty
Profile without swirl
5-path meter
(a) (b)
1 up 5 down
1 down 5 up
2 down 6 up
3 down 7 up
4 down 8 up
2 up 6 down
3 up 7 down
4 up 8 down

0.80
0.85
0.90
0.95
1.00
1.05
1.10
-1 -0.8 -0.6 -0.4 -0.2 0 0.2 0.4 0.6 0.8 1
Path radial position
No
rmal
ised
vel
oci
ty
8-path meter
Paths 1 to 4
Paths 5 to 8
Figure 9 Path velocities for (a) 4 paths, (b) 5 paths and (c) 8 paths with swirl
Field Test Experience with Ultrasonic and Coriolis Meters
In-line flow meter qualification tests for the Qatar common LNG facilities project were performed by the project partners at the ConocoPhillips LNG plant located in Kenai, Alaska. These tests were deemed necessary as the meters would be used for allocation into shared storage. The Kenai site was selected as it was an operational facility with appropriate infrastructure for the meter evaluation. The test line is a bypass loop on the rundown line with double block and bleed valve, allowing installation and maintenance of the test meters without interfering with the production. Based on discussions with various manufacturers, two different makes of Coriolis meter and one ultrasonic meter were chosen for evaluation. The ultrasonic meter was a six-inch 8-path meter supplied by Caldon. The initial qualification tests were performed over a three month period at the end of 2005. This infrastructure allowed the meters to be tested by using them to meter LNG into the plant’s storage tanks. The storage tank measurements were in turn verified against previously certified tanker measurements. Figure 10 shows a schematic diagram and a photograph of the test set up.
From LNG plant
Caldon ultrasonic
meter
Coriolis meters (with differential pressure cells)
Densitometer
LNG Storage Tanks
To LNG tanker
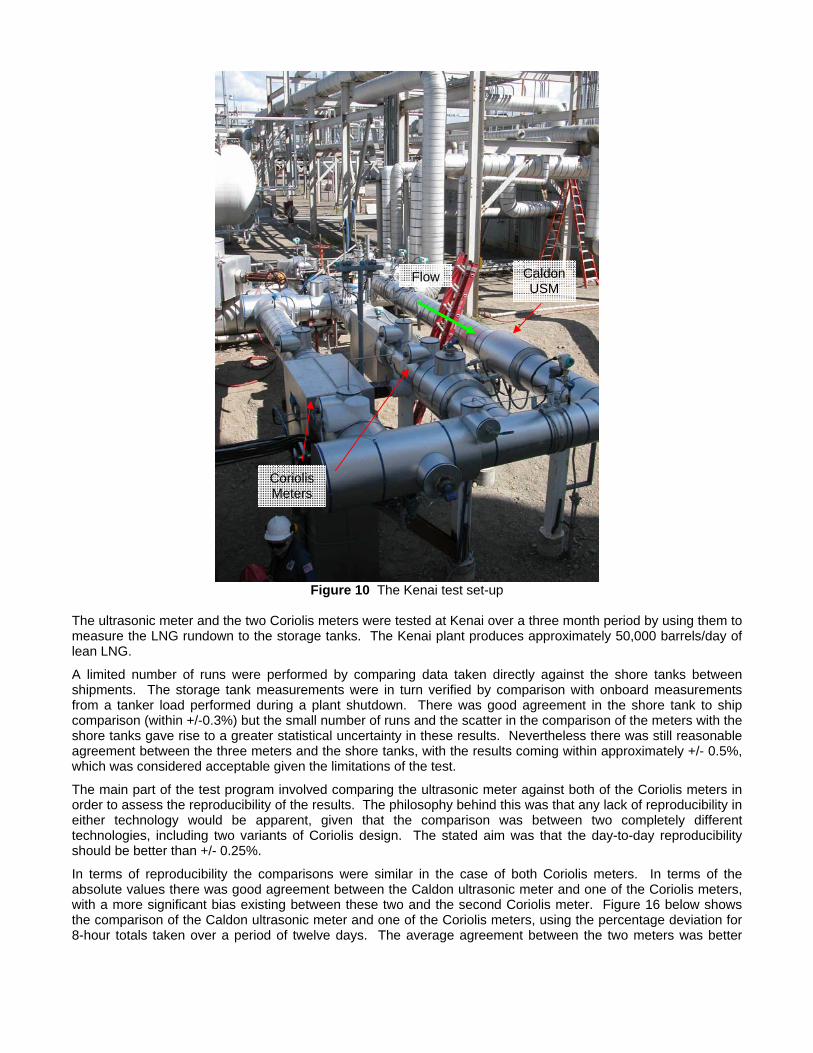
Figure 10 The Kenai test set-up
The ultrasonic meter and the two Coriolis meters were tested at Kenai over a three month period by using them to measure the LNG rundown to the storage tanks. The Kenai plant produces approximately 50,000 barrels/day of lean LNG.
A limited number of runs were performed by comparing data taken directly against the shore tanks between shipments. The storage tank measurements were in turn verified by comparison with onboard measurements from a tanker load performed during a plant shutdown. There was good agreement in the shore tank to ship comparison (within +/-0.3%) but the small number of runs and the scatter in the comparison of the meters with the shore tanks gave rise to a greater statistical uncertainty in these results. Nevertheless there was still reasonable agreement between the three meters and the shore tanks, with the results coming within approximately +/- 0.5%, which was considered acceptable given the limitations of the test.
The main part of the test program involved comparing the ultrasonic meter against both of the Coriolis meters in order to assess the reproducibility of the results. The philosophy behind this was that any lack of reproducibility in either technology would be apparent, given that the comparison was between two completely different technologies, including two variants of Coriolis design. The stated aim was that the day-to-day reproducibility should be better than +/- 0.25%.
In terms of reproducibility the comparisons were similar in the case of both Coriolis meters. In terms of the absolute values there was good agreement between the Caldon ultrasonic meter and one of the Coriolis meters, with a more significant bias existing between these two and the second Coriolis meter. Figure 16 below shows the comparison of the Caldon ultrasonic meter and one of the Coriolis meters, using the percentage deviation for 8-hour totals taken over a period of twelve days. The average agreement between the two meters was better
Caldon USM
Coriolis Meters
Flow
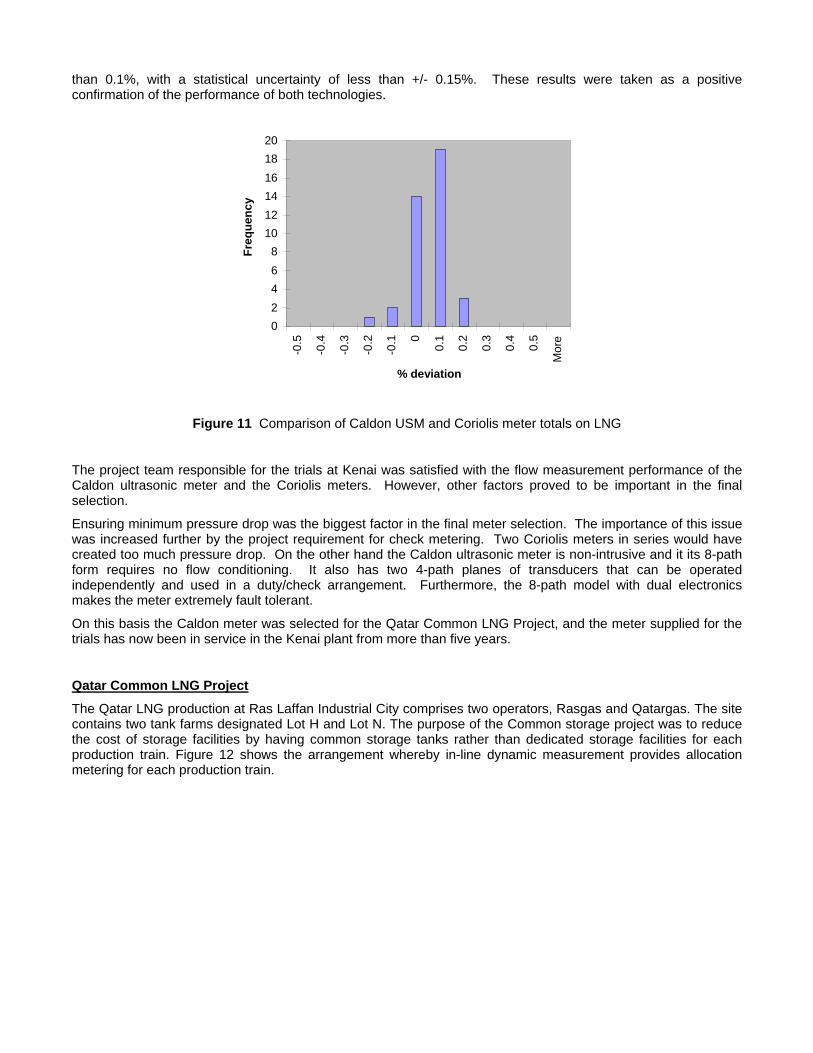
than 0.1%, with a statistical uncertainty of less than +/- 0.15%. These results were taken as a positive confirmation of the performance of both technologies.
0
2
4
6
8
10
12
14
16
18
20
-0.5
-0.4
-0.3
-0.2
-0.1 0
0.1
0.2
0.3
0.4 0.5
Mor
e
% deviation
Fre
qu
en
cy
0
2
4
6
8
10
12
14
16
18
20
-0.5
-0.4
-0.3
-0.2
-0.1 0
0.1
0.2
0.3
0.4 0.5
Mor
e
% deviation
Fre
qu
en
cy
Figure 11 Comparison of Caldon USM and Coriolis meter totals on LNG
The project team responsible for the trials at Kenai was satisfied with the flow measurement performance of the Caldon ultrasonic meter and the Coriolis meters. However, other factors proved to be important in the final selection.
Ensuring minimum pressure drop was the biggest factor in the final meter selection. The importance of this issue was increased further by the project requirement for check metering. Two Coriolis meters in series would have created too much pressure drop. On the other hand the Caldon ultrasonic meter is non-intrusive and it its 8-path form requires no flow conditioning. It also has two 4-path planes of transducers that can be operated independently and used in a duty/check arrangement. Furthermore, the 8-path model with dual electronics makes the meter extremely fault tolerant.
On this basis the Caldon meter was selected for the Qatar Common LNG Project, and the meter supplied for the trials has now been in service in the Kenai plant from more than five years.
Qatar Common LNG Project
The Qatar LNG production at Ras Laffan Industrial City comprises two operators, Rasgas and Qatargas. The site contains two tank farms designated Lot H and Lot N. The purpose of the Common storage project was to reduce the cost of storage facilities by having common storage tanks rather than dedicated storage facilities for each production train. Figure 12 shows the arrangement whereby in-line dynamic measurement provides allocation metering for each production train.

Figure 12 Ras Laffan Industrial City LNG Production
In addition to the inline measurement of LNG production the facility exists for the transfer of LNG between tank farms by means of bi-directional ultrasonic meters. The first measurement system was commissioned in August 2009 with the last system, Qatargas Train 7 coming on stream in December 2010.
SUMMARY AND CONCLUSIONS
Custody transfer of LNG is performed on an energy basis, normally involving shipboard tank gauging combined with density and calorific value determination via gas chromatography. These methods (although various in their implementation), are well established, and guidelines exist to help in their implementation.
The GIIGNL handbook gives estimates of uncertainty for volume, density and GCV of 0.21%, 0.23% and 0.30% respectively.
In-line allocation and custody transfer measurement of LNG is a relatively new development. The nature of the fluid, and the lack of in-situ proving imposes requirements that are not easily met by many metering technologies. Ultrasonic and Coriolis meters both have many suitable characteristics for LNG measurement and have been shown to have acceptable measurement performance. The main advantage of Coriolis technology is that it is mass based, whereas ultrasonic meters can handle high throughput with very little pressure drop, and hence less risk of vaporization of LNG causing measurement errors.

Multipath ultrasonic meters are generally recognized to have better accuracy than more simple single path and two-path devices. However, even 4 and 5-path meters are normally used with flow conditioners owing to the influence of swirl. In LNG applications this is unattractive as the conditioner itself is also a cause of pressure drop. The approach adopted in Caldon meters for LNG allocation and custody transfer is to employ a second crossed path in each of the four chordal planes of the meter. This design makes the meter insensitive to swirl and ensures that the calibration can be transferred from the laboratory to the field with minimal additional uncertainty.
Independent evaluation has shown that +/- 0.22% uncertainty in volume measurement can be obtained when using Caldon multipath ultrasonic meters. This level of uncertainty is comparable to what can be achieved using tank gauging and shows that in addition to allocation measurement, in-line measurement could be used for custody transfer or for check metering of tanker loading and unloading.