Embed Size (px)
Citation preview
Measurement of Color PPG Using
QuasaR™ Device
February 2019
2
Color PPG Using QuasaR™ Device © 2019 Think Biosolution
Abstract
Background The QuasaR™ device measures color PPG, which can then be post-processed to derive biometric parameters such as heart rate (HR), heart rate variability (HRV), respiratory rate (RR), and blood oxygen saturation (SpO2). The QuasaR™ device uses a novel optical sensor (color sensor) to measure changes in the skin color over time, i.e. photoplethysmography (PPG) instead of a photodiode. In this feasibility study, we describe the basic signal processing involved in the post-processing of the color PPG signal in measuring the biometric parameters, both while the subject is at rest and moving at a particular speed.
Objective QuasaR™ device is a smart wearable biometric tracking device that can help subjects continuously track their health and well-being both at home and at a clinical setting. The QuasaR™ device will sit on the chest (upper sternum) and will be held in position with a strap. The QuasaR™ device also measured additional parameters such as the type of movement, number of steps per unit time, core body temperature and GPS based location. The QuasaR™ device’s smart dashboard (QuasaR™ continuous monitoring platform) reports the biometric and movement parameters on a timeline and can automatically tag medically significant events, such as a sudden rise in heart rate.
Methods In the first part of this study, we report the underlying algorithms used by the QuasaR™ device to compute the biometric parameters. In the second part of this study the reliability of the QuasaR™ device and strap system in measuring biometric parameters on four subjects both at rest and running at two particular speeds. In the third part, we report how the QuasaR™ strap system was optimized to deliver the required perpendicular pressure so that it reliably measures biometric parameters from the subject’s chest, while the subject is resting.
Results We analyzed four subjects (Mean age is 31 years, weight is 82 kg, height of 176 cm). For QuasaR™ device while the subject is resting, the measured heart rate {FFT (fast Fourier transform) Avg=78.9 BPM, Min= 60.4 BPM, Max=96.6 BPM}, and heart rate variability (RMSSD - Avg=113.52 ms, Min=30.1 ms, Max=262.0 ms) is correlated with the gold standard instrument method. In this study, we avoided computing parameters like RR and SpO2 since the color PPGs are captured over 10 seconds, and it is too short a window to derive meaningful results.
Conclusions QuasaR™ can measure all two biometric parameters, i.e. heart rate and heart rate variability reasonably accurately.
3
Color PPG Using QuasaR™ Device © 2019 Think Biosolution
Introduction
The health and wellness tracking industry has been disrupted with the advent of wearable devices [1]. We now
have consumer grade thermometers [2], pulse monitors [3]– [5], pedometers [6], sleep trackers [7], calorie trackers
[8], and blood sugar monitors [9], that can continuously track one or more biometric parameters. However, the
most widely used variants are perhaps wristband based activity trackers like Fitbit, Jawbone, Garmin and Apple
Watch which combines pedometers with green light based photoplethysmogram (PPG) to track HR. Apple Watch
has additional single-lead electrocardiograph (ECG) to intermittently track HR more reliably. These wristband based
activity trackers are often targeted at the so-called fitness enthusiasts to motivate them to walk a minimum number
of steps per day and therefore live healthier lives. Fuelled by the popularity of wrist-band based wearable
companies, other wearable companies have introduced FDA approved and EMR compatible medical devices to be
used in a hospital or at home. Companies such as Vitalpatch and Biotricity use single-lead ECG based devices,
whereas Snap40, Valdic and CouldDX use optical PPG based instruments to track one or more biometric
parameters in clinical settings. Smart clothing companies such as Athos, Hexoskin, Myontec and Clothing+ designs
and manufactures their own ECG based smart apparel target only professional athletes and coaches.
Professional athletes and coaches are also using GPS trackers coupled with single lead ECG based heart rate
trackers to monitor endurance.
A 12-lead ECG is the gold standard signal that is used for monitoring HR and HRV. Single-lead ECG technology can
also measure HR and heart rate variability (HRV) accurately, however miniaturizing and integrating them with
fabrics in the apparel for regular use at an affordable price is a challenge. PPG sensors are less invasive (does not
require electrical leads to touch the body) and therefore allow the subject to move freely. Besides, additional
biometric parameters such as respiratory rate and blood oxygen saturation can be derived from PPG sensors. In
this study, we aim to establish the basic working principle of a new type of PPG sensor (color PPG sensor) that can
do multiple parameter tracking but has the accuracy of a single-lead ECG sensor.
Pulse/ HR is defined as the number of times the heart beats per minute and heart rate variability (HRV) is defined
as the amount of variance between each consecutive heartbeat. HR is widely used in the assessment of cardiac
health such as predicting myocardial infarctions, and HRV is used in the study of the autonomic nervous system. In
sports medicine, HR combined with speed is used to compute predictors like heart rate-running speed index, which
can then be used to track and therefore improve the cardiac endurance of athletes. HRV as a function of time is
used to determine if an athlete is overtraining. When the patient is not moving, both HR and HRV can be reliably
measured using an optical sensor technology called photoplethysmogram i.e. where the variation of transmissivity
and/or reflectivity of light is measured through the tissue as a function of arterial pulsation [10]– [12], followed by
different signal post-processing approaches [10]–[14]. The wavelength under consideration varies from near-
infrared (NIR) [10] to red or green [11] and even white flashlight [15] for fingertip based sensor systems. The
accuracy in measuring HR and HRV using PPG based approaches can be affected by a variety of factors including,
movement and skin color [16]–[18].
Respiratory rate (RR) is defined as the number of times you breathe per minute and is widely used to predict
respiratory dysfunction and circulatory health of an individual in clinical settings. In sports medicine, RR is seldom
used as it is difficult to measure when the subject is moving. However, RR as a function of exercise intensity can
be used to distinguish between aerobic and anaerobic regimens. Measurement of RR in clinical settings typically
consists of capnography, where the change in concentration or partial pressure of carbon dioxide is measured in
4
Color PPG Using QuasaR™ Device © 2019 Think Biosolution
exhaled respiratory gases, or pneumography, where the movement is measured as a change in pressure [19], [20].
Other less accurate ways of measuring RR include electrophysiological measurements analogous to
electrocardiography (ECG) [21] and/or PPG [10]–[12], [22]. Blood oxygen saturation (SpO2) is defined as an
estimate of the percentage of oxygen bound to hemoglobin in the peripheral blood. It is measured by using a PPG
primarily at the fingertip or the earlobe [23]–[27] and is an approximation of the actual arterial oxygen saturation
(SaO2). SpO2 is measured using the ratios of the varying transmissivity of alternating pulses of infrared and red light
on the skin surface [23], due to the differential transmissivity of oxyhemoglobin (HbO2) and hemoglobin (Hb) at
varying wavelengths [25].
In Section II we first discuss the various experimental setups and then in Section III we discuss in details the different
operational modes of the device to extract biometric parameters like HR and HRV from color PPG. We avoid
computing parameters like RR and SpO2 since the color PPGs are captured over 10 seconds, and it is too short a
window to derive meaningful results. This is followed by Section IV where we discuss the results and validate the
performance of color PPG with standard PPG. In Section V we summarise current findings and discuss future work.
II. Experimental Device
A. QuasaR™ Device
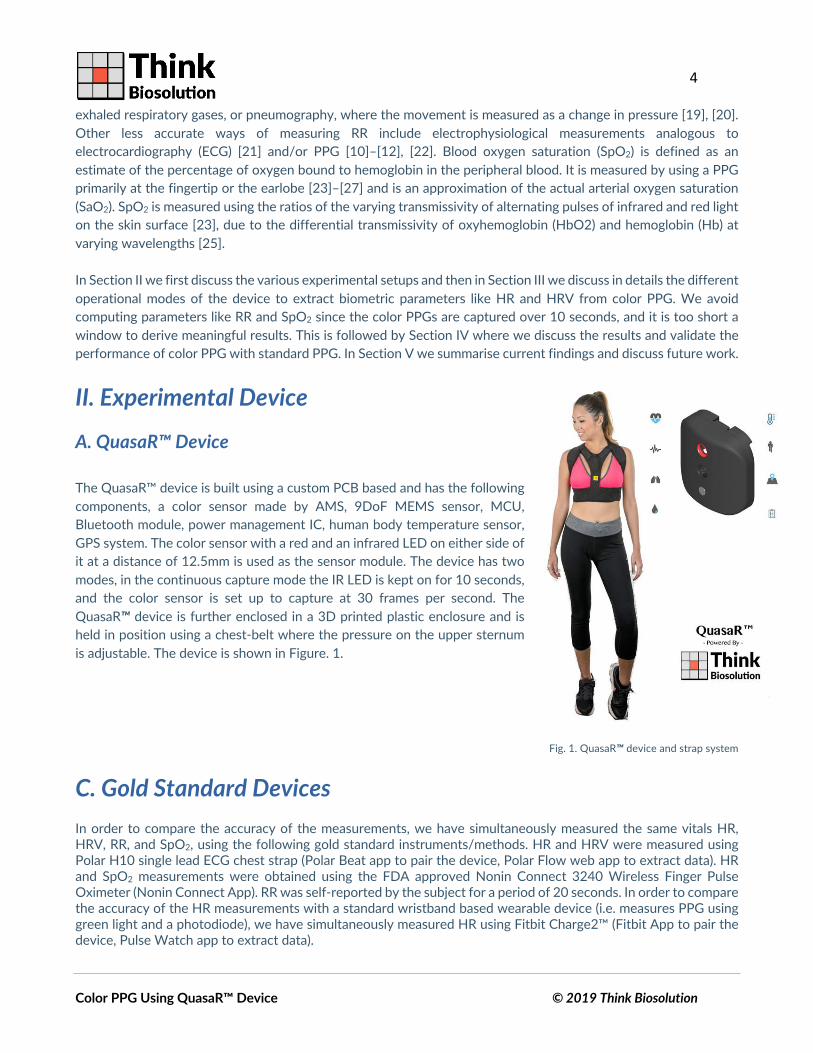
The QuasaR™ device is built using a custom PCB based and has the following
components, a color sensor made by AMS, 9DoF MEMS sensor, MCU,
Bluetooth module, power management IC, human body temperature sensor,
GPS system. The color sensor with a red and an infrared LED on either side of
it at a distance of 12.5mm is used as the sensor module. The device has two
modes, in the continuous capture mode the IR LED is kept on for 10 seconds,
and the color sensor is set up to capture at 30 frames per second. The
QuasaR™ device is further enclosed in a 3D printed plastic enclosure and is
held in position using a chest-belt where the pressure on the upper sternum
is adjustable. The device is shown in Figure. 1.
Fig. 1. QuasaR™ device and strap system
C. Gold Standard Devices
In order to compare the accuracy of the measurements, we have simultaneously measured the same vitals HR, HRV, RR, and SpO2, using the following gold standard instruments/methods. HR and HRV were measured using Polar H10 single lead ECG chest strap (Polar Beat app to pair the device, Polar Flow web app to extract data). HR and SpO2 measurements were obtained using the FDA approved Nonin Connect 3240 Wireless Finger Pulse Oximeter (Nonin Connect App). RR was self-reported by the subject for a period of 20 seconds. In order to compare the accuracy of the HR measurements with a standard wristband based wearable device (i.e. measures PPG using green light and a photodiode), we have simultaneously measured HR using Fitbit Charge2™ (Fitbit App to pair the device, Pulse Watch app to extract data).
5
Color PPG Using QuasaR™ Device © 2019 Think Biosolution
III. Measurement Method
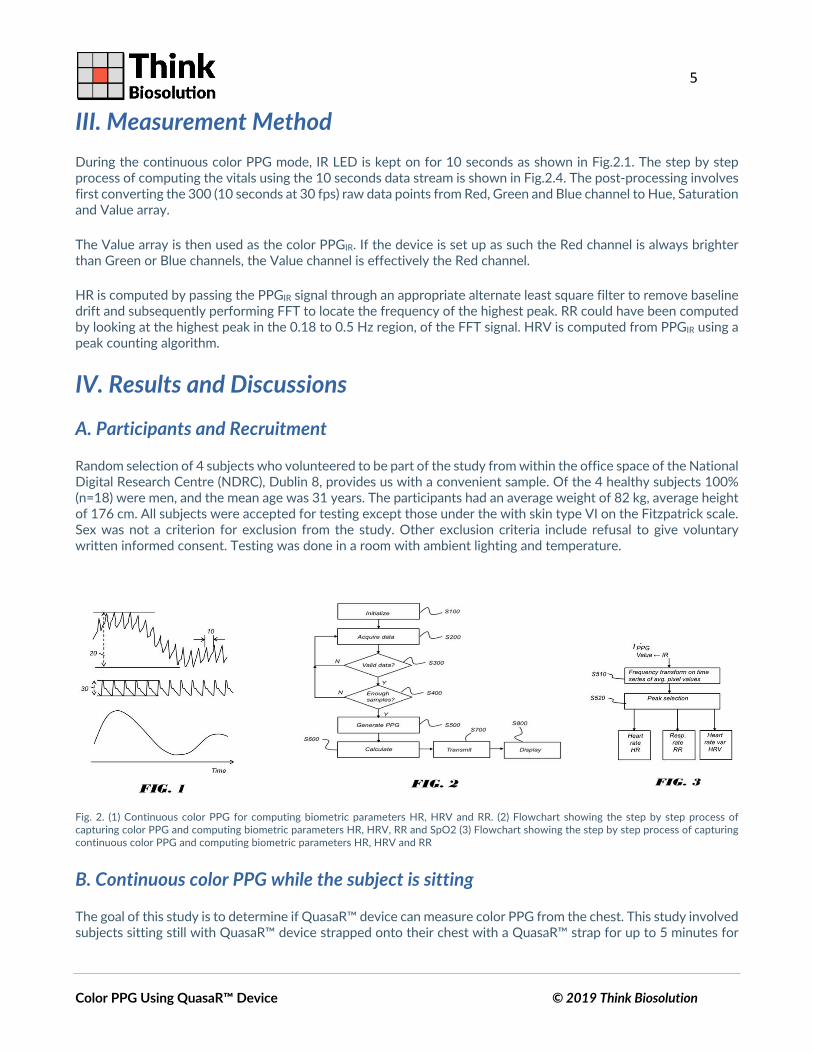
During the continuous color PPG mode, IR LED is kept on for 10 seconds as shown in Fig.2.1. The step by step process of computing the vitals using the 10 seconds data stream is shown in Fig.2.4. The post-processing involves first converting the 300 (10 seconds at 30 fps) raw data points from Red, Green and Blue channel to Hue, Saturation and Value array.
The Value array is then used as the color PPGIR. If the device is set up as such the Red channel is always brighter than Green or Blue channels, the Value channel is effectively the Red channel.
HR is computed by passing the PPGIR signal through an appropriate alternate least square filter to remove baseline drift and subsequently performing FFT to locate the frequency of the highest peak. RR could have been computed by looking at the highest peak in the 0.18 to 0.5 Hz region, of the FFT signal. HRV is computed from PPGIR using a peak counting algorithm.
IV. Results and Discussions
A. Participants and Recruitment
Random selection of 4 subjects who volunteered to be part of the study from within the office space of the National Digital Research Centre (NDRC), Dublin 8, provides us with a convenient sample. Of the 4 healthy subjects 100% (n=18) were men, and the mean age was 31 years. The participants had an average weight of 82 kg, average height of 176 cm. All subjects were accepted for testing except those under the with skin type VI on the Fitzpatrick scale. Sex was not a criterion for exclusion from the study. Other exclusion criteria include refusal to give voluntary written informed consent. Testing was done in a room with ambient lighting and temperature.
Fig. 2. (1) Continuous color PPG for computing biometric parameters HR, HRV and RR. (2) Flowchart showing the step by step process of
capturing color PPG and computing biometric parameters HR, HRV, RR and SpO2 (3) Flowchart showing the step by step process of capturing
continuous color PPG and computing biometric parameters HR, HRV and RR
B. Continuous color PPG while the subject is sitting
The goal of this study is to determine if QuasaR™ device can measure color PPG from the chest. This study involved subjects sitting still with QuasaR™ device strapped onto their chest with a QuasaR™ strap for up to 5 minutes for
6
Color PPG Using QuasaR™ Device © 2019 Think Biosolution
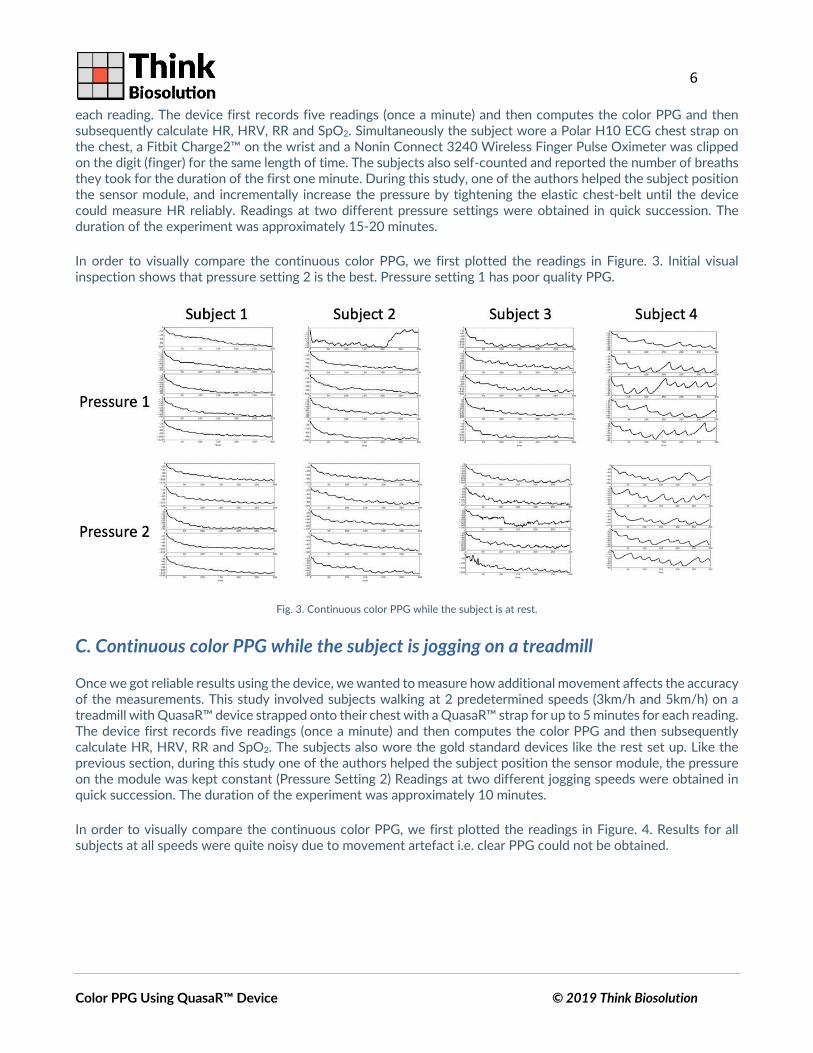
each reading. The device first records five readings (once a minute) and then computes the color PPG and then subsequently calculate HR, HRV, RR and SpO2. Simultaneously the subject wore a Polar H10 ECG chest strap on the chest, a Fitbit Charge2™ on the wrist and a Nonin Connect 3240 Wireless Finger Pulse Oximeter was clipped on the digit (finger) for the same length of time. The subjects also self-counted and reported the number of breaths they took for the duration of the first one minute. During this study, one of the authors helped the subject position the sensor module, and incrementally increase the pressure by tightening the elastic chest-belt until the device could measure HR reliably. Readings at two different pressure settings were obtained in quick succession. The duration of the experiment was approximately 15-20 minutes.
In order to visually compare the continuous color PPG, we first plotted the readings in Figure. 3. Initial visual inspection shows that pressure setting 2 is the best. Pressure setting 1 has poor quality PPG.
Fig. 3. Continuous color PPG while the subject is at rest.
C. Continuous color PPG while the subject is jogging on a treadmill
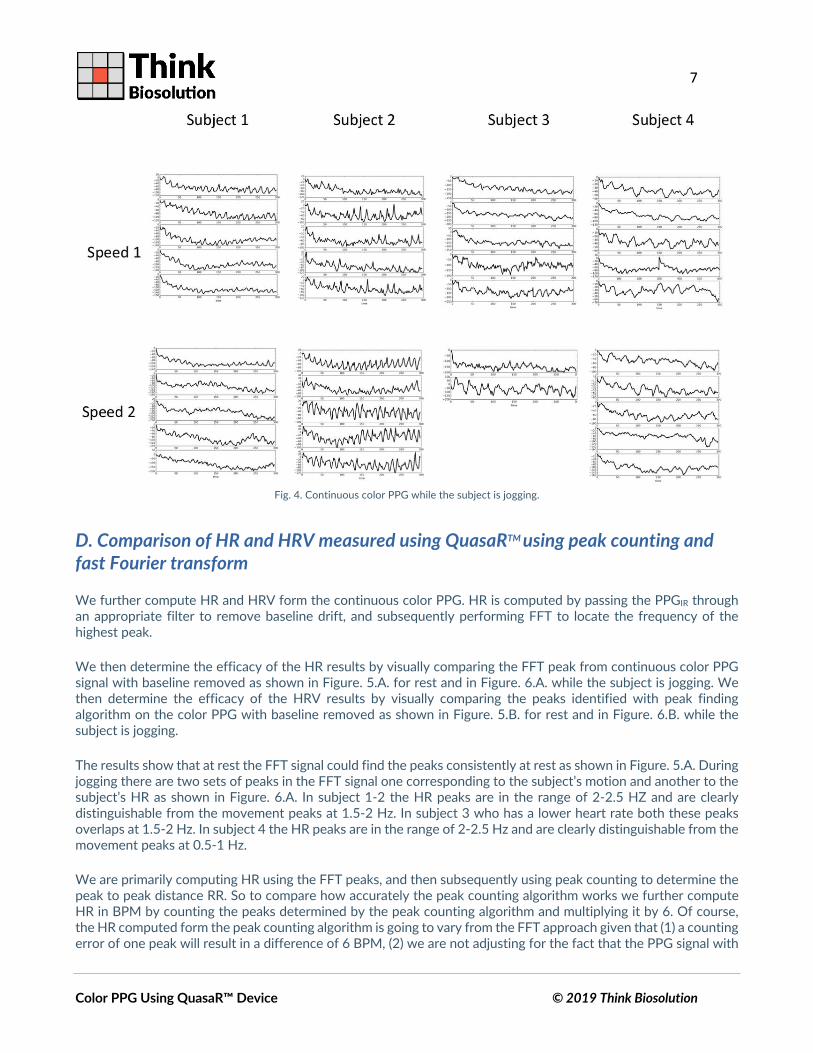
Once we got reliable results using the device, we wanted to measure how additional movement affects the accuracy of the measurements. This study involved subjects walking at 2 predetermined speeds (3km/h and 5km/h) on a treadmill with QuasaR™ device strapped onto their chest with a QuasaR™ strap for up to 5 minutes for each reading. The device first records five readings (once a minute) and then computes the color PPG and then subsequently calculate HR, HRV, RR and SpO2. The subjects also wore the gold standard devices like the rest set up. Like the previous section, during this study one of the authors helped the subject position the sensor module, the pressure on the module was kept constant (Pressure Setting 2) Readings at two different jogging speeds were obtained in quick succession. The duration of the experiment was approximately 10 minutes.
In order to visually compare the continuous color PPG, we first plotted the readings in Figure. 4. Results for all subjects at all speeds were quite noisy due to movement artefact i.e. clear PPG could not be obtained.
7
Color PPG Using QuasaR™ Device © 2019 Think Biosolution
Fig. 4. Continuous color PPG while the subject is jogging.
D. Comparison of HR and HRV measured using QuasaRTM using peak counting and
fast Fourier transform
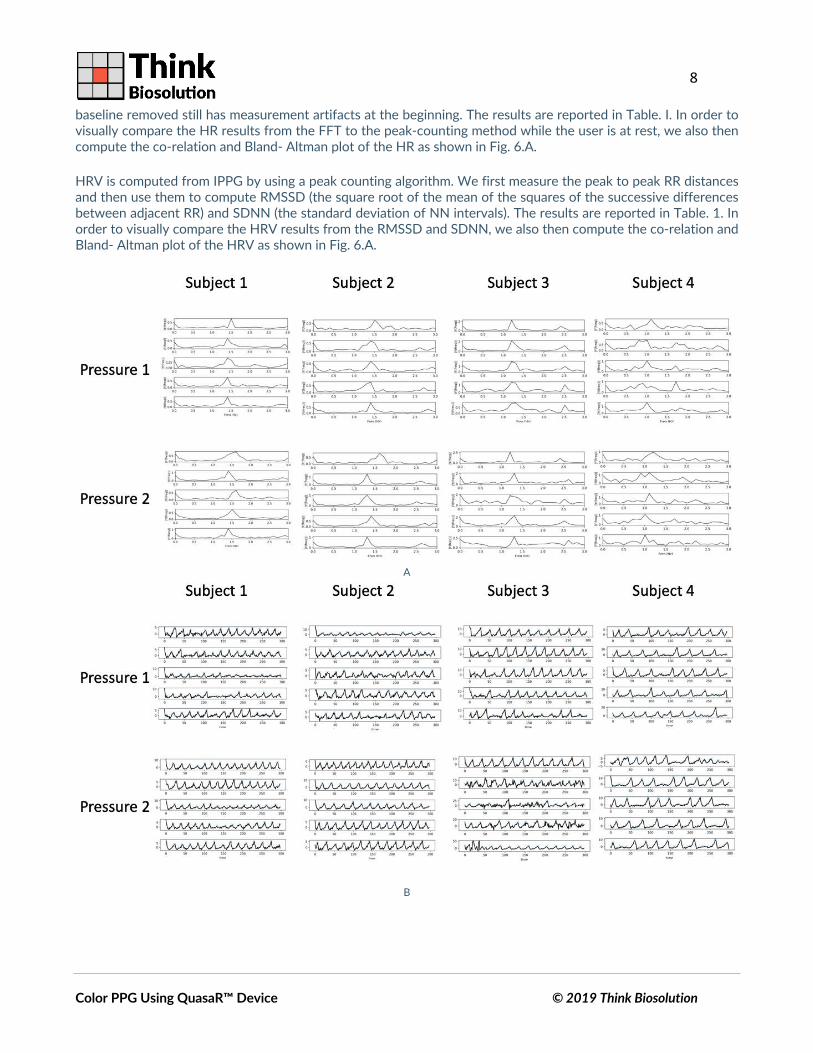
We further compute HR and HRV form the continuous color PPG. HR is computed by passing the PPGIR through an appropriate filter to remove baseline drift, and subsequently performing FFT to locate the frequency of the highest peak.
We then determine the efficacy of the HR results by visually comparing the FFT peak from continuous color PPG signal with baseline removed as shown in Figure. 5.A. for rest and in Figure. 6.A. while the subject is jogging. We then determine the efficacy of the HRV results by visually comparing the peaks identified with peak finding algorithm on the color PPG with baseline removed as shown in Figure. 5.B. for rest and in Figure. 6.B. while the subject is jogging.
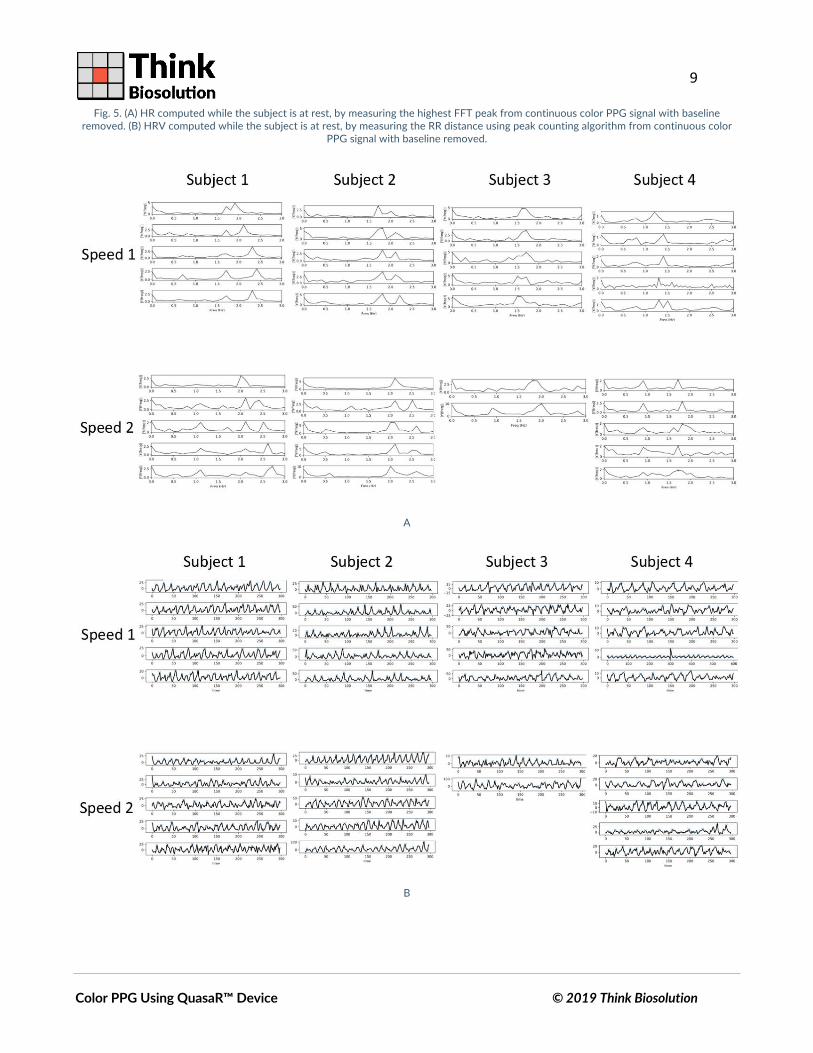
The results show that at rest the FFT signal could find the peaks consistently at rest as shown in Figure. 5.A. During jogging there are two sets of peaks in the FFT signal one corresponding to the subject’s motion and another to the subject’s HR as shown in Figure. 6.A. In subject 1-2 the HR peaks are in the range of 2-2.5 HZ and are clearly distinguishable from the movement peaks at 1.5-2 Hz. In subject 3 who has a lower heart rate both these peaks overlaps at 1.5-2 Hz. In subject 4 the HR peaks are in the range of 2-2.5 Hz and are clearly distinguishable from the movement peaks at 0.5-1 Hz.
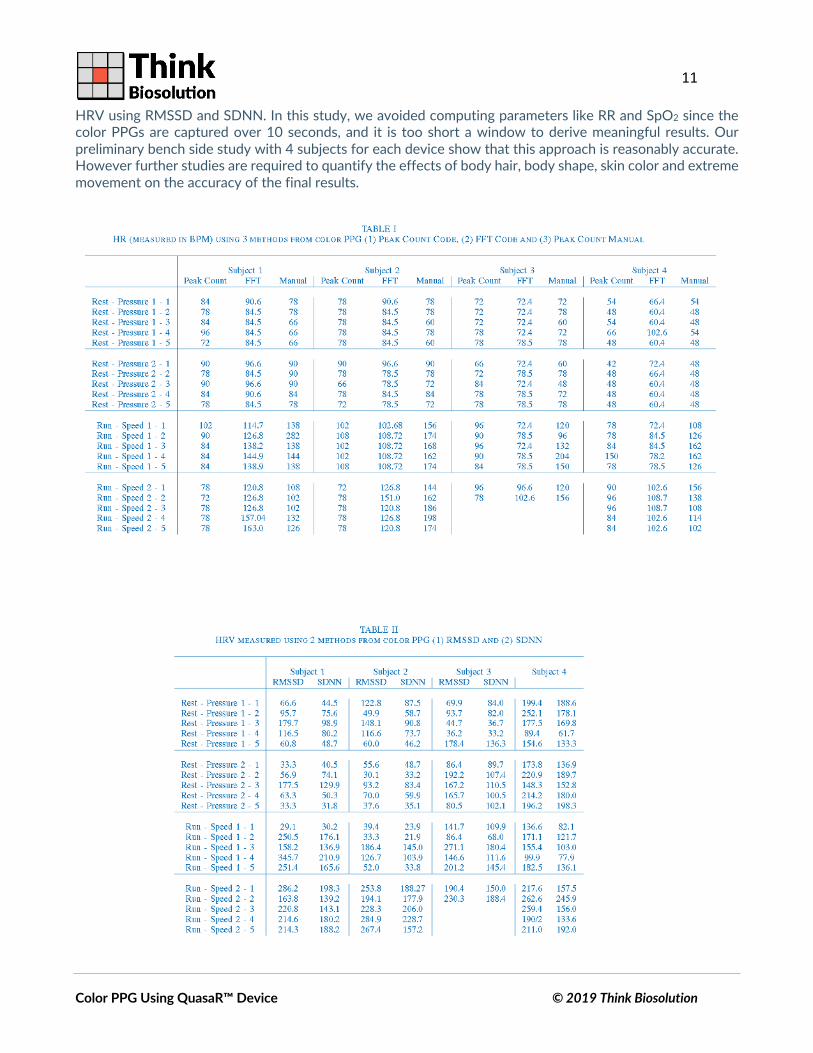
We are primarily computing HR using the FFT peaks, and then subsequently using peak counting to determine the peak to peak distance RR. So to compare how accurately the peak counting algorithm works we further compute HR in BPM by counting the peaks determined by the peak counting algorithm and multiplying it by 6. Of course, the HR computed form the peak counting algorithm is going to vary from the FFT approach given that (1) a counting error of one peak will result in a difference of 6 BPM, (2) we are not adjusting for the fact that the PPG signal with
8
Color PPG Using QuasaR™ Device © 2019 Think Biosolution
baseline removed still has measurement artifacts at the beginning. The results are reported in Table. I. In order to visually compare the HR results from the FFT to the peak-counting method while the user is at rest, we also then compute the co-relation and Bland- Altman plot of the HR as shown in Fig. 6.A.
HRV is computed from IPPG by using a peak counting algorithm. We first measure the peak to peak RR distances and then use them to compute RMSSD (the square root of the mean of the squares of the successive differences between adjacent RR) and SDNN (the standard deviation of NN intervals). The results are reported in Table. 1. In order to visually compare the HRV results from the RMSSD and SDNN, we also then compute the co-relation and Bland- Altman plot of the HRV as shown in Fig. 6.A.
A
B
9
Color PPG Using QuasaR™ Device © 2019 Think Biosolution
Fig. 5. (A) HR computed while the subject is at rest, by measuring the highest FFT peak from continuous color PPG signal with baseline
removed. (B) HRV computed while the subject is at rest, by measuring the RR distance using peak counting algorithm from continuous color
PPG signal with baseline removed.
A
B
10
Color PPG Using QuasaR™ Device © 2019 Think Biosolution
Fig. 6. (A) HR computed while the subject is jogging, by measuring the highest FFT peak from continuous color PPG signal with baseline
removed. (B) HRV computed while the subject is jogging, by measuring the RR distance using peak counting algorithm from continuous color
PPG signal with baseline removed.
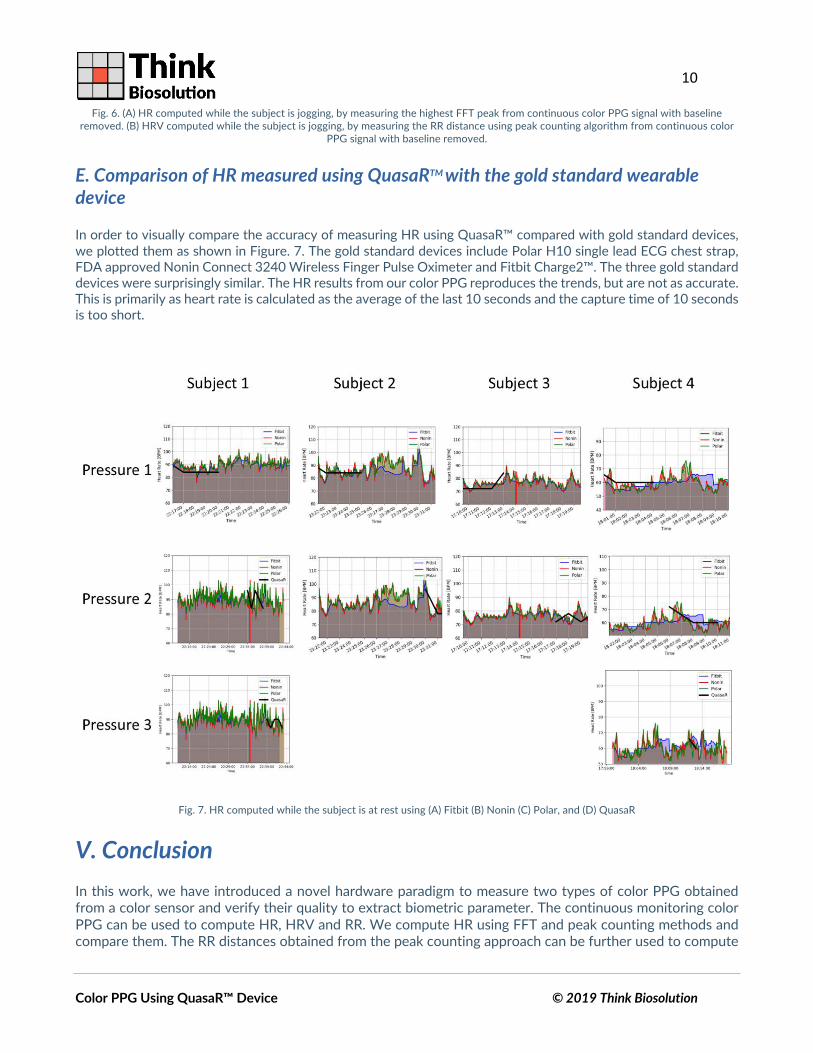
E. Comparison of HR measured using QuasaRTM with the gold standard wearable
device
In order to visually compare the accuracy of measuring HR using QuasaR™ compared with gold standard devices,
we plotted them as shown in Figure. 7. The gold standard devices include Polar H10 single lead ECG chest strap, FDA approved Nonin Connect 3240 Wireless Finger Pulse Oximeter and Fitbit Charge2™. The three gold standard devices were surprisingly similar. The HR results from our color PPG reproduces the trends, but are not as accurate. This is primarily as heart rate is calculated as the average of the last 10 seconds and the capture time of 10 seconds is too short.
Fig. 7. HR computed while the subject is at rest using (A) Fitbit (B) Nonin (C) Polar, and (D) QuasaR
V. Conclusion
In this work, we have introduced a novel hardware paradigm to measure two types of color PPG obtained from a color sensor and verify their quality to extract biometric parameter. The continuous monitoring color
PPG can be used to compute HR, HRV and RR. We compute HR using FFT and peak counting methods and compare them. The RR distances obtained from the peak counting approach can be further used to compute
11
Color PPG Using QuasaR™ Device © 2019 Think Biosolution
HRV using RMSSD and SDNN. In this study, we avoided computing parameters like RR and SpO2 since the color PPGs are captured over 10 seconds, and it is too short a window to derive meaningful results. Our
preliminary bench side study with 4 subjects for each device show that this approach is reasonably accurate. However further studies are required to quantify the effects of body hair, body shape, skin color and extreme
movement on the accuracy of the final results.
12
Color PPG Using QuasaR™ Device © 2019 Think Biosolution
REFERENCES
1. W. Song, H. Yu, C. Liang, Q. Wang, and Y. Shi, “Body monitoring system design based on android smartphone,” in Information and Communication Technologies (WICT), 2012 World Congress on. IEEE, 2012, pp. 1147–1151.
2. Kinsa smart thermometer. [Online]. Available: https://kinsahealth.com/
3. A. Al-Ali and M. E. Kiani, “Pulse oximeter monitor for expressing the urgency of the patient’s condition,” 2003, US Patent 6,542,764.
4. J. Achten and A. E. Jeukendrup, “Heart rate monitoring,” Sports medicine, vol. 33, no. 7, pp. 517–538, 2003. 5. E. Jonathan and M. Leahy, “Investigating a smartphone imaging unit for photoplethysmography,”
Physiological Measurement, vol. 31, no. 11, p.N79, 2010.
6. J. Takacs, C. L. Pollock, J. R. Guenther, M. Bahar, C. Napier, and M. A. Hunt, “Validation of the fitbit one activity monitor device during treadmill walking,” Journal of Science and Medicine in Sport, vol. 17, no. 5, pp. 496–500, 2014.
7. Fitbit. [Online]. Available: https://fitbit.com/
8. W. Lee, Y. M. Chae, S. Kim, S. H. Ho, and I. Choi, “Evaluation of a mobile phone-based diet game for weight control,” Journal of telemedicine and telecare, vol. 16, no. 5, pp. 270–275, 2010.
9. J. Tran, R. Tran, and J. R. White, “Smartphone-based glucose monitors and applications in the management of diabetes: an overview of 10 salient “apps” and a novel smartphone-connected blood glucose monitor,” Clinical Diabetes, vol. 30, no. 4, pp. 173–178, 2012.
10. P. Rolfe, “In Vivo Near-Infrared Spectroscopy,” Annual Review of Biomedical Engineering, vol. 2, no. 1, pp. 715–754, Aug. 2000.
11. N. G. Roald, “Estimation of Vital Signs from Ambient-Light Non- Contact Photoplethysmography,” Ph.D. dissertation, Norwegian University of Science and Technology, 2013.
12. T. Tamura, Y. Maeda, M. Sekine, and M. Yoshida, “Wearable photo-plethysmographic sensors-past and present,” Electronics, vol. 3, no. 2, pp. 282–302, 2014.
13. W. G. Zijlstra, a. Buursma, and W. P. Meeuwsen-van der Roest, “Absorption spectra of human fetal and adult oxyhemoglobin, deoxyhemoglobin, carboxyhemoglobin, and methemoglobin,” Clinical Chemistry, vol. 37, no. 9, pp. 1633–1638, 1991.
14. T. force of the European Society of Cardiology, the North American Society of Pacing, and Electrophysiology, “Heart rate variability standards of measurement, physiological interpretation, and clinical use,” European Heart Journal, vol. 17, pp. 354–381, 1996.
15. Instant heart rate by azumio. [Online]. Available: http://www.azumio.com/s/instantheartrate/index.html
16. H. Y. Wu, M. Rubinstein, E. Shih, J. Guttag, F. Durand, and W. Freeman, “Eulerian video magnification for revealing subtle changes in the world,” ACM Transactions on Graphics, vol. 31, no. 4, pp. 1–8, 2012.
17. C. F. Poets and V. a. Stebbens, “Detection of movement artifact in recorded pulse oximeter saturation.” European journal of pediatrics, vol. 156, no. 10, pp. 808–11, Oct. 1997.
18. R. Stojanovic and D. Karadaglic, “A led-led-based photoplethysmography sensor,” Physiological Measurement, vol. 28, no. 6, pp. N19–N27, 2007.
19. T. Yilmaz, R. Foster, and Y. Hao, “Detecting vital signs with wearable wireless sensors.” Sensors (Basel, Switzerland), vol. 10, no. 12, pp. 10 837–62, Jan. 2010.
20. E. a. Simoes, R. Roark, S. Berman, L. L. Esler, and J. Murphy, “Respiratory rate: measurement of variability
over time and accuracy at different counting periods,” Archives of disease in childhood, vol. 66, no. 10, pp. 1199–1203, 1991.
21. Dan Wu, Ping Yang, Guan-Zheng Liu, and Yuan-Ting Zhang, “Auto- matic estimation of respiratory rate from pulse transit time in normal subjects at rest,” in Proceedings of 2012 IEEE-EMBS International Conference on Biomedical and Health Informatics, vol. 25, no. Bhi. IEEE, Jan. 2012, pp. 779–781.
22. W. Verkruysse, L. O. Svaasand, and J. S. Nelson, “Remote plethysmo- graphic imaging using ambient light.” Optics Express, vol. 16, no. 26, pp. 21 434–21 445, 2008.
23. Analog Devices, “High Precision, Low Power, Low Cost Pulse Oximeter Infrared and Red Current Sinks,” pp. 1–4, 2009.
13
Color PPG Using QuasaR™ Device © 2019 Think Biosolution
24. Texas Instruments, “SpO Pulse Ox Wrist Oximeter Reference Design,” 2013.
25. J. M. Goldman, M. T. Petterson, R.J. Kopotic, and S. J. Barker, “Masimo signal extraction pulse oximetry.” Journal of clinical monitoring and computing, vol. 16, no. 7, pp. 475–83, Jan. 2000.
26. K. Humphreys, T. Ward, and C. Markham, “A CMOS camera-based pulse oximetry imaging system," in 2005 IEEE Engineering in Medicine and Biology 27th Annual Conference, vol. 4. IEEE, 2005, pp. 3494–3497.
27. K. Hung, W. Chan, and C. Lee, “Preliminary design of an intelligent finger-ring sensor for physiologic monitoring in mobile health,” in AMA- IEEE Medical Technology Conference, Boston, 2011, pp. 16–18.
28. “Rgb to hsv,” http://www.rapidtables.com/convert/color/rgb-to-hsv.htm.
29. U. Rubins, V. Upmalis, O. Rubenis, D. Jakovels, and J. Spigulis, “Real- time photoplethysmography imaging system,” IFMBE Proceedings, vol.
30. 34 IFMBE, no. 2008, pp. 183–186, 2011.
31. M.-Z. Poh, D. J. McDuff, and R. W. Picard, “Non-contact, automated cardiac pulse measurements using video imaging and blind source separation.” Optics express, vol. 18, no. 10, pp. 10 762–10 774, 2010.
32. J. Henrie, S. Kellis, S. M. Schultz, and A. Hawkins, “Electronic color charts for dielectric films on silicon,”
Optical Express, 2004.
33. A.R. Guazzi, M. Villarroel, J. Jorge, J. Daly, M. C. Frise, P. A. Robbins, and L. Tarassenko, “Non-contact measurement of oxygen saturation with an rgb camera,” Biomedical optics express, vol. 6, no. 9, pp. 3320–3338, 2015.
34. H. Liu, K. Ivanov, Y. Wang, and L. Wang, “A novel method based on two cameras for accurate estimation of arterial oxygen saturation,” Biomedical engineering online, vol. 14, no. 1, p. 1, 2015.