Embed Size (px)
Citation preview
PINSTECH/RIAD 129
MEASUREMENT OF CARBON -14 IN
HYDROLOGICAL SAMPLES
vf.*v»:
jv
fM'f j
SYED DILDAR HUSSAIN
n r. iijnni1
RADIATION & ISOTOPE APPLICATIONS DIVISION
Pakistan Institute of Nuclear Science & Technology P. O. Nilore, Islamabad.
November, 1991.
\
PINSTECH/RIAD - 129
MEASUREMENT OF CARBON - 14 IN HYDROLOGICAL SAMPLES
SYED DILDAR HUS8AIN
RADIATION & ISOTOPE APPLICATIONS D IV IS ION
PAKISTAN INSTITUTE OF NUCLEAR SCIENCE ft TECHNOLOGY
I ' . O . N I U J K t , ISLAMABAD Novambar, 1991.
•*
CONTENTS
S.NO. Description Page
ABSTRACT 1. INTRODUCTION 1 2. ORIGIN AND DISTRIBUTION OF RADIOCARBON 2
2.1 Radiocarbon in Atmosphere 2 2.1.1 Natural Production 2 2.1.2 Nuclear Weapon Tests 3 2.1.3 Activity of Radiocarbon 3 2.2 Radiocarbon in Groundwater 4 2.2.1 Transfer of Atmospheric Carbon Dioxide
to Groundwater 4 2.2.2 Biogenic Carbon Dioxide in Groundwater 4 2.2.3 Total Dissolved Inorganic Carbon 5 2.2.4 Initial Carbon-14 Content of Water 5
3. FRACTIONATION OF CARBON ISOTOPES 6 4. RADIOCARBON STANDARD 8 5. SAMPLING OF CARBON DISSOLVED IN WATER 9
5.1 Estimation of Volume of Water Sample 10 5.2 Recovery of Carbon From Water Sample 12
6. SYNTHESIS OF BENZENE 14 6.1 Preparation of Carbon Dioxide 15 6.1.1 Treatment of Carbonate Samples 15 6.1.2 Wet Oxidation of Oxalic Acid Standard 16 6.1.3 Purification of Carbon Dioxide 17 6.1.4 Calculation of Mass of Carbon in
Carbon Dioxide 17 6.2 Carbon Dioxide - Lithium Reaction 18 6.3 Preparation of Acetylene Gas 20 6.3.1 Calculation of Carbon Content of
Acetylene 20 6.4 Cyclization of Acetylene 21
6 . 4 . 1 Processes Af fec t ing Yield of Benzene 22 MEASUREMENT OF RADIOCARBON ACTIVITY 23
7.1 Liquid Scintillation Counting 23 7.1.1 Effect of Background Radiation 26 7.1.2 Interferences 26 7.2 Statistical Evaluation of Data 28 7.3 Calibration of Counting System 30 7.3.1 Quench Correction 31 7.4 Calculation of Results 32 7.4.1 Background 33 7.4.2 Radiocarbon Activity of Standard / TDIC 33 7.4.3 Correction of Net Standard Activity 33 7.4.4 Activity of Sample 34 7.4.5 Calculation of Age 34 7.5 Minimum Detectable Activity 35 7.6 Results of Carbon-14 Measurement 36
ACKNOWLEDGEMENTS 36 REFERENCES 37 APPENDIX-I 41
ABSTRACT
Thermal neutrons produced by cosmic rays or nuclear weapon tests interact with atmospheric nitrogen resulting in the formation of radiocarbon which, after oxidation into carbon dioxide, follows the natural carbon cycle. The partial pressure of carbon dioxide in the soil is several times that in the atmosphere due to plant root respiration and decay of organic matter. Water absorbs biogenic carbon dioxide while percolating through the unsaturated zone. The carbon content of groundwater is mainly in the form of bicarbonate ions. The extraction of carbon from water sample as barium carbonate is carried out in the field. Benzene is synthesised from the carbonate sample. The activity of radiocarbon in the synthesised benzene is determined by using a liquid scintillation analyzer. Details of sampling procedure, benzene synthesis, counter calibration and treatment of sample data have been given.
1. INTRODUCTION
Radiocarbon, a radioactive isotope of carbon ie produced in the upper atmosphere by the interaction of cosmic ray produced thermal neutrons with nitrogen On oxidation into carbon dioxide, it joins the natural carbon dioxide cycle thereby labelling the carbonaceous materials directly or indirectly. It decays with a half life of 5730 years by emitting beta particles having maximum energy of 156 keV.
Water contains carbon principally in the form of bicarbonate ions and has radiocarbon derived from biogenic carbon dioxide dissolved while percolating through the soil. The principal input of carbon-14 to groundwater occurs in the unsaturated zone where the partial pressure of carbon dioxide is much higher than that in the atmosphere due to plant root respiration and plant decay. Limestone in the unsaturated zone will also go into solution and so carbon-14 content of water will be altered. Changes in carbon-14 content of dissolved inorganic carbon of water taking place in the unsaturated zone are thus of primary importance. The problem is to determine the initial carbon-14 content of water before it reaches water table. Field measurement of pH, alkalinity and isotopic fractionation factor are used to interpret carbon-14 data. Determination of the radiocarbon content of water offers the possibility of dating old water bodies.
The carbon content of water is precipitated as carbonate of a suitable heavy metal such as barium or strontium and is converted into benzene through an intricate chemical process. Radiocarbon present in the synthesized benzene is measured by a liquid scintillation counting system and is expressed in terms of per cent of standard.
1
Various procedures involved are described ae follows.
2. ORIGIN AND DISTRIBUTION OF RADIOCARBON
The discovery of radiocarbon, methods and limitations of its use as a tool for dating various materials are treated in literature. Some information in this regard may be found in references 1-10. A brief account of origin and distribution of radiocarbon is as follows.
2.1 Radiocarbon in Axmosphere
The production and distribution of radiocarbon in the atmosphere is described below.
2.1.1 Natural Production
Radiocarbon is produced in nature at an altitude of about 12 km in the transition zone between stratosphere and troposphere by the interaction of thermal neutrons with atmospheric nitrogen. The effective thermal neutron capture cross section for nitrogen-14 is 1.7x10" cm . Neutrons with energies 5-10 MeV produced by energetic cosmic rays attain thermal energies by colliding with air molecules. The nuclear reaction which goes with considerable probability in the neutron energy region 0.4 to 1.6 MeV resulting in the production of C is
i 4N + n • 1 4C + *H (1)
As the intensity of neutrons increases with geomagnetic latitude, the production of radiocarbon is also affected accordingly. The highest production is at mid-latitudes. The northern hemisphere contains 4.5% more radiocarbon than the
2
southern hemisphere. This is due to faster absorption of radiocarbon in the sea which covers 40% more area in the southern hemisphere than in the northern hemisphere Prior to 1950 A.D. the atmosphere, sea and biosphere
so contained an estimated 2.16 * 10 atoms or 51 metric tons of "C < t 2 >.
2.1.2 Nuclear Weapon Tests
The detonation of nuclear and thermonuclear devices yields large thermal neutron fluxes. Testing of nuclear weapons in the atmosphere resulted in almost doubling of the radiocarbon in the terrestrial organics in the northern hemisphere in the spring of 1963. In the southern hemisphere the increase in C activity was about 65 % .This is so because the seasonal injection of C from the stratosphere into troposphere occured over the northern hemisphere. The 1961-62 nuclear tests added an additional 6 * 10 atoms of C to the atmosphere
2.1.3 Activity of Radiocarbon
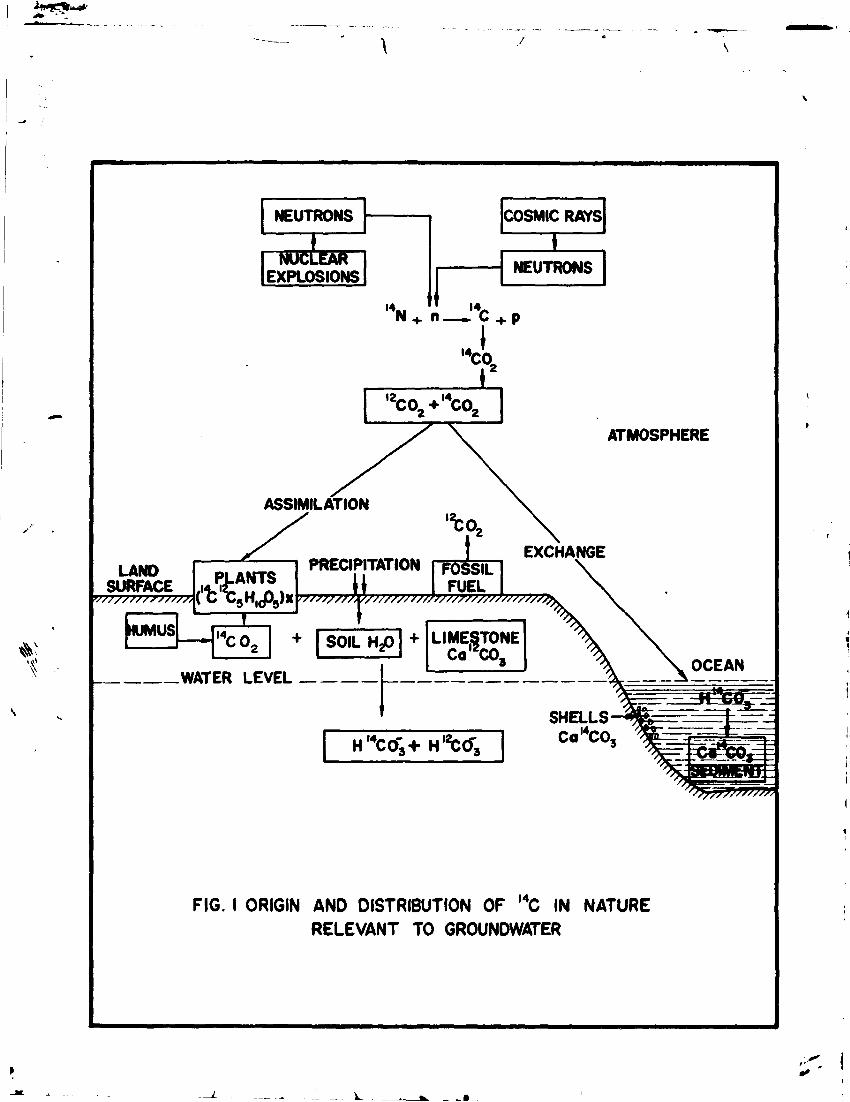
Radiocarbon produced as described above oxidizes to carbon dioxide ( CO ) and joins the natural carbon cycle (Fig.l). Due to its gaseous form and long residence time in troposphere radiocarbon is efficiently mixed in the troposphere. Combustion of fossil fuel lowered the carbon-14 activity in the 20th century wood by 2% as compared to the 19th century wood (Suess Effect)' '. The natural specific activity of carbon-14 in the atmosphere before any dilution was 13.56 ± 0.07 dpm/g carbon. This is refered to as "modern Carbon" or 100% modern carbon or 100 pmc.
3
2.2 Radiocarbon in Groundwater
Radiocarbon from the atmosphere enters water cycle by various processes ' A few sources of radiocarbon in water are briefly described:
2.2.1 Transfer of Atmospheric Carbon Dioxide to Groundwater
The following chemical processes are involved in the transfer of atmospheric carbon dioxide to groundwater.
C0 2 (gas) -s = "*• C0 2 (aqueous) (2) C0 2 (aqueous) » H 2C0 9 (3) H 2C0 a * HC0~ + H + (4) HCO~ ^ *- CO3" + H + (5) CO"" + Me + + % MeCC- (6)
3 3 where He is generally Ca but may be Hg , Fe etc
Most of C0_ molecules in the atmosphere enter the oceans and living marine organisms through exchange with oceanic dissolved carbon which is primarily in the form of bicarbonate.
2.2.2 Biogenic Carbon Dioxide in Groundwater
C0 2 is assimilated by plants which in turn are consumed by animals. Plants release carbon dioxide into the soil zone by root respiration. Fermentation and decay of organic matter also releases carbon dioxide into the soil. The partial pressure of carbon dioxide in the soil is much higher ( « 10" atro. ) as compared to that in the atmosphere («3.4 x 10 atm. ). Groundwater takes up biogenic CO while percolating through the unsaturated zone. Soil carbonate will also go into solution as:
C0 2 + H20 + CaC09 ^ * 2 HCO^ + Ca + + (7)
4
Reaction of organic acids/carbonic acid with calcite present in the soil produces HC09 as:
R-COOH + CaCO~ ** HCO" +Ca + + + RCOO~ (8) a a
Weathering of feldspars by the action of aqueous C0 2
and water also produces HCO ions as:
CaAl Si 0 + 6H 0 + 2H,C0a > Ca + + + 2A1(0H)„ 2 2 B 2 2 3 3
+ 2H SiC) + 2HC0" (9) 4 4 9
(Na or K)AlSi30B + 7H20 + H 2C0 3 ., Na + or (K+)+ A1(0H)3
+ 3H4Si04 + HCO~ (10)
Silicate weathering is a slow process and its contribution to groundwater carbon is usually negligible.
2.2.3 Total Dissolved Inorganic Carbon
Total dissolved inorganic carbon, TDIC is made up of aqueous species such as aqueous CO and H CO , and ionic species such as HCO and CO . Biogenic carbon dioxide gives TDIC. Various forms of carbon in the TDIC can undergo isotopic exchange with CO (gas) present in the unsaturated zone. Isotopic exchange reactions also involve C.
2.2.4 Initial Carbon-14 Content of Water
The processes of natural production and distribution of C have stabilized and its concentration in the atmosphere, oceans and biosphere is assumed to be constant over the geologic time which is long compared to the half life of radiocarbon. The variations in the natural level of
(7) radiocarbon are not generally important for a
5
hydrologist. However, bomb C has some relevance. The C variation in atmospheric carbon dioxide is reflected in plants. Carbon dioxide entering groundwater is produced by vegetation living over several years. The maximum C concentration in soil CO and thus in groundwater is not as high as in the atmosphere.
C content of TDIC is modified by chemical dilution and isotopic exchange processes. Initial activity of TDIC required for dating a water sample is its specific C content after all the dilution and exchange processes and before any radioactive decay has taken place. It may be determined by applying a suitable model depending upon the carbonate chemistry
3. FRACTIONATION OF CARBON ISOTOPES
The kinetic energy of a molecule depends upon its temperature and equals >*T, k being Boltzman's constant and T the Absolute Temperature. If u is average velocity and m. the molecular mass, then
1/2 n vS - M (11)
It follows that at any temperature molecules with different masses have different velocities. Light isotopic species react faster in chemical reactions than the heavy ones. Thus
12 18 14 the abundances of carbon isotopes C. C. and C in plants are different from those in the atmospheric carbon dioxide. Plants are generally depleted in C and C. The fractionation of carbon isotopes brought about by chemical changes in nature or in laboratory processes alters the C content and consequently the calculated age of the specimen. The fractionation of **C is expressed as <5*fC which is
6
d e f i n e d a s : 1 9 C = [ ( ^ S Q m p l » - 1 ) x 1000 ] p e r m i l ( 1 2 )
V standard *
13 . n Abundance of rare isotope i.e. C where P = £ — — Abundance of the most abundant isotope i.e. C
6 C is also denoted as <5 and is expressed as per mil (%•).
The standard used is carbon dioxide prepared from marine belemnites (Belemnitella Americana) collected from Pee Dee Formation (Cretaceous) of South Carolina. This is known as PDB Standard »-*•»•" and has 6 C - 0.
Larger natural variations in <5 C of biogenic CO are observed depending on the type of vegetation in the recharge
13 area. Land plants are depleted in C to varying extent depending upon the photosynthetic mechanism involved Majority of temperate plants use Calvin ( CAL or C ) photosynthetic cycle and show highest depletion in C (<5 C = -27 ± 5 %. ) . Some tropical plants e.g. maize and sugar cane follow Hatch-Slack ( HS or C ) photosynthetic pathway resulting in the lowest depletion i n 1 C ( < 5 C = - 1 3 ± 4 %o ) . A few plants e.g. succulents, utilize crassulacean acid metabolism ( CAM ) and may fix carbon either by HS or CAL pathways depending upon temperature and photoperiod with the
13 (IS 10) result that 6 C value lies between -27%o and -13%o In a well developed soil found in non-arid temperate climates, the soil CO should be isotopically equivalent to plants with <5t3C = -25%„ and 1-*C = 100 pmc<20>. The 613C for semi-arid regions is = -\b%. . The reaction of biogenic C0 2
with soil carbonate (613C = +1%„) will produce HC0" with 13
6 C - -12 or -1%9 In areas with little or no vegetation where groundwater is very soft, the contribution of
7
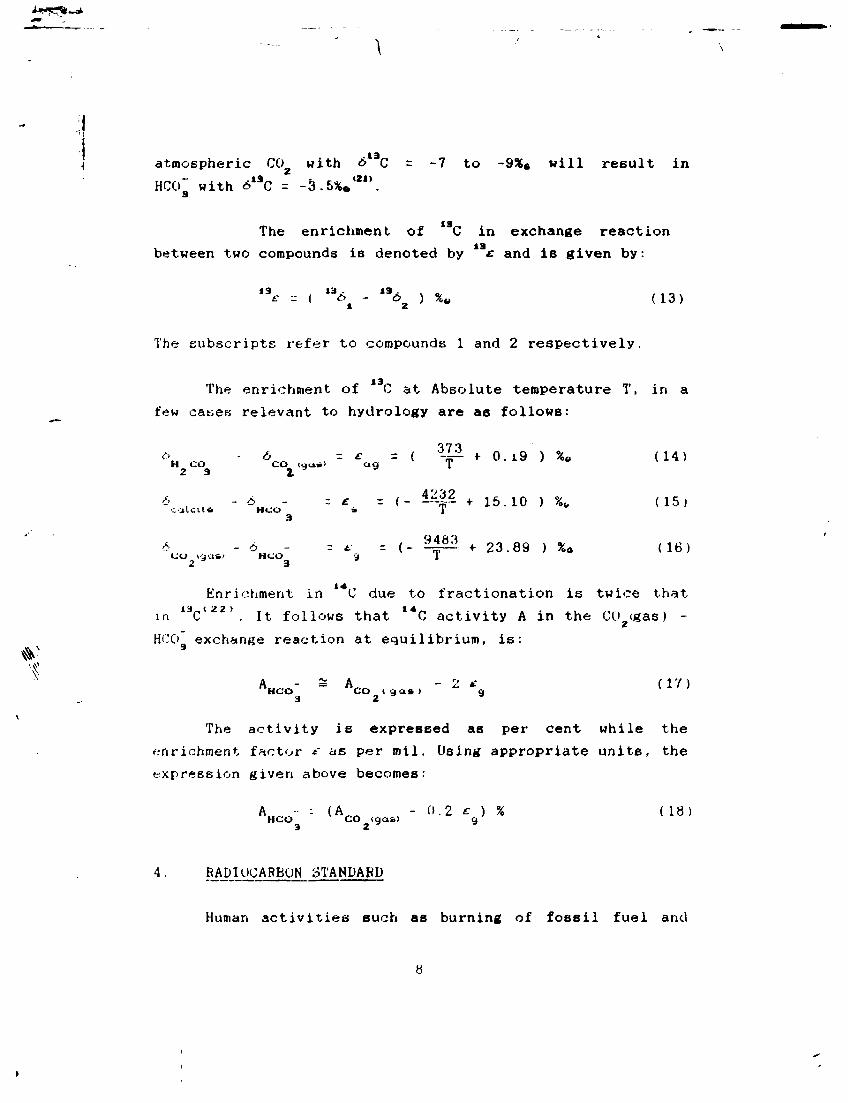
f 3 atmospheric CO with 6 C = -7 to -9%« will result in HCO" with <513C = -3.5**'"'.
a 19
The enrichment of C in exchange reaction 19
between two compounds is denoted by c and is given by: 1 3
£ = ( l 3 S t - X362 ) %y (13)
The subscripts refer to compounds 1 and 2 respectively.
13 The enrichment of C at Absolute temperature T, in a
few cases relevant to hydrology are as follows: <-' . . - <*,. = £ = ( ~ t 0 . i 9 ) %« ( 1 4 )
H C O C O (.J._l»> ClCi 1 2 3 1 y *
* , - * . . - = * = ( - — | ~ + 1 5 . 1 0 ) %«. ( 1 5 j •-alette HCu » 1
3
- 6 - = *•' = ( - ^ 4 ^ + 2 3 . 8 9 ) %a ( 1 6 ) 2 * 3
Enrichment in C due to fractionation is twice that in 'c' '.It follows that C activity A in the CO (gas) -HCO exchange reaction at equilibrium, is:
A H C O " " A e o <<,<.»> " 2 **3 ( 1 7 )
3 2 " The activity ie expressed as per cent while the
enrichment factor *" as per mil. Using appropriate units, the expression given above becomes:
A u, . - (A„rt , - 0.2 e ) % (18) 3 2
RADIOCARBON STANDARD
Human activities such as burning of fossil fuel and
8
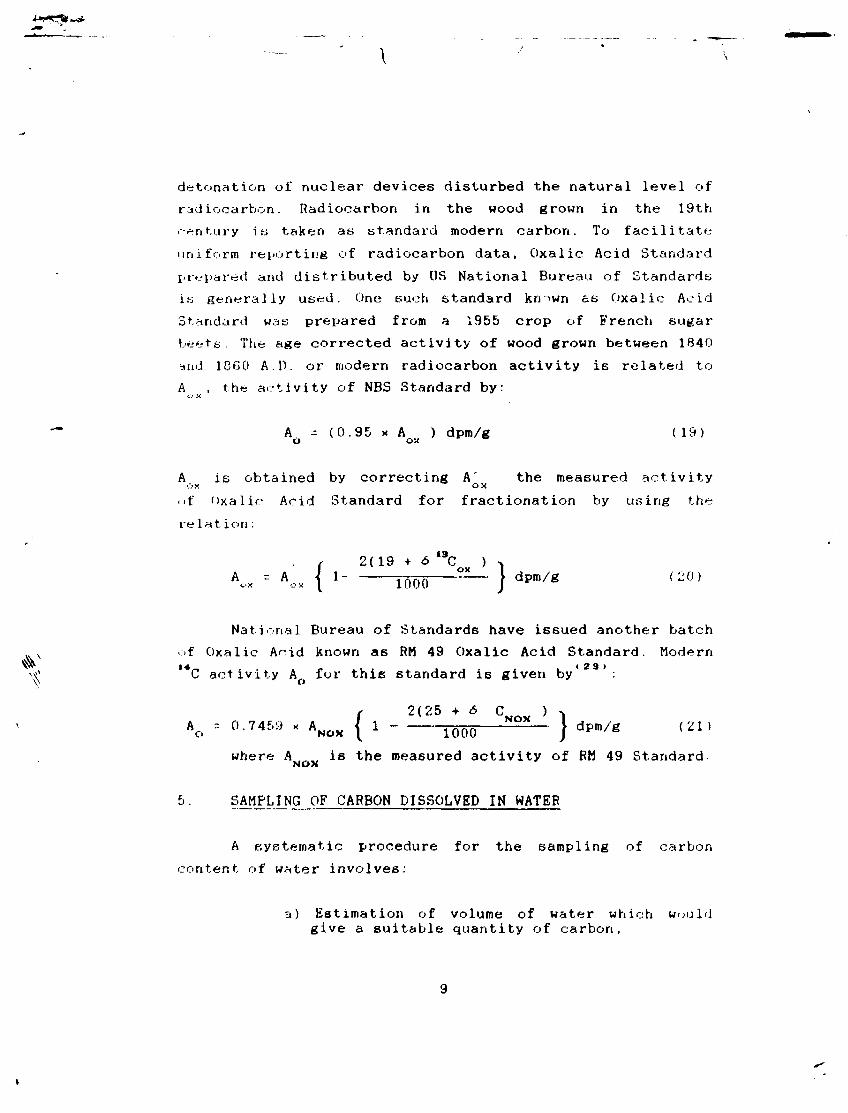
detonation of nuclear devices disturbed the natural level of radiocarbon. Radiocarbon in the wood grown in the 19th •-entury is taken as standard modern carbon. To facilitate uniform reporting of radiocarbon data, Oxalic Acid Standard prepared and distributed by US National Bureau of Standards is generally used. One such standard kn~>wn as Oxalic Acid Standard was prepared from a 1955 crop of French sugar beets. The age corrected activity of wood grown between 1840 and 18G0 AD. or modern radiocarbon activity is related to A , the activity of NBS Standard by:
A - (0.95 x A ) dpm/g (19) o ox
A is obtained by correcting A' the measured activity ox ox of Oxalic Acid Standard for fractionation by using the relation:
2(19 + 6 t 3C ) r £ I J. £7 -r <-> \J ) -\
A c x = A o y { 1 looci °— j d p m / g ( 2 0 )
National Bureau of Standards have issued another batch of Oxalic Acid known as RM 49 Oxalic Acid Standard. Modern 14 < 2 3 > C activity A for this standard is given by
2(25 + 6 C ) A o -- 0.7459 x A N O X | 1 f m | dpm/g (21)
where A ., is the measured activity of FM 49 Standard-NOX
5. SAMPLING OF CARBON DISSOLVED IN WATER
A systematic procedure for the sampling of carbon content of water involves:
a) Estimation of volume of water which would give a suitable quantity of carbon,
9
; «S"*S»- i«»
\ in M—imin
^ . g ^ : * - , - ^ * * ^ . ^ . ^ . - - - » i m a i i i,ni,i..n. i u ;... .<ijtiXg|iij;j»
,/ rr— i^rg»s^jgr>i'*a'^^
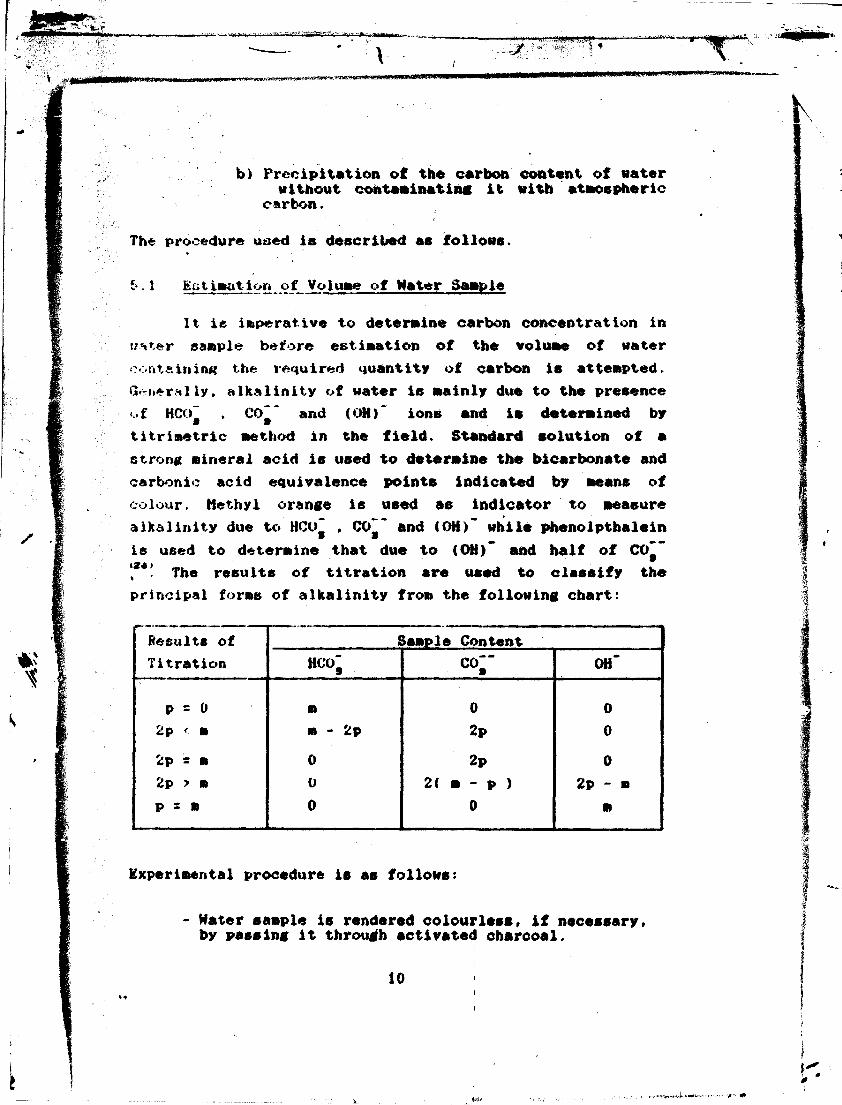
K b) Precipitation of the carbon content of water
without contaminating it with atmospheric carbon.
The procedure used is described as follows.
**• * BKtiaatlon of Volume of Water Sample
It ie imperative to determine carbon concentration in i?*tter sample before estimation of the volume of water containing the inquired quantity of carbon is attempted. G'-i.̂ rnl ly. alkalinity of water is mainly due to the presence of HCO~ . C0~~ and (OH)" ions and is determined by titriaetric method in the field. Standard solution of a strong mineral acid is used to determine the bicarbonate and carbonic acid equivalence points indicated by means of colour. Methyl orange is used as indicator to measure alkalinity due to HCO~ , C(f ~ and (OH)" while phenolpthalein is used to determine that due to (OH)" and half of C0~~ '**! The results of titration are used to classify the principal foms of alkalinity from the following chart:
Results of Titration
Sample Content Results of Titration HCO^ (XT' OH"
p = 0 m 0 0 2p < m m - 2p 2p 0 2p = m 0 2p 0 2p > a 0 2( m - p ) 2p - n p a n 0 0 m
Experimental procedure is as follows:
Hater sample is rendered colourless, if necessary, by passing it through activated charcoal.
10
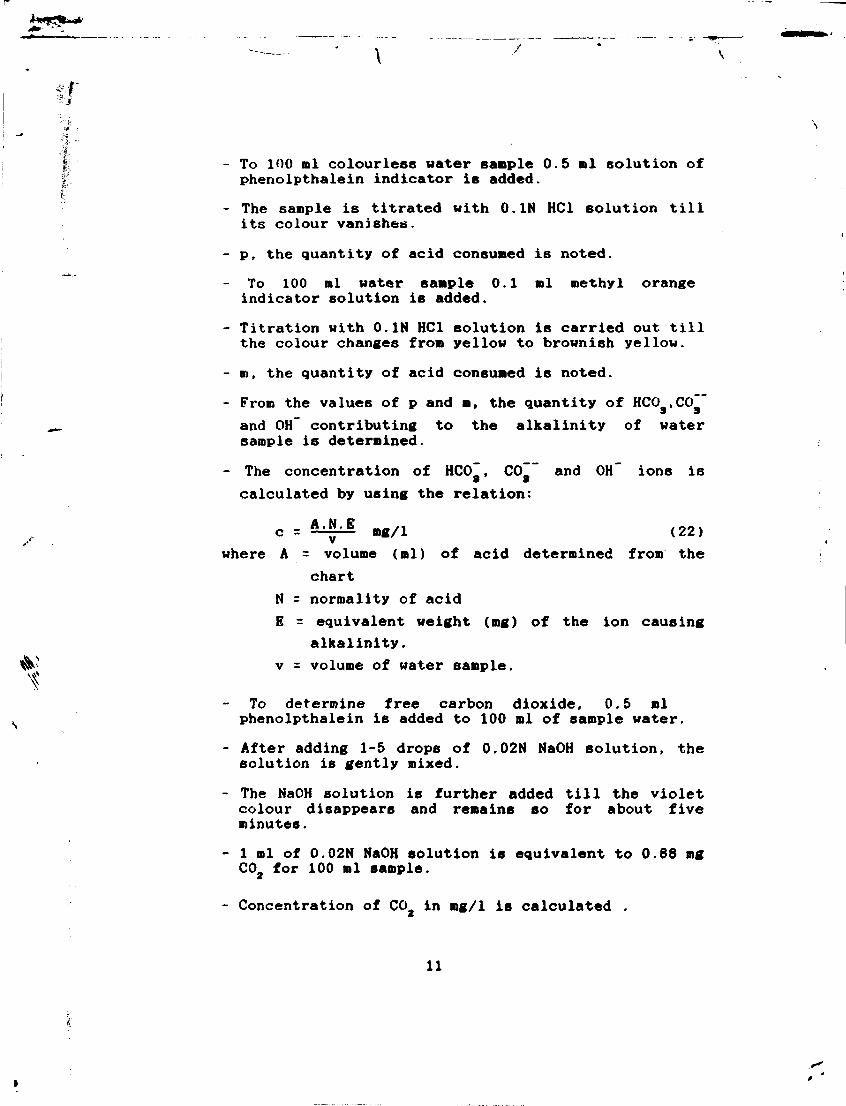
- To 100 ml colourless water sample 0.5 ml solution of phenolpthalein indicator is added.
- The sample is titrated with 0.1N HC1 solution till its colour vanishes.
- p, the quantity of acid consumed is noted. - To 100 ml water sample 0.1 ml methyl orange indicator solution is added.
- Titration with 0.1N HC1 solution is carried out till the colour changes from yellow to brownish yellow.
- m, the quantity of acid consumed is noted. - From the values of p and m, the quantity of HC09,C0~ and 0H~ contributing to the alkalinity of water sample is determined.
- The concentration of HC0~, C0~~ and OH" ions is calculated by using the relation:
c = t^LM. »g/i (22) where A = volume (ml) of acid determined from the
chart N = normality of acid E = equivalent weight (mg) of the ion causing
alkalinity, v = volume of water sample.
To determine free carbon dioxide, 0.5 ml phenolpthalein is added to 100 ml of sample water.
- After adding 1-5 drops of 0.02N NaOH solution, the solution is gently mixed.
- The NaOH solution is further added till the violet colour disappears and remains so for about five minutes.
- 1 ml of 0.02N NaOH solution is equivalent to 0.68 mg C0 2 for 100 ml sample.
- Concentration of C0 2 in mg/1 is calculated .
11
Total carbon concentration Ct is calculated by using the relation: C C f"
ci = 1 2 ( 6T + &> + W * **n ( 2. 3 )
where C, C, and C. represent the concentration of HCO~, C0~~ and free CO respectively as determined above.
Volume of water, V required to give w gm of carbon is calculated by using the equation:
V = ( w/Ct ) x 1000 1 (24)
The basic anions such as silicate, borate, hydroxide, etc. present in water will also be included in the titration giving high value of alkalinity. This will result in under-estimation of the volume of water sample. Accordingly, the volume of water sample to be collected is about 1.25 times the calculated quantity.
I.2 Recovery of Carbon From Water Sample
Total dissolved inorganic carbon of water is recovered by precipitating it in the form of carbonate of some heavy metal such as barium, strontium, etc.. The method applied for the recovery of carbon from water sample is described below :
Ionic exchange between atmospheric carbon dioxide and bicarbonate dissolved in water takes place if groundwater remains in contact with atmosphere for a long time. This will modify the t4C content of TDIC. It is, therefore, essential to remove the free standing water in a well before taking a sample.
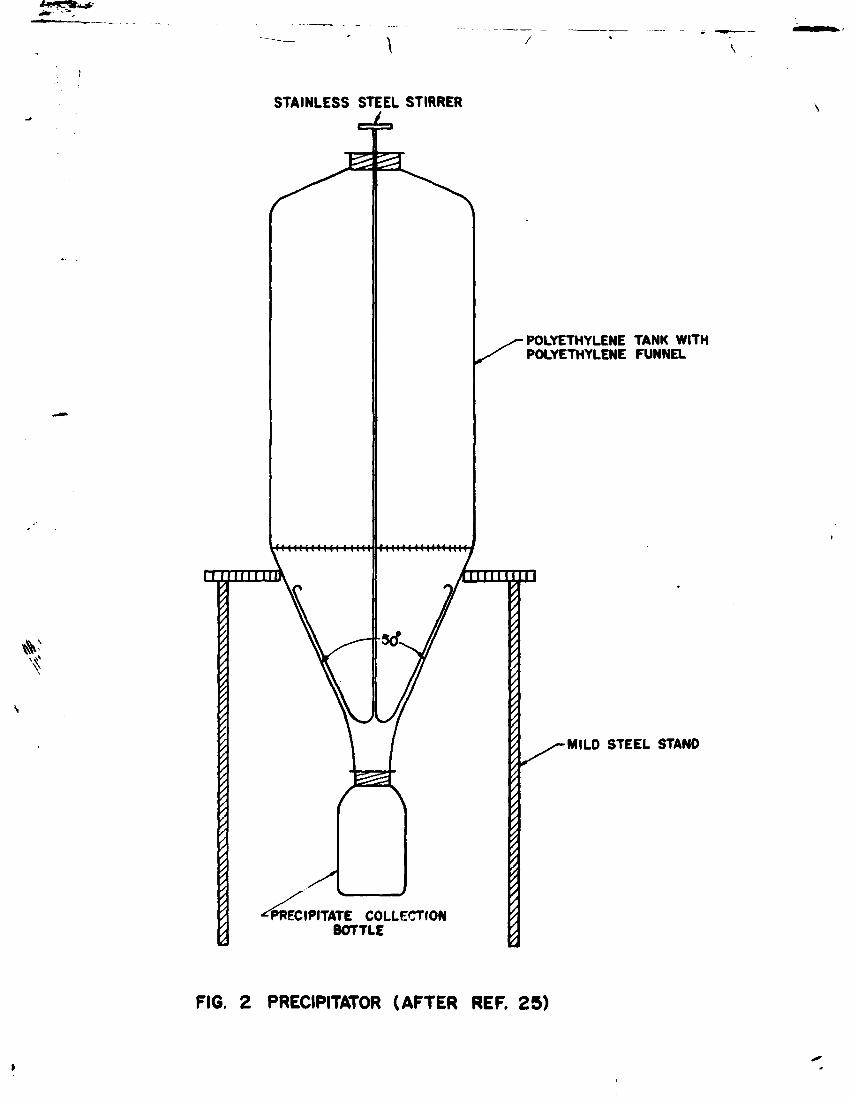
The apparatus used is schematically shown in figure 2. Step-by-step procedure is as follows :
12
* The 60 1 polythene tank i6 rinsed thoroughly with sample water and positoned securely on its stand.
* A wide mouth polyethylene bottle is tightly screwed. * The tank i6 almost completely filled with sample water and capped to avoid its contact with the atmosphere.
* About 5g ferrous sulphate is added and stirred to distribute it uniformly. If the sample contains H S gas, as may be indicated by smell, ferrous sulphate need not be added because it will precipitate as black FeS causing problems in subsequent gas preparation.
* 50 ml (or more) carbonate-free concentrated solution of NaOH is added to make the pH of the bulk solution greater than 8 so as to convert all HCO and free CO into carbonate.
* 500 ml saturated solution (carbonate free) of barium chloride is added to the tank and the sample is stirred for 5 minutes keeping the cap closed. Alternatively barium chloride solution prepared by dissolving 200 g BaCl powder in about 800 ml sample water may be added to the tank and stirred.
* A heavy precipitate of barium carbonate (BaCO ) is produced which settles slowly.
* 40 ml Praestol solution is added to accelerate settling of the precipitate.
* The solution is stirred slowly for one minute at three minute intervals during half an hour.
* The stirrer is used to facilitate sliding of the precitate down the walls of the container into the bottle. A gentle tapping of the walls of the container may be helpful.
* 25 - 30 ml of BaCl2 solution is added without stirring. Appearance of cloudiness indicates that recovery of TDIC is not complete.
* More BaCl solution and possibly NaOH solution are added to ensure complete precipitation.
13
* In case the precipitate does not settle within one hour then it is syphoned out into polyethylene bottle/s.
* After completion of precipitation of TDIC, the lower end of the tank is closed with a rubber stopper.
* The bottle is removed and tightly capped. If one bottle is insufficient to accommodate the precipitate, additional bottles may be used.
* The bottle/s is/are properly labelled. + The tank is emptied and thoroughly cleaned.
Preparation of the reagents/6olutions mentioned in the steps given above is described in Appendix-I.
SYNTHESIS OF BENZENE
Carbon content of a water sample may be converted into carbon dioxide, acetylene or methane for the measurement of C activity by a suitable gas counter. Alternatively,
benzene may be synthesized from the TDIC of the sample and liquid scintillation counting system applied for the measurement of C activity Each of the methods has its own merits and limitations. The benzene method of measuring radiocarbon has the following advantages:
- Benzene, C H«, has a high proportion of carbon (92 %) which is derived from the sample.
- Contamination by radon is eliminated during chemical procedures.
- Chemistry is simple and pure solutions are obtained. - Benzene or a mixture of benzene and toluene is the best solvent for C ^-detection. Benzene exhibits almost ideal energy transfer properties
- Computer-aided, compact liquid scintillation counting systems are easily available for assaying the samples.
14
.~d-
\
Major steps involved in the conversion of TDIC of water sample into benzene are preparation of C0 2 ; reaction of CO with lithium metal to produce lithium carbide (Li2C ); hydrolysis of lithium carbide to evolve acetylene gas ; and finally cyclization of C H gas into benzene.
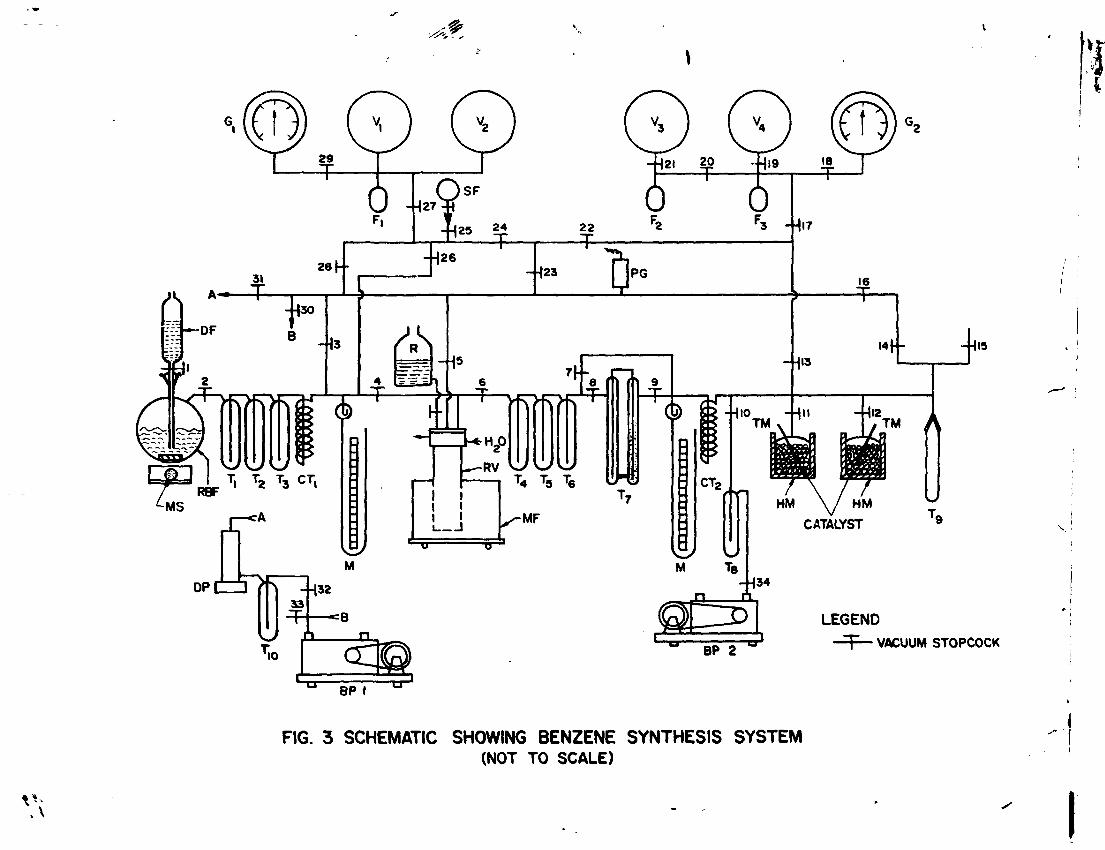
Benzene synthesis system is schematically shown in figure 3. The system is evacuated first with the help of backing pump BP and then with oil diffusion pump DP. The vacuum in the system is monitored by Pirani gauge PG. Traps T and T are cooled with liquid nitrogen. Stopcocks 33 and 34 are opened when the pumps are to be aired after switching off power. Backing pump BP is mostly used to evacuate catalyst chamber while drying the catalyst.
Volume of gas storage vessels and the associated connections was determined in a separate experiment and is :
Volume of vessels V f and V 2 = 11.243 1 (25) Volume of vessel Vg = 6.091 1 (26) Volume of vessels V and V = 11.692 1 (27)
The procedure is as follows :
6.1 Preparation of Carbon Dioxide
As first step, TDIC (BaC09) , background (marble i.e.CaC03) and standard (NBS 14C-0xalic Acid Standard) samples are converted into C0 2 a*$ described below.
6.1.1 Treatment of Carbonate Samples
Carbonate samples are allowed to react with
15
i».+!%~*
\
perchloric acid to produce C0 2 by the reaction :
MeC09 + 2HC104 • Me(C104)t + H f0 • CO^ (28) where He is Ba, Sr or Ca.
The whole system is evacuated as mentioned above. Bound bottomed flask RBF is rinsed with water standing over barium carbonate precipitate in the sample bottle. Precipitate alongwith some water is transferred to the RBF. The contents of BBF are degassed by applying vacuum for a few moments 2-3 times with the help of backing pump BPft. Perchloric acid (diluted 1:1) is then dropped from the dropping funnel DF. The mixture is stirred with a magnetic stirrer MS throughout the reaction.
Marble chips after washing with dilute acid and deionized water are taken in BBF for preparing background sample. Freshly deionized water is added to cover the chips. The water-chips mixture is degassed and reacted with acid.
6.1.2 Wet Oxidation of Oxalic Acid Standard
^ NBS '4C-Oxalic Acid Standard is taken in RBF and potassium permanganate solution acidified with sulphuric acid is dropped from the dropping funnel. The mixture is stirred to ensure instantaneous mixing so that localized build up of permanganate does not take place. Carbon dioxide is produced according to the following reaction :
5<C„HJ3 .2H 0) • 2KMnO^ • 3H SO^ • 10CO. + 2Mn*+ + 2K +
2 2 4 2 4 2 4 2
• 3(S0~~) • 18H 20 (29)
* For preparation, •*• Appmndix-I.
16
The reaction is slow in the beginning until the concentration of Mn** ions builds up. The funnel tap is closed for some time after the addition of first few milliliter of permanganate solution. The rate of reaction is monitored by observing the pressure in the mercury manometer M - The apparent end point of the reaction is reached when the colour of the solution in the flack changes from clear to reddish brown. A few ml of permanganate solution is added till the solution in the flask changes to chocolate brown tint. The funnel tap is closed and the manganic oxalate formed during the reaction is allowed to decompose. After about 15 minutes the gas is collected.
6.1.3 Purification of Carbon Dioxide
Carbon dioxide so produced is dried by passing it through cold traps T
1 > T2 > T a n Q coil trap CTf kept at about
-80*C. The dry gas is collected in vessels Vf and V . After completion of the reaction, the gas is frozen in cold finger F by applying liquid nitrogen trcti. Gas in the glass line is also recovered by operating appropriate stopcocks. Any unfrozen gas in the line is pumped out. The gas is then expanded into the vessels V and V and its pressure is read on the absolute pressure gauge G .
Carbon dioxide sample for the measurement of 6 * C may be taken in a small flask SF.
6.1.4 Calculation of Mass of Carbon in Carbon Dioxide
Let P' , V and t' denote the pressure (mb), volume (1) and temperature (°C) respectively of the C0 2 produced. One mole of all gases at standard temperature and pressure STP i.e. 0 C and 760 mm Hg respectively occupies a volume of
17
\
22.4 liter. The the molar weight mt of carbon in the gas can be calculated by using the gas equation and is given by:
m = 0.012 P' V*/(t* + 273) moles (30)
The value of V can be substituted from equations (25) to (27) in equation (30) depending upon the vessel/s used for the collection of the gas. Knowing the pressure and temperature of the gas, the mass of carbon in C0 2 can be calculated.
6.2 Carbon Dioxide - Lithium Reaction
Carbon dioxide prepared as described in the foregoing section is reacted with lithium metal heated to a temperature of about 700 °C in stainless steel reaction vessel RV (Fig. 3 ).The reaction is:
2C02 + lOLi • Li 2C 2 + 4Li2<D (31*
If volume of CO. is V" liter and its pressure at t' °C is P' mb, then the quantity of Li metal required is given by:
Weight of Li metal = 0.4174 x P'V'/(f + 273) g (32)
Carbon dioxide from vessels V and V passes through coil trap CT , cold traps T , T. and T . Traps T and T are
Z O 9 4 • 9 kept at -80 *C. The reaction rate is monitored with the help of mercury manometer M„. When the reaction is near
* At.Wt. =6.941 . M. P. =180. 54 °C, B. P. =1347 °C. Sp.Gr. =0.534 at BO C, Heat of vapor i sat ion=5100 cal/g and Vapour pressure at 900 °C =12 mm He
18
completion, the gas in the line is frozen in trap Ttf and expanded into the chamber RV.
The efficiency of CO - carbide conversion reaction is greater than 95 % in the absence of air. For best results, CO should not be exposed to Lithium until it has been heated to a temperature of about 700 C The yield may be reduced due to the formation of lithium carbonate (Li2C03) by the reaction:
4Li + 2C02 » L i2
C 0 3 * C + L i2 ° ( 3 3 )
The temperature of the muffle furnace, HF, is increased to 950 - 1000 *C to decompose Li 2C0 9 into C02- Heating is continued for about half an hour to allow C0_ and C to react with Lithium metal. Reaction vessel RV is then allowed to cool down to room temperature.
Reaction chamber must be evacuated and leak tight as nitrogen and oxygen present in air react with lithium metal and produce solid nitride and oxide of lithium. Each mole of air entering the chamber consumes about 5.5 moles of lithium metal.
Lithium metal is stored in argon gas to avoid formation of LiOH on its surface due to reaction with atmospheric moisture resulting in the absorption of atmospheric C0 2 containing bomb C \ Long exposure of Li rods to air produces white carbonate scale on the otherwise grey-black surface. Argon-packed Li rods may be immersed in petroleum ether immediately after opening the tin to avoid formation of scales.
19
6.3 Preparation of Acetylene Gas
Acetylene (C_H ) g a s * s produced b> admitting demineralizd water from the reservoir R into the reaction vessel RV to hydrolyse lithium carbide according to the reaction :
Li,C, + H,0 » C H + Li,0 (34) 2 2 2 2 2 2
The reaction is exothermic and RV may be cooled with iced water to minimize water carry-over by the evolving gas. Excess lithium reacts with the evolution of hydrogen gas.
Acetylene produced is purified by passing it through traps T and T cooled to -70°C and collected in trap T
4 5 0 cooled with liquid nitrogen. The progress of reaction is monitored with mercury manometer M . The pressure inside the glass line is not allowed to exceed the atmospheric pressure. Hydrogen gas produced is pumped out from time to time.
After completion of the reaction, C H collected in trap T is allowed to expand through trap T„ and coil trap
o 7 CT2 into storage vessels Vg and/or V^. The trap T ? contains orthophosphoric acid to purify the gas and coil trap CT cooled to -70"c to further dry it. The gas in the vessels V g
and/or V 4 and the glass line is frozen into cold finger Fg
and/or F4. Any unfrozen gas is pumped out. The gas is then expanded into V and/or V and its pressure is read from the absolute pressure gauge G . 6.3.1 Calculation of Carbon Content of Acetylene
Let pressure, volume and temperature of acetylene
20
produced be P"(mb) ,V"(1) and t"(°C). Volume V s T p of the gas at STP can be calculated by using gas equation and is given by:
V S T p = 0.269 P" V" /(f + 273) (35)
The value of V" i.e. the volume of vessel/s used for collecting the gas can be substituted from equations (25) to (27) in equation (35) and the value of V S T p can be worked out.
As already stated, one mole of all gases at STP occupies a volume of 22.4 1. Mass m 2 of carbon in the acetylene produced can be calculated by using the relation:
ro2 = 1 ' 0 7 V S T P g ( 3 6 )
6.4 Cyclization of Acetylene
Acetylene is cyclized into benzene in the presence of a catalyet according to the reaction:
3C2H2 c a t a l y 8 t . C ^ (37)
The catalyst which is in the form of 2mm silica-alumina pallets activated by the transition metal Cr (0.2% by weight) is used. Potassium chrornate (K Cr04) is the activating agent. One liter of acetylene at STP requires about 5g catalyst. Knowing the volume of C H at STP , amount of catalyst required can be calculated. The catalyst is heated in a glass bottle with the help of heating mantle HM (Fig. 3) and dried at 250 °C under vacuum for about two hours. The temperature is monitored with the help of thermometer TM. The catalyst should be at a temperature of about 70 C when exposed to acetylene gas.
21
The process of cyclization of C 2H 2 into CtfHtf is exothermic. The CH. gas is admitted into the flask in such
2 2 a way that the temperature of the catalyst remains below 200°C. The process of cyclization of C aH 2 is monitored by mercury manometer M . After completion of the reaction, benzene is distilled under vacuum into liquid nitrogen cooled trap T maintaining the catalyst at a temperature of about 125°C for 40 minutes. At this stage trap T p is isolated from the vacuum system and the catalyst. Air is introduced into the trap T^. Benzene so produced is demoieturized by adding a few pieces of Drierite (anhydrous calcium sulphate). Under the best conditions, more than 95% conversion of dry acetylene to benzene may be obtained. 6.4.1 Processes Affecting Yield of Benzene
The processes affecting the yield of benzene have been discussed in detail in reference 31. Moisture present in acetylene or catalyst reduces the benzene yield by deactivating the catalyst due to the formation of intermediates like acetic acid and acetaldehyde which end in the formation of potassium acetate or potassium carbonate when catalyst is heated to high temperature. The cause of the deactivation of the catalyst is indicated by the colour it developes after exposure to acetylene.
- Blackish colour is due to the formation of carbon during decomposition of acetylene when heated above 230 °C.
- Grey-green or violet colour is due to the formation of Cr 0 3 when the temperature is kept below 30°C by constant cooling and slow addition of acetylene.
- Brown colour is due to CrO_ when the temperature is around 100 °C.
22
The catalyst may be reactivated by heating it in the air at 500°C to oxidize Cr and Cr into Cr . Heating to higher temperatures may cause permanent loss of catalyst capacity due to reaction of chromium with silica- alumina base.
7. MEASUREMENT OF RADIOCARBON ACTIVITY
Radiocarbon is a radioactive isotope of carbon. A C nucleus decays by emitting a beta particle {ft) and a neutrino (T?) according to:
»*C • **N + (f + T> + Q (38) ©
The two particles e.g. ft~ and T? are released simultaneously from the nucleus and carry the decay energy, Q from the nucleus. The decay energy which is characteristic of a radionuclide is 156 keV in case of C and is shared randomly by ft and n. The beta particle can thus have any energy in the range 0 - 156 keV. The half life for the decay of 1 4C is 5730 ± 40 years' 9 7' 9 B ). Libby half life of 5568 ± 30 years for the calculation of conventional radiocarbon age of a sample is also used.
7.1 Liquid Scintillation Counting
A lot of information about the theoretical and practical aspects of the liquid scintillation counting method has been published A summary of the basic principles of the technique is as follows.
In order to detect beta particles, sample benzene is usually mixed with a solution (scintillation cocktail) which contains solvent and solute (scintillator e.g. PPO, butyl PBD, etc.). The beta particle dissipates itd energy within
23
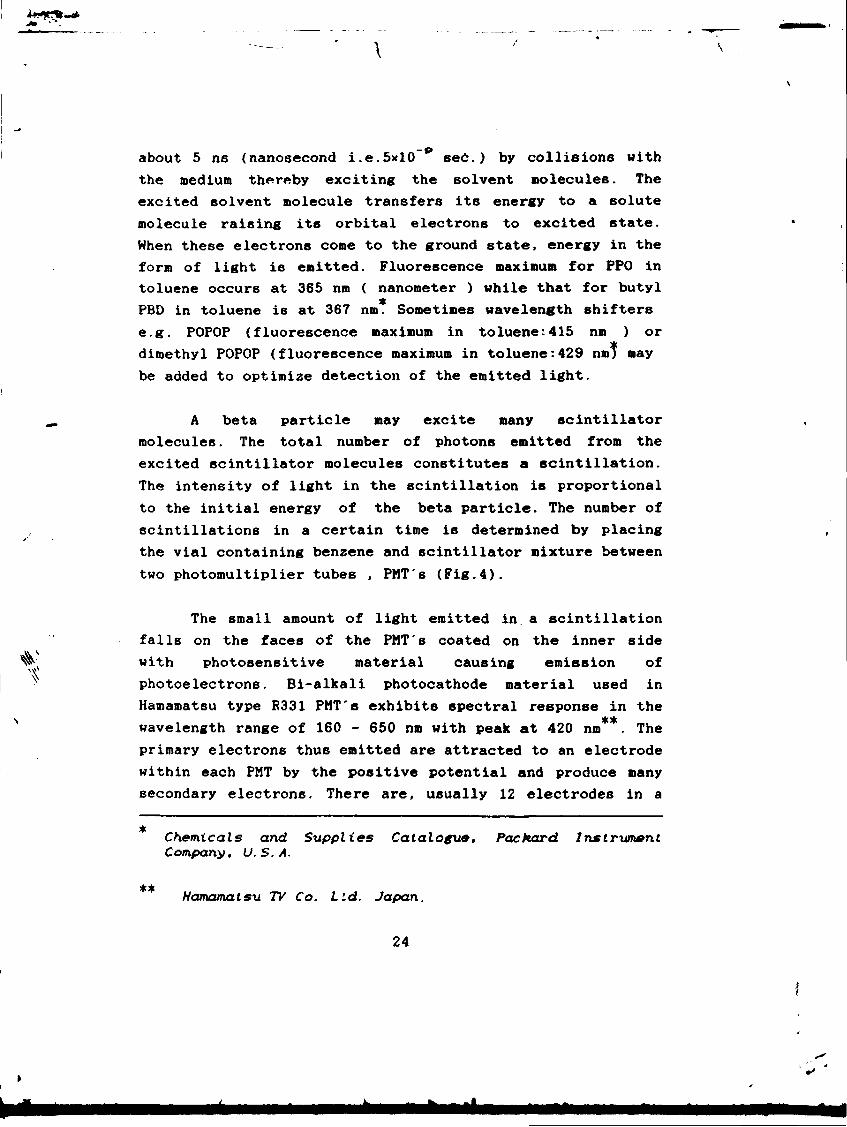
about 5 ns (nanosecond i.e.5x10 sec.) by collisions with the medium thereby exciting the solvent molecules. The excited solvent molecule transfers its energy to a solute molecule raising its orbital electrons to excited state. When these electrons come to the ground state, energy in the form of light is emitted. Fluorescence maximum for PPO in toluene occurs at 365 nm ( nanometer ) while that for butyl PBD in toluene is at 367 nm. Sometimes wavelength shifters e.g. POPOP (fluorescence maximum in toluene:415 nm ) or dimethyl POPOP (fluorescence maximum in toluene:429 nm) may be added to optimize detection of the emitted light.
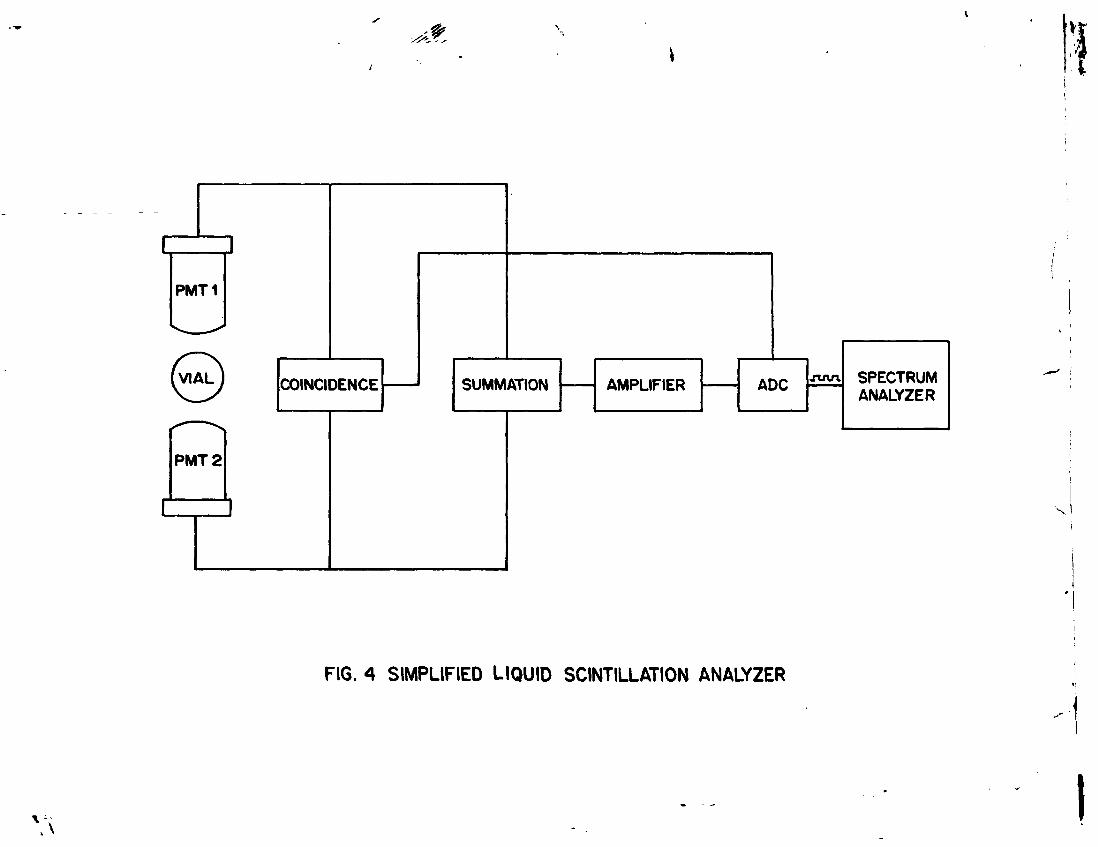
A beta particle may excite many scintillator molecules. The total number of photons emitted from the excited scintillator molecules constitutes a scintillation. The intensity of light in the scintillation is proportional to the initial energy of the beta particle. The number of scintillations in a certain time is determined by placing the vial containing benzene and scintillator mixture between two photomultiplier tubes , PMT's (Fig.4).
The small amount of light emitted in. a scintillation falls on the faces of the PMT's coated on the inner side with photosensitive material causing emission of photoelectrons. Bi-alkali photocathode material used in Hamamatsu type R331 PMT's exhibits spectral response in the wavelength range of 160 - 650 nm with peak at 420 nm . The primary electrons thus emitted are attracted to an electrode within each PMT by the positive potential and produce many secondary electrons. There are, usually 12 electrodes in a
Chemicals and Supplies Catalogue, Packard Instrument Company, U.S.A.
Hamamatsu TV Co. Lid. Japan.
24
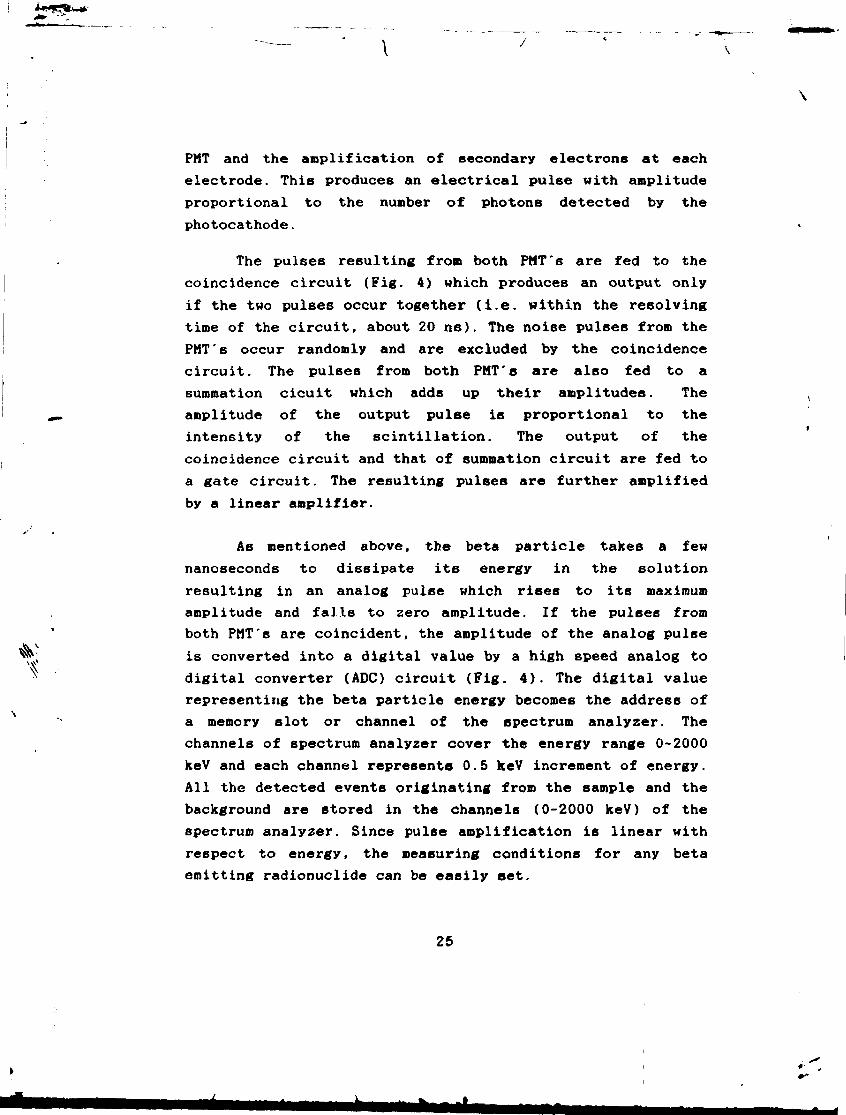
PMT and the amplification of secondary electrons at each electrode. This produces an electrical pulse with amplitude proportional to the number of photons detected by the photocathode.
The pulses resulting from both PMT's are fed to the coincidence circuit (Fig. 4) which produces an output only if the two pulses occur together (i.e. within the resolving time of the circuit, about 20 ns). The noise pulses from the PMT's occur randomly and are excluded by the coincidence circuit. The pulses from both PMT'e are also fed to a summation cicuit which adds up their amplitudes. The amplitude of the output pulse is proportional to the intensity of the scintillation. The output of the coincidence circuit and that of summation circuit are fed to a gate circuit. The resulting pulses are further amplified by a linear amplifier.
As mentioned above, the beta particle takes a few nanoseconds to dissipate its energy in the solution resulting in an analog pulse which rises to its maximum amplitude and falls to zero amplitude. If the pulses from both PMT's are coincident, the amplitude of the analog pulse is converted into a digital value by a high speed analog to digital converter (ADC) circuit (Fig. 4). The digital value representing the beta particle energy becomes the address of a memory slot or channel of the spectrum analyzer. The channels of spectrum analyzer cover the energy range 0-2000 keV and each channel represents 0.5 keV increment of energy. All the detected events originating from the sample and the background are stored in the channels (0-2000 keV) of the spectrum analyzer. Since pulse amplification is linear with respect to energy, the measuring conditions for any beta emitting radionuclide can be easily set.
25
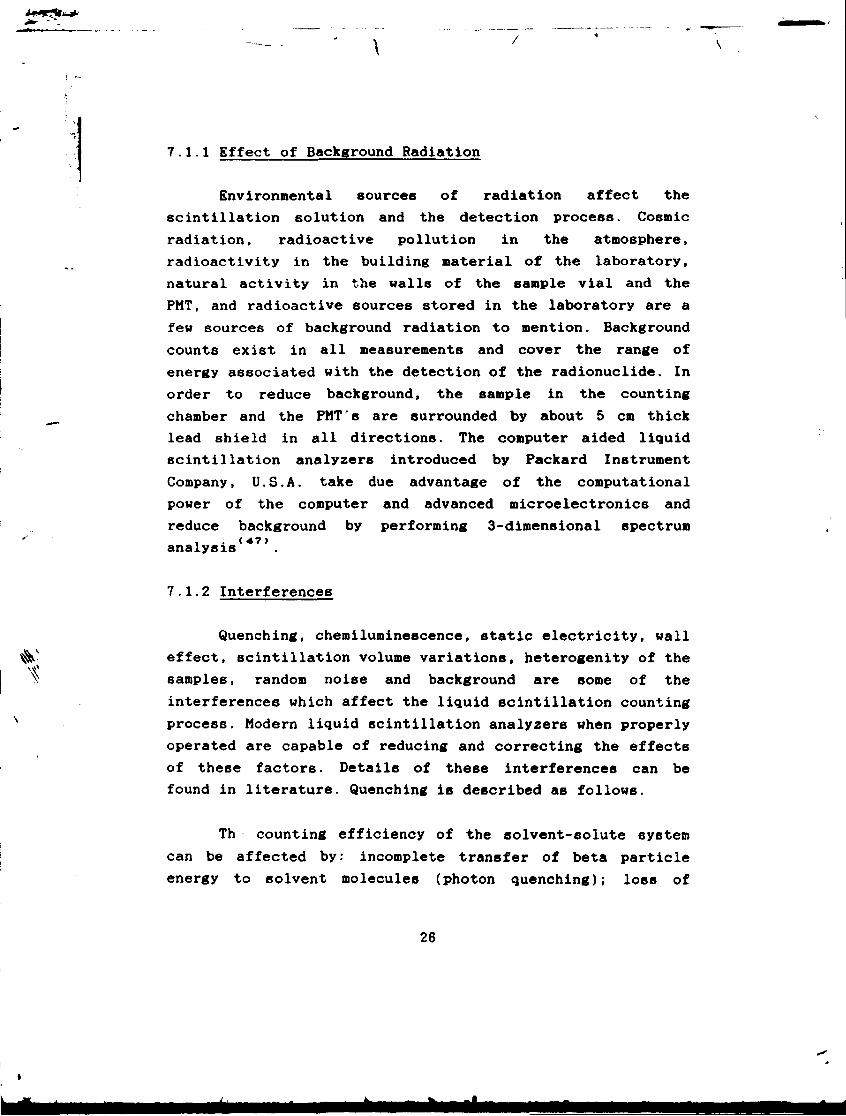
7.1.1 Effect of Background Radiation
Environmental sources of radiation affect the scintillation solution and the detection process. Cosmic radiation, radioactive pollution in the atmosphere, radioactivity in the building material of the laboratory, natural activity in the walls of the sample vial and the PMT, and radioactive sources stored in the laboratory are a few sources of background radiation to mention. Background counts exist in all measurements and cover the range of energy associated with the detection of the radionuclide. In order to reduce background, the sample in the counting chamber and the PHT's are surrounded by about 5 cm thick lead shield in all directions. The computer aided liquid scintillation analyzers introduced by Packard Instrument Company, U.S.A. take due advantage of the computational power of the computer and advanced microelectronics and reduce background by performing 3-dimensional spectrum
i . (47) analysis
7.1.2 Interferences
Quenching, chemiluminescence, static electricity, wall effect, scintillation volume variations, heterogenity of the samples, random noise and background are some of the interferences which affect the liquid scintillation counting process. Modern liquid scintillation analyzers when properly operated are capable of reducing and correcting the effects of these factors. Details of these interferences can be found in literature. Quenching is described as follows.
Th counting efficiency of the solvent-solute system can be affected by: incomplete transfer of beta particle energy to solvent molecules (photon quenching); loss of
26
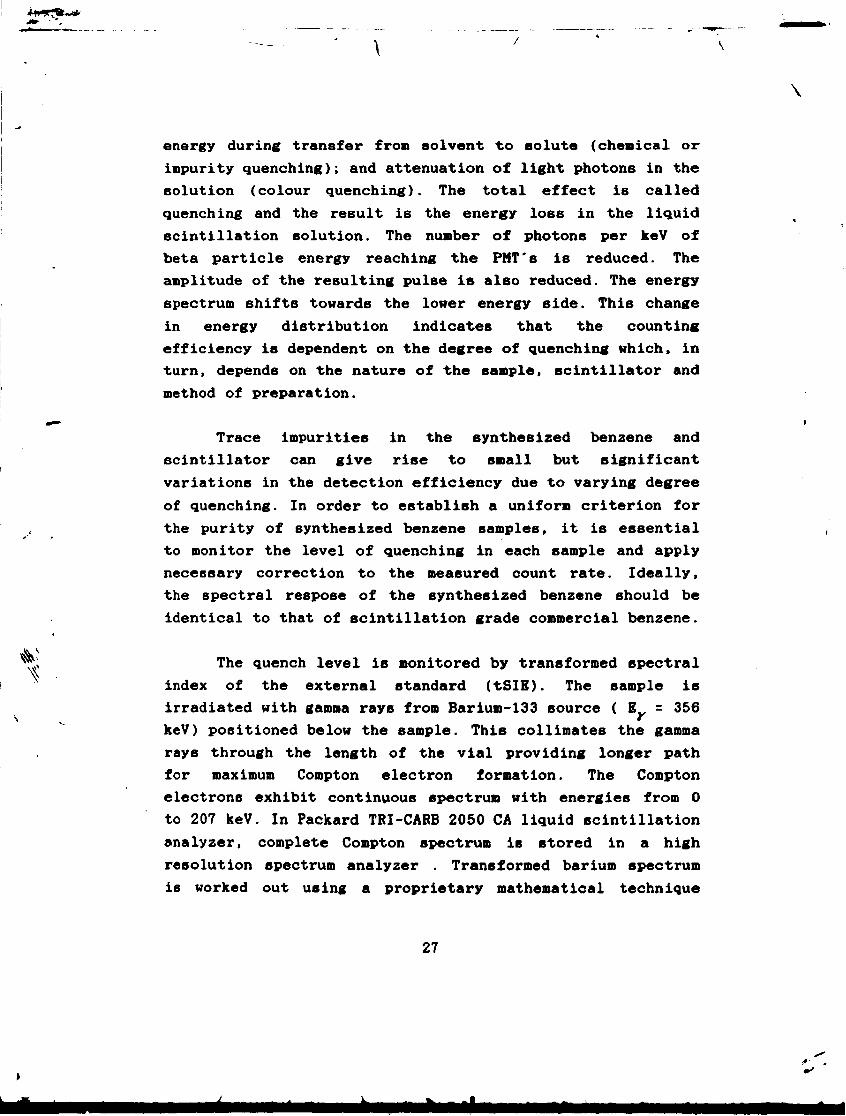
energy during transfer from solvent to solute (chemical or impurity quenching); and attenuation of light photons in the solution (colour quenching). The total effect is called quenching and the result is the energy loss in the liquid scintillation solution. The number of photons per keV of beta particle energy reaching the PMT's is reduced. The amplitude of the resulting pulse is also reduced. The energy spectrum shifts towards the lower energy side. This change in energy distribution indicates that the counting efficiency is dependent on the degree of quenching which, in turn, depends on the nature of the sample, scintillator and method of preparation.
Trace impurities in the synthesized benzene and scintillator can give rise to small but significant variations in the detection efficiency due to varying degree of quenching. In order to establish a uniform criterion for the purity of synthesized benzene samples, it is essential to monitor the level of quenching in each sample and apply necessary correction to the measured count rate. Ideally, the spectral respose of the synthesized benzene should be identical to that of scintillation grade commercial benzene.
The quench level is monitored by transformed spectral index of the external standard (tSIE). The sample is irradiated with gamma rays from Barium-133 source ( E = 356 keV) positioned below the sample. This collimates the gamma rays through the length of the vial providing longer path for maximum Compton electron formation. The Compton electrons exhibit continuous spectrum with energies from 0 to 207 keV. In Packard TRI-CARB 2050 CA liquid scintillation analyzer, complete Compton spectrum is stored in a high resolution spectrum analyzer Transformed barium spectrum is worked out using a proprietary mathematical technique
27
called Reverse Spectrum Transform (RST). This filters out spectral distortions conserving the integrity of the spectrum. Spectral distortions can be introduced due to wall effect (diffusion of the solvent in the wall of the plastic vial distorting the lower energy part of the spectrum), sample volume ( more Compton electrons are produced in the low energy region when the sample volume is low ), and colour (the presence of colour flattens and extends the spectrum over broader energy range).
The value of tSIE (keV) is calculated by the system software using all the counts in the Compton spectrum. It is independent of wall effect and volume variation in the range 50 pi to 20 ml and provides maximum statistical precision
<47> even at high quench levels or at extremely low volumes
7.2 Statistical Evaluation of Data
The activity of a sample is measured repeatedly for a certain number of times and the set of readings obtained is statiscally evaluated to determine whether the data is acceptable or not. A count is rejected if it is not reasonably expected to occur. Suppose we measure a sample N times and one of these counts has unusually large deviation from the mean value. Gauss distribution function may be used to calculate the probability that a deviation this large or larger will occur. If this probability is greater than 1/N, it is reasonable to obtain such a deviation. If the probability of obtaining such a deviation is smaller than 1/N, the deviation this large is unlikely to occur even once in the set of N measurements. Such count may be due to some anomalous fluctuation of the experimental conditions and may be discarded. According to Chauvenet's criterion an observation or a count may be rejected if the probability of
28
obtaining it is less than 1/2N.
The Gauss distribution is given by: 2 2
f(x) = A e" h ( x ~ n ) (39) where A = maximum height of the function = 1/ o.V2n ,
ct is the standard deviation m = value of x for which the function attains
maximum height. h = measure of the broadness of the bell shaped
curve (large for sharply peaking curve corresponding to small spread of errors).
= 1/ <y.Y2
Substituting the values of A and h in terms of o, we get:
The probability P(T) that a measurement will occur in the interval la of the mean value is:
T 2 P ( T ) = TBT S e _ t n d t < 4 1 >
-T where t = (x-m)/cr and T = d. /«>, d. is deviation of i th data from the mean value
or P(T) = 2,-^j-./ e _ t / 2 dt (42)
The values of Gauss integral for various values of T can be found in relevant table'
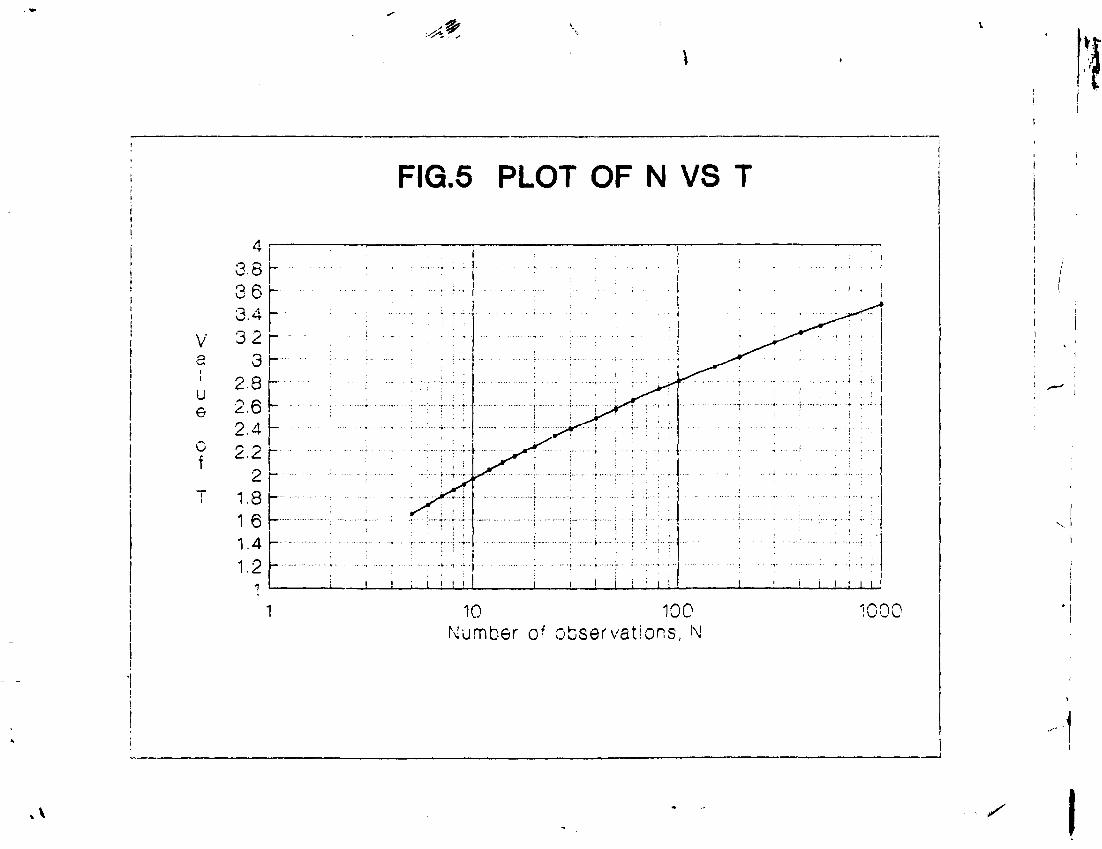
Suppose we measure a sample repeatedly for 8 times. An observation will be rejected if its deviation from the mean is so large that the probability of occurrence of a
29
deviation that large or larger is less than 1/16. We find the value of T such that:
P(T) = 1 - 1/16 = 0.9375 (43)
Value of T corresponding to 1/2 P(T) i.e. 0.4687 as found from the table of Gauss Integrals comes out to be 1.86. Any count falling outside the range: mean value ± 1.86 x a .will be rejected.
Value of T for various values of N , the number of observations has been plotted in figure 5 for ready reference.
7.3 Calibration of Counting System
In order to select the measurement conditions, benzene samples with sufficient concentration of tritium and carbon-14 were required. A sample of scintillation grade
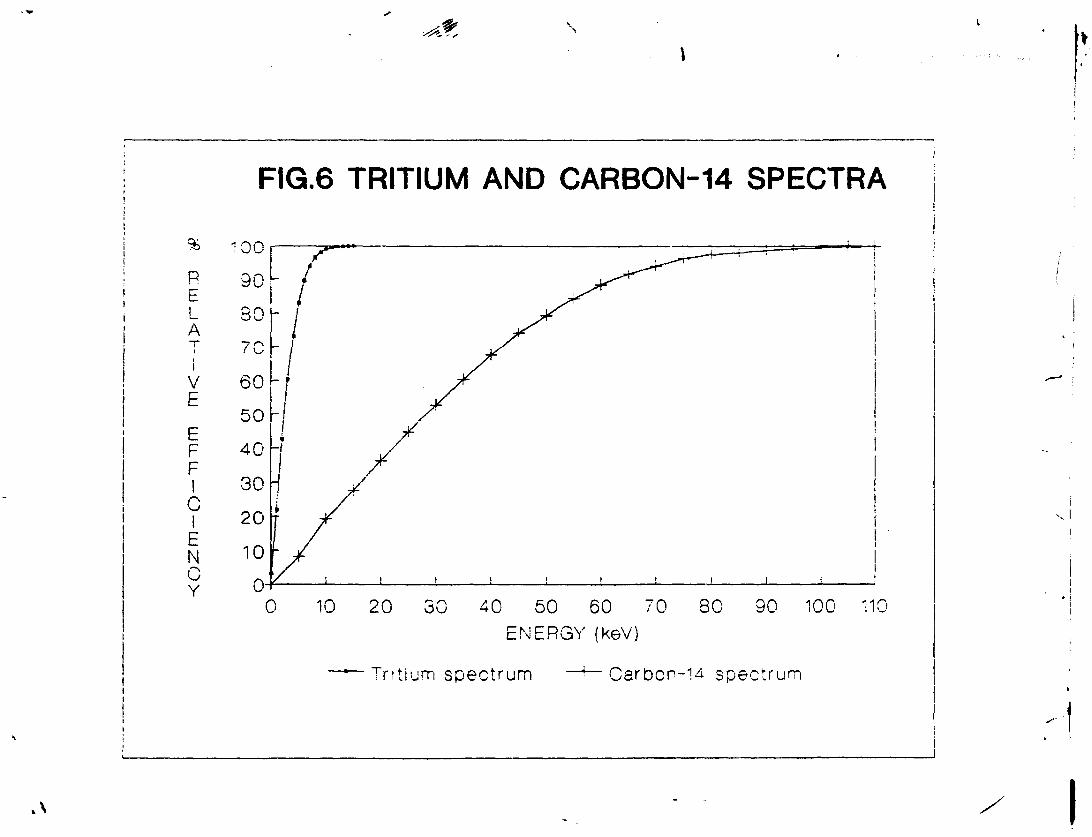
3 benzene was spiked with H-toluene. Another sample of benzene was spiked with C-toluene. To 3 ml spiked benzene taken in a normal scintillation glass vial, 0.045 g butyl PBD was added as scintillator. One of the three selectable counting regions was set to 0-25 keV in case of tritium and 0-200 keV for Carbon-14 to include full spectra of these isotopes. A series of measurements was made and plots of relative efficiency versus energy prepared. The resulting curves are shown in figure 6. Upper level of the counting window was set at about 98% relative carbon-14 detection efficiency while the lower level was set at about 98% relative tritium detection efficiency. For fine adjustment of the lower detection limit, background was measured and figure of merit, FM calculated by using the relation:
30
FM = * Relative Efficiency i AA\ V Background Count Rate
The lower discriminator was set for maximum value of FM without accepting more than 3% tritium detection efficiency into the carbon-14 window. Figure of merit determined for different window settings is given in Table 1.
The counting efficiency is less sensitive to variations in upper discriminator level and was set to 95 keV. In our case, the counting window was taken as 10-95 keV for the sample composition and geometry as mentioned above.
7.3.1 Quench Correction
Experimental procedure adopted for the determination of quench level of a sample for the geometry and scintillator composition mentioned above is as follows :
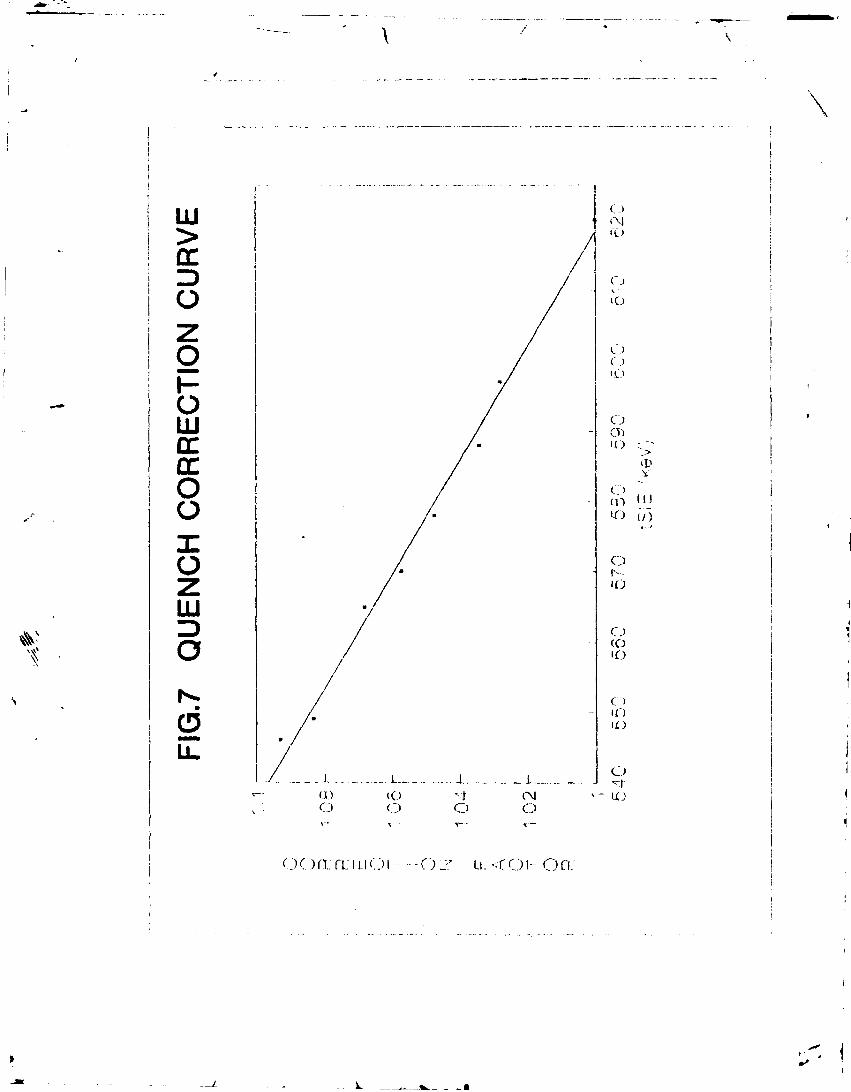
The unquenched sample was prepared in normal scintillation glass vial by mixing 3 ml 14C-spiked benzene with 0.045 g butyl PBD and counted for a total time of 100 minutes (10 times, each time for 10 minutes). The corresponding mean value of tSIE was noted. Per cent relative efficiency and quench correction factor were calculated. The sample was then quenched with the quenching solution and counted as before. The process of progressive quenching and counting was repeated.
The data was statistically evaluated by applying Chauvenete's criterion. A plot of tSIE and quench correction factor is shown in figure 7. The regression line is represented by the equation:
31
\ /
Y = 1.76 - 1.23 x 10"". X (45) (Corr. Coeff.= 99 %)
— 2 The standard error in the intercept is 2.63 x 10 and that in the slope is 4.56 * 10
The error in the correction factor varies between 0.0037 and 0.0043- A conservative error on the quench correction factor has been assumed as 0.005.
The quench correction factor should be close to 1 and if it is £ 1.05, the sample preparation procedure need be repeated.
7.4 Calculation of Results
Samples of background (marble), standard (NBS C-Oxalic Acid) and TDIC are processed to synthesize
benzene as described earlier. Benzene and scintillator mixture is prepared to ensure the same geometry. If sample benzene is not enough, its volume is made up by adding 4C-free (dead) benzene. The benzene samples of background, standard and TDIC are counted with preset time of 50 minutes to accummulate about 20,000 to 50,000 counts to reduce statistical counting error.
The counts are statistically evaluated by applying Chauvenet's criterion and any unusual count is rejected. Mean count rate is calculated. The average value of tSIE is also recorded for the standard and TDIC samples. The calculation of results is as follows
32
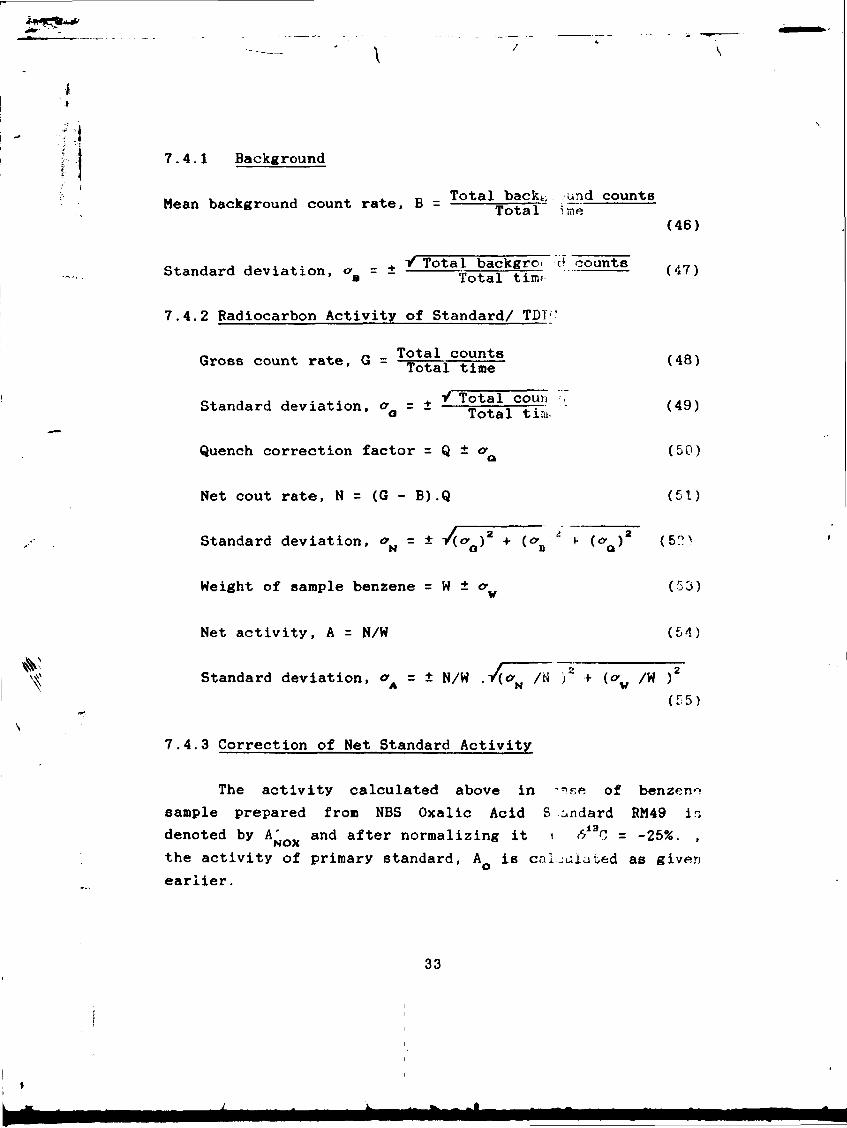
7.4.1 Background
M . , , . D Total backt; und counts Mean background count rate, B = Total- im^ (46)
(47) _. , , . . .. + V Total backgroi d counts Standard deviation, & = ± ^ — s _ _
a lotal txmf
7.4.2 Radiocarbon Activity of Standard/ TDI''
n * * r> - Total counts ,,9, Gross count rate, G = Total time ( 4 8 ) e* J J J • * • x. + V Total coun Standard deviation, o - ± _ ., .. a Total tmi; (49)
Quench correction factor = Q ± erQ (50)
Net cout rate, N = (G - B).Q (51)
Standard deviation, a - ± V{a\z + (c 2 f (<y ) 2 (5^ N O B u
Weight of sample benzene = W ± c (53)
Net activity, A = N/W (54)
Standard deviation, <* = ± N/W .vfc/N ) 2 + (c„ /W ) 2
(55)
7.4.3 Correction of Net Standard Activity
The activity calculated above in ^se of benzene sample prepared from NBS Oxalic Acid S ondard RM49 ir; denoted by A' and after normalizing it i J>i3G - -25%. ,
NOX the activity of primary standard, A is calculated as given earlier.
33
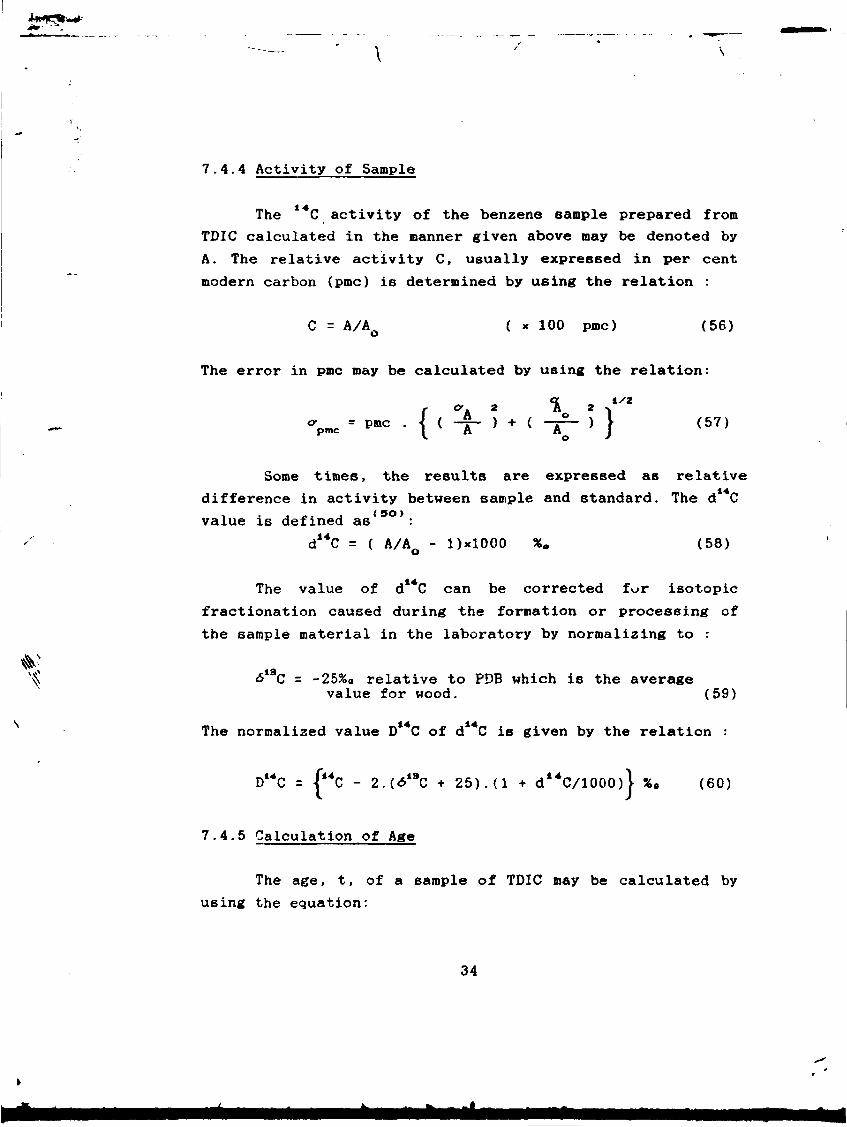
7.4.4 Activity of Sample
The C activity of the benzene sample prepared from TDIC calculated in the manner given above may be denoted by A. The relative activity C, usually expressed in per cent modern carbon (pmc) is determined by using the relation :
C = A/A0 ( x 100 pmc) (56)
The error in pmc may be calculated by using the relation:
a 2 A 2 ^pmc = P m c • < < -T- > + < -7T- > \ (57) { < 4 - > - < ^ > }
Some times, the results are expressed as relative difference in activity between sample and standard. The d C value is defined as :
d**C = ( A/AQ - DxlOOO %„ (58)
The value of d C can be corrected for isotopic fractionation caused during the formation or processing of the sample material in the laboratory by normalizing to :
<513C = -25%a relative to PDB which is the average value for wood. (59)
The normalized value D C of d C is given by the relation :
D14C = {"C - 2.(619C + 25). (1 + d 1 4C/1000)| %. (60)
7.4.5 Calculation of Age
The age, t, of a sample of TDIC may be calculated by thfi panation: using the equation
34
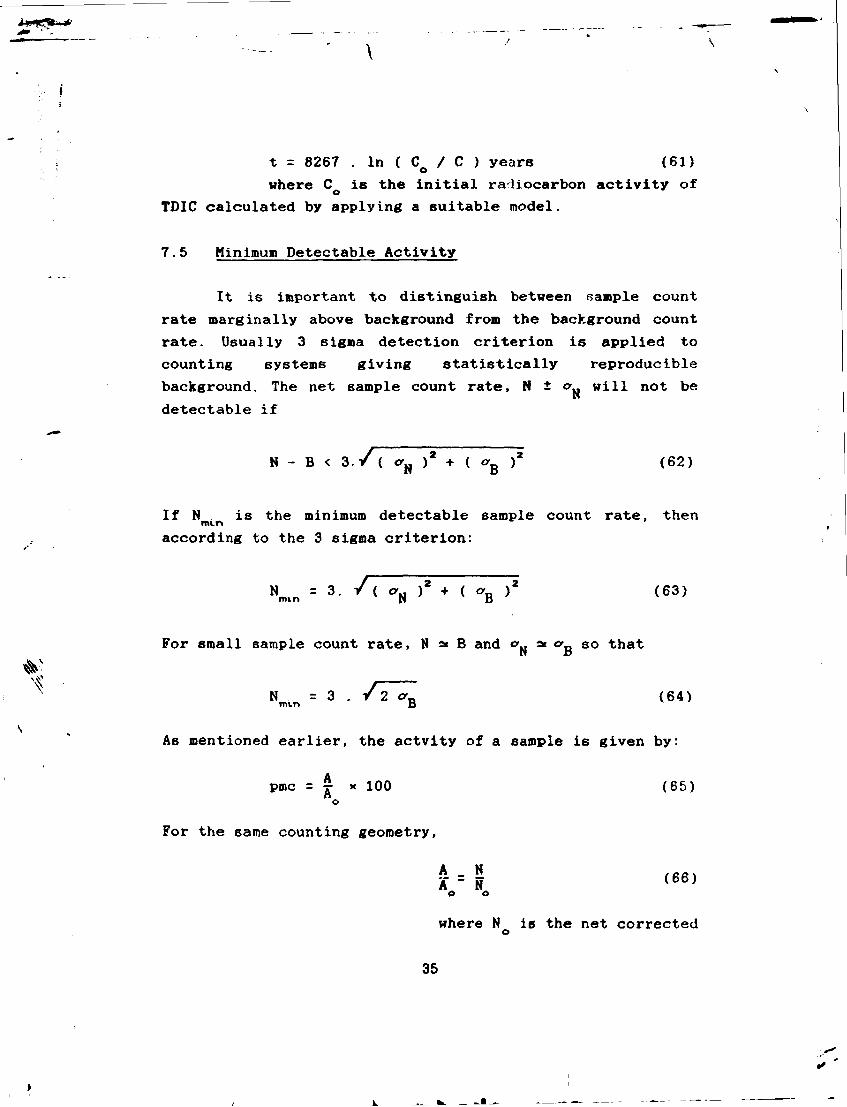
t = 8267 . In ( C / C ) years (61) O
where C is the initial radiocarbon activity of o
TDIC calculated by applying a suitable model. 7.5 Minimum Detectable Activity
It is important to distinguish between sample count rate marginally above background from the background count rate. Usually 3 sigma detection criterion is applied to counting systems giving statistically reproducible background. The net sample count rate, N ± o will not be detectable if
N - B < 3./( c N ) 2 + ( <?B ) 2 (62)
If N is the minimum detectable sample count rate, then nu.r*
according to the 3 sigma criterion:
Nnan = 3" A -„ >' • < % >' (63)
For small sample count rate, N a« B and o as a so that
N = 3 . / 2 orn (64)
As mentioned earlier, the actvity of a sample is given by:
pmc = | * 100 (65)
For the same counting geometry,
o o
where N is the net corrected o
35
count rate yielded by the standard.
The minimum pmc . may be calculated by: win
300 . V2 . <fo P»Cmin = N ( 6 7 )
o The minimum detectable activity for the experimental
set up described above is about 2 pmc.
7.6 Results of Carbon-14 Measurement
(51) Results of Carbon-14 measurement for the samples
collected from various places in Chaj Doab are given in Table 2. Low values of Carbon-14 content in deep wells may be due to long residence time. A good knowledge of the chemistry of water and soil of the area is essential to interpret the data properly.
ACKNOWLEDGEMENTS
The author wishes to thank International Atomic Energy Agency for providing the much needed equipment (e.g. Liquid scintillation analyzer, carbon precipitator and some expendable items) and expert services under Technical Co-operation Programme. Thanks are due to Director PINSTECH for his interest in the establishment of facilities for the measurement of radiocarbon in hydrological samples. The co-operation of Mr.Muhammad Islam Pasha in carrying out laboratory experiments is appreciated.
36
REFERENCES
1. Libby.W.F. (1955) Radiocarbon Dating, 2nd ed.,The University of Chicago Press.
2. Libby.W.F. (1967) History of Radiocarbon Dating, In: Radioac t ive Dating and Methods of Low Level Counting, I.A.E.A. Vienna C19675.
3. Chatters,R.M. and Olsson.E.A., eds.(1965) Proc.6th Intl.Conf. Radiocarbon and Tritium Dating, Pullman, Washington,June 7-11,1965, TID 4500 CONF 650652.
4. Radioactive Dating and Methods of Low Level Counting (1967), IAEA, Vienna, STI/PUB/152.
5. Isotopes in Hydrology (1967), IAEA, Vienna, STI/B/141. 6. Isotope Hydrology (1970), IAEA, Vienna, STI/PUB/255. 7. Olsson,I.U.,ed.(1970) Radiocarbon Variation and
Absolute Chronology, Nobel Symp.,12th,Proc.: John Wiley and Sons Inc.
8. Taylor,R.E.(1987), Radiocarbon Dating : An Archaeological Perspective, Academic Press Inc.(London) Ltd.
9. Fritz,P. and Fontes,J.-Ch.,eds. (1980),Environmental Isotope Geochemistry Vol.1, Elsevier.Amsterdam.
10. Guidebook on Nuclear Techniques in Hydrology (1983) ,I.A.E.A., Vienna, STI/DOC/10/91/2.
11. Lerman,J.C..Mook.W.G. and Vogel.J.C. C14 in tree rings from different localities, In: Ref.7.
12. Fairhall.A.W. and Young,J.A.(1970),Radiocarbon in the environment, In: Advances in Chemistry Series No.93: Radionuclides in the Environment, American Chemical Society.
13. Suess,H.E.(1955), Radiocarbon concentration in modern wood, Science, Vol.122, pp.415-417.
14. Fontes,J.-Ch. apd Garnier,J.M.(1979), Determination of the initial C activity of the total dissolved carbon: A revievr of the existing models and a new approach, Water Resources Research, Vol.15,No.2, PP.399-413.
37
15. Craig,H.(1953), The geochemistry of stable isotopes, Geochimica et Cosmochimica Acta, Vol.3, pp.53-92.
16. Craig,H.(1957), Isotopic standards for carbon and oxygen and correction factors for mass spectrometric analysis of carbon dioxide, Geochimica et Cosmochimica Acta, Vol.12,pp.133-149.
17. Rundel.P.W., Ehleringer,J.R., Nagy.K.A. eds.(1988), Stable isotopes in ecological research, Springer Verlag, New York.
18. Lloyd,J.W. and Heathcote,J.A.(1985), Natural Inorganic Hydrochemiet.ry in Relation to Groundwater, Clarendon Press, Oxford.
19. Bradley.R.S.(1985).Quaternary Paleoclimatology, Allen & Unwin, London.
20. Pearson,J.Jr. and Hanshaw.B.B.(1970), In: Ref.6. 21. Mook.W.G.(1980), Carbon-14 in geological studies, In:
Re/. 9
22. Badnel^C.J.(1980), The isotopic fractionation of *4C and C relative to C, In: Slater,E. A. , Tale,J.O. , eds. C198Q5, Proc.16 th Intl. Symp. Archaeometry and Archaeological Prospection, Edinburgh.
23. Stuiver.M.(1983), International agreements and the use of new oxalic acid standard, Radiocarbon, Vol.25, No.2, pp.793-795.
24. Standard Methods for the Examination of Water and Waste Water (1985).American Public Health Association, Inc., New York, U.S.A.
25. I.A.E.A.Isotope Hydrology Laboratory.Vienna (1981), Sampling of Water for C Analysis.
26. Tamers,M.A.(1960), Carbon-14 dating with the liquid scintillation counter: Total synthesis of the benzene solvent, Science Vol.132, pp. 668-669.
27. Nokes,J.E.,Kim,S.M. and Stipp,J.J.(1965), Chemical and counting advances in liquid scintillation age dating In: Proc. 6th Intl Con/. Radiocarbon and Tritium. Dating,Pullman,Washington, June 7-11,1965, TID450O CONF650652.
38
28. Tamers,M.A.(1965) .Routine C-14 Dating U6ing liquid scintillation techniques, ibid.
29. Polach.H.A. and Stipp,J.J.(1967),Improved synthesis techniques for methane and benzene radiocarbon dating,IJARI, Vol.18, pp.359 - 364.
30. Florkowski.T., Grabczak.J., Kuc.T. and Rozanski.K. (1975), Determination of radiocarbon in water by gas or liquid scintillation counting, Nukleonika,20, No.11-12, pp. 1053 - 1066.
31. Tamers,M.A.(1975) , Chemical yield optimization of the benzene synthesis for radiocarbon dating, IJARI, Vol.26, pp. 676 - 682.
32. Tamers,M.A., Radiocarbon/Tritium Dating: Benzene Syntheses and Liquid Scintillation Spectrometry, Reference Manual.
33. Polach.H., Gower.J.and Fraser.I. (1972), Synthesis of high purity benzene for radiocarbon dating, In: Rafter.T. A. .Taylor.T.G. . eds. Proc. 8th Intl. Radiocarbon Dating Con/.. 18-25 Oct. .1972. Lo-.L^r Hut t. New Zealand, pp. 145-208.
34. Birks,J.B.(1974).Towards an understanding of the scintillation process in organic molecular systems, In: Stanley. P. E. and Scoggins.B. A. ,~-ds.. Liquid Scintillation Counting - Recent Developments. Academic Press, London.
35. Weast.R.C.(1973-74).Handbook of Chemistry and Physics CRC Press.
36. Geyh.M.A. (1969) Problems in radiocarbon dat'.ig of small samples by means of acetylene,ethane or benzene, IJARI, Vol.20, pp. 463 - 466.
37. Godwin,H.(1962), Nature, London, Vol.195, pp.984. 38. Hughes,E.E. and Mann,W.B.(1964), The half life of
carbon-14: Comments on the mass-spectrometric method, IJARI, VOL.15, PP.97-100.
39. Bransome,Jr.,ed. ,(1970) ,The Current Status of Liquid Scintillation, Grune & Stratton, New York.
40. Horroks.D.L.,Noujaim,A.A.,Ediss.C. Weibe.L.I.(1976) eds.,Liquid Scintillation science and Technology, Academic Press,Inc., New York.
39
41. Bell..J.Jr. and Hayes,F.N.,eds.(1958).Liquid Scintillation Counting.Pergammon Press,London.
42. The Application of Liquid-Scintillation Counting to Radionuclide Metrology (1980).Monographic BTPM-3, Bureau International des Poids et Measures,Sevres.
43. Kleinknecht.K.(1987), Detectors for particle radiation, Cambridge University Press.
44. Birks,J.B.(1953).Scintillation Counters, MeGraw Hill Book Company, New York.
45. Liquid Scintillation Analysis (1987), Packard Instrument Co.Inc. U.S.A.
46. Polach.H.A.(1987), Evaluation and status of liquid scintillation counting for radiocarbon dating, Radiocarbon, Vol.29,No.1, pp.1-11.
47. Operation Manual, TRI-CARB 2000 Series Liquid Scintillation Analyzer, Packard Instrument Co.Inc.
48. Young,H.D.(1962), Statistical Treatment of Experimental Data, McGraw-Hill Book Company, Inc.
49. Harkness.D.D.(1986), Private communication, NERC Radiocarbon Laboratory.Scottish Universities Research and Reactor Centre, Glasgow.
50. Stuiver.M.and Polach.H.A.(1977), Reporting of 1 4C data, Radiocarbon,Vol.19,No.3, pp.355-363.
51. Huseain.S.D., Sajjad.M.I., Akram.W., Ahmad,M., Rafiq.M., Tariq.J.A. (1990), Surface water/groundwater relationship in Chaj Doab, Internal Report No. PINSTECH/RIAD-122.
40
APPENDIX - I : PREPARATION OF REAGENTS
Various solutions required for the titration and precipitation of TDIC are prepared in polyethylene bottles. Chemicals used are pure and of analytical grade.
1. CQz -Free Water
The pH of distilled water to be used should not be less than 6.0 . If it is less than 6.0, then water should be freshly boiled for 15 minutes and cooled to room temperature.
Deionized water may substituted for distilled water provided its electrical conductivity is less than 2pS/cra and pH greater than 6.0 .
2. Carbonate-Free NaOH Solution
A saturated solution of N'tOH in distilled water is allowed to stand for several weeks so that any Na CO produced may settle down. The supernatent Kolution is carefully decanted and its exposure to atmosphere avoided.
Alternatively, saturated solution of NnOH may be prepared in freshly deionized hot water.
3. Barium Chloride Solution
Saturated solution of barium chloride is prepared by dissolving 500 g BaCl,,.2H20 in 1000 ml hot distilled water or preferably CO -free water. Any precipitate- formed is allowed to settle and discarded.
41
4. Praestol Solution
Praestol is a synthetic high molecular weight water-soluble resin commercially available from: Chemische Fabrik Stockhausen & Cie., D-415 Krefeld.West Germany. It is used to improve the rate of solid/liquid separation. The solution is prepared by dissolving 5 g Praestol 2900 in 1000 ml CO -free water.
2
5. Phenolphthalein Indicator Solution
In order to prepare this indicator solution, 5 g phenolphthalein is dissolved in 500 ml 95% ethyl alcohl in glass bottle and the solution is mixed with 500 ml distilled/deionized water. When CO present in water sample is converted into HCO during titration , this indicator turns colourless at a pH of about 8.3 showing end point of the reaction.
6. Methyl Orange Indicator Solution
This solution is prepared by dissolving 0.5 g methyl orange in distilled/deionized water. The end point of the conversion reaction of HCOg to C0 2 is indicated by change of colour from yellow to salmon pink at a pH of about 4.
7. 0.1N Hydrochloric Acid Solution
It is prepared by dilution of 8.3 ml Hydrochloric acid of 37 % concentration and 1.19 kg/1 density with C02-free water to make 1000 ml solution.
8. Potassium Permanganate Solution
Potassium permanganate solution may be prepared by
42
dissolving 30 g KMn04 crystals in 500 ml deionized water. 5 ml concentrated sulphuric acid may be added to acidify it.
9. Unquenched Sample
A sample of C-spiked benzene with sufficient activity to give a count rate of about 1000 cpm (counts per minute) in the C window may be prepared.
10. Quenching Solution
A quenching solution may be prepared by mixing 1 ml acetone in 5 ml benzene.
43
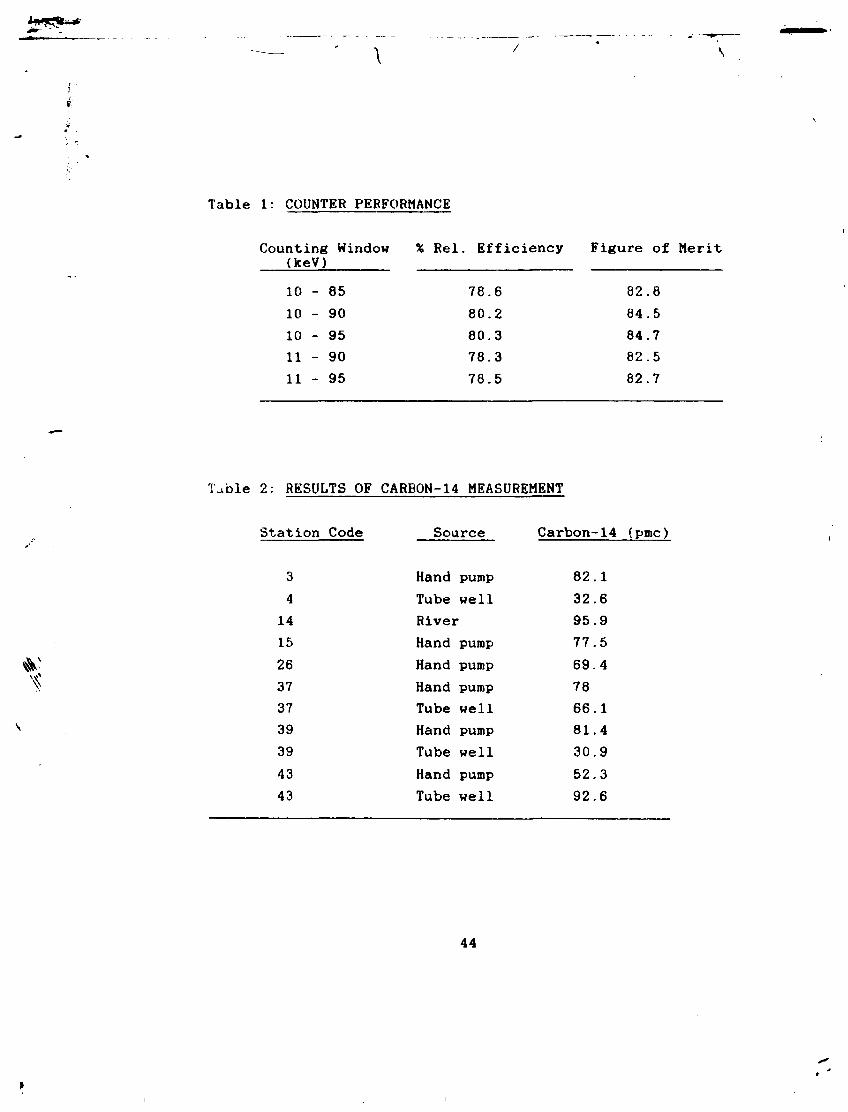
Table 1: COUNTER PERFORMANCE
Counting Window % Rel . Efficiency Figure of Merit (keV) 10 - 85 78.6 82.8 10 - 90 80.2 84.5 10 - 95 80.3 84.7 11 - 90 78.3 82.5 11 - 95 78.5 82.7
Table 2: RESULTS OF CARBON-14 MEASUREMENT
Station Code Source Carbon-14 (pmc)
3 Hand pump 82.1 4 Tube well 32.6 14 River 95.9 15 Hand pump 77.5 26 Hand pump 69.4 37 Hand pump 78 37 Tube well 66.1 39 Hand pump 81.4 39 Tube well 30.9 43 Hand pump 52.3 43 Tube well 92.6
44
NEUTRONS
NUCLEAR EXPLOSIONS
14,
COSMIC RAYS
—r~ NEUTRONS
I4„ N + n—» C + p
14, CO. i , 2 c o 2 +
, 4 c o 2
ATMOSPHERE
ASSIMILATION
LAND SURFACE
177777777777777;
IHUMUS
( PJ-ANTS 11 ft C 9 H l ( p 5 ) x 77777777)1^,
T
PRECIPITATION , FUEL
, 2 c o 2
t EXCHANGE FOSSIL
777777.
3—n to. SOIL \\p WATER LEVEI
LIMESTONE Ca' 2C0.
H , 4 C0s+ H , 2C(T3
FIG. I ORIGIN AND DISTRIBUTION OF , 4 C IN NATURE RELEVANT TO GROUNDWATER
STAINLESS STEEL STIRRER
POLYETHYLENE TANK WITH POLYETHYLENE FUNNEL
MILD STEEL STANO
FIG. 2 PRECIPITATOR (AFTER REF. 25)
x * V • &
LEGEND ^ p - VACUUM STOPCOCK
FIG. 3 SCHEMATIC SHOWING BENZENE SYNTHESIS SYSTEM (NOT TO SCALE)
\ \ y
si*;
PMT1
(VIAL)
PMT2
COINCIDENCE SUMMATION AMPLIFIER ADC JXfUl SPECTRUM ANALYZER
FIG. A SIMPLIFIED LIQUID SCINTILLATION ANALYZER
>\
x ^ 1
FIG.5 PLOT OF N VS T
v
u G
4 r
10 100 Number of observations, N
1000
i /
»v S
•sf*,T,
FIG.6 TRITIUM AND CARBON-14 SPECTRA
% 00
R 90 b L 30 A T "7 <~*
i i
I O
i
V 60 F
50 E F 40 r-r 1 30 0 I 20 F N 10 O Y 0
0 10 20 30 40 50 60 70 ENERGY (keV)
80 90 100 110
•*~ Tritium spectrum Carbon-14 spectrum
1
111 >
O
o LU CL CC O O X o z o
CD LL.
t'M <0
O
('.)
o
o <n
o r-
r > CO "O
O
I l l
()(.) n_ rL in c. j i - - o.?' LL < r o i - o cr
- W _ _ _ •