Embed Size (px)
Citation preview

ORIGINAL RESEARCH ARTICLEpublished: 11 October 2011
doi: 10.3389/fphys.2011.00070
Measurement of calcium dissociation rates fromtroponin C in rigor skeletal myofibrilsSean C. Little1, Svetlana B.Tikunova2, Catalina Norman1, Darl R. Swartz3 and Jonathan P. Davis1*
1 Department of Physiology and Cell Biology, The Ohio State University, Columbus, OH, USA2 Department of Pharmacological and Pharmaceutical Sciences, University of Houston, Houston, TX, USA3 Department of Anatomy and Cell Biology, Indiana University School of Medicine, Indianapolis, IN, USA
Edited by:
Julio L. Vergara, University ofCalifornia Los Angeles, USA
Reviewed by:
Julien Ochala, Uppsala University,SwedenD. George Stephenson, La TrobeUniversity, Australia
*Correspondence:
Jonathan P. Davis, Department ofPhysiology and Cell Biology, The OhioState University, 209 Hamilton Hall,1645 Neil Avenue, Columbus, OH43210, USA.e-mail: [email protected]
Ca2+ dissociation from the regulatory domain of troponin C may influence the rate ofstriated muscle relaxation. However, Ca2+ dissociation from troponin C has not been mea-sured within the geometric and stoichiometric constraints of the muscle fiber. Here wereport the rates of Ca2+ dissociation from the N-terminal regulatory and C-terminal struc-tural domains of fluorescent troponin C constructs reconstituted into rabbit rigor psoasmyofibrils using stopped-flow technology. Chicken skeletal troponin C fluorescently labeledat Cys 101, troponin CIAEDANS, reported Ca2+ dissociation exclusively from the structuraldomain of troponin C at ∼0.37, 0.06, and 0.07/s in isolation, in the presence of troponinI and in myofibrils at 15˚C, respectively. Ca2+ dissociation from the regulatory domainwas observed utilizing fluorescently labeled troponin C containing the T54C and C101Smutations.Troponin CT54C,C101S reported Ca2
MIANS+ dissociation exclusively from the regulatory
domain of troponin C at >1000, 8.8, and 15/s in isolation, in the presence of troponin I andin myofibrils at 15˚C, respectively. Interestingly, troponin CT54C,C101S reported a biphasicIAANSfluorescence change upon Ca2+ dissociation from the N- and C-terminal domains of tro-ponin C with rates that were similar to those reported by troponin CT54C,C101S and troponinMIANSCIAEDANS at all levels of the troponin C systems. Furthermore, the rate of Ca2+ dissociationfrom troponin C in the myofibrils was similar to the rate of Ca2+ dissociation measuredfrom the troponin C-troponin I complexes. Since the rate of Ca2+ dissociation from theregulatory domain of TnC in myofibrils is similar to the rate of skeletal muscle relaxation,Ca2+ dissociation from troponin C may influence relaxation.
Keywords: troponin, calcium, myofibril, skeletal, muscle, relaxation, dissociation
INTRODUCTIONFast-twitch skeletal muscle troponin C (TnC) contains two N-terminal and two C-terminal EF-hand Ca2+ binding sites that canbe easily distinguished according to their Ca2+ dissociation rates
Abbreviations: ATPγS, adenosine 5′-[gamma-thio]triphosphate; BDM, 2,3-butanedione monoxime; BTS, N -benzyl-p-toluenesulfonamide; [Ca2+]50,[Ca2+] required for 50% of maximal force generation; DTT, dithio-threitol; EDTA, ethylenediamine-N,N,N ′,N ′-tetraacetic acid; EGTA, eth-ylene glycol bis ((-aminoethyl ether)-N,N,N ′,N ′-tetraacetic acid; IAANS,2-(4′-(iodoacetamido)anilino) naphthalene-6-sulfonic acid; IAEDANS,5-((((2-iodoacetyl)amino)ethyl)amino) naphthalene-1-sulfonic acid;IANBD, N,N ′-dimethyl-N -(iodoacetyl)-N ′-(7-nitrobenz-2-oxa-1,3-diazol-4-yl)ethylenediamine; Kd(Ca), Ca2+ dissociation constant; MIANS, 2-(4′-maleimidylanilino)naphthalene-6-sulfonic acid; MOPS, 3-(N -morpholino)propanesulfonic acid; Quin-2, 2-[(2-amino-5-methylphenoxy)methyl]-6-methoxy-8-aminoquinoline-n,n,n′,n′-tetraacetic acid; TFP, trifluoperazine dihydrochloride;Tn, troponin; TnC, troponin C; TnCdanz, TnC labeled on Met25 with 5-dimethylaminonaphthalene-1-sulfonyl aziridine; TnCEndog, endogenous TnC;TnCF29W, TnC containing the F29W mutation; TnCF29W(5OH), TnCF29W contain-ing the Trp analog 5-fluoro-dl-tryptophan; TnCIAEDANS, TnC labeled at Cys 101with IAEDANS; TnCT54C,C101S
IAANS , TnC containing the T54C and C101S mutations
labeled on T54C with IAANS; TnCT54C,C101SMIANS , TnC containing the T54C and C101S
mutations labeled on T54C with MIANS; TnI, troponin I; TnI96–148, chickenskeletal troponin I peptide corresponding to residues 96–148; TnIAANS, Tn complexcontaining TnI labeled with IAANS. TnT, troponin T; Tween-20, polysorbate 20.
(Johnson et al., 1981). Based on data obtained from TnC in solu-tion, only the N-terminal EF-hands release Ca2+ fast enough tobe involved in the regulation of muscle relaxation (Johnson et al.,1981; Stephenson and Williams, 1981). However, this hypothesishas not been tested with TnC bound in the myofibril.
Clearly, the mechanisms that determine or modulate the rateof striated muscle relaxation are biochemical and mechanical(Stephenson and Williams, 1981; Wahr et al., 1998; Gordon et al.,2000; Luo et al., 2002; Tesi et al., 2002). Thus, it is important tolink the fundamental relationships of muscle biochemistry to thatof its physiology. There are at least three biochemical factors thatcan potentially influence the rate of striated muscle relaxation: (1)the rate of fall in the Ca2+ transient; (2) the rate of cross-bridgedetachment; and (3) the rate of deactivation of the thin filamentcontrolled by Ca2+ dissociation from the N-terminal regulatorydomain of TnC (Gordon et al., 2000; Luo et al., 2002). Under nor-mal physiological conditions it may be that no one mechanismis the all-inclusive rate-limiting step of relaxation, but that theseprocesses may be working together (Johnson et al., 1997; Luo et al.,2002).
Previously, we demonstrated that TnC mutants with fasteror slower regulatory domain Ca2+ dissociation rates in solutionincreased, but more effectively decreased, the rate of Diazo-2
www.frontiersin.org October 2011 | Volume 2 | Article 70 | 1

Little et al. Myofibrillar TnC Ca2+ dissociation rates
induced relaxation when reconstituted into rabbit skinned psoasmuscle (Luo et al., 2002). The rate of Ca2+ dissociation from TnCin solution is at least 20-times faster than the rate of skeletal musclerelaxation and thus is too rapid to be considered rate-limiting forrelaxation (Stephenson and Williams, 1981; Luo et al., 2002). How-ever, isolated TnC is not a good model system for troponin (Tn)in muscle (Davis et al., 2002, 2004). The simplest model systemfor Ca2+ dissociation from TnC in skeletal muscle may be the rateof Ca2+ dissociation from the regulatory domain of TnC boundto troponin I (TnI) or its peptide fragment, TnI96–148 (Davis et al.,2002, 2004). For instance, the rate of Ca2+ dissociation from theregulatory domain of the TnC–TnI96–148, TnC–TnI and Tn com-plexes, are all quantitatively similar to the rate of skeletal musclerelaxation at ∼4, 15, and 20˚C (Stephenson and Williams, 1981;Johnson et al., 1997; Luo et al., 2002; Davis et al., 2004; Kreutzigeret al., 2008; Lee et al., 2010).
In order to ultimately test the hypothesis that the rate of Ca2+dissociation from the N-terminal regulatory domain of TnC con-tributes to the rate of skeletal muscle relaxation, one must be ableto measure this rate in a muscle fiber and confirm that it is quan-titatively similar to the rate of muscle relaxation. To date this hasnot been accomplished, nor to the best of our knowledge evenattempted. However, numerous studies have attempted to simu-late the physiological system’s Ca2+ kinetics by studying TnC inisolation, in the TnC–TnI complex, in Tn and in regulated thinfilaments (Johnson et al., 1981, 1994; Luo et al., 2002; Davis et al.,2004; Shitaka et al., 2004, 2005). We have taken these studies astep further and closer to the physiological system by utilizing iso-lated rigor skeletal myofibrils. Skeletal myofibrils contain all thenecessary contractile and regulatory proteins in the proper sto-ichiometry and geometry. Isolated myofibrils have been shownto contract and relax with kinetics similar to skinned and intactmuscle fibers (Tesi et al., 2002; Poggesi et al., 2005).
In order to observe the N-terminal regulatory domain of TnCin myofibrils we have engineered a new fluorescent TnC labeledwith two different environmentally sensitive fluorescent probes,IAANS or MIANS. Neither the two mutations (T54C and C101S)nor the extrinsic fluorescent labeling of TnC affected its bio-logical activity. Furthermore, it was possible to follow both theN-terminal and C-terminal rates of Ca2+ dissociation from TnCusing the different fluorescent TnC moieties in isolation, in theTnC–TnI complex and in myofibrils. Consistent with currentthought, only the rate of Ca2+ dissociation from the N-terminalregulatory domain of TnC in rigor myofibrils is kinetically rapidenough to be physiologically relevant. Furthermore, this rate isquantitatively similar to the rate of skeletal muscle relaxationat ∼4 and 15˚C and thus may influence the rate of skeletalmuscle relaxation (Stephenson and Williams, 1981; Luo et al.,2002).
MATERIALS AND METHODSMATERIALSPhenyl-Sepharose CL-4B and EGTA were purchased from SigmaChemical Co. (St. Louis, MO, USA). Quin-2 was purchased fromCalbiochem (La Jolla, CA, USA). All other chemicals were ofanalytical grade.
PROTEIN MUTAGENESIS AND PURIFICATIONThe chicken skeletal fast TnI protein (with native Cys residuesmutated to Ser) and TnC plasmid were a generous gift fromDr. Lawrence B. Smillie (University of Alberta). The construc-tion and expression of chicken skeletal TnC in pET3a hasbeen described (Li et al., 1994). The TnCT54C,C101S proteinwas constructed from the TnC plasmid by primer based site-directed mutagenesis using Stratagene’s (La Jolla, CA, USA) Quik-Change Site-Directed Mutagenesis Kit. The mutations were con-firmed by DNA sequence analysis. The plasmid for TnCT54C,C101S
was transformed into E. Coli BL21(DE3)pLysS cells (Novagen),expressed and purified as previously described (Tikunova et al.,2002). Aliquots of TnC or TnCT54C,C101S were labeled withthe environmentally sensitive thiol-reactive fluorescent probes5-((((2-iodoacetyl)amino)ethyl)amino) naphthalene-1-sulfonicacid (IAEDANS), 2-(4′-(iodoacetamido)anilino) naphthalene-6-sulfonic acid (IAANS), or 2-(4′-maleimidylanilino)naphthalene-6-sulfonic acid (MIANS). The TnC constructs were reacted withthree- to fivefold molar excess of the different fluorescent probesfor ∼6 h at room temperature with constant shaking in 50 mMTris, 90 mM KCl, 1 mM EGTA, 6 M urea, pH 7.5. The labelingreaction was stopped by addition of 2 mM DTT and the labeledproteins were exhaustively dialyzed against 10 mM MOPS, 90 mMKCl,pH 7.0 at 4˚C to remove un-reacted label. On average,71 ± 4%of the different TnC constructs were determined to be labeled withthe various fluorescent probes under these conditions.
DETERMINATION OF Ca2+ AFFINITIESAll steady-state fluorescence measurements were performed usinga Perkin-Elmer LS5 Spectrofluorimeter at 15˚C. IAANS fluores-cence was excited at 330 nm and monitored at 450 nm, whereasMIANS fluorescence was excited at 325 nm and monitored at435 nm. Ca2+ titrations were performed by adding microliteramounts of CaCl2 to 1 ml of the fluorescent TnC constructs(0.6 (M) ± TnI (1.2 (M) in 200 mM MOPS (to prevent pH changesupon addition of Ca2+), 90 mM KCl, 2 mM EGTA, 1 mM Mg2+,1 mM DTT, pH 7.0, at 15˚C. The [Ca2+]free was calculated usingthe computer program EGCA02 developed by Robertson andPotter (1984). The Ca2+ affinities are reported as dissociation con-stants (Kd(Ca)). Each Kd(Ca) represents a mean ± SE of three tofive titrations fit with a logistic sigmoid function mathematicallyequivalent to the Hill equation, as previously described (Tikunovaet al., 2002).
MYOFIBRIL PREPARATIONAll the animal protocols and procedures were performed in accor-dance with National Institutes of Health guidelines and approvedby the Institutional Laboratory Animal Care and Use Committeeat The Ohio State University. Rabbit skeletal psoas myofibrils inrigor were prepared, stored, and handled as previously described(Swartz et al., 1997; Davis et al., 2004). Endogenous TnC wasextracted from a sample of the stock myofibrils by first washingthe myofibrils three times in a myofibril TnC extraction solution(10 mM MOPS, 5 mM EDTA, 1 mM DTT, 0.02% Tween-20, pH8.0) to remove any residual glycerol. Tween-20 was utilized as asurfactant to minimize myofibril aggregation. Bovine serum albu-min was initially utilized instead of Tween-20, but was found to
Frontiers in Physiology | Striated Muscle Physiology October 2011 | Volume 2 | Article 70 | 2

Little et al. Myofibrillar TnC Ca2+ dissociation rates
bind Ca2+ and interfere with the Quin-2 studies mentioned below.The myofibrils were then incubated in the TnC extraction solu-tion for approximately 10 min at room temperature, pelleted andresuspended in fresh TnC extraction solution an additional threetimes each for 10 min to ensure that TnC was extracted from boththe non-overlap and overlap zones of the sarcomere (Swartz et al.,1997). The TnC extracted myofibrils were then washed three timesin 10 mM MOPS, 90 mM KCl, 1 mM Mg2+, 1 mM DTT, 0.02%Tween-20 at pH 7.0. The TnC extracted myofibrils were then
exposed to 16 (M TnCIAEDANS, TnCT54C,C101SIAANS , or TnCT54C,C101S
MIANSfor 30 min on ice. Free labeled TnC was removed from the myofib-rils by washing the myofibrils three times in 10 mM MOPS, 90 mMKCl, 1 mM Mg2+, 1 mM DTT, 0.02% Tween-20 at pH 7.0. Themyofibrils were then diluted in the same buffer to ∼1 mg/ml andfiltered through a 100-μm pore diameter mesh to remove largepieces of muscle or myofibril aggregates. Prior to the stopped-flowexperiments, 200 μM Ca2+ was added to the myofibrils. Samplesof the reconstituted myofibrils were also plated on a glass slidewith a cover slip and imaged as previously described (Swartz et al.,1997; Zhang et al., 2000; Davis et al., 2004). Briefly, the imageswere collected using a Zeiss Axiovert TV (Thornwood, NJ, USA)epifluorescence microscope equipped with a 100× oil-immersionphase contrast lens and a Chroma filter set #11000UV (360 nmbroad excitation, 400 nm long pass dichroic, and 420 nm long passemission). Digital images were obtained using a 12-bit intensityresolution CCD camera (Kodak KAF 1300 chip; Photometrics,Tucson, AZ, USA) controlled by a Matrox board and IPLab Spec-trum software (v3.2.3, Signal Analytics, Vienna, VA, USA) run bya PowerMac 8100.
DETERMINATION OF Ca2+ DISSOCIATION KINETICSCa2+ dissociation kinetics were measured using an Applied Pho-tophysics Ltd. (Leatherhead, UK) model SX.18 MV stopped-flowinstrument with a dead time of 1.4 ms at 15˚C. The fluores-cently labeled TnC or TnCT54C,C101S ± TnI samples were excitedusing a 150-W xenon arc source (at 325, 330, or 340 nm forMIANS, IAANS, or IAEDANS, respectively) with emission moni-tored through a 420- to 470-nm band-pass filter (Oriel, Stratford,CT, USA). Direct Ca2+ dissociation rates were also measuredfrom unlabeled TnC ± TnI using the fluorescent Ca2+ chelatorQuin-2 (Tikunova et al., 2002; Davis et al., 2004). Quin-2 wasexcited at 330 nm with its emission monitored through a 510-nmbroad band-pass interference filter (Oriel, Stratford, CT, USA).The buffer used for the solution stopped-flow experiments was10 mM MOPS, 90 mM KCl, 1 mM Mg2+, 1 mM DTT, at pH 7.0.Since the myofibrils are a suspension prone to scatter artifacts,approximately one in six shots led to inconsistent fluorescent sig-nals, a phenomenon not experienced with the solution studies.Each Ca2+ dissociation event represents an average of at least fivetraces collected and repeated 9 times for the isolated TnC andTnC–TnI complexes and 14 times for the myofibril studies. Thedata were fit with a single or double exponential equation aftermixing was complete.
MUSCLE FIBER EXPERIMENTSSingle fibers were isolated the day of use from bundles of rab-bit psoas muscle that had been stored in a glycerinating solution
at −20˚C no longer than 1 month. Solutions and the mechanicalsetup utilized for force measurements were as previously described(Greaser et al., 1988). Briefly, a single fiber was soaked in relaxingsolution containing 1% (v/v) Triton X-100 for 5 min to removeany residual sarcolemma and sarcoplasmic reticulum. The fiberwas then attached to a servo-controlled DC torque motor (Cam-bridge Technologies,Watertown, MA, USA) and an isometric forcetransducer (model 403A, Cambridge Technologies, Watertown,MA, USA) by aluminum T-clips (Wahr et al., 1998). Resting sar-comere length was set between 2.50 and 2.60 (m. The fiber wasthen activated in a pCa 4.0 solution and rapidly slackened afterisometric force reached a plateau. The analog output of the forcetransducer was digitized using a DaqBoard/2000 and Daqviewsoftware (Iotech Inc., Cleveland, OH, USA). The total force wasmeasured between the plateau and baseline levels. The same pro-cedure was utilized to obtain the resting force level of the fiber ina pCa 9.0 solution. The active force generated by the fiber in thevarious pCa solutions was calculated as the total force minus theresting force. Three active force measurements were performedin pCa 4.0 with the final activation taken as the maximal forcegenerated by the native fiber (i.e., prior to extraction of endoge-nous TnC) which led to an average force per cross sectional areaof 73 ± 7 kN/m2. The fiber was then exposed for 2 min to a TnCextraction solution containing 5 mM EDTA, 10 mM HEPES and0.5 mM trifluoperazine dihydrochloride (TFP; used to enhance therate of TnC extraction) at pH 7.0 (Metzger et al., 1989). The fiberwas then washed three times in pCa 9.0 solution to remove residualTFP. TFP was not used with the myofibril studies since TFP is fluo-rescent and we were concerned that trace amounts remaining afterwashing the myofibrils could compromise the IAANS or MIANSfluorescent signals (Martyn et al., 1999). If the residual force inpCa 4.0 solution was >10% of the maximal force the extractionprocess was repeated. The fibers were then incubated for 2 min ina pCa 9.0 solution containing 16.7 (M recombinant TnCT54C,C101S
or TnCT54C,C101SIAANS . All of the reconstituted fibers were then exposed
to a series of pCa solutions varying from pCa 9.0 to 4.0 and theactive force versus pCa was measured. Every fourth activation wasperformed at pCa 4.0 to which each adjacent and randomized pCawere normalized. Each data point represents the mean ± SE fromat least four separate fibers individually normalized and fit witha logistic sigmoid function mathematically equivalent to the Hillequation. The solutions for skinned fiber experiments were pre-pared as previously described (Norman et al., 2007). Large batchesof pCa 9.0 and pCa 4.0 solutions were divided into aliquots andstored at -80˚C. These aliquots were thawed and mixed to makeintermediate-pCa solutions, which were stored at 4˚C and usedwithin a week.
RESULTSCHARACTERIZATION OF THE Ca2+ DISSOCIATION RATES FROMTNCIAEDANS IN ISOLATION, IN THE PRESENCE OF TNI AND INMYOFIBRILSChicken skeletal TnC contains a single, C-terminal Cys residue atposition 101 (Golosinska et al., 1991). Previously we have shownthat this residue can be labeled with an environmentally sensitivefluorophore, TnCIAEDANS, and observed in reconstituted rabbitpsoas myofibrils (Davis et al., 2004). We hypothesized that it
www.frontiersin.org October 2011 | Volume 2 | Article 70 | 3

Little et al. Myofibrillar TnC Ca2+ dissociation rates
would be possible to take advantage of the fluorescence signalof TnCIAEDANS to follow the rate of Ca2+ dissociation from theC-terminal structural domain of TnC in myofibrils.
As Ca2+ dissociated from isolated TnCIAEDANS, the fluorescentsignal decayed at a rate of 0.37 ± 0.03/s at 15˚C (Figure 1A), whichwas similar to the rate of Ca2+ dissociation from the C-terminalsites of TnCF29W (0.48 ± 0.01/s) as measured by the fluorescentCa2+ chelator Quin-2 (Davis et al., 2002). We have previouslyshown that addition of TnI to TnCF29W slowed the rate of Ca2+dissociation from the C-terminal sites of TnCF29W approximatelyfourfold as measured by Quin-2 at 15˚C (Davis et al., 2002). Like-wise, the dissociation of Ca2+ from the TnCIAEDANS–TnI complexdecreased the rate of fluorescence decay approximately fivefold(Figure 1A). Figure 1A also shows that the rate of fluorescencedecay of TnCIAEDANS (0.07 ± 0.02/s) reconstituted into rabbitpsoas skeletal myofibrils (in rigor) was identical to that of theTnCIAEDANS–TnI complex (0.07 ± 0.01/s; Figure 1A). Figure 1B
FIGURE 1 | Characterization of the Ca2+ dissociation rates from
TnCIAEDANS in isolation, in the presence ofTnI and in myofibrils. (A)
Shows the time course of decrease in IAEDANS fluorescence as Ca2+ wasremoved by EGTA from the C-terminal Ca2+-binding sites of TnCIAEDANS ±TnIand in reconstituted myofibrils. TnCIAEDANS (0.6 μM) ±TnI (1.2 μM) in 10 mMMOPS, 90 mM KCl, 1 mM Mg2+, 1 mM DTT at pH 7.0 plus 200 μM Ca2+
was rapidly mixed with an equal volume of the same buffer plus 10 mMEGTA at 15˚C. Similar experiments were performed with ∼1 mg/mlreconstituted myofibrils except the buffer also contained 0.02% Tween-20.The flat line represents the fluorescence level of Ca2+ saturated myofibrils inwhich EGTA in the second syringe was replaced with 200 μM Ca2+.IAEDANS emission fluorescence was monitored through a 420- to 470-nmband-pass filter with excitation at 340 nm. The TnCIAEDANS and TnCIAEDANS–TnIcomplex traces have been normalized to that of the TnCIAEDANS reconstitutedmyofibrils trace and staggered for visual clarity. (B) Shows the phasecontrast (top panel) and IAEDANS fluorescence (bottom panel) imagesobtained from a representative rigor psoas myofibril reconstituted withTnCIAEDANS. The vertical line designates the location of the Z-line, and thehorizontal lines designate the location of the A bands.
demonstrates that TnCIAEDANS incorporated into the myofibrilsand that its fluorescence originated from the location of the thinfilaments. Based on the phase contrast images, the average sar-comere length of the myofibrils was 2.5 ± 0.1 μm. Thus, Ca2+dissociation from the C-terminal EF-hands of TnC can be followedby TnCIAEDANS in the myofibrils and consistent with the solutionstudies, is too slow to be rate-limiting for fast-twitch skeletal mus-cle relaxation (∼4 and 17/s at ∼4 and 15˚C, respectively; Johnsonet al., 1981; Stephenson and Williams, 1981; Luo et al., 2002).
CALCIUM BINDING TO TNCT54C,C101SIAANS OR TNCT54C,C101S
MIANS ± TNIThe question still remained if Ca2+ dissociation from the N-terminal Ca2+ binding sites of TnC in myofibrils occurs with arate that could influence the rate of muscle relaxation. We havepreviously demonstrated that the rate of Ca2+ dissociation fromthe N-terminal, regulatory Ca2+ binding sites of the TnCF29W–TnIcomplex was slow enough (∼11/s) to potentially be rate-limitingfor fast-twitch muscle relaxation and may be a good model systemfor the rate of Ca2+ dissociation from TnC in muscle (Davis et al.,2002, 2004). It was not possible to utilize TnCF29W fluorescencein myofibrils due to contaminating Trp signals from numerousother proteins. Reconstituted myofibrils with TnCF29W(5OH) (aTrp analog with distinct spectral properties; Valencia et al., 2003)gave signals that were too noisy to utilize (data not shown), pos-sibly due to the fact that this fluorescent probe has a small Stoke’sshift, making it more prone to scatter artifacts. Additionally, eventhough TnCdanz fluorescence has been utilized in skinned fibers(Guth and Potter, 1987; Morano and Ruegg, 1991), the signal wasalso too noisy and small to reliably measure the Ca2+ dissociationrates from TnCdanz reconstituted myofibrils in the stopped-flowapparatus (data not shown).
We engineered a novel fluorescent TnC that would follow therate of Ca2+ dissociation from the regulatory sites of TnC withhigh fidelity and had a fluorescent signal that could be distin-guished and measured in the myofibril. Figure 2A shows a cartoonrepresentation of the movement of Thr 54 (T54) as TnC bindsCa2+ ± TnI. T54 is located at the junction of the B and C helicesin the N-terminal of TnC and is not involved in direct ligationof Ca2+ nor does it appear to interact with TnI based on thecrystal structure of the Ca2+ saturated regulatory domain of theTn complex (however, in the Ca2+-free N-terminal Tn structureT54 comes in close contact with Arg 112 in TnI; Vinogradovaet al., 2005). Thus, we predicted that the conservative mutationof T54 to Cys (with the endogenous Cys 101 mutated to Ser)labeled with an environmentally sensitive fluorophore would cre-ate an appropriate fluorescent TnC to measure Ca2+ dissociationin myofibrils.
Figure 2B shows that the fluorescence of TnCT54C,C101SIAANS
increases upon Ca2+ binding with a Kd(Ca) of 7 ± 1 μM, whichwas close to that of TnCF29W at 15˚C (Davis et al., 2002; Tikunovaet al., 2002). However, unlike TnCF29W fluorescence, Ca2+ con-centrations in excess of 16 μM caused the fluorescence of isolatedTnCT54C,C101S
IAANS to decrease with a Kd(Ca) of 73 ± 23 μM. The Hillcoefficients of these fluorescent changes were near unity (1.2 ± 0.2and 0.9 ± 0.2 for the increase and decrease phases, respectively)potentially implying the binding event of two independent Ca2+ions to the regulatory domain of TnC. This biphasic pattern of
Frontiers in Physiology | Striated Muscle Physiology October 2011 | Volume 2 | Article 70 | 4

Little et al. Myofibrillar TnC Ca2+ dissociation rates
FIGURE 2 | Calcium binding toTnCT54C,C101S
IAANS±TnI. (A) Shows a helical
representation of apo TnC and Ca2+ saturated TnC ±TnI with T54 depicted inspace fill format. The Protein Data Bank files utilized for this figure were1TOP (apo TnC; Satyshur et al., 1994), 2TN4 (Ca2+–TnC; Houdusse et al.,1997), and 1YTZ (Ca2+–TnC–TnI, TnT is not shown for clarity; Vinogradovaet al., 2005) and were rendered using Rasmol (Sayle and Milner-White,1995). (B) Shows the Ca2+ dependent increase and decrease in IAANSfluorescence for TnCT54C,C101S
IAANS (•) and the Ca2+ dependent decrease inMIANS fluorescence for TnCT54C,C101S
MIANS (�) as a function of pCa. TnCT54C,C101SIAANS
fluorescence was fit with the sum of two independent Hill equations. (C)
Shows the Ca2+ dependent decrease in IAANS and MIANS fluorescence forthe TnCT54C,C101S
IAANS –TnI (•) and TnCT54C,C101SMIANS –TnI (�) complexes as a function of
pCa. Microliter amounts of Ca2+ were added to the different fluorescentTnC constructs (0.6 μM) ±TnI (1.2 μM) in 200 mM MOPS, 90 mM KCl,2 mM EGTA, 1 mM Mg2+, 1 mM DTT, pH 7.0, at 15˚C. IAANS fluorescenceemission was monitored at 450 nm with excitation at 330 nm, whereasMIANS fluorescence emission was monitored at 435 nm with excitation at325 nm. Hundred percentage fluorescence corresponds to the highestfluorescent state whereas 0% fluorescence corresponds to the lowestfluorescent state of the two respective conditions (±TnI).
Ca2+ binding to TnCT54C,C101SIAANS is consistent with a mechanism of
sequential Ca2+ binding to the two N-terminal EF-hands of TnC,as was observed with wild type TnC by NMR, CD spectroscopy,and flow dialysis (Li et al., 1995; Pearlstone et al., 2000; Valen-
cia et al., 2003). The calculated Kd(Ca) values for TnCT54C,C101SIAANS
have relatively large errors and may under- or over-estimate theactual Kd(Ca) values. The error does not arise from irreproducibledata but from the fact that there was no unique solution to thecurve fit since we were unable to determine the true amplitudesof the fluorescent changes. Interestingly, TnCT54C,C101S
MIANS fluores-cence only decreased upon the addition of Ca2+ with a Kd(Ca) of
56 ± 5 μM (Figure 2B). This low Kd(Ca) for TnCT54C,C101SMIANS falls
within the range observed by NMR for the second Ca2+ bind-ing to the N-terminal of TnC, potentially at site I (Li et al., 1995;Pearlstone et al., 2000; Valencia et al., 2003). Thus, IAANS fluores-cence was sensitive to both N-terminal Ca2+ binding sites, whereasMIANS fluorescence was only sensitive to the second, low affinitybinding site.
Unlike isolated TnCT54C,C101SIAANS , the TnCT54C,C101S
IAANS –TnI complexdisplayed only a monophasic decrease in fluorescence upon Ca2+binding with a Kd(Ca) of 130 ± 4 nM (Figure 2C), a value similarto that of the TnCF29W–TnI complex (Ramos, 1999; Davis et al.,2002, 2004). Thus, TnI enhanced the Ca2+ binding sensitivity of
TnCT54C,C101SIAANS ∼31- to 1338-fold. Likewise, the TnCT54C,C101S
MIANS –TnI complex also displayed a monophasic decrease in fluorescenceupon Ca2+ binding with a Kd(Ca) of 80 ± 5 nM (Figure 2C).
Thus, TnI enhanced the Ca2+ binding sensitivity of TnCT54C,C101SMIANS
∼700-fold. It is not known if these fluorescent changes sense onlyone of the N-terminal Ca2+ binding sites or if both sites nowbind Ca2+ with a similar affinity in the presence of TnI. The Hill
coefficients for the TnCT54C,C101SIAANS –TnI and TnCT54C,C101S
MIANS –TnIcomplexes were 1.20 ± 0.06 and 0.76 ± 0.06, respectively, whichmight suggest these fluorescent changes were monitoring a sin-gle Ca2+ binding site. However, interpretation of Hill coefficientsbased on fluorescence changes as a measure of number of Ca2+binding sites or cooperativity must be taken with caution (Valen-
cia et al., 2003). In any regard, the fluorescence of TnCT54C,C101SIAANS
and TnCT54C,C101SMIANS were sensitive to Ca2+ binding in the presence
and absence of TnI and appeared to report the Ca2+ binding prop-erties of the N-terminal regulatory domain of TnC. Even thoughthe fluorescent probes are located on the N-terminal domain ofTnC, it may be that these apparent N-terminal Ca2+ affinities areaffected by Ca2+ binding or Mg2+ exchange with the C-terminalEF-hands of TnC.
COMPARISON OF THE CALCIUM DEPENDENCE OF SKELETAL MUSCLEFORCE GENERATION BY NATIVE AND TnC RECONSTITUTED FIBERSBefore the kinetics of Ca2+ dissociation from TnCT54C,C101S
IAANS wasaddressed, we verified that this TnC construct was biologically
active. TnCT54C,C101S and TnCT54C,C101SIAANS were individually recon-
stituted into single, rabbit skinned psoas fibers to test the biologicalfunction, force versus pCa relationship (Figure 3). The endoge-nous TnC (TnCEndog) fibers exhibited a Ca2+ dependent increasein force development with a [Ca2+]50 of 1.1 ± 0.1 μM and a Hillcoefficient of 3.5 ± 0.8 (Figure 3). After TnCEndog extraction, theaverage force generated by the single skinned muscle fibers was
www.frontiersin.org October 2011 | Volume 2 | Article 70 | 5

Little et al. Myofibrillar TnC Ca2+ dissociation rates
FIGURE 3 | Comparison of the calcium dependence of skeletal muscle
force generation by native andTnC reconstituted fibers. The Ca2+
dependence of isometric force generation in native (� TnCEndog) singlerabbit skinned psoas fibers is compared to that of fibers reconstituted withTnCT54C,C101S (•) or TnCT54C,C101S
IAANS (�) as a function of pCa. The experimentalconditions are described in “Experimental Procedures.” Each data pointrepresents the mean ± SE from at least four separate fibers individuallynormalized and fit with a logistic sigmoid function mathematicallyequivalent to the Hill equation. The inset shows the phase contrast (top ofpaired panels) and IAANS or MIANS fluorescence (bottom of paired panels)images obtained from representative rigor psoas myofibrils reconstitutedwith TnCT54C,C101S
IAANS or TnCT54C,C101SMIANS . The vertical lines designate the location of
the Z-lines, and the horizontal lines designate the location of the A bands.
3 ± 2% of the maximal force (data not shown). Subsequent recon-stitution of the muscle fibers with TnCT54C,C101S or TnCT54C,C101S
IAANSrecovered 90 ± 7 or 87 ± 6% of the maximal force at pCa 4, respec-tively. Figure 3 demonstrates that the Ca2+ dependence of force
development controlled by TnCT54C,C101S or TnCT54C,C101SIAANS was
similar to that controlled by TnCEndog. Furthermore, the inset
of Figure 3 demonstrates that TnCT54C,C101SIAANS or TnCT54C,C101S
MIANSincorporated into isolated myofibrils and that their fluorescenceoriginated from the location of the thin filaments. Thus, both
TnCT54C,C101S and TnCT54C,C101SIAANS possessed nearly identical bio-
logical activity to that observed for TnCEndog judged by the Ca2+sensitivity of force development and extent of force recovery.
COMPARISON OF CALCIUM DISSOCIATION KINETICS FROM ISOLATEDTNCT54C,C101S
IAANS , TnCT54C,C101S, AND TNCT54C,C101SMIANS
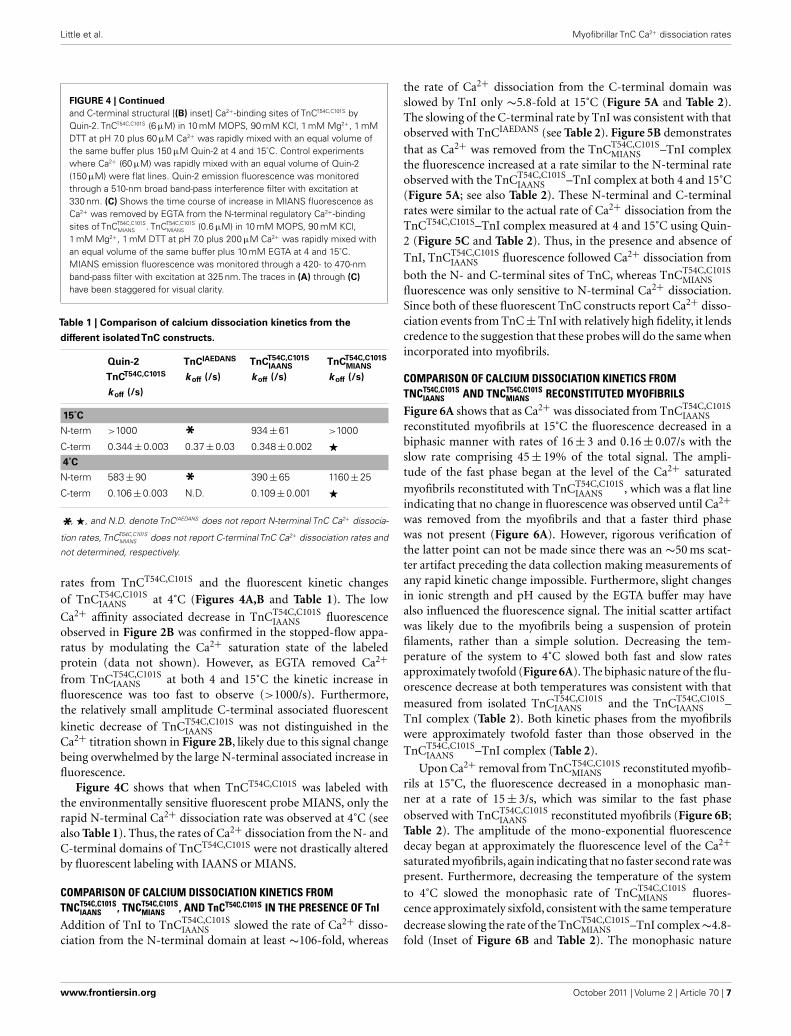
Figure 4A shows that as Ca2+ dissociated from isolated
TnCT54C,C101SIAANS at 15˚C, its fluorescence decreased in a biphasic
manner with rates of 934 ± 61 and 0.348 ± 0.002/s, with the slowrate comprising only ∼5 ± 1% of the total signal. Figure 4B showsthat this biphasic fluorescence decrease corresponded to that ofthe fast rate being associated with Ca2+ dissociation from atleast one of the N-terminal sites (>1000/s) and the slow ratebeing associated with Ca2+ dissociation from the C-terminalsites (0.344 ± 0.003/s) as measured from unlabeled TnCT54C,C101S
using Quin-2 (data summarized in Table 1). A similar conclusionwas reached upon comparison of the Quin-2 Ca2+ dissociation
FIGURE 4 | Comparison of calcium dissociation kinetics from isolated
TnCT54C,C101S
IAANS, TnCT54C,C101S, andTnC
T54C,C101S
MIANS. (A) Shows the time course of
decrease in IAANS fluorescence as Ca2+ was removed by EGTA from theN-terminal regulatory and C-terminal structural [(A) inset] Ca2+-binding sitesof TnCT54C,C101S
IAANS . TnCT54C,C101SIAANS (0.6 μM) in 10 mM MOPS, 90 mM KCl, 1 mM
Mg2+, 1 mM DTT at pH 7.0 plus 200 μM Ca2+ was rapidly mixed with anequal volume of the same buffer plus 10 mM EGTA at 4 and 15˚C. IAANSemission fluorescence was monitored through a 420- to 470-nm band-passfilter with excitation at 330 nm. (B) Shows the time course of increase inQuin-2 fluorescence as Ca2+ was removed from the N-terminal regulatory
(Continued)
Frontiers in Physiology | Striated Muscle Physiology October 2011 | Volume 2 | Article 70 | 6
Little et al. Myofibrillar TnC Ca2+ dissociation rates
FIGURE 4 | Continued
and C-terminal structural [(B) inset] Ca2+-binding sites of TnCT54C,C101S byQuin-2. TnCT54C,C101S (6 μM) in 10 mM MOPS, 90 mM KCl, 1 mM Mg2+, 1 mMDTT at pH 7.0 plus 60 μM Ca2+ was rapidly mixed with an equal volume ofthe same buffer plus 150 μM Quin-2 at 4 and 15˚C. Control experimentswhere Ca2+ (60 μM) was rapidly mixed with an equal volume of Quin-2(150 μM) were flat lines. Quin-2 emission fluorescence was monitoredthrough a 510-nm broad band-pass interference filter with excitation at330 nm. (C) Shows the time course of increase in MIANS fluorescence asCa2+ was removed by EGTA from the N-terminal regulatory Ca2+-bindingsites of TnCT54C,C101S
MIANS . TnCT54C,C101SMIANS (0.6 μM) in 10 mM MOPS, 90 mM KCl,
1 mM Mg2+, 1 mM DTT at pH 7.0 plus 200 μM Ca2+ was rapidly mixed withan equal volume of the same buffer plus 10 mM EGTA at 4 and 15˚C.MIANS emission fluorescence was monitored through a 420- to 470-nmband-pass filter with excitation at 325 nm. The traces in (A) through (C)
have been staggered for visual clarity.
Table 1 | Comparison of calcium dissociation kinetics from the
different isolatedTnC constructs.
Quin-2
TnCT54C,C101S
koff (/s)
TnCIAEDANS
koff (/s)
TnCT54C,C101SIAANS
koff (/s)
TnCT54C,C101SMIANS
koff (/s)
15˚C
N-term >1000 * 934 ± 61 >1000
C-term 0.344 ± 0.003 0.37 ± 0.03 0.348 ± 0.002 �4˚C
N-term 583 ± 90 * 390 ± 65 1160 ± 25
C-term 0.106 ± 0.003 N.D. 0.109 ± 0.001 �
*, �, and N.D. denote TnCIAEDANS does not report N-terminal TnC Ca2+ dissocia-
tion rates, TnCT54C,C101SMIANS does not report C-terminal TnC Ca2+ dissociation rates and
not determined, respectively.
rates from TnCT54C,C101S and the fluorescent kinetic changes
of TnCT54C,C101SIAANS at 4˚C (Figures 4A,B and Table 1). The low
Ca2+ affinity associated decrease in TnCT54C,C101SIAANS fluorescence
observed in Figure 2B was confirmed in the stopped-flow appa-ratus by modulating the Ca2+ saturation state of the labeledprotein (data not shown). However, as EGTA removed Ca2+from TnCT54C,C101S
IAANS at both 4 and 15˚C the kinetic increase influorescence was too fast to observe (>1000/s). Furthermore,the relatively small amplitude C-terminal associated fluorescent
kinetic decrease of TnCT54C,C101SIAANS was not distinguished in the
Ca2+ titration shown in Figure 2B, likely due to this signal changebeing overwhelmed by the large N-terminal associated increase influorescence.
Figure 4C shows that when TnCT54C,C101S was labeled withthe environmentally sensitive fluorescent probe MIANS, only therapid N-terminal Ca2+ dissociation rate was observed at 4˚C (seealso Table 1). Thus, the rates of Ca2+ dissociation from the N- andC-terminal domains of TnCT54C,C101S were not drastically alteredby fluorescent labeling with IAANS or MIANS.
COMPARISON OF CALCIUM DISSOCIATION KINETICS FROMTNCT54C,C101S
IAANS , TNCT54C,C101SMIANS , AND TnCT54C,C101S IN THE PRESENCE OF TnI
Addition of TnI to TnCT54C,C101SIAANS slowed the rate of Ca2+ disso-
ciation from the N-terminal domain at least ∼106-fold, whereas
the rate of Ca2+ dissociation from the C-terminal domain wasslowed by TnI only ∼5.8-fold at 15˚C (Figure 5A and Table 2).The slowing of the C-terminal rate by TnI was consistent with thatobserved with TnCIAEDANS (see Table 2). Figure 5B demonstrates
that as Ca2+ was removed from the TnCT54C,C101SMIANS –TnI complex
the fluorescence increased at a rate similar to the N-terminal rateobserved with the TnCT54C,C101S
IAANS –TnI complex at both 4 and 15˚C(Figure 5A; see also Table 2). These N-terminal and C-terminalrates were similar to the actual rate of Ca2+ dissociation from theTnCT54C,C101S–TnI complex measured at 4 and 15˚C using Quin-2 (Figure 5C and Table 2). Thus, in the presence and absence of
TnI, TnCT54C,C101SIAANS fluorescence followed Ca2+ dissociation from
both the N- and C-terminal sites of TnC, whereas TnCT54C,C101SMIANS
fluorescence was only sensitive to N-terminal Ca2+ dissociation.Since both of these fluorescent TnC constructs report Ca2+ disso-ciation events from TnC ± TnI with relatively high fidelity, it lendscredence to the suggestion that these probes will do the same whenincorporated into myofibrils.
COMPARISON OF CALCIUM DISSOCIATION KINETICS FROMTNCT54C,C101S
IAANS AND TNCT54C,C101SMIANS RECONSTITUTED MYOFIBRILS
Figure 6A shows that as Ca2+ was dissociated from TnCT54C,C101SIAANS
reconstituted myofibrils at 15˚C the fluorescence decreased in abiphasic manner with rates of 16 ± 3 and 0.16 ± 0.07/s with theslow rate comprising 45 ± 19% of the total signal. The ampli-tude of the fast phase began at the level of the Ca2+ saturated
myofibrils reconstituted with TnCT54C,C101SIAANS , which was a flat line
indicating that no change in fluorescence was observed until Ca2+was removed from the myofibrils and that a faster third phasewas not present (Figure 6A). However, rigorous verification ofthe latter point can not be made since there was an ∼50 ms scat-ter artifact preceding the data collection making measurements ofany rapid kinetic change impossible. Furthermore, slight changesin ionic strength and pH caused by the EGTA buffer may havealso influenced the fluorescence signal. The initial scatter artifactwas likely due to the myofibrils being a suspension of proteinfilaments, rather than a simple solution. Decreasing the tem-perature of the system to 4˚C slowed both fast and slow ratesapproximately twofold (Figure 6A). The biphasic nature of the flu-orescence decrease at both temperatures was consistent with thatmeasured from isolated TnCT54C,C101S
IAANS and the TnCT54C,C101SIAANS –
TnI complex (Table 2). Both kinetic phases from the myofibrilswere approximately twofold faster than those observed in the
TnCT54C,C101SIAANS –TnI complex (Table 2).
Upon Ca2+ removal from TnCT54C,C101SMIANS reconstituted myofib-
rils at 15˚C, the fluorescence decreased in a monophasic man-ner at a rate of 15 ± 3/s, which was similar to the fast phaseobserved with TnCT54C,C101S
IAANS reconstituted myofibrils (Figure 6B;Table 2). The amplitude of the mono-exponential fluorescencedecay began at approximately the fluorescence level of the Ca2+saturated myofibrils, again indicating that no faster second rate waspresent. Furthermore, decreasing the temperature of the system
to 4˚C slowed the monophasic rate of TnCT54C,C101SMIANS fluores-
cence approximately sixfold, consistent with the same temperature
decrease slowing the rate of the TnCT54C,C101SMIANS –TnI complex ∼4.8-
fold (Inset of Figure 6B and Table 2). The monophasic nature
www.frontiersin.org October 2011 | Volume 2 | Article 70 | 7

Little et al. Myofibrillar TnC Ca2+ dissociation rates
Table 2 | Comparison of calcium dissociation kinetics from the differentTnC constructs in the presence ofTnI and myofibrils.
TnC–TnI complex In myofibrils
Quin-2TnCT54C,C101S
koff (/s)
TnCIAEDANS
koff (/s)
TnCT54C,C101SIAANS
koff (/s)
TnCT54C,C101SMIANS
koff (/s)
TnCIAEDANS
koff (/s)
TnCT54C,C101SIAANS
koff (/s)
TnCT54C,C101SMIANS
koff (/s)
15˚C
N-term 11.1 ± 0.7 * 8.8 ± 0.4 7.4 ± 0.5 * 16 ± 3 15 ± 3
C-term 0.123 ± 0.004 0.07 ± 0.01 0.06 ± 0.01 � 0.07 ± 0.02 0.16 ± 0.07 �4˚C
N-term 2.27 ± 0.06 * 1.9 ± 0.2 1.53 ± 0.07 * 8 ± 2 2.5 ± 0.9
C-term 0.055 ± 0.009 N.D. 0.038 ± 0.004 � N.D. 0.07 ± 0.01 �
*, �, and N.D. denote TnCIAEDANS does not report N-terminal TnC Ca2+ dissociation rates, TnCT54C,C101SMIANS does not report C-terminal TnC Ca2+ dissociation rates and not
determined, respectively.
of the fluorescence decrease at both temperatures was consis-tent with that measured from isolated TnCT54C,C101S
MIANS and the
TnCT54C,C101SMIANS –TnI complex (Table 2). At 15˚C, the myofibril
kinetic rate was approximately twofold faster than that measured
from the TnCT54C,C101SMIANS –TnI complex, whereas at 4˚C the two
rates were nearly identical (Table 2). Thus, in the reconstituted
myofibrils, TnCT54C,C101SIAANS fluorescence followed Ca2+ dissocia-
tion from both the N- and C-terminal sites of TnC, whereasTnCT54C,C101S
MIANS and TnCIAEDANS fluorescence was only sensitiveto N- and C-terminal Ca2+ dissociation, respectively.
It was not possible to determine the actual Ca2+ dissociationrates from TnC in the myofibrils using Quin-2. Quin-2 reportedmultiple rates from the myofibrils ranging from 400 to 0.04/s (datanot shown). Accurate estimates of the different rates measured byQuin-2 were not feasible due to the complexity of the fluorescentsignal. Not surprisingly, the data suggests there are additional Ca2+binding proteins in the myofibril besides TnC from which Quin-2non-discriminately removed Ca2+. Consistent with this interpre-tation, electron probe X-ray microanalysis of Ca2+ binding toskeletal fibers at high [Ca2+]free ((pCa 5.5) showed Ca2+ bind-ing to the thin filaments (TnC), thick filaments (possibly myosinlight chains), and M-lines (unknown origin; Cantino et al., 1993,1998).
All the myofibril experiments in this study were performedunder rigor conditions. The addition of ATP (1 mM) to themyofibrils in the presence of Ca2+ caused the myofibrils to irre-versibly hypercontract (under a light microscope the myofibrilsshortened so extensively that they were almost not visible – datanot shown). The strong cross-bridge inhibitors, BDM (up to20 mM) and BTS (up to 200 μM), were able to inhibit the hyper-contraction of the myofibrils in the presence of Ca2+ and ATP, butthe myofibrils still significantly shortened and aggregated (data notshown). Since these myofibrils were not under any passive force,it might be that dissociation of rigor cross-bridges or cycling ofonly a few active cross-bridges cause shortening of the myofib-rils. Alternatively, these compounds may block the cross-bridgecycle at a step that occurs only after the power stroke (Shawet al., 2003). In any regard, it is unknown why the myofibrilsshorten and aggregate in the presence of the strong cross-bridgeinhibitors.
DISCUSSIONSince it was not possible to distinguish the true rate of Ca2+ dis-sociation from TnC in the myofibrils using Quin-2 (due to thepresence of numerous other Ca2+ binding proteins contaminatingthe signal), a fluorescent TnC had to be utilized. There are alwaysconcerns that intrinsic or extrinsic labeling of a protein will sub-stantially modify the parameter one wants to measure. This wasdefinitely the case for measuring the Ca2+ sensitivity and rate ofCa2+ dissociation from isolated TnCF29W, which increased theKd(Ca) approximately sixfold and slowed the rate of Ca2+ disso-ciation from the N-terminal regulatory domain of TnC > 3-foldcompared to wild type TnC (Davis et al., 2002; Valencia et al.,2003). However, the rate of Ca2+ dissociation from the N-terminalregulatory domain of the TnCF29W–TnI complex was nearly iden-tical to that of the wild type complex (Davis et al., 2002). Thus,the F29W mutation affected the rate of Ca2+ dissociation fromTnC in isolation, but not when complexed with TnI or its peptide,TnI96–148 (Davis et al., 2002, 2004).
The evidence that the extrinsically labeled IAEDANS, IAANS,and MIANS TnC moieties accurately report Ca2+ dissociationfrom the structural and regulatory domains of TnC in isolationand in the TnC–TnI complex is as follows: (1) the structuralchanges reported by the fluorescent TnCs occurred at the N-and C-terminal Ca2+ dissociation rates in isolation and in theTnC–TnI complex as verified by Quin-2 from the unlabeled TnCconstructs; (2) the different fluorescent TnCs reported similarkinetic changes from the N- and C-terminal domains of TnC inisolation and in the TnC–TnI complex; (3) the Ca2+ dependentfluorescence changes in isolated TnCT54C,C101S
IAANS and TnCT54C,C101SMIANS
were consistent with sequential Ca2+ binding as observed withwild type TnC (Li et al., 1995; Pearlstone et al., 2000; Valencia et al.,
2003); and (4) the Ca2+ sensitivities of the TnCT54C,C101SIAANS –TnI
and TnCT54C,C101SMIANS –TnI complexes were within the range reported
for the TnCF29W–TnI96–148 complex (Davis et al., 2002, 2004),TnCF29W–TnI complex, and TnC–TnI complexes (containingdifferent fluorescent TnIs; Oliveira and Reinach, 2003).
The circumstantial evidence that the extrinsically labeled fluo-rescent TnC moieties accurately report Ca2+ dissociation from thestructural and regulatory domains of TnC in the myofibrils is asfollows: (1) the different fluorescent probes accurately reported the
Frontiers in Physiology | Striated Muscle Physiology October 2011 | Volume 2 | Article 70 | 8

Little et al. Myofibrillar TnC Ca2+ dissociation rates
FIGURE 5 | Comparison of calcium dissociation kinetics from
TnCT54C,C101S
IAANS, TnC
T54C,C101S
MIANS, andTnCT54C,C101S in the presence ofTnI. (A) Shows
the time course of increase in IAANS fluorescence as Ca2+ was removed byEGTA from the N-terminal regulatory and C-terminal structural Ca2+-bindingsites of the TnCT54C,C101S
IAANS –TnI complex. TnCT54C,C101SIAANS (0.6 μM) plus TnI (1.2 μM)
in 10 mM MOPS, 90 mM KCl, 1 mM Mg2+, 1 mM DTT at pH 7.0 plus200 μM Ca2+ was rapidly mixed with an equal volume of the same bufferplus 10 mM EGTA at 4 and 15˚C. IAANS emission fluorescence wasmonitored as described in the legend of Figure 4A. (B) Shows the timecourse of increase in MIANS fluorescence as Ca2+ was removed by EGTA
(Continued )
FIGURE 5 | Continued
from the N-terminal regulatory Ca2+-binding sites of the TnCT54C,C101SMIANS –TnI
complex. TnCT54C,C101SMIANS (0.6 μM) plus TnI (1.2 μM) in 10 mM MOPS, 90 mM
KCl, 1 mM Mg2+, 1 mM DTT at pH 7.0 plus 200 μM Ca2+ was rapidly mixedwith an equal volume of the same buffer plus 10 mM EGTA at 4 and 15˚C.MIANS emission fluorescence was monitored as described in the legend ofFigure 4C. (C) Shows the time course of increase in Quin-2 fluorescenceas Ca2+ was removed from the N-terminal regulatory [(C) inset showsexpanded 15˚C trace] and C-terminal structural Ca2+-binding sites of theTnCT54C,C101S–TnI complex by Quin-2. TnCT54C,C101S (6 μM) plus TnI (9 μM) in10 mM MOPS, 90 mM KCl, 1 mM Mg2+, 1 mM DTT at pH 7.0 plus ∼30 μMCa2+ was rapidly mixed with an equal volume of the same buffer plus150 μM Quin-2 at 4 and 15˚C. Control experiments where Ca2+ (30 μM) wasrapidly mixed with an equal volume of Quin-2 (150 μM) were flat lines.Quin-2 emission fluorescence was monitored as described in the legend ofFigure 4B. The traces in (A) through (C) have been staggered for visualclarity.
Ca2+ binding and dissociation rates in isolation and the TnC–TnIcomplex (see above); (2) the different fluorescent TnCs reportedsimilar kinetic changes from the N- and C-terminal domains ofTnC in the myofibrils; (3) decreasing the experimental temper-ature had quantitatively similar effects on the kinetics measuredfrom the TnC–TnI complexes and from the myofibrils; and (4)
TnCT54C,C101S and TnCT54C,C101SIAANS recovered near maximal forces
with similar [Ca2+]50 and Hill coefficients as observed with theendogenous fibers.
The Ca2+ dissociation rate from TnCIAEDANS supported thehypothesis that the rate of Ca2+ dissociation from the C-terminalstructural domain of TnC in the myofibrils, and presumably mus-cle, is too slow to control relaxation. However, TnCIAEDANS fluo-rescence did not report the N-terminal regulatory domain Ca2+kinetics. This fluorescent TnC did allow us to have confidence thatTnCT54C,C101S
IAANS was at least measuring the C-terminal structuraldomain Ca2+ dissociation events with relatively high fidelity inthe myofibrils.
The similarity of the N-terminal Ca2+ dissociation rates mea-
sured with TnCT54C,C101SIAANS and TnCT54C,C101S
MIANS in the myofibrils isimportant considering that MIANS only reported the N-terminalstructural changes. It may be that MIANS is a slightly less envi-ronmentally sensitive probe compared to IAANS, so that eventhough the same structural changes occur in both systems, onlyIAANS was able to measure the C-terminal associated events. In all,TnCT54C,C101S
MIANS appeared to have the highest fidelity of N-terminalCa2+ dissociation kinetics across the systems studied as comparedto the wild type (Davis et al., 2002) and unlabeled systems. Further-
more, TnCT54C,C101SMIANS reported N-terminal Ca2+ dissociation rates
in the myofibrils at 4 and 15˚C that were close to those observed
from the TnCT54C,C101SMIANS –TnI complex. These results support the
hypothesis that the TnC–TnI complex is the simplest biochemicalmodel system for Ca2+ dissociation from TnC in skeletal muscle(Davis et al., 2002, 2004).
The reason for the approximately twofold faster rates of Ca2+dissociation from the regulatory N-domain of TnCT54C,C101S
IAANS and
TnCT54C,C101SMIANS at 15˚C in the reconstituted myofibrils as compared
to their respective TnC–TnI complexes is not known. It may bethat addition of troponin T (TnT) to the TnC–TnI complex may
www.frontiersin.org October 2011 | Volume 2 | Article 70 | 9

Little et al. Myofibrillar TnC Ca2+ dissociation rates
FIGURE 6 | Comparison of calcium dissociation kinetics from
TnCT54C,C101S
IAANSandTnC
T54C,C101S
MIANSreconstituted myofibrils. (A) Shows the time
course of decrease in IAANS fluorescence as Ca2+ was removed by EGTAfrom the N-terminal regulatory and C-terminal structural Ca2+-binding sitesof TnCT54C,C101S
IAANS reconstituted rigor rabbit psoas myofibrils. ∼1 mg/mlTnCT54C,C101S
IAANS reconstituted myofibrils in 10 mM MOPS, 90 mM KCl, 1 mMMg2+, 1 mM DTT, 0.02% Tween-20 at pH 7.0 plus 200 μM Ca2+ was rapidlymixed with an equal volume of the same buffer plus 10 mM EGTA at 4 and15˚C. The flat line represents the 15˚C fluorescence level of Ca2+ saturatedmyofibrils in which EGTA in the second syringe was replaced with 200 μMCa2+. IAANS emission fluorescence was monitored as described in thelegend of Figure 4A. (B) Shows the time course of decrease in MIANSfluorescence as Ca2+ was removed by EGTA from the N-terminal regulatoryCa2+-binding sites of TnCT54C,C101S
MIANS reconstituted rigor rabbit psoas myofibrils.∼1 mg/ml TnCT54C,C101S
MIANS reconstituted myofibrils in 10 mM MOPS, 90 mM KCl,1 mM Mg2+, 1 mM DTT, 0.02% Tween-20 at pH 7.0 plus 200 μM Ca2+ wasrapidly mixed with an equal volume of the same buffer plus 10 mM EGTA at4 [(B) inset] and 15˚C. MIANS emission fluorescence was monitored asdescribed in the legend of Figure 4C. The 4˚C trace in (A) has beenstaggered for visual clarity.
slightly increase the rate of Ca2+ dissociation from the regulatoryN-domain of TnC as was observed with the human slow skeletalTn system (Gomes et al., 2004). Alternatively, other thin filamentproteins such as actin and tropomyosin may also modulate the rateof Ca2+ dissociation from Tn in the myofibril. Consistent with thishypothesis, a thin filament system reconstituted with fluorescentlylabeled IANBD skeletal Tn (primarily labeled on TnI) exhibited an
∼10-fold faster rate of structural change as Ca2+ dissociated fromthe regulatory domain of TnC as compared to the isolated fluo-rescent Tn (Rosenfeld and Taylor, 1985). Interestingly, the samepaper showed that addition of myosin subfragment 1 to the thinfilament system in the absence of ATP decreased the rate of struc-tural change as Ca2+ dissociated from the N-terminal regulatorydomain of TnC ∼10-fold, back to that of the labeled Tn com-plex. The rate of structural change as Ca2+ dissociated from theN-terminal regulatory domain of TnC on the thin filaments inthe presence of myosin subfragment 1 (∼1.6 and 15–20/s at 4 and20˚C, respectively; Rosenfeld and Taylor, 1985) is consistent withthe Ca2+ dissociation rates we observed in the rigor myofibrils at4 and 15˚C. It would appear that the structural changes in the Tncomplex are controlled by Ca2+ dissociation as was observed inFRET studies of regulated thin filaments (Shitaka et al., 2004).
However, according to the thin filament results discussed above,one would have expected biphasic N-terminal kinetics from thefluorescent TnC constructs in the myofibrils since some of thereconstituted Tn complexes are in the A-band whereas other Tncomplexes are in the I band (locations of thick and thin overlapand non-overlap, respectively). Based on thin (∼1.1 μm) and thick(∼0.8 μm) filament lengths in the half sarcomere of rabbit psoasmuscle (Morimoto and Harrington, 1973; Fowler, 1996, and ref-erences within), at a sarcomere length of ∼2.5 μm, ∼60% of thethin filaments would be overlapped by the thick filaments. Thus,nearly 40% of the thin filament would not have a rigor cross-bridgebound near a Tn complex. In this region of non-overlap Ca2+ dis-sociation from the N-terminal regulatory sites of TnC should havebeen very fast according to the thin filament study (Rosenfeld andTaylor, 1985). We can not necessarily rule out this possibility sincean ∼10-fold faster rate could not be observed in the myofibril sus-pensions due to the initial large scatter and/or mixing time artifact.However, based on the amplitude of the N-terminal rate at both 4and 15˚C in the myofibrils beginning at the Ca2+ saturated state,we do not believe this is the case. However, slight changes in ionicstrength and pH caused by the EGTA buffer may have influencedthe intensity of the fluorescence signal. Furthermore, this specu-lation does not take into account possible cooperative effects ofrigor cross-bridge binding affecting neighboring Tn, which couldpotentially slow the rate of Ca2+ dissociation from additional Tncomplexes in the non-overlap region. The existence and causeof this cooperative effect is controversial. Reported cooperativeeffects of cross-bridge binding on skeletal Tn have ranged fromnon-existent to only a few cross-bridges influencing the entirethin filament (Fuchs, 1985; Guth and Potter, 1987; Gordon et al.,2000).
Since the myofibrils significantly shortened in the presence ofCa2+ and ATP ± strong cross-bridge inhibitors, we were not ableto delineate the effect of cross-bridge binding on the rate of Ca2+dissociation from the regulatory domain of TnC. In the futureit may be possible to accomplish these experiments with ATPγSor by minimally cross-linking the myofibrils (Glyn and Sleep,1985; Kraft et al., 1999). Stretching the myofibrils beyond over-lap ± myosin subfragment 1 may also be an approach to test theeffect of cross-bride binding on Tn Ca2+ dissociation kinetics.Alternatively, it might be possible to simultaneously measure con-traction/relaxation and TnC fluorescence changes from myofibrils
Frontiers in Physiology | Striated Muscle Physiology October 2011 | Volume 2 | Article 70 | 10

Little et al. Myofibrillar TnC Ca2+ dissociation rates
mounted in force measuring devices, where sarcomere length canbe better maintained (Tesi et al., 2002; Poggesi et al., 2005).
Although different buffer conditions were utilized for the fiber,titration, and stopped-flow studies, we do not believe this to havecompromised the qualitative interpretation of our data. Consis-tent with our findings, Johnson et al., 1997 and references within)demonstrated that the rate of relaxation from intact frog skeletalmuscle fibers (∼27/s) was nearly identical to that of the rate ofCa2+ dissociation from a fluorescently labeled skeletal TnIAANS
complex (labeled on TnI) in solution at 20˚C. This paper alsodemonstrated that as the rate of the Ca2+ transient decay wasincreased (with only marginal decreases in peak amplitude), therelaxation kinetics plateaued at a rate (∼9/s) again nearly identicalto that of the Ca2+ dissociation rate from the N-terminal regula-tory domain of TnIAANS at 10˚C. Mathematical modeling of Ca2+spark dynamics, also measured in frog skeletal muscle at 18˚C,suggested that Ca2+ dissociates at ∼13/s from the N-terminal reg-ulatory domain of TnC (Baylor et al., 2002). Furthermore, we haveshown that relaxation of rabbit psoas fibers was slowed approxi-mately twofold at 15˚C by reconstitution of the fibers with a TnCmutant that had a quantitatively slowed rate of Ca2+ dissociationfrom the N-terminal regulatory domain of the TnC–TnI complex(Luo et al., 2002; Davis et al., 2004). All of these studies demon-strate that the rate of Ca2+ dissociation from the N-terminalregulatory domain of TnC in muscle is similar to that measured inthe myofibrils. Thus, the rate of Ca2+ dissociation from TnC mayinfluence the kinetics of skeletal muscle relaxation.
There are a diverse group of skeletal myopathies that typicallymanifest as muscle weakness (Ochala, 2008). Mutations in severalthin filament proteins including, actin, tropomyosin, TnI, and TnT
have been linked to these skeletal muscle diseases. Many of the pro-tein modifications alter the Ca2+ sensitivity of force development(Michele and Metzger, 2000; Robinson et al., 2007). Although notknown, these modifications may alter the rate of Ca2+ dissoci-ation from TnC. This effect may be more significant for slowmuscle where force development is more dependent on motor-unit recruitment and much less so on increasing its low frequencyof motor-unit firing (Fruend, 1983; Navarrete and Vrbová, 1983).Thus, if the rate of Ca2+ dissociation is increased in these slowfibers, the twitch may relax too quickly, leading to a decrease inforce production at any given frequency of muscle stimulation. Infact, a skeletal myopathy associated tropomyosin mutation (M9R)expressed in cardiac myocytes, accelerated relaxation (Micheleet al., 2002). These findings are similar to the effects of otherthin filament, cardiac disease related mutations that increase ordecrease the rate of cardiac muscle relaxation (Du et al., 2007,2008). Thus, the rate of Ca2+ dissociation from TnC may haveprofound effects on both skeletal and cardiac muscle physiologyand pathophysiology.
ACKNOWLEDGMENTSWe thank Dr. Lawrence Smillie for the generous gifts of thechicken fast-twitch skeletal muscle TnC plasmid and TnI proteinand Zhenyun Yang for help in preparing the myofibril samples.This research was funded, in part, by NIH grant HL091986 toDr. Jonathan P. Davis, NIH grant HL087462 to Dr. Svetlana B.Tikunova, NIH grant TL1RR025753 from the National Center ForResearch Resources to Sean C. Little, and by separate awards fromthe American Heart Association, to Dr. Jonathan P. Davis, CatalinaAlionte, and Darl R. Swartz.
REFERENCESBaylor, S. M., Hollingworth, S., and
Chandler, W. K. (2002). Compari-son of simulated and measured cal-cium sparks in intact skeletal musclefibers of the frog. J. Gen. Physiol. 120,349–368.
Cantino, M. E., Allen, T. S., and Gordon,A. M. (1993). Subsarcomeric distrib-ution of calcium in demembranatedfibers of rabbit psoas muscle. Bio-phys. J. 64, 211–222.
Cantino, M. E., Eichen, J. G., andDaniels, S. B. (1998). Distribu-tions of calcium in A and Ibands of skinned vertebrate mus-cle fibers stretched to beyond fil-ament overlap. Biophys. J. 75,948–956.
Davis, J. P., Rall, J. A., Alionte, C.,and Tikunova, S. B. (2004). Muta-tions of hydrophobic residues inthe N-terminal domain of tro-ponin C affect calcium bindingand exchange with the troponin C-troponin I96-148 complex and mus-cle force production. J. Biol. Chem.279, 17348–17360.
Davis, J. P., Rall, J. A., Reiser, P. J.,Smillie, L. B., and Tikunova, S.B. (2002). Engineering competitive
magnesium binding into the first EF-hand of skeletal troponin C. J. Biol.Chem. 277, 49716–49726.
Du, C. K., Morimoto, S., Nishi, K.,Minakami, R., Ohta, M., Tadano, N.,Lu, Q. W., Wang, Y. Y., Zhan, D. Y.,Mochizuki, M., Kita, S., Miwa, Y.,Takahashi-Yanaga, F., Iwamoto, T.,Ohtsuki, I., and Sasaquri, T. (2007).Knock-in mouse model of dilatedcardiomyopathy caused by troponinmutation. Circ. Res. 101, 185–194.
Du, J., Liu, J., Feng, H. Z., Hossain,M. M., Gobara, N., Zhang, C., Li,Y., Jean-Charles, P. Y., Jin, J. P.,and Huang, X. P. (2008). Impairedrelaxation is the main manifesta-tion in transgenic mice expressinga restrictive cardiomyopathy muta-tion, R193H, in cardiac TnI. Am.J. Physiol. Heart Circ. Physiol. 294,H2604–H2613.
Fowler,V. M. (1996). Regulation of actinfilament length in erythrocytes andstriated muscle. Curr. Opin. Cell Biol.8, 86–96.
Fruend, H. J. (1983). Motor unit andmuscle activity in voluntary motorcontrol. Physiol. Rev. 63, 387–431.
Fuchs, F. (1985). The binding of calciumto detergent-extracted rabbit psoas
muscle fibres during relaxation andforce generation. J. Muscle Res. CellMotil. 6, 477–486.
Glyn, H., and Sleep, J. (1985). Depen-dence of adenosine triphosphataseactivity of rabbit psoas muscle fibresand myofibrils on substrate con-centration. J. Physiol. (Lond.) 365,259–276.
Golosinska, K., Pearlstone, J. R.,Borgford, T., Oikawa, K., Kay, C. M.,Carpenter, M. R., and Smillie, L. B.(1991). Determination of and cor-rections to sequences of turkey andchicken troponins-C. Effects of Thr-130 to Ile mutation on Ca2+ affinity.J. Biol. Chem. 266, 15797–15809.
Gomes, A. V., Venkatraman, G., Davis, J.P., Tikunova, S. B., Engel, P., Solaro,R. J., and Potter, J. D. (2004). Car-diac troponin T isoforms affect theCa(2+) sensitivity of force devel-opment in the presence of slowskeletal troponin I: insights intothe role of troponin T isoforms inthe fetal heart. J. Biol. Chem. 279,49579–49587.
Gordon, A. M., Homsher, E., and Reg-nier, M. (2000). Regulation of con-traction in striated muscle. Physiol.Rev. 80, 853–924.
Greaser, M. L., Moss, R. L., and Reiser,P. J. (1988). Variations in contrac-tile properties of rabbit single mus-cle fibres in relation to troponin Tisoforms and myosin light chains. J.Physiol. (Lond.) 406, 85–98.
Guth, K., and Potter, J. D. (1987). Effectof rigor and cycling cross-bridgeson the structure of troponin C andon the Ca2+ affinity of the Ca2+-specific regulatory sites in skinnedrabbit psoas fibers. J. Biol. Chem.262, 13627–13635.
Houdusse, A., Love, M. L., Dominguez,R., Grabarek, Z., and Cohen, C.(1997). Structures of four Ca2+-bound troponin C at 2.0 A resolu-tion: further insights into the Ca2+-switch in the calmodulin superfam-ily. Structure 5, 1695–1711.
Johnson, J. D., Jiang, Y., and Flynn, M.(1997). Modulation of Ca2+ tran-sients and tension by intracellularEGTA in intact frog muscle fibers.Am. J. Physiol. 272, C1437–C1444.
Johnson, J. D., Nakkula, R. J., Vasulka,C., and Smillie, L. B. (1994). Mod-ulation of Ca2+ exchange with theCa(2+)-specific regulatory sites oftroponin C. J. Biol. Chem. 269,8919–8923.
www.frontiersin.org October 2011 | Volume 2 | Article 70 | 11

Little et al. Myofibrillar TnC Ca2+ dissociation rates
Johnson, J. D., Robinson, D. E., Robert-son, S. P., Schwartz, A., and Potter,J. D. (1981). “Ca2+ exchange withtroponin and the regulation of mus-cle contraction,” in The Regulationof Muscle Contraction Excitation-Contraction Coupling, eds A. D.Grinnell and M. A. B. Brazier (NewYork, NY: Academic Press), 241–259.
Kraft, T., Xu, S., Brenner, B., and Yu,L. C. (1999). The effect of thinfilament activation on the attach-ment of weak binding cross-bridges:a two-dimensional x-ray diffractionstudy on single muscle fibers. Bio-phys. J. 76, 1494–1513.
Kreutziger, K. L., Piroddi, N., Scellini, B.,Tesi, C., Poggesi, C., and Regnier, M.(2008). Thin filament Ca2+ bind-ing properties and regulatory unitinteractions alter kinetics of tensiondevelopment and relaxation in rab-bit skeletal muscle. J. Physiol. (Lond.)586, 3683–3700.
Lee, R. S., Tikunova, S. B., Kline, K. P.,Zot, H. G., Hasbun, J. E., Minh, N. V.,Swartz, D. R., Rall, J. A., and Davis,J. P. (2010). Effect of Ca2+ bind-ing properties on the rate of skele-tal muscle force redevelopment. Am.J. Physiol. Cell Physiol. 299, C1091–C1099.
Li, M. X., Chandra, M., Pearlstone, J.R., Racher, K. I., Trigo-Gonzalez, G.,Borgford, T., Kay, C. M., and Smil-lie, L. B. (1994). Properties of iso-lated recombinant N and C domainsof chicken troponin C. Biochemistry33, 917–925.
Li, M. X., Gagne, S. M., Tsuda, S., Kay,C. M., Smillie, L. B., and Sykes,B. D. (1995). Calcium binding tothe regulatory N-domain of skele-tal muscle troponin C occurs in astepwise manner. Biochemistry 34,8330–8340.
Luo, Y., Davis, J. P., Smillie, L. B., andRall, J. A. (2002). Determinants ofrelaxation rate in rabbit skinnedskeletal muscle fibres. J. Physiol.(Lond.) 545, 887–901.
Martyn, D. A., Freitag, C. J., Chase, P.B., and Gordon, A. M. (1999). Ca2+and cross-bridge-induced changesin troponin C in skinned skeletalmuscle fibers: effects of force inhi-bition. Biophys. J. 76, 1480–1493.
Metzger, J. M., Greaser, M. L., andMoss, R. L. (1989). Variations incross-bridge attachment rate andtension with phosphorylation ofmyosin in mammalian skinned
skeletal muscle fibers. Implicationsfor twitch potentiation in intactmuscle. J. Gen. Physiol. 93, 855–883.
Michele, D. E., Coutu, P., and Metzger,J. M. (2002). Divergent abnormalmuscle relaxation by hypertrophiccardiomyopathy and nemalinemyopathy mutant tropomyosins.Physiol. Genomics 9, 103–111.
Michele, D. E., and Metzger, J. M.(2000). Physiological consequencesof tropomyosin mutations asso-ciated with cardiac and skele-tal myopathies. J. Mol. Med. 78,543–553.
Morano, I., and Ruegg, J. C. (1991).What does TnCDANZ fluorescencereveal about the thin filament state?Pflugers Arch. 418, 333–337.
Morimoto, K., and Harrington, W. F.(1973). Isolation and composition ofthick filaments from rabbit skeletalmuscle. J. Mol. Biol. 77, 165–175.
Navarrete, R., and Vrbová, G. (1983).Changes of activity patterns in slowand fast muscles during postna-tal development. Dev. Brain Res. 8,11–19.
Norman, C., Rall, J. A., Tikunova, S. B.,and Davis, J. P. (2007). Modulationof the rate of cardiac muscle contrac-tion by troponin C constructs withvarious calcium binding affinities.Am. J. Physiol. Heart Circ. Physiol.293, H2580–H2587.
Ochala, J. (2008). Thin filament proteinsmutations associated with skeletalmyopathies: defective regulation ofmuscle contraction. J. Mol. Med. 86,1197–1204.
Oliveira, D. C., and Reinach, F. C.(2003). The calcium-induced switchin the troponin complex probed byfluorescent mutants of troponin I.Eur. J. Biochem. 270, 2937–2944.
Pearlstone, J. R., Chandra, M., Soren-son, M. M., and Smillie, L. B. (2000).Biological function and site II Ca2+-induced opening of the regulatorydomain of skeletal troponin C areimpaired by invariant site I or IIGlu mutations. J. Biol. Chem. 275,35106–35115.
Poggesi, C., Tesi, C., and Stehle, R.(2005). Sarcomeric determinants ofstriated muscle relaxation kinetics.Pflugers Arch. 449, 505–517.
Ramos, C. H. (1999). Mapping subdo-mains in the C-terminal region oftroponin I involved in its binding totroponin C and to thin filament. J.Biol. Chem. 274, 18189–18195.
Robertson, S. P., and Potter, J. D. (1984).The regulation of free calcium ionconcentration by metal chelators.Meth. Pharmacol. 5, 63–75.
Robinson, P., Lipscomb, S., Preston, L.C., Altin, E., Watkins, H., Ashley,C. C., and Redwood, C. S. (2007).Mutations in fast skeletal troponinI, troponin T, and beta-tropomyosinthat cause distal arthrogryposis allincrease contractile function. FASEBJ. 21, 896–905.
Rosenfeld,S. S., and Taylor,E. W. (1985).Kinetic studies of calcium binding toregulatory complexes from skeletalmuscle. J. Biol. Chem. 260, 252–261.
Satyshur, K. A., Pyzalska, D., Greaser, M.,Rao, S. T., and Sundaralingam, M.(1994). Structure of chicken skele-tal muscle troponin C at 1.78 Aresolution. Acta Crystallogr. D Biol.Crystallogr. 50, 40–49.
Sayle, R. A., and Milner-White, E.J. (1995). RasMol: biomoleculargraphics for all. Trends Biochem. Sci.20, 374–376.
Shaw, M. A., Ostap, E. M., and Goldman,Y. E. (2003). Mechanism of inhibi-tion of skeletal muscle actomyosinby N-benzyl-p-toluenesulfonamide.Biochemistry 42, 6128–6135.
Shitaka, Y., Kimura, C., Iio, T., and Miki,M. (2004). Kinetics of the struc-tural transition of muscle thin fila-ments observed by fluorescence res-onance energy transfer. Biochemistry43, 10739–10747.
Shitaka, Y., Kimura, C., and Miki, M.(2005). The rates of switching move-ment of troponin T between threestates of skeletal muscle thin fila-ments determined by fluorescenceresonance energy transfer. J. Biol.Chem. 280, 2613–2619.
Stephenson, D. G., and Williams, D.A. (1981). Calcium-activated forceresponses in fast- and slow-twitchskinned muscle fibers of the ratat different temperatures. J. Physiol.(Lond.) 317, 281–302.
Swartz, D. R., Moss, R. L., and Greaser,M. L. (1997). Characteristics of tro-ponin C binding to the myofibrillarthin filament: extraction of troponinC is not random along the lengthof the thin filament. Biophys. J. 73,293–305.
Tesi, C., Piroddi, N., Colomo, F., andPoggesi, C. (2002). Relaxation kinet-ics following sudden Ca(2+) reduc-tion in single myofibrils from skele-tal muscle. Biophys. J. 83, 2142–2151.
Tikunova, S. B., Rall, J. A., and Davis,J. P. (2002). Effect of hydrophobicresidue substitutions with glutamineon Ca(2+) binding and exchangewith the N-domain of troponin C.Biochemistry 41, 6697–6705.
Valencia, F. F., Paulucci, A. A., Quaggio,R. B., Da Silva,A. C., Farah, C. S., andReinach, F. C. (2003). Parallel mea-surement of Ca2+ binding and fluo-rescence emission upon Ca2+ titra-tion of recombinant skeletal mus-cle troponin C. Measurement ofsequential calcium binding to theregulatory sites. J. Biol. Chem. 278,11007–11014.
Vinogradova, M. V., Stone, D. B., Malan-ina, G. G., Karatzaferi, C., Cooke,R., Mendelson, R. A., and Fletterick,R. J. (2005). Ca2+-regulated struc-tural changes in troponin. Proc. Natl.Acad. Sci. U.S.A. 102, 5038–5043.
Wahr, P. A., Johnson, J. D., and Rall,J. A. (1998). Determinants of relax-ation rate in skinned frog skeletalmuscle fibers. Am. J. Physiol. 274,C1608–C1615.
Zhang, D., Yancey, K. W., and Swartz,D. R. (2000). Influence of ADPon cross-bridge-dependent activa-tion of myofibrillar thin filaments.Biophys. J. 78, 3103–3111.
Conflict of Interest Statement: Theauthors declare that the research wasconducted in the absence of anycommercial or financial relationshipsthat could be construed as a potentialconflict of interest.
Received: 31 August 2011; accepted: 19September 2011; published online: 11October 2011.Citation: Little SC, Tikunova SB, Nor-man C, Swartz DR and Davis JP (2011)Measurement of calcium dissociationrates from troponin C in rigor skele-tal myofibrils. Front. Physio. 2:70. doi:10.3389/fphys.2011.00070This article was submitted to Frontiers inStriated Muscle Physiology, a specialty ofFrontiers in Physiology.Copyright © 2011 Little, Tikunova, Nor-man, Swartz and Davis. This is an open-access article subject to a non-exclusivelicense between the authors and FrontiersMedia SA, which permits use, distribu-tion and reproduction in other forums,provided the original authors and sourceare credited and other Frontiers condi-tions are complied with.
Frontiers in Physiology | Striated Muscle Physiology October 2011 | Volume 2 | Article 70 | 12