Embed Size (px)
Citation preview
Measurement of Broiler Litter Production Rates and Nutrient ContentUsing Recycled Litter
C. D. Coufal, C. Chavez, P. R. Niemeyer, and J. B. Carey1
Department of Poultry Science, Texas A&M University, College Station 77843
ABSTRACT It is important for broiler producers toknow litter production rates and litter nutrient contentwhen developing nutrient management plans. Estimationof broiler litter production varies widely in the literaturedue to factors such as geographical region, type of hous-ing, size of broiler produced, and number of flocks rearedon the same litter. Published data for N, P, and K contentare also highly variable. In addition, few data are availableregarding the rate of production, characteristics, and nu-trient content of caked litter (cake). In this study, 18 con-secutive flocks of broilers were reared on the same litterin experimental pens under simulated commercial condi-tions. The mass of litter and cake produced was measuredafter each flock. Samples of all litter materials were ana-
Key words: broiler, litter, cake, production rate, nutrient
2006 Poultry Science 85:398–403
INTRODUCTION
Manure management and disposal are 2 of the mostimportant challenges that poultry producers face. Im-proper management of manure can lead to odor genera-tion, fly breeding, and excess nutrient loading of soil andwater resources. For broiler producers, accurate predic-tion of litter production and nutrient content is importantto properly plan for the disposal of litter materials frombroiler housing. In commercial broiler production, litteris commonly recycled for several flocks before an entireclean-out is performed. Removal and replacement of alllitter varies widely in the industry and can range from2 flocks to several years of production (Malone, 1992;Chamblee and Todd, 2002). Caked litter (cake) commonlyfound around drinkers or near evaporative cooling sys-tems is typically greater than 35% moisture (Malone etal., 1992). It is commonly mechanically separated fromthe loose litter and removed from the house after eachflock of broilers is marketed. The loose litter remains inthe house and is recycled for the next flock of birds. Thistype of litter management leads to the production of 2
2006 Poultry Science Association, Inc.Received July 1, 2005.Accepted October 23, 2005.1Corresponding author: [email protected]
398
lyzed for pH, moisture, N, P, and K. Average litter andcake moisture content were 26.4 and 46.9%, respectively.Significant variation in litter and cake nutrient contentwas observed and can largely be attributed to ambienttemperature differences. Average litter, cake, and totallitter (litter plus cake) production rates were 153.3, 74.8,and 228.2 g of dry litter material per kg of live broilerweight (g/kg) per flock, respectively. Significant variationin litter production rates among flocks was also observed.Cumulative litter, cake, and total litter production ratesafter 18 flocks were 170.3, 78.7, and 249.0 g/kg, respec-tively. The data produced from this research can be usedby broiler producers to estimate broiler litter and cakeproduction and the nutrient content of these materials.
types of litter waste materials with potentially differentcharacteristics and nutrient content. The removal of cakedlitter from broiler housing after each flock will also affectthe rate of loose litter accumulation in broiler houses.
The rate of litter production and litter nutrient contentcan be affected by many factors, including the type andamount of bedding material used, number of flocksreared on the litter, feed formulation, litter managementtechniques, type of housing, ventilation rates and man-agement, drinker management, bird health, performanceparameters, stocking density, and age at time of market(Malone, 1992). As a result, estimates of litter productionand nutrient content in published literature vary. Litterproduction data published in the peer-reviewed journalliterature also provide little information regarding theamount of cake produced during broiler production. Lit-ter production rates are most commonly reported as tonsof litter on an as-is or wet basis per 1,000 broilers. Calculat-ing litter production rates on a wet basis can introduceerror into litter production estimates because of variabil-ity in moisture content. In addition, litter production cal-culations based on numbers of birds can also contributeto variability in estimation due to variation in bird size.From commercial broiler houses in Pennsylvania, Pat-terson et al. (1998) reported considerably different ratesof litter production from 2 companies growing birds todifferent ending body weights. Farms growing smaller
at National C
hung Hsing U
niversity Library on A
pril 10, 2014http://ps.oxfordjournals.org/
Dow
nloaded from
LITTER PRODUCTION FROM BROILERS 399
birds produced litter at a rate of 1.07 tons per 1,000 broil-ers, and the farms growing larger birds produced litterat a rate of 1.65 tons per 1,000 broilers. Based on severalsources, Malone (1992) estimated average broiler litterproduction rate to be 1.0 dry metric ton per 1,000 broilersper flock with a range of 0.7 to 2.0 metric tons. Chambleeand Todd (2002) estimated broiler litter production frombroilers in Mississippi to be 1.6 tons per 1,000 broilers ifthe houses were cleaned out completely on an annualbasis, and a rate of 1 ton per 1,000 broilers if houses werecleaned out completely at the end of 2 yr. The NaturalResource, Agriculture, and Engineering Service (NRAES,1999) reported whole litter production from broilers tobe 1.25 ton per 1,000 birds with cake production at 0.4ton per 1,000 birds. Thus, in NRAES (1999) cake repre-sented 30 to 35% of the total litter. Depending on fre-quency of total house clean-out, Malone et al. (1992) re-ported that cake accounted for 35 to 40% of total litter pro-duction.
A great deal of variation exists between sources in theliterature regarding litter nutrient content. On an as-is orwet basis, Malone (1992) reported an average of 2.94, 3.22,and 2.03% for N, P2O5, and K2O, respectively, from severalsources in the United States. Patterson et al. (1998) re-ported broiler litter in Pennsylvania to have an averageN, P2O5, and K2O content of 3.73, 3.11, and 2.18%, respec-tively. Mississippi broiler litter was reported to contain2.85, 1.45, and 2.95% N, P2O5, and K2O, respectively(Chamblee and Todd, 2002). Bowers et al. (2002) reportedpine shaving litter used for 9 flocks in Alabama to contain3.11, 1.94, and 3.28% for N, P, and K, respectively. Previ-ous research has also indicated that the number of flocksreared on the litter has a substantial influence on nutrientdensities of broiler litter (Malone et al., 1992; Bowers etal., 2002; Chamblee and Todd, 2002). In addition, verylittle data were found in the literature regarding the nutri-ent content of cake. Malone et al. (1992) reported thatcake was similar in N content but was 40 to 50% lowerin P and K concentrations than loose litter on an as-isbasis. In contrast, Malone (1992) stated that cake nutrientdensity (litter used for 6 flocks) averaged 15% greaterthan litter on a dry-weight basis. Research is needed toaccurately determine the nutrient content of loose andcaked broiler litter materials.
The objectives of the current research were to 1) accu-rately measure litter and cake production rates from broil-ers reared under simulated commercial conditions overseveral consecutive flocks using recycled rice hull litter,and 2) characterize the nutrient content, moisture, andpH of the 2 types of litter materials produced.
MATERIALS AND METHODS
This experiment was conducted in 2 phases. In the firstphase, 9 flocks of broilers (flocks 1 through 9) were rearedin 4 large pens under simulated commercial conditionswithout any litter treatments or amendments. Prior toflock 10, equal amounts of litter were removed from theoriginal 4 pens and distributed evenly into 2 additional
pens in the same building. No litter was moved betweenpens again after the second phase was started (flocks 10to 18). Three of the 6 pens continued to be managed asin flocks 1 to 9 (no litter added or litter amendments) forthe continuation of this experiment. The data reportedherein are from the 4 untreated pens for flocks 1 to 9 and3 untreated pens for flocks 10 to 18. When the depth ofthe built-up litter became excessive (after flocks 13 and16), a portion of the litter was discarded during theweighing process between flocks. The mass of the dis-carded litter was recorded. Cake was removed from thepens at the end of each flock with a silage fork. Cakemass was recorded before disposal. Loose litter remainingafter cake-out was collected, weighed, and returned toeach pen and recycled for the next flock.
All materials (day-old chicks (Cobb-Vantress, SiloamSprings, AR), feed, and rice hull litter) used in this studywere obtained directly from a commercial broiler inte-grator. Broilers were reared to 40 to 42 d of age, andfeed and water were provided ad libitum. All broilermanagement practices (lighting, ventilation, supplemen-tal heating, mortality collection, etc.) and stocking densi-ties were followed as previously described in Coufal etal. (2006).
Data and sample collection procedures were followedas previously described (Coufal et al., 2006). The mass ofall birds and litter materials entering and leaving thefacility was recorded (±0.005 kg). Litter and cake pH weredetermined by mixing 3 g of litter material in 60 mL ofdeionized water and measuring with a pH meter (Model430, Corning Corporation, Corning, NY). Samples of alllitter materials were acidified with aluminum sulfate (10litter:1 Al2(SO4)3 by wet weight), dried, and analyzed fortotal N content on a dry matter basis by the proceduresdescribed in Coufal et al. (2006). Nonacidified litter andcake samples were also dried for total P and K contentanalysis. Duplicate samples (0.300 g ± 0.003 g) were di-gested in 8 mL of concentrated sulfuric acid at 350°Cin a heating block (Model 23540, Labconco Corporation,Kansas City, MO) for 45 min with 1 gram of a catalystmixture [83.85% lithium sulfate (Mallinckrodt Baker, Inc.,Phillipsburg, NJ), 13.86% cupric sulfate (Sigma ChemicalCo., St. Louis, MO), and 2.29% selenium dioxide (Mallin-ckrodt Baker, Inc.)] added to each sample before diges-tion. After digestion, samples were diluted to a final vol-ume of 50 mL with deionized water. Total P and K contentwere determined by inductively coupled plasma analysisusing a Spectroflame Modula S analyzer (Spectro Analyti-cal Instruments, Fitchburg, MA) at the Texas A&M Uni-versity Soil, Forage, and Water Testing Laboratory.
All statistical analyses were performed by one-wayANOVA using the GLM procedure of SAS (SAS for Win-dows, Version 8.01, SAS Inst., Cary, NC). Flock was thesource of variation in the model statement. Data fromindividual pens were the replicates within flock. Meansbetween flocks for the same parameters measured wereseparated using the PDIFF option of GLM procedure.Statistical significance between means was determined atP < 0.05. All calculations for litter and cake production
at National C
hung Hsing U
niversity Library on A
pril 10, 2014http://ps.oxfordjournals.org/
Dow
nloaded from
COUFAL ET AL.400
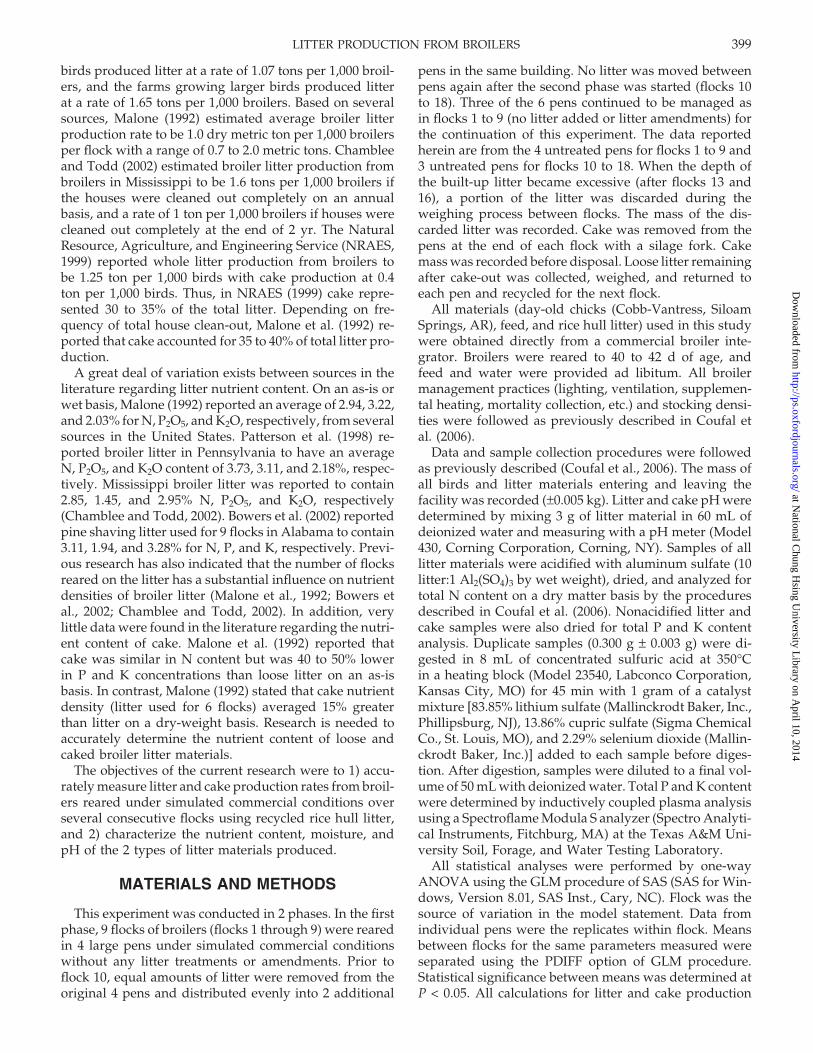
Table 1. Percent moisture and average pH for recycled rice hull broiler litter and cake at the end of each flock,flocks 1 to 181
Begin date End date Litter Cake Litter Cake(mo/yr) (mo/yr) Flock moisture (%) moisture (%) pH2 pH2
7/01 8/01 1 26.1cdef 53.5ab 8.59gh 8.71cd
9/01 10/01 2 23.4h 53.3ab 8.78def 8.72cd
11/01 12/01 3 26.9bcde 55.6a 8.74ef 8.52de
1/02 2/02 4 26.2cdef 49.2cd 8.88ab 8.92abc
2/02 4/02 5 25.7defg 41.2fg 8.90a 8.88bc
4/02 5/02 6 26.6bcde 43.1ef 8.90a 9.14a
6/02 7/02 7 27.4abcd 45.1ef 8.85abc 8.94abc
7/02 9/02 8 26.0defg 38.4g 8.89a 9.03ab
9/02 10/02 9 27.2bcd 50.8bc 8.79def 8.38e
11/02 12/02 10 25.2efg 45.6de 8.57h 8.71cd
1/03 2/03 11 24.2gh 44.1ef 8.65g 8.79bcd
2/03 4/03 12 24.4fgh 44.8ef 8.72f 8.77bcd
4/03 6/03 13 26.9bcde 42.8ef 8.80cde 8.88abc
6/03 7/03 14 29.1a 46.4de 8.79def 8.82bc
8/03 9/03 15 28.4ab 44.8ef 8.82bcd 8.91abc
9/03 10/03 16 27.9abc 44.2ef 8.86abc 8.89abc
11/03 12/03 17 26.8bcde 46.2de 8.89a 8.87bc
1/04 2/04 18 28.3ab 52.7abc 8.90a 7.17f
Average 26.4 46.9 8.80 8.73Pooled SEM 0.636 1.502 0.023 0.097
a–hMeans within a column lacking a common superscript differ (P < 0.05).1Flocks 1 to 9, average of 4 pens; flocks 10 to 18, average of 3 pens.2n = 2 per pen.
rates and nutrient content were performed on a dry mat-ter basis.
RESULTS AND DISCUSSION
Moisture and pH
New rice hull litter placed in the pens at the beginningof the experiment had an average moisture content of9.4% and an average pH of 7.05. Moisture and pH datafor litter and cake samples collected at the end of eachflock are summarized in Table 1. Litter moisture wasrelatively consistent from flock to flock and ranged from23.4 to 29.1% with an average of 26.4%. Cake moisturecontent was more variable than litter moisture with arange from 38.4 to 55.6% and an average of 46.9%. Cakemoisture was approximately 1.5 to 2 times that of thelitter. These values are similar to previously reported databy Malone et al. (1992). They reported average litter andcake moisture to be 27 and 42%, respectively, for commer-cial broiler houses using recycled litter and nipple drink-ers. Although significant differences between flocks wereobserved, no consistent trends or temperature-related ef-fects were found for litter or cake moisture. Differencesin litter and cake moisture on a flock-by-flock basis werelikely influenced by many factors such as ambient temper-ature and humidity, bird health, drinker management,and ventilation rate.
The addition of manure to the litter increased litterpH from 7.05 to 8.59 after flock 1. Litter pH increasedsignificantly from flock 1 to flock 2, after which only smallchanges in pH were noted (Table 1). Average litter pHover all 18 flocks was 8.80. Cake pH was similar to litterpH with an average of 8.73. No consistent trends wereobserved for cake pH. These values are similar to pre-
viously published data. Moore et al. (1996) reported thatuntreated rice hull litter that had been used for 4 flockshad a pH of 8.75. In contrast, Carey et al. (2000) and Singhet al. (2004) reported broiler litter pH to be 8.4 to 8.5.These differences, although slight, could be due to thetype of bedding material used in each study. The pH ofnew sawdust or wood shaving litter has been reportedto be between pH 5 and 6.5 (Nahm, 2003), whereas thepH of new rice hulls used in this study was 7.05.
Nutrient Content
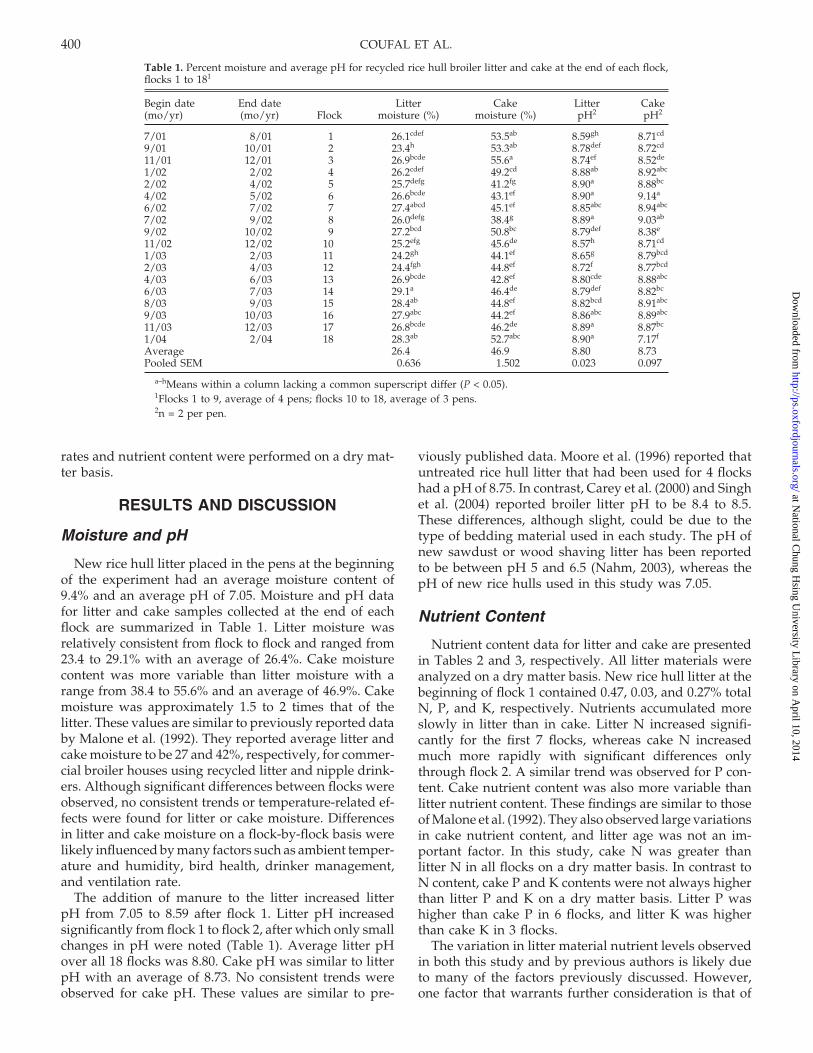
Nutrient content data for litter and cake are presentedin Tables 2 and 3, respectively. All litter materials wereanalyzed on a dry matter basis. New rice hull litter at thebeginning of flock 1 contained 0.47, 0.03, and 0.27% totalN, P, and K, respectively. Nutrients accumulated moreslowly in litter than in cake. Litter N increased signifi-cantly for the first 7 flocks, whereas cake N increasedmuch more rapidly with significant differences onlythrough flock 2. A similar trend was observed for P con-tent. Cake nutrient content was also more variable thanlitter nutrient content. These findings are similar to thoseof Malone et al. (1992). They also observed large variationsin cake nutrient content, and litter age was not an im-portant factor. In this study, cake N was greater thanlitter N in all flocks on a dry matter basis. In contrast toN content, cake P and K contents were not always higherthan litter P and K on a dry matter basis. Litter P washigher than cake P in 6 flocks, and litter K was higherthan cake K in 3 flocks.
The variation in litter material nutrient levels observedin both this study and by previous authors is likely dueto many of the factors previously discussed. However,one factor that warrants further consideration is that of
at National C
hung Hsing U
niversity Library on A
pril 10, 2014http://ps.oxfordjournals.org/
Dow
nloaded from
LITTER PRODUCTION FROM BROILERS 401
Table 2. Nitrogen, P, and K content of recycled rice hull broiler litter at the end of each flock on a dry matterbasis, flocks 1 to 181
Begin date End date(mo/yr) (mo/yr) Flock N P K
(%)7/01 8/01 1 2.08l 0.85k 1.97i
9/01 10/01 2 2.87k 1.19j 2.50h
11/01 12/01 3 3.18j 1.38i 2.87gh
1/02 2/02 4 3.56hi 1.59h 3.12defg
2/02 4/02 5 3.73fg 1.57h 3.27cdefg
4/02 5/02 6 3.86de 1.81g 3.44bcdef
6/02 7/02 7 3.53i 1.92fg 3.55bcde
7/02 9/02 8 3.64ghi 2.35ab 3.89b
9/02 10/02 9 3.64ghi 2.30abc 3.81b
11/02 12/02 10 3.95cd 2.06def 2.97fgh
1/03 2/03 11 4.08bc 2.11cdef 3.03efgh
2/03 4/03 12 4.33a 2.11cdef 3.03efgh
4/03 6/03 13 3.97bcd 2.05ef 3.10defg
6/03 7/03 14 3.80ef 2.22bcde 3.63bcde
8/03 9/03 15 3.65ghi 2.26abcde 3.68bcd
9/03 10/03 16 3.69fgh 2.26abcd 3.76bc
11/03 12/03 17 4.02bc 2.46a 4.56a
1/04 2/04 18 4.10b 2.12cde 3.15cdefg
Pooled SEM 0.046 0.069 0.202
a–lMeans within a column lacking a common superscript differ (P < 0.05).1Flocks 1 to 9, average of 4 pens; flocks 10 to 18, average of 3 pens.
temperature. The volatilization of N in the form of ammo-nia from poultry litter has been shown to be largely de-pendent on temperature and moisture (Elliott and Collins,1982; Carr et al., 1990). Ambient weather conditions inTexas and other states in the southern United States arehot and humid in the summer. The use of evaporativecooling systems (such as the system used in this study)increases the humidity of air entering the facility. There-fore, warm and humid conditions are common in broilerhouses in summer. Combined with high ventilation rates,such an environment is conducive to ammonia generation
Table 3. Nitrogen, P, and K content of caked rice hull broiler litter at the end of each flock on a dry matterbasis, flocks 1 to 181
Begin date End date(mo/yr) (mo/yr) Flock N P K
%7/01 8/01 1 3.40j 1.74h 3.64efghi
9/01 10/01 2 4.76def 1.83gh 3.80efgh
11/01 12/01 3 4.48fg 1.94fg 4.02defg
1/02 2/02 4 4.54efg 2.05def 4.13cdef
2/02 4/02 5 4.26ghi 2.06def 4.13cdef
4/02 5/02 6 4.37gh 1.97efg 4.21cde
6/02 7/02 7 4.07hi 2.31c 4.38cd
7/02 9/02 8 4.00i 2.60b 4.60bc
9/02 10/02 9 5.16bc 2.16cd 3.77efgh
11/02 12/02 10 5.04cd 2.19cd 3.77efghi
1/03 2/03 11 5.01cd 2.09def 3.37hi
2/03 4/03 12 5.42ab 2.05def 3.20hi
4/03 6/03 13 4.86cde 2.05def 3.46ghi
6/03 7/03 14 4.53efg 2.17de 3.59fghi
8/03 9/03 15 4.36gh 3.00a 6.89a
9/03 10/03 16 4.96cd 2.58b 5.04b
11/03 12/03 17 5.0cd 2.45bc 5.16b
1/04 12/04 18 5.64a 1.97efg 3.13i
Pooled SEM 0.118 0.059 0.219
a–jMeans within a column lacking a common superscript differ (P < 0.05).1Flocks 1 to 9, average of 4 pens; flocks 10 to 18, average of 3 pens.
in the litter and subsequent N loss to the environment.These processes most likely account for the decreases inlitter and cake N observed in flocks reared during warmerweather (flocks 7, 8, 14, and 15) compared with flocksgrown during cooler periods of the year. Average ambienttemperature for flocks 7, 8, 14, and 15 was 27.7°C com-pared with an average temperature of 12.1°C for flocks4, 5, 11, 12, and 18 (NCDC, 2005). In contrast, P and Kare minerals that are not readily volatilized from the litter,although some small amounts may be lost as dust. Forthis reason, it would seem logical that litter and cake P
at National C
hung Hsing U
niversity Library on A
pril 10, 2014http://ps.oxfordjournals.org/
Dow
nloaded from
COUFAL ET AL.402
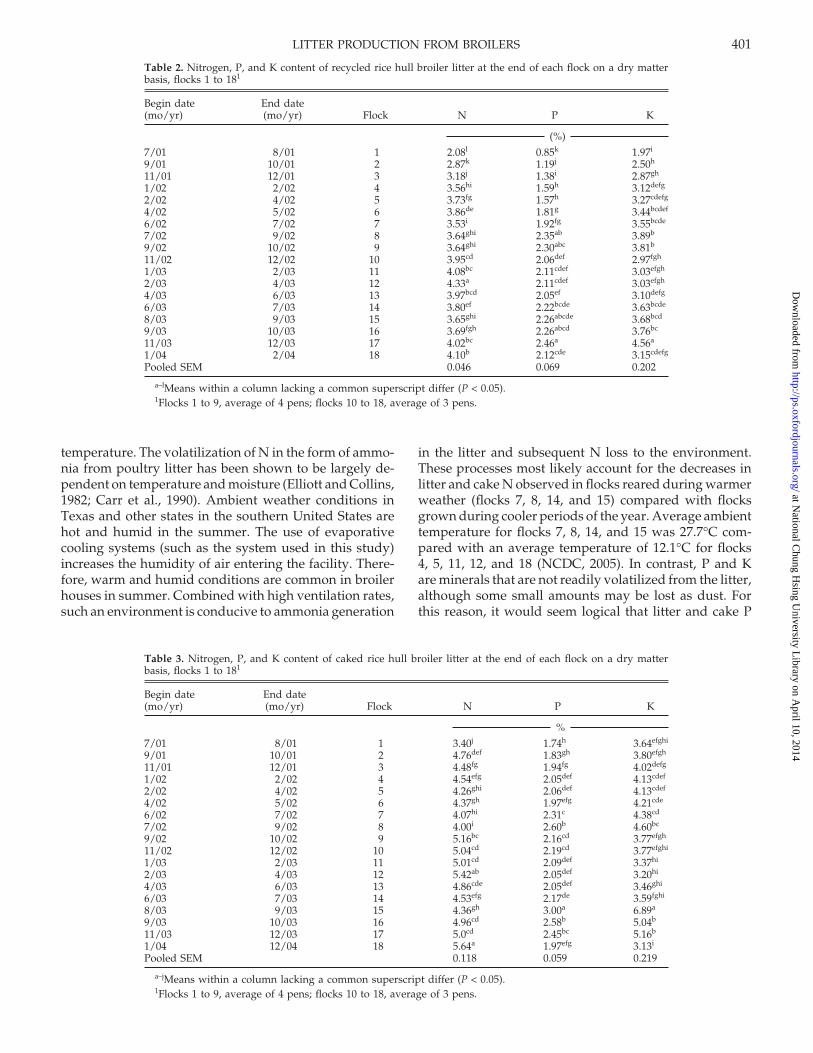
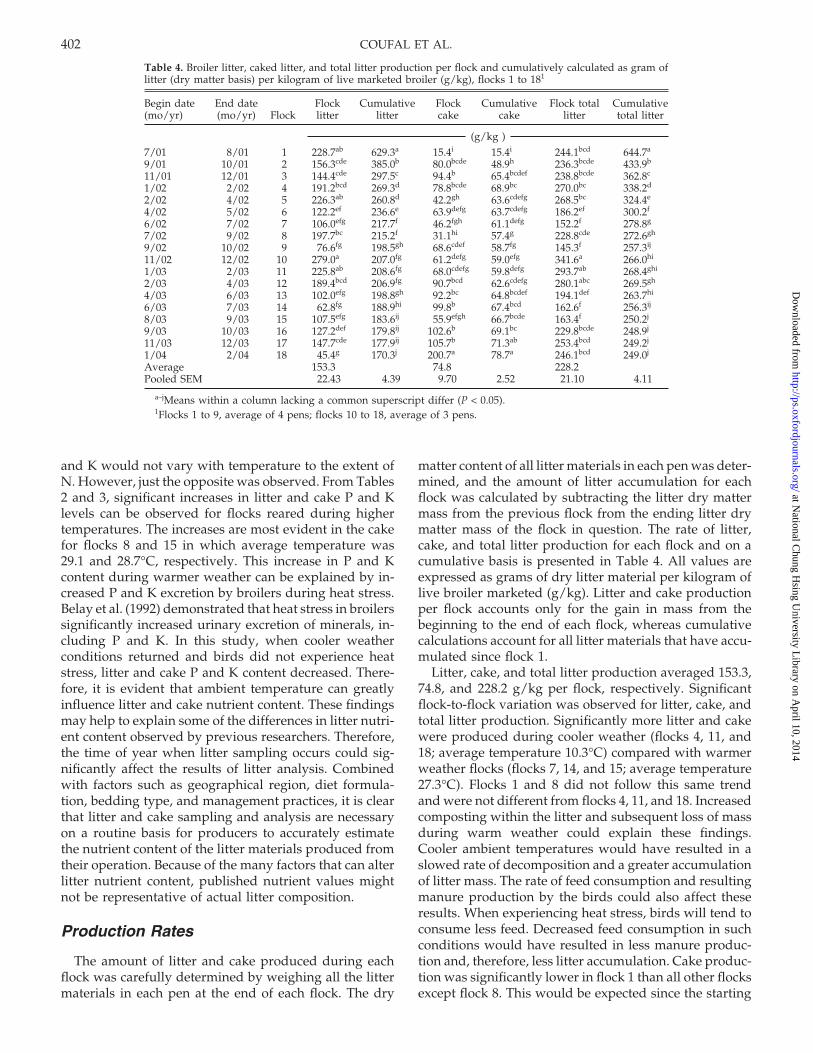
Table 4. Broiler litter, caked litter, and total litter production per flock and cumulatively calculated as gram oflitter (dry matter basis) per kilogram of live marketed broiler (g/kg), flocks 1 to 181
Begin date End date Flock Cumulative Flock Cumulative Flock total Cumulative(mo/yr) (mo/yr) Flock litter litter cake cake litter total litter
(g/kg )7/01 8/01 1 228.7ab 629.3a 15.4i 15.4i 244.1bcd 644.7a
9/01 10/01 2 156.3cde 385.0b 80.0bcde 48.9h 236.3bcde 433.9b
11/01 12/01 3 144.4cde 297.5c 94.4b 65.4bcdef 238.8bcde 362.8c
1/02 2/02 4 191.2bcd 269.3d 78.8bcde 68.9bc 270.0bc 338.2d
2/02 4/02 5 226.3ab 260.8d 42.2gh 63.6cdefg 268.5bc 324.4e
4/02 5/02 6 122.2ef 236.6e 63.9defg 63.7cdefg 186.2ef 300.2f
6/02 7/02 7 106.0efg 217.7f 46.2fgh 61.1defg 152.2f 278.8g
7/02 9/02 8 197.7bc 215.2f 31.1hi 57.4g 228.8cde 272.6gh
9/02 10/02 9 76.6fg 198.5gh 68.6cdef 58.7fg 145.3f 257.3ij
11/02 12/02 10 279.0a 207.0fg 61.2defg 59.0efg 341.6a 266.0hi
1/03 2/03 11 225.8ab 208.6fg 68.0cdefg 59.8defg 293.7ab 268.4ghi
2/03 4/03 12 189.4bcd 206.9fg 90.7bcd 62.6cdefg 280.1abc 269.5gh
4/03 6/03 13 102.0efg 198.8gh 92.2bc 64.8bcdef 194.1def 263.7hi
6/03 7/03 14 62.8fg 188.9hi 99.8b 67.4bcd 162.6f 256.3ij
8/03 9/03 15 107.5efg 183.6ij 55.9efgh 66.7bcde 163.4f 250.2j
9/03 10/03 16 127.2def 179.8ij 102.6b 69.1bc 229.8bcde 248.9j
11/03 12/03 17 147.7cde 177.9ij 105.7b 71.3ab 253.4bcd 249.2j
1/04 2/04 18 45.4g 170.3j 200.7a 78.7a 246.1bcd 249.0j
Average 153.3 74.8 228.2Pooled SEM 22.43 4.39 9.70 2.52 21.10 4.11
a–jMeans within a column lacking a common superscript differ (P < 0.05).1Flocks 1 to 9, average of 4 pens; flocks 10 to 18, average of 3 pens.
and K would not vary with temperature to the extent ofN. However, just the opposite was observed. From Tables2 and 3, significant increases in litter and cake P and Klevels can be observed for flocks reared during highertemperatures. The increases are most evident in the cakefor flocks 8 and 15 in which average temperature was29.1 and 28.7°C, respectively. This increase in P and Kcontent during warmer weather can be explained by in-creased P and K excretion by broilers during heat stress.Belay et al. (1992) demonstrated that heat stress in broilerssignificantly increased urinary excretion of minerals, in-cluding P and K. In this study, when cooler weatherconditions returned and birds did not experience heatstress, litter and cake P and K content decreased. There-fore, it is evident that ambient temperature can greatlyinfluence litter and cake nutrient content. These findingsmay help to explain some of the differences in litter nutri-ent content observed by previous researchers. Therefore,the time of year when litter sampling occurs could sig-nificantly affect the results of litter analysis. Combinedwith factors such as geographical region, diet formula-tion, bedding type, and management practices, it is clearthat litter and cake sampling and analysis are necessaryon a routine basis for producers to accurately estimatethe nutrient content of the litter materials produced fromtheir operation. Because of the many factors that can alterlitter nutrient content, published nutrient values mightnot be representative of actual litter composition.
Production Rates
The amount of litter and cake produced during eachflock was carefully determined by weighing all the littermaterials in each pen at the end of each flock. The dry
matter content of all litter materials in each pen was deter-mined, and the amount of litter accumulation for eachflock was calculated by subtracting the litter dry mattermass from the previous flock from the ending litter drymatter mass of the flock in question. The rate of litter,cake, and total litter production for each flock and on acumulative basis is presented in Table 4. All values areexpressed as grams of dry litter material per kilogram oflive broiler marketed (g/kg). Litter and cake productionper flock accounts only for the gain in mass from thebeginning to the end of each flock, whereas cumulativecalculations account for all litter materials that have accu-mulated since flock 1.
Litter, cake, and total litter production averaged 153.3,74.8, and 228.2 g/kg per flock, respectively. Significantflock-to-flock variation was observed for litter, cake, andtotal litter production. Significantly more litter and cakewere produced during cooler weather (flocks 4, 11, and18; average temperature 10.3°C) compared with warmerweather flocks (flocks 7, 14, and 15; average temperature27.3°C). Flocks 1 and 8 did not follow this same trendand were not different from flocks 4, 11, and 18. Increasedcomposting within the litter and subsequent loss of massduring warm weather could explain these findings.Cooler ambient temperatures would have resulted in aslowed rate of decomposition and a greater accumulationof litter mass. The rate of feed consumption and resultingmanure production by the birds could also affect theseresults. When experiencing heat stress, birds will tend toconsume less feed. Decreased feed consumption in suchconditions would have resulted in less manure produc-tion and, therefore, less litter accumulation. Cake produc-tion was significantly lower in flock 1 than all other flocksexcept flock 8. This would be expected since the starting
at National C
hung Hsing U
niversity Library on A
pril 10, 2014http://ps.oxfordjournals.org/
Dow
nloaded from
LITTER PRODUCTION FROM BROILERS 403
litter moisture in flock 1 was less than 10%. Cake ex-pressed as a percentage of all litter materials producedvaried significantly from 6.3 (flock 1) to 81.6% (flock 18).Cake as a percentage of all litter produced per flock aver-aged 32.8% on a dry matter basis and 39.8% on an as-isbasis. These values are similar to the findings of theNRAES (1999) and Malone et al. (1992). In addition, litteraccumulation is inversely related to the rate of cake pro-duction, as would be expected. This relationship is easilyobserved by comparing litter material production forflocks 17 and 18. Total litter production for the 2 flockswas very similar. However, a significant increase in cakeproduction from flock 17 to 18 resulted in a significantdecrease in litter production for the same flocks.
Cumulative production was calculated at the end ofeach flock by dividing the litter and cake mass that hadbeen generated since the start of the experiment by thekilograms of live broilers that had been produced sinceflock 1. Therefore, the starting litter mass put into thefacility at the beginning of the experiment is accountedfor in the cumulative calculation and represents theamount of litter material that would have to be disposedof if the facility were completely cleaned-out at that pointin time. Cumulative total litter production decreased sig-nificantly for the first 7 flocks. Cumulative litter and totallitter production rates decreased less with each subse-quent flock produced. This is due to the fact that the rateof litter accumulation was less than the rate at which totalkilograms of live broiler were being produced. Cumula-tive cake production rates increased with each flock be-cause there was no starting cake mass at the beginningof the experiment. Cumulative litter, cake, and total litterproduction were 170.3, 78.7, and 249.0 g/kg, respectively,at the end of 18 consecutive flocks. Calculated on a wet-weight basis, cumulative litter, cake, and total litter pro-duction rates after 18 flocks were 236.5, 140.0, and 376.5g of litter material per kilogram of live broiler weight.For a 2.24 kg broiler (average broiler market weight in thisstudy), litter, cake, and total litter production estimateswould be 0.530, 0.314, and 0.843 kg per bird produced.This would equate to a total litter production rate of 1.86lb/broiler or 0.93 US tons/1,000 broilers on an as-is basis.This figure is lower than the 2.5 lb/broiler or 1.25 UStons/1,000 broilers reported by NRAES (1999). However,these results are similar to litter production rates esti-mated by Chamblee and Todd (2002). They determinedan as-is litter production rate of 1 ton/1,000 broilers after2 years (10 flocks). Patterson et al. (1998) reported as-islitter production to be 0.558 and 0.488 lb/lb of live weightfor litter that was used for 2 to 3 flocks and 1 to 2 flocks,respectively. In the present study, similar results wereobserved with wet-weight total litter production for flocks2 and 3 calculated to be 0.606 and 0.550 lb/lb of liveweight, respectively. Broiler ending live weight, startinglitter depth and density, and litter material moisture couldaccount for the small differences.
The data generated in this study can be used by broilerproducers to estimate the amount of litter materials thatwill be generated over a range of flocks reared on the samelitter. Coupled with nutrient analysis of litter materials,broiler producers can then estimate total nutrients avail-able from litter materials.
ACKNOWLEDGMENTS
Portions of this work were supported by US Poultryand Egg Association Research Project #495: Quantifica-tion of the fate of nitrogen in commercial broiler produc-tion systems.
REFERENCES
Belay, T., C. J. Wiernusz, and R. G. Teeter. 1992. Mineral balanceand urinary and fecal mineral excretion profile of broilershoused in thermoneutral and heat-distressed environments.Poult. Sci. 71:1043–1047.
Bowers, B. D., J. B. Hess, S. F. Bilgili, J. P. Blake, and M. K.Eckman. 2002. Nutrient level buildup in sand litter. Pages289–293 in Proc. of 2002 Natl. Poult. Waste Manage. Symp.,Birmingham, AL.
Carey, J. B., R. P. Burgess, R. A. Russo, C. Chavez, T. P. Nie-meyer, and C. D. Coufal. 2000. Field evaluation of litter condi-tions in tunnel ventilated broiler houses at the end of theproduction cycle. Pages 340–343 in Proc. of 2000 Natl. Poult.Waste Manage. Symp.
Carr, L. E., F. W. Wheaton, and L. W. Douglass. 1990. Empiricalmodels to determine ammonia concentrations from broilerchicken litter. Trans. ASAE 33:1337–1342.
Chamblee, T. N. and R. L. Todd. 2002. Mississippi broiler litter:Fertilizer value and quantity produced. Mississippi Agric.Forestry Exp. Sta. Res. Rep. 23(5).
Coufal, C. D., C. Chavez, P. R. Niemeyer, and J. B. Carey. 2006.Nitrogen emissions from broilers measured by mass balanceover eighteen consecutive flocks. Poult. Sci. 85:384–391.
Elliott, H. A., and N. E. Collins. 1982. Factors affecting ammoniarelease in broiler houses. Trans. ASAE 25:413–424.
Malone, G. W. 1992. Nutrient enrichment in integrated broilerproduction systems. Poult. Sci. 71:1117–1122.
Malone, G. W., T. Sims, and N. Gedamu. 1992. Quantity andquality of poultry manure produced under current manage-ment programs. Final report to the Delaware Department ofNatural Resources and Environmental Control and Del-marva Poultry Industry, Inc., University of Delaware, Re-search and Education Center, Georgetown, Delaware.
Moore, P. A., Jr., T. C. Daniel, D. R. Edwards, and D. M. Miller.1996. Evaluation of chemical amendments to reduce ammo-nia volatilization from poultry litter. Poult. Sci. 75:315–320.
Nahm, K. H. 2003. Evaluation of the nitrogen content in poultrymanure. World’s Poul. Sci. J. 59:77–88.
National Climatic Data Center (NCDC). 2005. Subject: Meteoro-logical data for College Station, TX. http://cdo.ncdc.noaa.gov/ulcd/ULCD Accessed June 2005.
Natural Resource, Agriculture, and Engineering Service(NRAES). 1999. Poultry Waste Management Handbook.Coop. Extension, Ithaca, NY.
Patterson, P. H., E. S. Lorenz, W. D. Weaver, Jr., and J. H.Schwartz. 1998. Litter production and nutrients from com-mercial broiler chickens. J. Appl. Poult. Res. 7:247–252.
Singh, A., J. R. Bicudo, A. L. Tinoco, I. F. Tinoco, R. S. Gates,K. D. Casey, and A. J. Pescatore. 2004. Characterization ofnutrients in built-up broiler litter using trench and randomwalk sampling methods. J. Appl. Poult. Res. 13:426–432.
at National C
hung Hsing U
niversity Library on A
pril 10, 2014http://ps.oxfordjournals.org/
Dow
nloaded from