Embed Size (px)
Citation preview
564
RADIATION RESEARCH 154, 564–581 (2000)0033-7587/00 $5.00q 2000 by Radiation Research Society.All rights of reproduction in any form reserved.
Measurement and Validation of Benchmark-Quality Thick-TargetTungsten X-Ray Spectra below 150 kVp
J. R. Mercier,a,1 D. T. Kopp,a W. D. McDavid,b S. B. Dove,b J. L. Lancasterc and D. M. Tuckerd
a The University of Texas Health Science Center at San Antonio, Radiological Sciences Division, San Antonio, Texas 78284-7800; b The Universityof Texas Health Science Center at San Antonio, Dental Diagnostic Sciences Division, San Antonio, Texas 78284-7919; c The University of Texas
Health Science Center at San Antonio, Research Imaging Center, San Antonio, Texas 78284-6239; and d Storage Technology Corporation,Louisville, Colorado 80028-8102
Mercier, J. R., Kopp, D. T., McDavid, W. D., Dove, S. B.,Lancaster, J. L. and Tucker, D. M. Measurement and Vali-dation of Benchmark-Quality Thick-Target Tungsten X-RaySpectra below 150 kVp. Radiat. Res. 154, 564–581 (2000).
Pulse-height distributions of two constant potential X-raytubes with fixed anode tungsten targets were measured andunfolded. The measurements employed quantitative align-ment of the beam, the use of two different semiconductor de-tectors (high-purity germanium and cadmium-zinc-telluride),two different ion chamber systems with beam-specific calibra-tion factors, and various filter and tube potential combina-tions. Monte Carlo response matrices were generated for eachdetector for unfolding the pulse-height distributions into spec-tra incident on the detectors. These response matrices werevalidated for the low error bars assigned to the data. A sig-nificant aspect of the validation of spectra, and a detailedcharacterization of the X-ray tubes, involved measuring fil-tered and unfiltered beams at multiple tube potentials (30–150kVp). Full corrections to ion chamber readings were em-ployed to convert normalized fluence spectra into absolute flu-ence spectra. The characterization of fixed anode pitting andits dominance over exit window plating and/or detector deadlayer was determined. An Appendix of tabulated benchmarkspectra with assigned error ranges was developed for futurereference. q 2000 by Radiation Research Society
INTRODUCTION
One of the many factors that influences the ability of theradiologist to detect subtle lesions in X-ray-based imagingis the signal-to-noise ratio presented by the lesion in theimage. This important factor ultimately depends on thespectrum of the X-ray beam incident on the patient for theimaging procedure. Establishing imaging techniques thatyield incident spectra that optimize the relationship betweenthe dose to the patient and image quality involves modelingthe X-ray imaging chain from the point of production ofthe primary beam in the anode to absorption of primary
1 Author to whom correspondence should be addressed at 8500 ChapelDrive, Annandale, VA 22003.
and secondary radiation in a specific image receptor. There-fore, knowledge of the X-ray spectrum is paramount in im-age optimization.
Validation of any spectral model for predicting tungstenX-ray tube spectra requires agreement between the calcu-lated spectra and benchmark-quality measured spectraacross the range of applications for which it is intended tosimulate. A robust and powerful technique that can be usedfor modeling X-ray spectra is with the Monte Carlo methodfor simulating coupled electron–photon radiation transport.For X-ray spectra to be of benchmark quality for validatinga Monte Carlo code, or other computational methods, theymust be accurate, reproducible and well documented. Al-though Profio (1) makes some suggestions for recordingbenchmark-quality measured data, such as sketching anddescribing the experimental setup, the following guidelineswere found useful for ongoing research. Beams must becharacterized in detail for geometry and composition of an-ode, for detectors, and for inherent and added filtration.Waveforms for voltage (in kV) and current (in mA) shouldbe described. Other information pertinent to the Monte Car-lo modeling process, such as assessments of anode pittingand detector dead layer, should be provided. Beam align-ment and scatter reduction techniques should be presented.A thorough error analysis of the measured data is required,and any databases used in calculations (e.g. attenuation andenergy absorption coefficients) should be referenced. Cali-bration and quality control of the spectroscopy systemshould be discussed, and ion chamber corrections (e.g. forenergy response, temperature, pressure) should be present-ed. The method for unfolding X-ray pulse-height distribu-tions into spectra must be described and validated. Finally,the benchmark data should be provided in tabulated formand presented in a peer-reviewed scientific journal for useby others.
Although several scientific papers and a few governmentreports have presented measured tungsten spectra (2–12),none of them appear to meet all the stringent benchmarkingrequirements of a Monte Carlo code. This paper, supported
565THICK-TARGET TUNGSTEN X-RAY SPECTRA
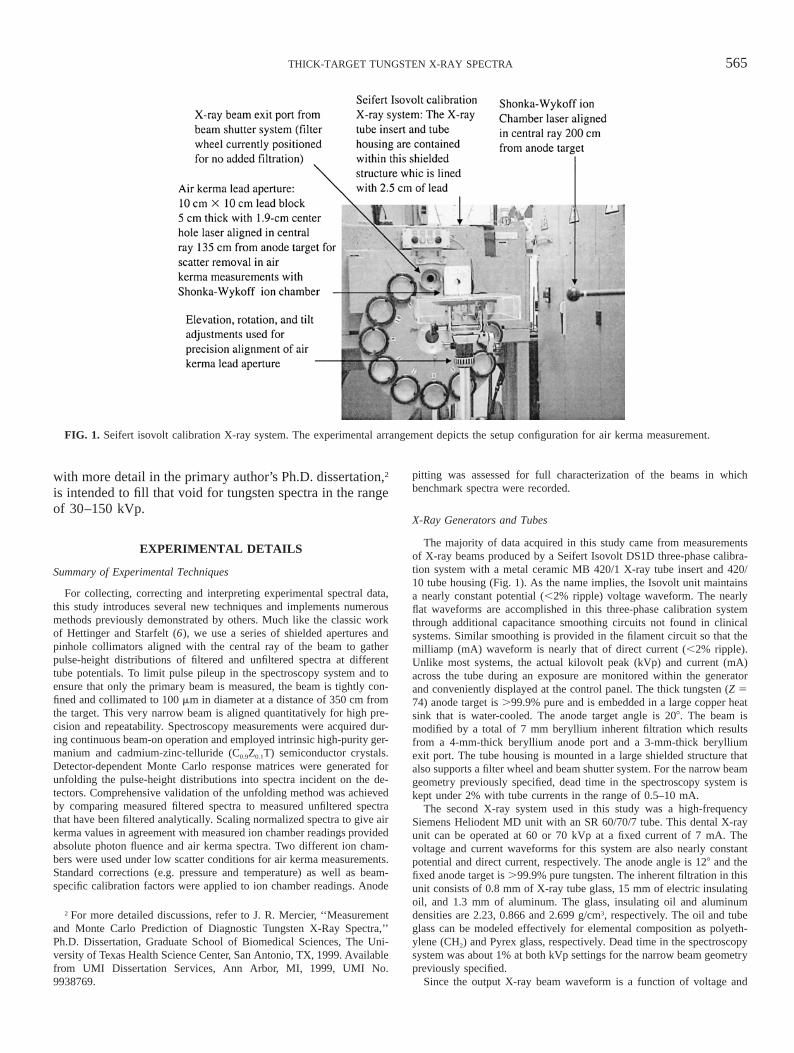
FIG. 1. Seifert isovolt calibration X-ray system. The experimental arrangement depicts the setup configuration for air kerma measurement.
with more detail in the primary author’s Ph.D. dissertation,2
is intended to fill that void for tungsten spectra in the rangeof 30–150 kVp.
EXPERIMENTAL DETAILS
Summary of Experimental Techniques
For collecting, correcting and interpreting experimental spectral data,this study introduces several new techniques and implements numerousmethods previously demonstrated by others. Much like the classic workof Hettinger and Starfelt (6), we use a series of shielded apertures andpinhole collimators aligned with the central ray of the beam to gatherpulse-height distributions of filtered and unfiltered spectra at differenttube potentials. To limit pulse pileup in the spectroscopy system and toensure that only the primary beam is measured, the beam is tightly con-fined and collimated to 100 mm in diameter at a distance of 350 cm fromthe target. This very narrow beam is aligned quantitatively for high pre-cision and repeatability. Spectroscopy measurements were acquired dur-ing continuous beam-on operation and employed intrinsic high-purity ger-manium and cadmium-zinc-telluride (C0.9Z0.1T) semiconductor crystals.Detector-dependent Monte Carlo response matrices were generated forunfolding the pulse-height distributions into spectra incident on the de-tectors. Comprehensive validation of the unfolding method was achievedby comparing measured filtered spectra to measured unfiltered spectrathat have been filtered analytically. Scaling normalized spectra to give airkerma values in agreement with measured ion chamber readings providedabsolute photon fluence and air kerma spectra. Two different ion cham-bers were used under low scatter conditions for air kerma measurements.Standard corrections (e.g. pressure and temperature) as well as beam-specific calibration factors were applied to ion chamber readings. Anode
2 For more detailed discussions, refer to J. R. Mercier, ‘‘Measurementand Monte Carlo Prediction of Diagnostic Tungsten X-Ray Spectra,’’Ph.D. Dissertation, Graduate School of Biomedical Sciences, The Uni-versity of Texas Health Science Center, San Antonio, TX, 1999. Availablefrom UMI Dissertation Services, Ann Arbor, MI, 1999, UMI No.9938769.
pitting was assessed for full characterization of the beams in whichbenchmark spectra were recorded.
X-Ray Generators and Tubes
The majority of data acquired in this study came from measurementsof X-ray beams produced by a Seifert Isovolt DS1D three-phase calibra-tion system with a metal ceramic MB 420/1 X-ray tube insert and 420/10 tube housing (Fig. 1). As the name implies, the Isovolt unit maintainsa nearly constant potential (,2% ripple) voltage waveform. The nearlyflat waveforms are accomplished in this three-phase calibration systemthrough additional capacitance smoothing circuits not found in clinicalsystems. Similar smoothing is provided in the filament circuit so that themilliamp (mA) waveform is nearly that of direct current (,2% ripple).Unlike most systems, the actual kilovolt peak (kVp) and current (mA)across the tube during an exposure are monitored within the generatorand conveniently displayed at the control panel. The thick tungsten (Z 574) anode target is .99.9% pure and is embedded in a large copper heatsink that is water-cooled. The anode target angle is 208. The beam ismodified by a total of 7 mm beryllium inherent filtration which resultsfrom a 4-mm-thick beryllium anode port and a 3-mm-thick berylliumexit port. The tube housing is mounted in a large shielded structure thatalso supports a filter wheel and beam shutter system. For the narrow beamgeometry previously specified, dead time in the spectroscopy system iskept under 2% with tube currents in the range of 0.5–10 mA.
The second X-ray system used in this study was a high-frequencySiemens Heliodent MD unit with an SR 60/70/7 tube. This dental X-rayunit can be operated at 60 or 70 kVp at a fixed current of 7 mA. Thevoltage and current waveforms for this system are also nearly constantpotential and direct current, respectively. The anode angle is 128 and thefixed anode target is .99.9% pure tungsten. The inherent filtration in thisunit consists of 0.8 mm of X-ray tube glass, 15 mm of electric insulatingoil, and 1.3 mm of aluminum. The glass, insulating oil and aluminumdensities are 2.23, 0.866 and 2.699 g/cm3, respectively. The oil and tubeglass can be modeled effectively for elemental composition as polyeth-ylene (CH2) and Pyrex glass, respectively. Dead time in the spectroscopysystem was about 1% at both kVp settings for the narrow beam geometrypreviously specified.
Since the output X-ray beam waveform is a function of voltage and
566 MERCIER ET AL.
current waveforms, a small silicon diode array connected to an oscillo-scope was used to verify the ripple content of the output beam. The diodedetector provides an instantaneous current output signal when subjectedto the X-ray beam. For the full range of voltages (30 to 150 kVp) andcurrents (0.5 to 10 mA) used in this study, there was no appreciable ripplemeasured in the output beams for either X-ray system. The diode detectorwas also used to assess X-ray shutter timer error and verify exposuretimer accuracy.
Spectroscopy System and Detectors
With their high-resolution capability and linear energy response, semi-conductor detectors have proven to be the detectors of choice for mea-suring spectra in the diagnostic energy range. Whether intrinsic or theolder lithium-drifted type, germanium semiconductor detectors have pro-vided the best spectral results over the last three decades and thereforeare the current standard. The most recent low-energy g- and X-ray spec-troscopy challenger to intrinsic germanium is cadmium-zinc-telluride.This study employs both high-purity germanium- and cadmium-zinc-tel-luride-type detectors with 60 keV line-energy system resolutions ofroughly 1.5 and 3.0 keV (peak full width at half-maximum), respectively.
Detector signals are modified and enhanced as they pass through asophisticated electronic spectroscopy system to form pulse-height distri-butions in a multichannel analyzer. An oscilloscope is used to ensureproper setup and signal flow at each step in the system. Calibration ofthe 0.5 keV channel widths was performed with 241Am and 57Co sources.System calibration was very stable so that a single energy calibration wasusually sufficient on any given day.
The primary detector for collecting pulse-height distributions of inci-dent spectra was a reverse-electrode coaxial intrinsic high-purity germa-nium detector. The high-purity germanium crystal is mounted behind a0.5-mm-thick beryllium window in an evacuated aluminum cryostathousing atop a copper cold finger for liquid nitrogen cooling. The high-purity germanium crystal is cylindrical with a diameter of 49.5 mm. Thecrystal is only 14.5 mm thick out to a centerline radius of 3.75 mm andis 50.5 mm thick elsewhere. In high-purity germanium detectors, the con-tacts are made of diffused lithium in the N-type layer and boron-ionimplantation in the P-type layer. In a standard coaxial design, the P-typecontact is 2–3 mm thick and lines the crystal at the inner void area andthe much thicker (;500 mm) N-type contact covers the front face andsides of the crystal. An advantage of the reverse-electrode detector designused for this study is that the locations of the P and N contacts arereversed so that the detector dead layer is all but eliminated (e.g. 3 com-pared to 500 mm). The spectroscopy system was configured for inter-changing the high-purity germanium and cadmium-zinc-telluride detec-tors. The cadmium-zinc-telluride crystal is only 2 mm thick, has a 3 33-mm face, and is mounted on a tiny thermoelectric cooler. The cadmium-zinc-telluride detector beryllium window is 250 mm thick.
Ion Chambers
For high accuracy, the superbly designed and time-tested Shonka-Wy-koff ion chamber (Fig. 1) was used for measuring air kerma of primaryX-ray beams (13). The Shonka-Wykoff chamber was calibrated at theNational Institute of Standards and Technology (NIST) in which air ker-ma calibration factors in grays per coulomb (Gy/C) were provided in acalibration report for various NIST beam codes. The calibration factorsare accurate to 1% with a 95% confidence interval.
A second well-designed ion chamber system was employed to measureair kerma in the beams. This was an MDH 1015 series monitor with10X5-6 and 10X5-6M probes (14). The MDH calibration was performedby the Food and Drug Administration (FDA) and is traceable to NIST.The accuracy for this calibration was 5%. MDH exposure rate readingswere converted to air kerma values and used as a general check on thevalues obtained with the Shonka-Wykoff chamber.
UNFOLDING OF HIGH-PURITY GERMANIUMSPECTRA
Although high-purity germanium detectors have the ad-vantage of high resolution with reasonably high detectionefficiencies, it is still necessary to correct the measuredpulse-height distributions for the distorting effects of thedetector response. Except for recourse to rather crude ap-proximations, estimation of the Compton continua and thecorresponding full-energy absorption probabilities has de-pended on Monte Carlo calculations (15). Incorporating theperformance characteristics of the detector in relation tocrystal geometry, beam geometry, and beam energy is im-portant for achieving the best results. Using version 4B2 ofthe Monte Carlo N-Particle (MCNP4B2) radiation transportcode (16), detector response was modeled for a very narrowbeam normally incident on the face of the detector. MonteCarlo and analytical modeling of detector response andspectra unfolding procedures are introduced in refs. (5, 7,10, 15).
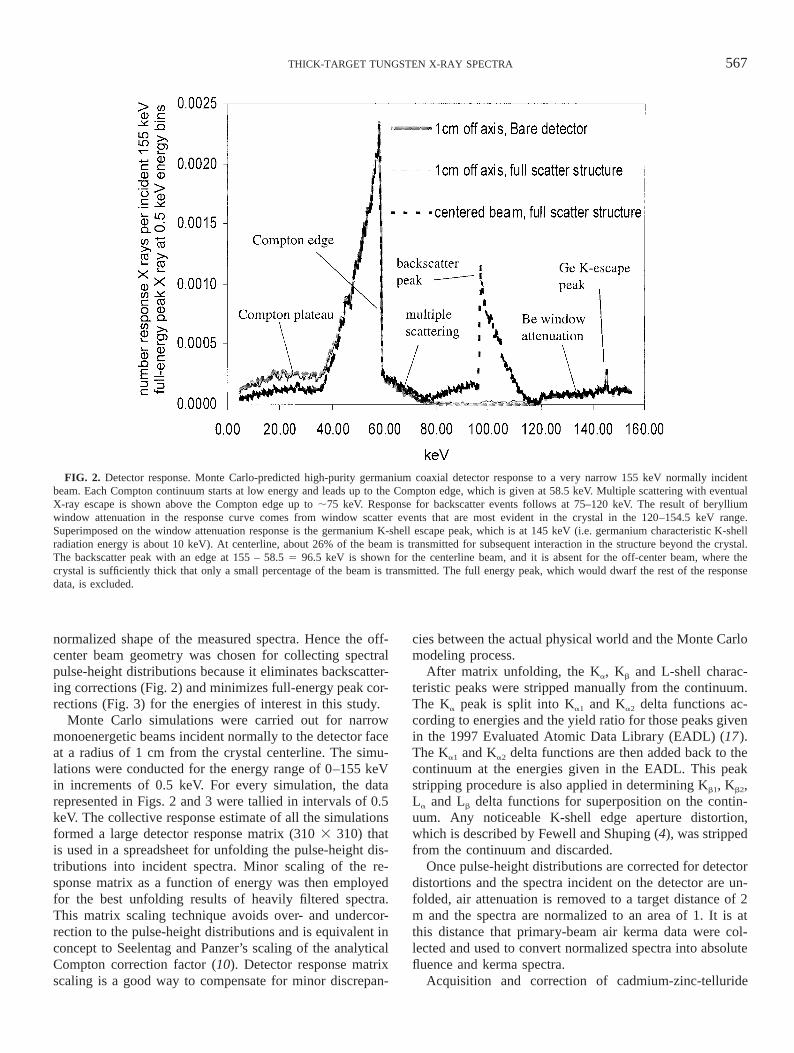
For a full-scatter structure, the modeling included theberyllium window, the previously described crystal geom-etry, the aluminum cryostat housing, an estimate of variousbacking materials beyond the crystal, and the head of thecopper cold finger. Figure 2 shows the predicted responsefor 155 keV monoenergetic beams at the center of the de-tector and 1 cm off center. The figure also shows the de-tector response for Monte Carlo modeling of just the be-ryllium window and the bare crystal for the 1-cm off-centerbeam. The backscatter peak with an edge at 155 – 58.5 596.5 keV is correctly shown for the centerline beam and isabsent for the off-center beam, where the crystal is suffi-ciently thick that only a small percentage of the beam istransmitted. The nearly full absorption condition is also ex-plicative of the agreement between the bare detector andfull scatter modeling in the off-center beam.
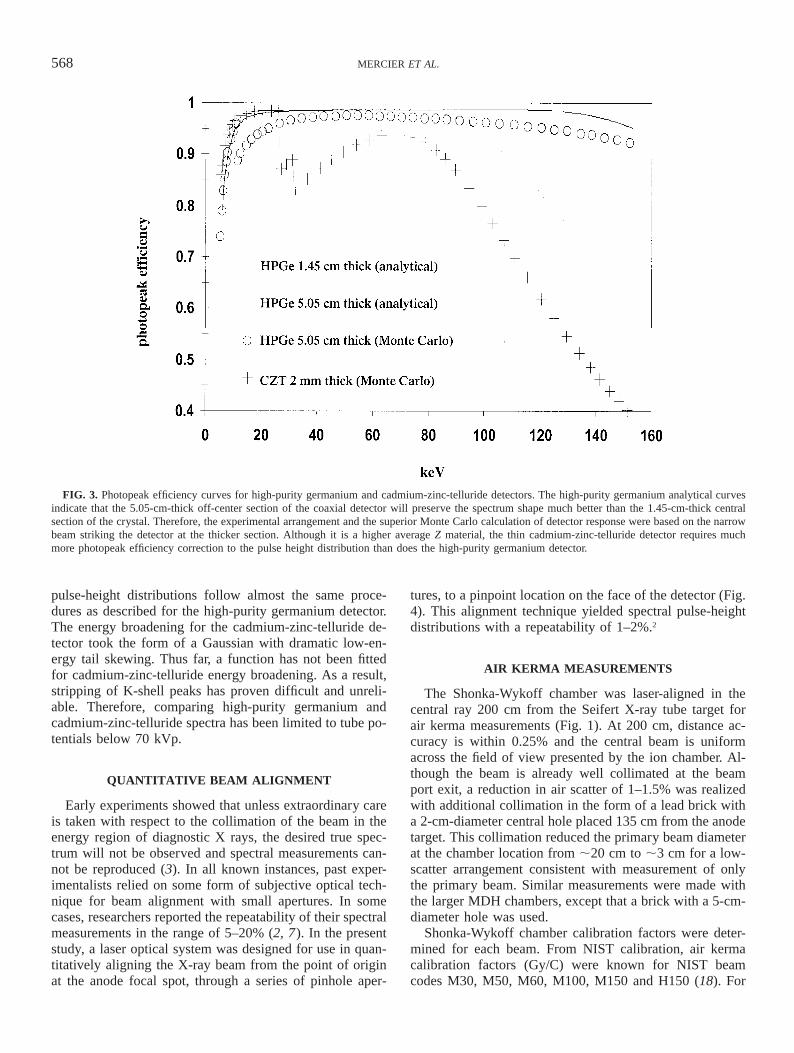
Monte Carlo and photopeak efficiency curves calculatedanalytically for the high-purity germanium crystal areshown in Fig. 3 for energies up to 150 keV. FollowingIsrael et al. (7), the analytical calculation is a simple ex-ponential attenuation calculation using the narrow-beam to-tal energy absorption coefficient for germanium and the to-tal linear attenuation coefficient for beryllium. The analyt-ical calculation does not account for the discontinuity at thecrystal K-shell edge, the loss of K-shell X rays and Comp-ton X rays from the front face and sides of the crystal,coherent scatter, or multiple scattered Compton X rays thataffect the photopeak efficiency. Since the Monte Carlo cal-culation accounts for all of the important physical processesand for actual detector geometry, it is the method of choicefor correcting measured data. Figure 3 shows that an off-center beam requires less full-energy response correctionthan a centerline beam for the coaxial detector geometry.In fact, application of off-center photopeak efficiencycurves, which are above 90% and relatively flat across theenergy range of interest, will result in little change in the
567THICK-TARGET TUNGSTEN X-RAY SPECTRA
FIG. 2. Detector response. Monte Carlo-predicted high-purity germanium coaxial detector response to a very narrow 155 keV normally incidentbeam. Each Compton continuum starts at low energy and leads up to the Compton edge, which is given at 58.5 keV. Multiple scattering with eventualX-ray escape is shown above the Compton edge up to ;75 keV. Response for backscatter events follows at 75–120 keV. The result of berylliumwindow attenuation in the response curve comes from window scatter events that are most evident in the crystal in the 120–154.5 keV range.Superimposed on the window attenuation response is the germanium K-shell escape peak, which is at 145 keV (i.e. germanium characteristic K-shellradiation energy is about 10 keV). At centerline, about 26% of the beam is transmitted for subsequent interaction in the structure beyond the crystal.The backscatter peak with an edge at 155 – 58.5 5 96.5 keV is shown for the centerline beam, and it is absent for the off-center beam, where thecrystal is sufficiently thick that only a small percentage of the beam is transmitted. The full energy peak, which would dwarf the rest of the responsedata, is excluded.
normalized shape of the measured spectra. Hence the off-center beam geometry was chosen for collecting spectralpulse-height distributions because it eliminates backscatter-ing corrections (Fig. 2) and minimizes full-energy peak cor-rections (Fig. 3) for the energies of interest in this study.
Monte Carlo simulations were carried out for narrowmonoenergetic beams incident normally to the detector faceat a radius of 1 cm from the crystal centerline. The simu-lations were conducted for the energy range of 0–155 keVin increments of 0.5 keV. For every simulation, the datarepresented in Figs. 2 and 3 were tallied in intervals of 0.5keV. The collective response estimate of all the simulationsformed a large detector response matrix (310 3 310) thatis used in a spreadsheet for unfolding the pulse-height dis-tributions into incident spectra. Minor scaling of the re-sponse matrix as a function of energy was then employedfor the best unfolding results of heavily filtered spectra.This matrix scaling technique avoids over- and undercor-rection to the pulse-height distributions and is equivalent inconcept to Seelentag and Panzer’s scaling of the analyticalCompton correction factor (10). Detector response matrixscaling is a good way to compensate for minor discrepan-
cies between the actual physical world and the Monte Carlomodeling process.
After matrix unfolding, the Ka, Kb and L-shell charac-teristic peaks were stripped manually from the continuum.The Ka peak is split into Ka1 and Ka2 delta functions ac-cording to energies and the yield ratio for those peaks givenin the 1997 Evaluated Atomic Data Library (EADL) (17).The Ka1 and Ka2 delta functions are then added back to thecontinuum at the energies given in the EADL. This peakstripping procedure is also applied in determining Kb1, Kb2,La and Lb delta functions for superposition on the contin-uum. Any noticeable K-shell edge aperture distortion,which is described by Fewell and Shuping (4), was strippedfrom the continuum and discarded.
Once pulse-height distributions are corrected for detectordistortions and the spectra incident on the detector are un-folded, air attenuation is removed to a target distance of 2m and the spectra are normalized to an area of 1. It is atthis distance that primary-beam air kerma data were col-lected and used to convert normalized spectra into absolutefluence and kerma spectra.
Acquisition and correction of cadmium-zinc-telluride
568 MERCIER ET AL.
FIG. 3. Photopeak efficiency curves for high-purity germanium and cadmium-zinc-telluride detectors. The high-purity germanium analytical curvesindicate that the 5.05-cm-thick off-center section of the coaxial detector will preserve the spectrum shape much better than the 1.45-cm-thick centralsection of the crystal. Therefore, the experimental arrangement and the superior Monte Carlo calculation of detector response were based on the narrowbeam striking the detector at the thicker section. Although it is a higher average Z material, the thin cadmium-zinc-telluride detector requires muchmore photopeak efficiency correction to the pulse height distribution than does the high-purity germanium detector.
pulse-height distributions follow almost the same proce-dures as described for the high-purity germanium detector.The energy broadening for the cadmium-zinc-telluride de-tector took the form of a Gaussian with dramatic low-en-ergy tail skewing. Thus far, a function has not been fittedfor cadmium-zinc-telluride energy broadening. As a result,stripping of K-shell peaks has proven difficult and unreli-able. Therefore, comparing high-purity germanium andcadmium-zinc-telluride spectra has been limited to tube po-tentials below 70 kVp.
QUANTITATIVE BEAM ALIGNMENT
Early experiments showed that unless extraordinary careis taken with respect to the collimation of the beam in theenergy region of diagnostic X rays, the desired true spec-trum will not be observed and spectral measurements can-not be reproduced (3). In all known instances, past exper-imentalists relied on some form of subjective optical tech-nique for beam alignment with small apertures. In somecases, researchers reported the repeatability of their spectralmeasurements in the range of 5–20% (2, 7). In the presentstudy, a laser optical system was designed for use in quan-titatively aligning the X-ray beam from the point of originat the anode focal spot, through a series of pinhole aper-
tures, to a pinpoint location on the face of the detector (Fig.4). This alignment technique yielded spectral pulse-heightdistributions with a repeatability of 1–2%.2
AIR KERMA MEASUREMENTS
The Shonka-Wykoff chamber was laser-aligned in thecentral ray 200 cm from the Seifert X-ray tube target forair kerma measurements (Fig. 1). At 200 cm, distance ac-curacy is within 0.25% and the central beam is uniformacross the field of view presented by the ion chamber. Al-though the beam is already well collimated at the beamport exit, a reduction in air scatter of 1–1.5% was realizedwith additional collimation in the form of a lead brick witha 2-cm-diameter central hole placed 135 cm from the anodetarget. This collimation reduced the primary beam diameterat the chamber location from ;20 cm to ;3 cm for a low-scatter arrangement consistent with measurement of onlythe primary beam. Similar measurements were made withthe larger MDH chambers, except that a brick with a 5-cm-diameter hole was used.
Shonka-Wykoff chamber calibration factors were deter-mined for each beam. From NIST calibration, air kermacalibration factors (Gy/C) were known for NIST beamcodes M30, M50, M60, M100, M150 and H150 (18). For
569THICK-TARGET TUNGSTEN X-RAY SPECTRA
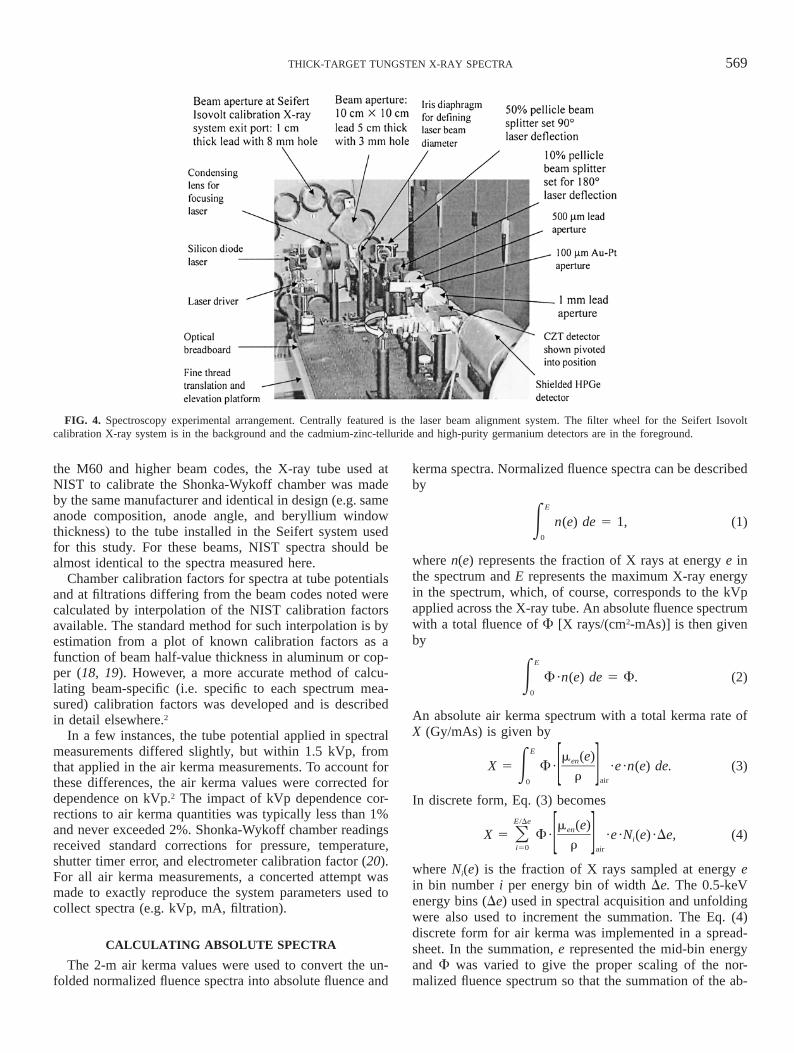
FIG. 4. Spectroscopy experimental arrangement. Centrally featured is the laser beam alignment system. The filter wheel for the Seifert Isovoltcalibration X-ray system is in the background and the cadmium-zinc-telluride and high-purity germanium detectors are in the foreground.
the M60 and higher beam codes, the X-ray tube used atNIST to calibrate the Shonka-Wykoff chamber was madeby the same manufacturer and identical in design (e.g. sameanode composition, anode angle, and beryllium windowthickness) to the tube installed in the Seifert system usedfor this study. For these beams, NIST spectra should bealmost identical to the spectra measured here.
Chamber calibration factors for spectra at tube potentialsand at filtrations differing from the beam codes noted werecalculated by interpolation of the NIST calibration factorsavailable. The standard method for such interpolation is byestimation from a plot of known calibration factors as afunction of beam half-value thickness in aluminum or cop-per (18, 19). However, a more accurate method of calcu-lating beam-specific (i.e. specific to each spectrum mea-sured) calibration factors was developed and is describedin detail elsewhere.2
In a few instances, the tube potential applied in spectralmeasurements differed slightly, but within 1.5 kVp, fromthat applied in the air kerma measurements. To account forthese differences, the air kerma values were corrected fordependence on kVp.2 The impact of kVp dependence cor-rections to air kerma quantities was typically less than 1%and never exceeded 2%. Shonka-Wykoff chamber readingsreceived standard corrections for pressure, temperature,shutter timer error, and electrometer calibration factor (20).For all air kerma measurements, a concerted attempt wasmade to exactly reproduce the system parameters used tocollect spectra (e.g. kVp, mA, filtration).
CALCULATING ABSOLUTE SPECTRA
The 2-m air kerma values were used to convert the un-folded normalized fluence spectra into absolute fluence and
kerma spectra. Normalized fluence spectra can be describedby
E
n(e) de 5 1, (1)E0
where n(e) represents the fraction of X rays at energy e inthe spectrum and E represents the maximum X-ray energyin the spectrum, which, of course, corresponds to the kVpapplied across the X-ray tube. An absolute fluence spectrumwith a total fluence of F [X rays/(cm2-mAs)] is then givenby
E
F ·n(e) de 5 F. (2)E0
An absolute air kerma spectrum with a total kerma rate ofX (Gy/mAs) is given by
E m (e)enX 5 F · ·e ·n(e) de. (3)E [ ]r air0
In discrete form, Eq. (3) becomesE/De m (e)enX 5 F · ·e ·N (e) ·De, (4)O i[ ]ri50 air
where Ni(e) is the fraction of X rays sampled at energy ein bin number i per energy bin of width De. The 0.5-keVenergy bins (De) used in spectral acquisition and unfoldingwere also used to increment the summation. The Eq. (4)discrete form for air kerma was implemented in a spread-sheet. In the summation, e represented the mid-bin energyand F was varied to give the proper scaling of the nor-malized fluence spectrum so that the summation of the ab-
570 MERCIER ET AL.
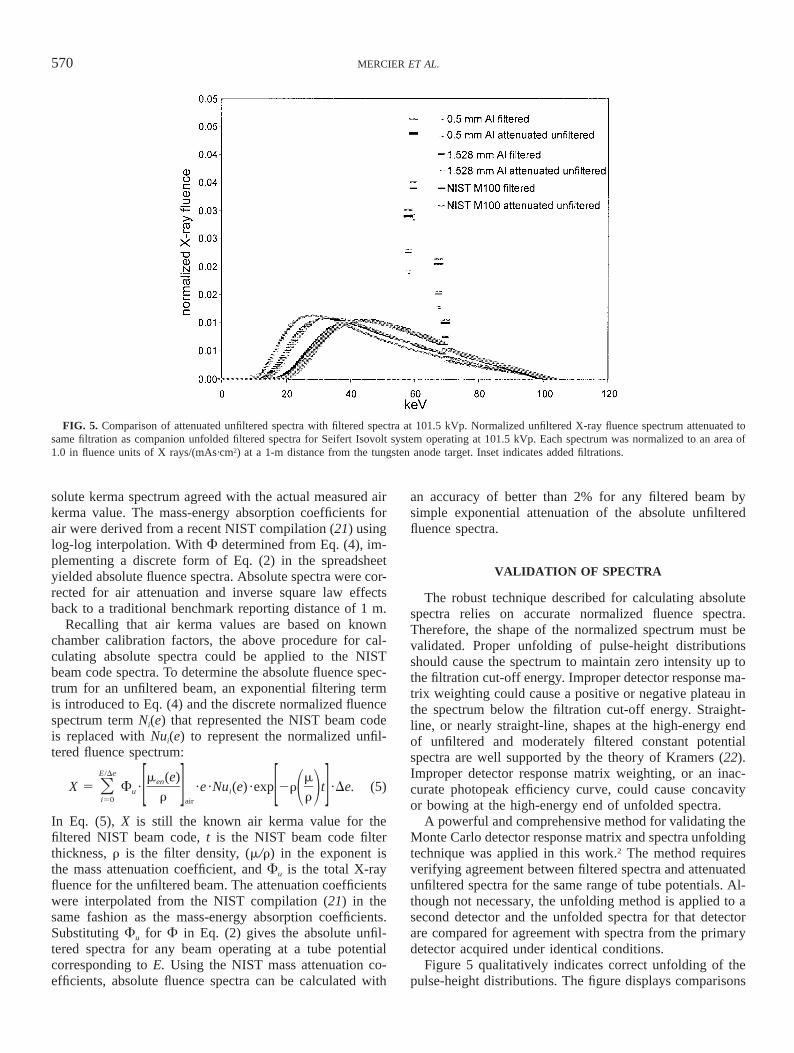
FIG. 5. Comparison of attenuated unfiltered spectra with filtered spectra at 101.5 kVp. Normalized unfiltered X-ray fluence spectrum attenuated tosame filtration as companion unfolded filtered spectra for Seifert Isovolt system operating at 101.5 kVp. Each spectrum was normalized to an area of1.0 in fluence units of X rays/(mAs·cm2) at a 1-m distance from the tungsten anode target. Inset indicates added filtrations.
solute kerma spectrum agreed with the actual measured airkerma value. The mass-energy absorption coefficients forair were derived from a recent NIST compilation (21) usinglog-log interpolation. With F determined from Eq. (4), im-plementing a discrete form of Eq. (2) in the spreadsheetyielded absolute fluence spectra. Absolute spectra were cor-rected for air attenuation and inverse square law effectsback to a traditional benchmark reporting distance of 1 m.
Recalling that air kerma values are based on knownchamber calibration factors, the above procedure for cal-culating absolute spectra could be applied to the NISTbeam code spectra. To determine the absolute fluence spec-trum for an unfiltered beam, an exponential filtering termis introduced to Eq. (4) and the discrete normalized fluencespectrum term Ni(e) that represented the NIST beam codeis replaced with Nui(e) to represent the normalized unfil-tered fluence spectrum:
E/De m (e) menX 5 F · ·e ·Nu (e) ·exp 2r t ·De. (5)O u i 1 2[ ] [ ]r ri50 air
In Eq. (5), X is still the known air kerma value for thefiltered NIST beam code, t is the NIST beam code filterthickness, r is the filter density, (m/r) in the exponent isthe mass attenuation coefficient, and Fu is the total X-rayfluence for the unfiltered beam. The attenuation coefficientswere interpolated from the NIST compilation (21) in thesame fashion as the mass-energy absorption coefficients.Substituting Fu for F in Eq. (2) gives the absolute unfil-tered spectra for any beam operating at a tube potentialcorresponding to E. Using the NIST mass attenuation co-efficients, absolute fluence spectra can be calculated with
an accuracy of better than 2% for any filtered beam bysimple exponential attenuation of the absolute unfilteredfluence spectra.
VALIDATION OF SPECTRA
The robust technique described for calculating absolutespectra relies on accurate normalized fluence spectra.Therefore, the shape of the normalized spectrum must bevalidated. Proper unfolding of pulse-height distributionsshould cause the spectrum to maintain zero intensity up tothe filtration cut-off energy. Improper detector response ma-trix weighting could cause a positive or negative plateau inthe spectrum below the filtration cut-off energy. Straight-line, or nearly straight-line, shapes at the high-energy endof unfiltered and moderately filtered constant potentialspectra are well supported by the theory of Kramers (22).Improper detector response matrix weighting, or an inac-curate photopeak efficiency curve, could cause concavityor bowing at the high-energy end of unfolded spectra.
A powerful and comprehensive method for validating theMonte Carlo detector response matrix and spectra unfoldingtechnique was applied in this work.2 The method requiresverifying agreement between filtered spectra and attenuatedunfiltered spectra for the same range of tube potentials. Al-though not necessary, the unfolding method is applied to asecond detector and the unfolded spectra for that detectorare compared for agreement with spectra from the primarydetector acquired under identical conditions.
Figure 5 qualitatively indicates correct unfolding of thepulse-height distributions. The figure displays comparisons
571THICK-TARGET TUNGSTEN X-RAY SPECTRA
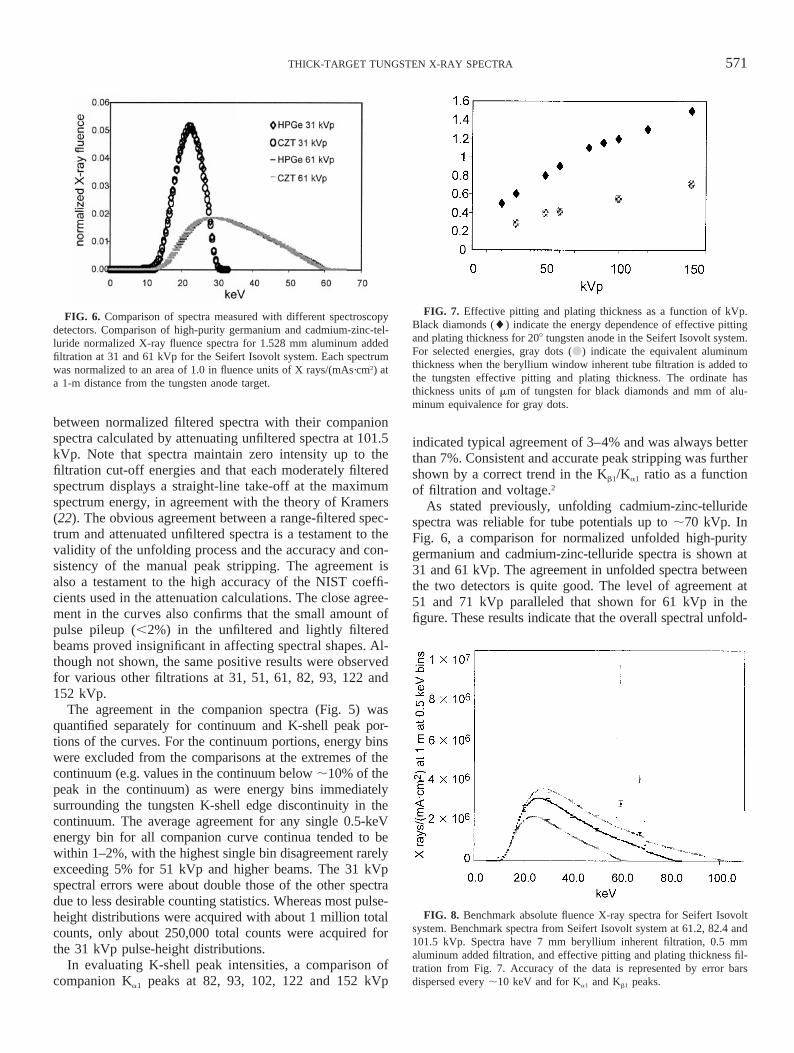
FIG. 6. Comparison of spectra measured with different spectroscopydetectors. Comparison of high-purity germanium and cadmium-zinc-tel-luride normalized X-ray fluence spectra for 1.528 mm aluminum addedfiltration at 31 and 61 kVp for the Seifert Isovolt system. Each spectrumwas normalized to an area of 1.0 in fluence units of X rays/(mAs·cm2) ata 1-m distance from the tungsten anode target.
FIG. 7. Effective pitting and plating thickness as a function of kVp.Black diamonds (l) indicate the energy dependence of effective pittingand plating thickness for 208 tungsten anode in the Seifert Isovolt system.For selected energies, gray dots (v) indicate the equivalent aluminumthickness when the beryllium window inherent tube filtration is added tothe tungsten effective pitting and plating thickness. The ordinate hasthickness units of mm of tungsten for black diamonds and mm of alu-minum equivalence for gray dots.
FIG. 8. Benchmark absolute fluence X-ray spectra for Seifert Isovoltsystem. Benchmark spectra from Seifert Isovolt system at 61.2, 82.4 and101.5 kVp. Spectra have 7 mm beryllium inherent filtration, 0.5 mmaluminum added filtration, and effective pitting and plating thickness fil-tration from Fig. 7. Accuracy of the data is represented by error barsdispersed every ;10 keV and for Ka1 and Kb1 peaks.
between normalized filtered spectra with their companionspectra calculated by attenuating unfiltered spectra at 101.5kVp. Note that spectra maintain zero intensity up to thefiltration cut-off energies and that each moderately filteredspectrum displays a straight-line take-off at the maximumspectrum energy, in agreement with the theory of Kramers(22). The obvious agreement between a range-filtered spec-trum and attenuated unfiltered spectra is a testament to thevalidity of the unfolding process and the accuracy and con-sistency of the manual peak stripping. The agreement isalso a testament to the high accuracy of the NIST coeffi-cients used in the attenuation calculations. The close agree-ment in the curves also confirms that the small amount ofpulse pileup (,2%) in the unfiltered and lightly filteredbeams proved insignificant in affecting spectral shapes. Al-though not shown, the same positive results were observedfor various other filtrations at 31, 51, 61, 82, 93, 122 and152 kVp.
The agreement in the companion spectra (Fig. 5) wasquantified separately for continuum and K-shell peak por-tions of the curves. For the continuum portions, energy binswere excluded from the comparisons at the extremes of thecontinuum (e.g. values in the continuum below ;10% of thepeak in the continuum) as were energy bins immediatelysurrounding the tungsten K-shell edge discontinuity in thecontinuum. The average agreement for any single 0.5-keVenergy bin for all companion curve continua tended to bewithin 1–2%, with the highest single bin disagreement rarelyexceeding 5% for 51 kVp and higher beams. The 31 kVpspectral errors were about double those of the other spectradue to less desirable counting statistics. Whereas most pulse-height distributions were acquired with about 1 million totalcounts, only about 250,000 total counts were acquired forthe 31 kVp pulse-height distributions.
In evaluating K-shell peak intensities, a comparison ofcompanion Ka1 peaks at 82, 93, 102, 122 and 152 kVp
indicated typical agreement of 3–4% and was always betterthan 7%. Consistent and accurate peak stripping was furthershown by a correct trend in the Kb1/Ka1 ratio as a functionof filtration and voltage.2
As stated previously, unfolding cadmium-zinc-telluridespectra was reliable for tube potentials up to ;70 kVp. InFig. 6, a comparison for normalized unfolded high-puritygermanium and cadmium-zinc-telluride spectra is shown at31 and 61 kVp. The agreement in unfolded spectra betweenthe two detectors is quite good. The level of agreement at51 and 71 kVp paralleled that shown for 61 kVp in thefigure. These results indicate that the overall spectral unfold-
572 MERCIER ET AL.
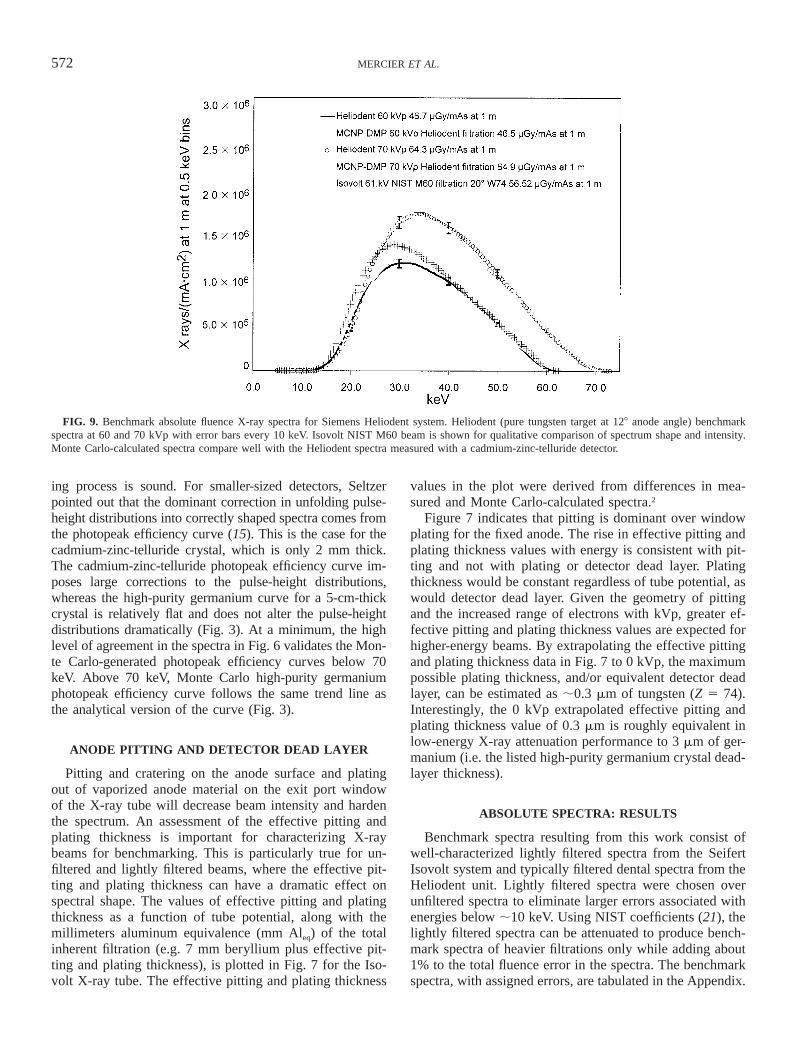
FIG. 9. Benchmark absolute fluence X-ray spectra for Siemens Heliodent system. Heliodent (pure tungsten target at 128 anode angle) benchmarkspectra at 60 and 70 kVp with error bars every 10 keV. Isovolt NIST M60 beam is shown for qualitative comparison of spectrum shape and intensity.Monte Carlo-calculated spectra compare well with the Heliodent spectra measured with a cadmium-zinc-telluride detector.
ing process is sound. For smaller-sized detectors, Seltzerpointed out that the dominant correction in unfolding pulse-height distributions into correctly shaped spectra comes fromthe photopeak efficiency curve (15). This is the case for thecadmium-zinc-telluride crystal, which is only 2 mm thick.The cadmium-zinc-telluride photopeak efficiency curve im-poses large corrections to the pulse-height distributions,whereas the high-purity germanium curve for a 5-cm-thickcrystal is relatively flat and does not alter the pulse-heightdistributions dramatically (Fig. 3). At a minimum, the highlevel of agreement in the spectra in Fig. 6 validates the Mon-te Carlo-generated photopeak efficiency curves below 70keV. Above 70 keV, Monte Carlo high-purity germaniumphotopeak efficiency curve follows the same trend line asthe analytical version of the curve (Fig. 3).
ANODE PITTING AND DETECTOR DEAD LAYER
Pitting and cratering on the anode surface and platingout of vaporized anode material on the exit port windowof the X-ray tube will decrease beam intensity and hardenthe spectrum. An assessment of the effective pitting andplating thickness is important for characterizing X-raybeams for benchmarking. This is particularly true for un-filtered and lightly filtered beams, where the effective pit-ting and plating thickness can have a dramatic effect onspectral shape. The values of effective pitting and platingthickness as a function of tube potential, along with themillimeters aluminum equivalence (mm Aleq) of the totalinherent filtration (e.g. 7 mm beryllium plus effective pit-ting and plating thickness), is plotted in Fig. 7 for the Iso-volt X-ray tube. The effective pitting and plating thickness
values in the plot were derived from differences in mea-sured and Monte Carlo-calculated spectra.2
Figure 7 indicates that pitting is dominant over windowplating for the fixed anode. The rise in effective pitting andplating thickness values with energy is consistent with pit-ting and not with plating or detector dead layer. Platingthickness would be constant regardless of tube potential, aswould detector dead layer. Given the geometry of pittingand the increased range of electrons with kVp, greater ef-fective pitting and plating thickness values are expected forhigher-energy beams. By extrapolating the effective pittingand plating thickness data in Fig. 7 to 0 kVp, the maximumpossible plating thickness, and/or equivalent detector deadlayer, can be estimated as ;0.3 mm of tungsten (Z 5 74).Interestingly, the 0 kVp extrapolated effective pitting andplating thickness value of 0.3 mm is roughly equivalent inlow-energy X-ray attenuation performance to 3 mm of ger-manium (i.e. the listed high-purity germanium crystal dead-layer thickness).
ABSOLUTE SPECTRA: RESULTS
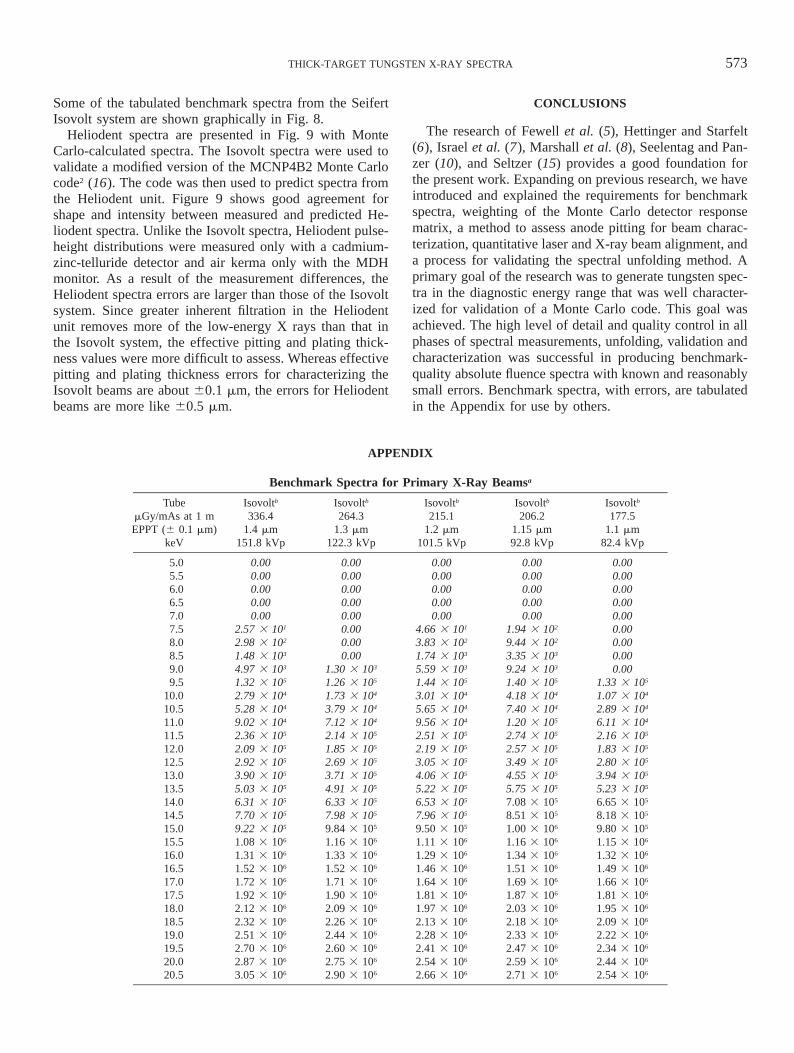
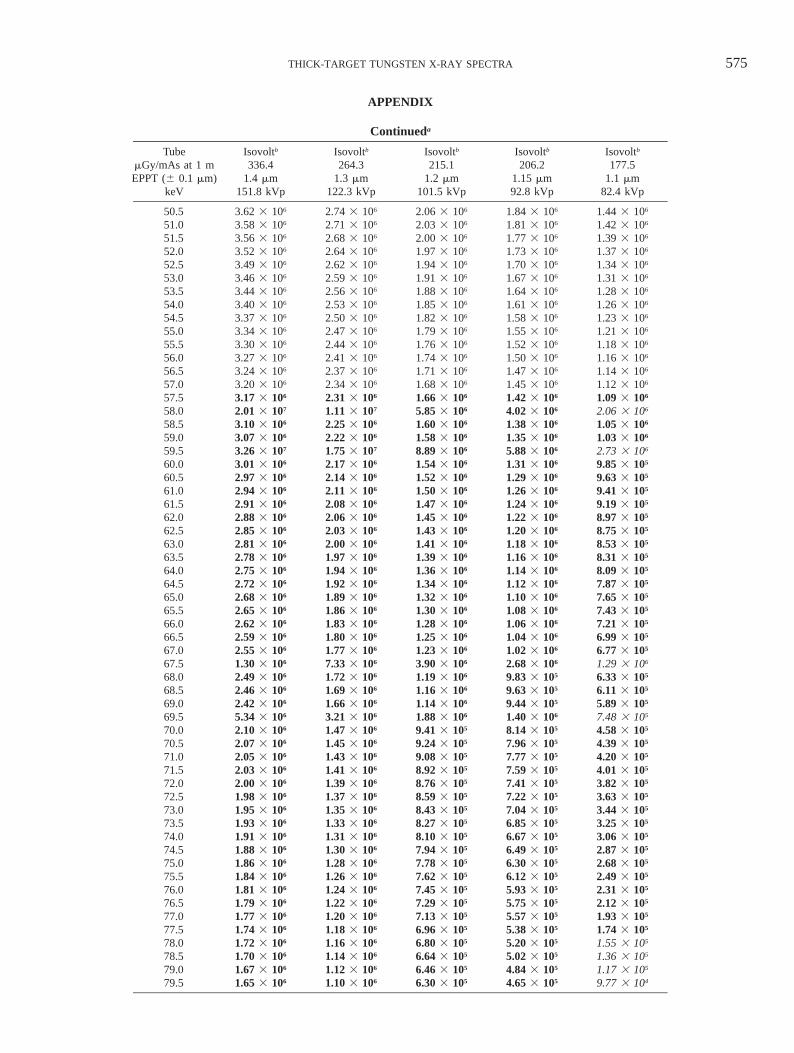
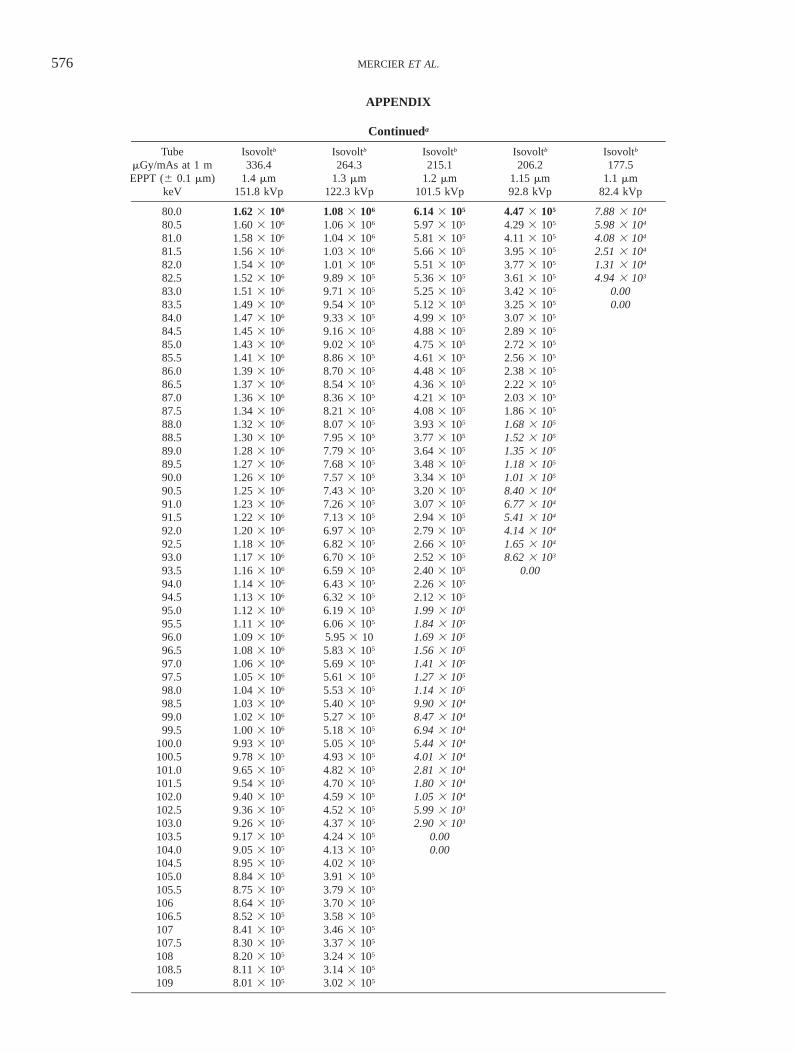
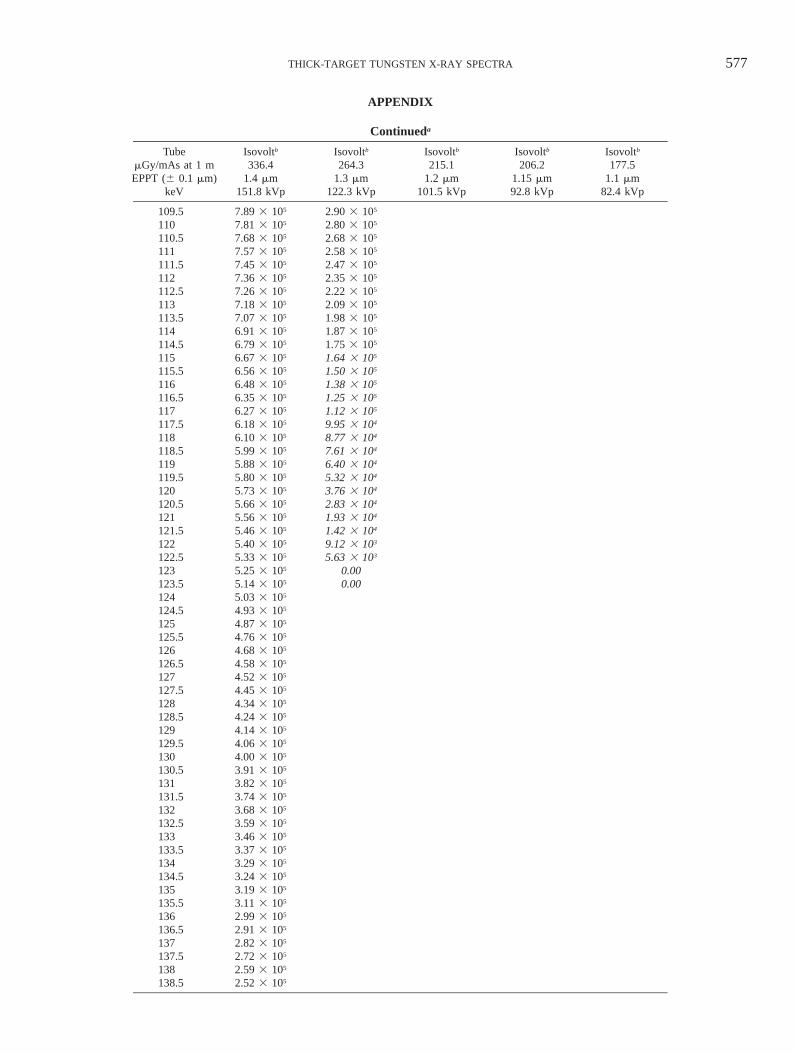
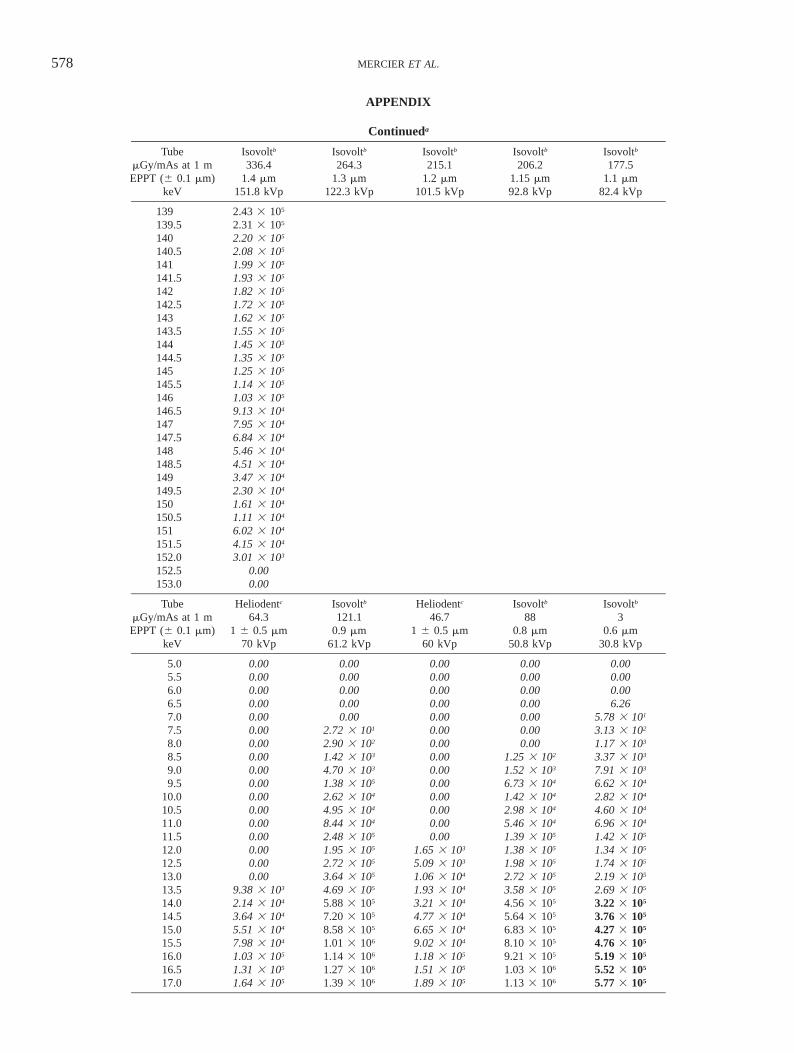
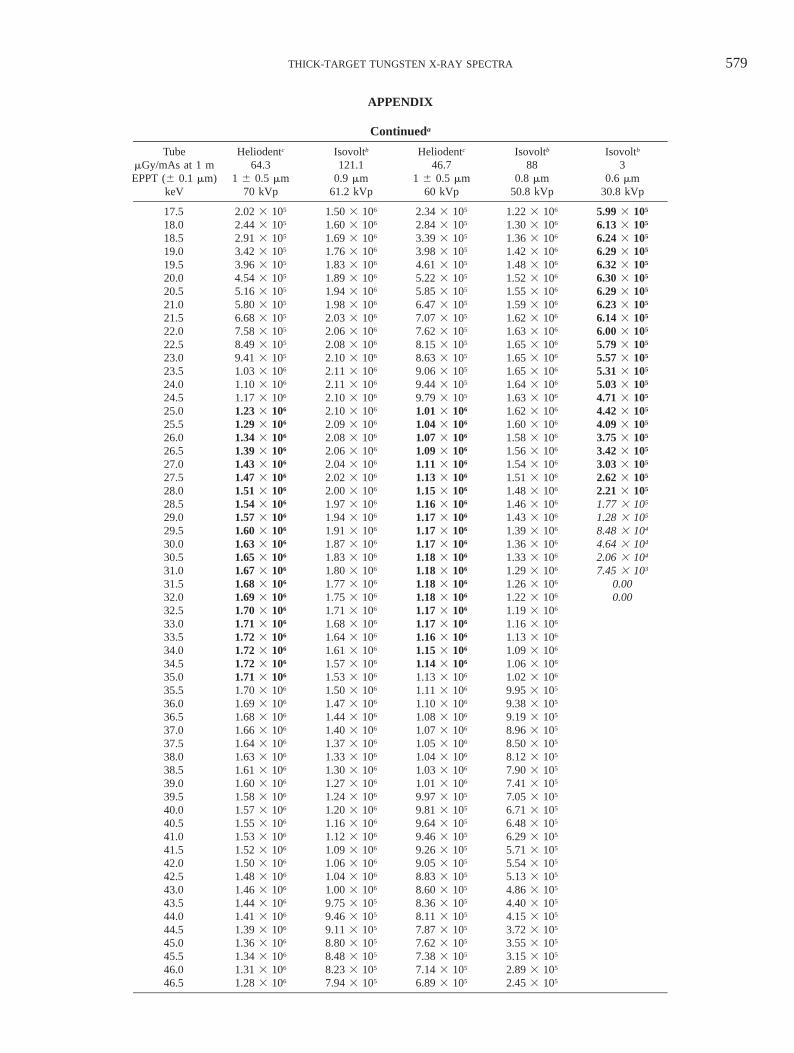
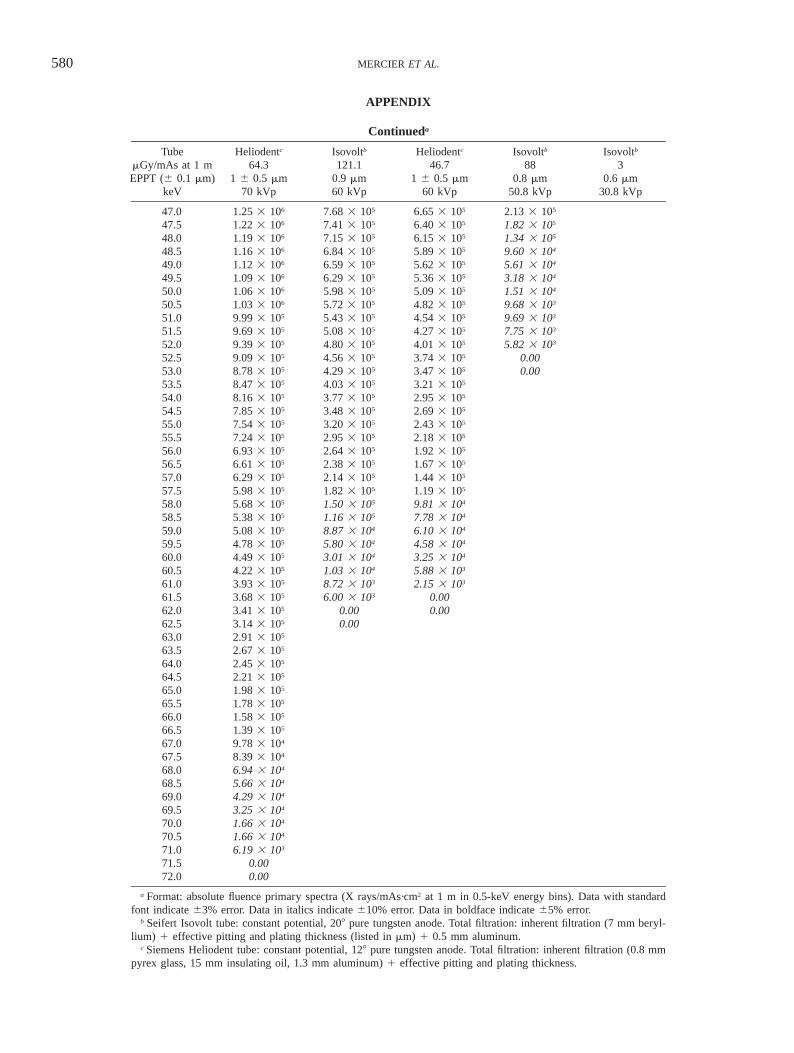
Benchmark spectra resulting from this work consist ofwell-characterized lightly filtered spectra from the SeifertIsovolt system and typically filtered dental spectra from theHeliodent unit. Lightly filtered spectra were chosen overunfiltered spectra to eliminate larger errors associated withenergies below ;10 keV. Using NIST coefficients (21), thelightly filtered spectra can be attenuated to produce bench-mark spectra of heavier filtrations only while adding about1% to the total fluence error in the spectra. The benchmarkspectra, with assigned errors, are tabulated in the Appendix.
573THICK-TARGET TUNGSTEN X-RAY SPECTRA
APPENDIX
Benchmark Spectra for Primary X-Ray Beamsa
TubemGy/mAs at 1 mEPPT (6 0.1 mm)
keV
Isovoltb
336.41.4 mm
151.8 kVp
Isovoltb
264.31.3 mm
122.3 kVp
Isovoltb
215.11.2 mm
101.5 kVp
Isovoltb
206.21.15 mm92.8 kVp
Isovoltb
177.51.1 mm
82.4 kVp
5.0 0.00 0.00 0.00 0.00 0.005.5 0.00 0.00 0.00 0.00 0.006.0 0.00 0.00 0.00 0.00 0.006.5 0.00 0.00 0.00 0.00 0.007.0 0.00 0.00 0.00 0.00 0.007.5 2.57 3 101 0.00 4.66 3 101 1.94 3 102 0.008.0 2.98 3 102 0.00 3.83 3 102 9.44 3 102 0.008.5 1.48 3 103 0.00 1.74 3 103 3.35 3 103 0.009.0 4.97 3 103 1.30 3 103 5.59 3 103 9.24 3 103 0.009.5 1.32 3 105 1.26 3 105 1.44 3 105 1.40 3 105 1.33 3 105
10.0 2.79 3 104 1.73 3 104 3.01 3 104 4.18 3 104 1.07 3 104
10.5 5.28 3 104 3.79 3 104 5.65 3 104 7.40 3 104 2.89 3 104
11.0 9.02 3 104 7.12 3 104 9.56 3 104 1.20 3 105 6.11 3 104
11.5 2.36 3 105 2.14 3 105 2.51 3 105 2.74 3 105 2.16 3 105
12.0 2.09 3 105 1.85 3 105 2.19 3 105 2.57 3 105 1.83 3 105
12.5 2.92 3 105 2.69 3 105 3.05 3 105 3.49 3 105 2.80 3 105
13.0 3.90 3 105 3.71 3 105 4.06 3 105 4.55 3 105 3.94 3 105
13.5 5.03 3 105 4.91 3 105 5.22 3 105 5.75 3 105 5.23 3 105
14.0 6.31 3 105 6.33 3 105 6.53 3 105 7.08 3 105 6.65 3 105
14.5 7.70 3 105 7.98 3 105 7.96 3 105 8.51 3 105 8.18 3 105
15.0 9.22 3 105 9.84 3 105 9.50 3 105 1.00 3 106 9.80 3 105
15.5 1.08 3 106 1.16 3 106 1.11 3 106 1.16 3 106 1.15 3 106
16.0 1.31 3 106 1.33 3 106 1.29 3 106 1.34 3 106 1.32 3 106
16.5 1.52 3 106 1.52 3 106 1.46 3 106 1.51 3 106 1.49 3 106
17.0 1.72 3 106 1.71 3 106 1.64 3 106 1.69 3 106 1.66 3 106
17.5 1.92 3 106 1.90 3 106 1.81 3 106 1.87 3 106 1.81 3 106
18.0 2.12 3 106 2.09 3 106 1.97 3 106 2.03 3 106 1.95 3 106
18.5 2.32 3 106 2.26 3 106 2.13 3 106 2.18 3 106 2.09 3 106
19.0 2.51 3 106 2.44 3 106 2.28 3 106 2.33 3 106 2.22 3 106
19.5 2.70 3 106 2.60 3 106 2.41 3 106 2.47 3 106 2.34 3 106
20.0 2.87 3 106 2.75 3 106 2.54 3 106 2.59 3 106 2.44 3 106
20.5 3.05 3 106 2.90 3 106 2.66 3 106 2.71 3 106 2.54 3 106
Some of the tabulated benchmark spectra from the SeifertIsovolt system are shown graphically in Fig. 8.
Heliodent spectra are presented in Fig. 9 with MonteCarlo-calculated spectra. The Isovolt spectra were used tovalidate a modified version of the MCNP4B2 Monte Carlocode2 (16). The code was then used to predict spectra fromthe Heliodent unit. Figure 9 shows good agreement forshape and intensity between measured and predicted He-liodent spectra. Unlike the Isovolt spectra, Heliodent pulse-height distributions were measured only with a cadmium-zinc-telluride detector and air kerma only with the MDHmonitor. As a result of the measurement differences, theHeliodent spectra errors are larger than those of the Isovoltsystem. Since greater inherent filtration in the Heliodentunit removes more of the low-energy X rays than that inthe Isovolt system, the effective pitting and plating thick-ness values were more difficult to assess. Whereas effectivepitting and plating thickness errors for characterizing theIsovolt beams are about 60.1 mm, the errors for Heliodentbeams are more like 60.5 mm.
CONCLUSIONS
The research of Fewell et al. (5), Hettinger and Starfelt(6), Israel et al. (7), Marshall et al. (8), Seelentag and Pan-zer (10), and Seltzer (15) provides a good foundation forthe present work. Expanding on previous research, we haveintroduced and explained the requirements for benchmarkspectra, weighting of the Monte Carlo detector responsematrix, a method to assess anode pitting for beam charac-terization, quantitative laser and X-ray beam alignment, anda process for validating the spectral unfolding method. Aprimary goal of the research was to generate tungsten spec-tra in the diagnostic energy range that was well character-ized for validation of a Monte Carlo code. This goal wasachieved. The high level of detail and quality control in allphases of spectral measurements, unfolding, validation andcharacterization was successful in producing benchmark-quality absolute fluence spectra with known and reasonablysmall errors. Benchmark spectra, with errors, are tabulatedin the Appendix for use by others.
574 MERCIER ET AL.
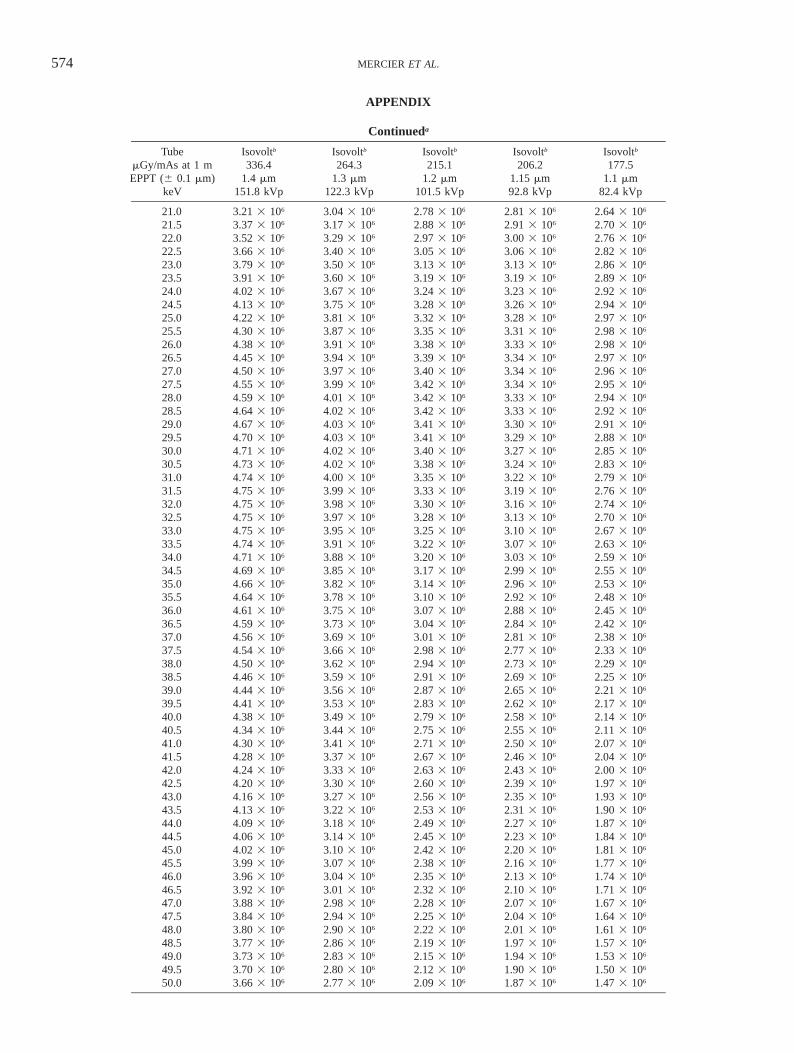
APPENDIX
Continueda
TubemGy/mAs at 1 mEPPT (6 0.1 mm)
keV
Isovoltb
336.41.4 mm
151.8 kVp
Isovoltb
264.31.3 mm
122.3 kVp
Isovoltb
215.11.2 mm
101.5 kVp
Isovoltb
206.21.15 mm92.8 kVp
Isovoltb
177.51.1 mm
82.4 kVp
21.0 3.21 3 106 3.04 3 106 2.78 3 106 2.81 3 106 2.64 3 106
21.5 3.37 3 106 3.17 3 106 2.88 3 106 2.91 3 106 2.70 3 106
22.0 3.52 3 106 3.29 3 106 2.97 3 106 3.00 3 106 2.76 3 106
22.5 3.66 3 106 3.40 3 106 3.05 3 106 3.06 3 106 2.82 3 106
23.0 3.79 3 106 3.50 3 106 3.13 3 106 3.13 3 106 2.86 3 106
23.5 3.91 3 106 3.60 3 106 3.19 3 106 3.19 3 106 2.89 3 106
24.0 4.02 3 106 3.67 3 106 3.24 3 106 3.23 3 106 2.92 3 106
24.5 4.13 3 106 3.75 3 106 3.28 3 106 3.26 3 106 2.94 3 106
25.0 4.22 3 106 3.81 3 106 3.32 3 106 3.28 3 106 2.97 3 106
25.5 4.30 3 106 3.87 3 106 3.35 3 106 3.31 3 106 2.98 3 106
26.0 4.38 3 106 3.91 3 106 3.38 3 106 3.33 3 106 2.98 3 106
26.5 4.45 3 106 3.94 3 106 3.39 3 106 3.34 3 106 2.97 3 106
27.0 4.50 3 106 3.97 3 106 3.40 3 106 3.34 3 106 2.96 3 106
27.5 4.55 3 106 3.99 3 106 3.42 3 106 3.34 3 106 2.95 3 106
28.0 4.59 3 106 4.01 3 106 3.42 3 106 3.33 3 106 2.94 3 106
28.5 4.64 3 106 4.02 3 106 3.42 3 106 3.33 3 106 2.92 3 106
29.0 4.67 3 106 4.03 3 106 3.41 3 106 3.30 3 106 2.91 3 106
29.5 4.70 3 106 4.03 3 106 3.41 3 106 3.29 3 106 2.88 3 106
30.0 4.71 3 106 4.02 3 106 3.40 3 106 3.27 3 106 2.85 3 106
30.5 4.73 3 106 4.02 3 106 3.38 3 106 3.24 3 106 2.83 3 106
31.0 4.74 3 106 4.00 3 106 3.35 3 106 3.22 3 106 2.79 3 106
31.5 4.75 3 106 3.99 3 106 3.33 3 106 3.19 3 106 2.76 3 106
32.0 4.75 3 106 3.98 3 106 3.30 3 106 3.16 3 106 2.74 3 106
32.5 4.75 3 106 3.97 3 106 3.28 3 106 3.13 3 106 2.70 3 106
33.0 4.75 3 106 3.95 3 106 3.25 3 106 3.10 3 106 2.67 3 106
33.5 4.74 3 106 3.91 3 106 3.22 3 106 3.07 3 106 2.63 3 106
34.0 4.71 3 106 3.88 3 106 3.20 3 106 3.03 3 106 2.59 3 106
34.5 4.69 3 106 3.85 3 106 3.17 3 106 2.99 3 106 2.55 3 106
35.0 4.66 3 106 3.82 3 106 3.14 3 106 2.96 3 106 2.53 3 106
35.5 4.64 3 106 3.78 3 106 3.10 3 106 2.92 3 106 2.48 3 106
36.0 4.61 3 106 3.75 3 106 3.07 3 106 2.88 3 106 2.45 3 106
36.5 4.59 3 106 3.73 3 106 3.04 3 106 2.84 3 106 2.42 3 106
37.0 4.56 3 106 3.69 3 106 3.01 3 106 2.81 3 106 2.38 3 106
37.5 4.54 3 106 3.66 3 106 2.98 3 106 2.77 3 106 2.33 3 106
38.0 4.50 3 106 3.62 3 106 2.94 3 106 2.73 3 106 2.29 3 106
38.5 4.46 3 106 3.59 3 106 2.91 3 106 2.69 3 106 2.25 3 106
39.0 4.44 3 106 3.56 3 106 2.87 3 106 2.65 3 106 2.21 3 106
39.5 4.41 3 106 3.53 3 106 2.83 3 106 2.62 3 106 2.17 3 106
40.0 4.38 3 106 3.49 3 106 2.79 3 106 2.58 3 106 2.14 3 106
40.5 4.34 3 106 3.44 3 106 2.75 3 106 2.55 3 106 2.11 3 106
41.0 4.30 3 106 3.41 3 106 2.71 3 106 2.50 3 106 2.07 3 106
41.5 4.28 3 106 3.37 3 106 2.67 3 106 2.46 3 106 2.04 3 106
42.0 4.24 3 106 3.33 3 106 2.63 3 106 2.43 3 106 2.00 3 106
42.5 4.20 3 106 3.30 3 106 2.60 3 106 2.39 3 106 1.97 3 106
43.0 4.16 3 106 3.27 3 106 2.56 3 106 2.35 3 106 1.93 3 106
43.5 4.13 3 106 3.22 3 106 2.53 3 106 2.31 3 106 1.90 3 106
44.0 4.09 3 106 3.18 3 106 2.49 3 106 2.27 3 106 1.87 3 106
44.5 4.06 3 106 3.14 3 106 2.45 3 106 2.23 3 106 1.84 3 106
45.0 4.02 3 106 3.10 3 106 2.42 3 106 2.20 3 106 1.81 3 106
45.5 3.99 3 106 3.07 3 106 2.38 3 106 2.16 3 106 1.77 3 106
46.0 3.96 3 106 3.04 3 106 2.35 3 106 2.13 3 106 1.74 3 106
46.5 3.92 3 106 3.01 3 106 2.32 3 106 2.10 3 106 1.71 3 106
47.0 3.88 3 106 2.98 3 106 2.28 3 106 2.07 3 106 1.67 3 106
47.5 3.84 3 106 2.94 3 106 2.25 3 106 2.04 3 106 1.64 3 106
48.0 3.80 3 106 2.90 3 106 2.22 3 106 2.01 3 106 1.61 3 106
48.5 3.77 3 106 2.86 3 106 2.19 3 106 1.97 3 106 1.57 3 106
49.0 3.73 3 106 2.83 3 106 2.15 3 106 1.94 3 106 1.53 3 106
49.5 3.70 3 106 2.80 3 106 2.12 3 106 1.90 3 106 1.50 3 106
50.0 3.66 3 106 2.77 3 106 2.09 3 106 1.87 3 106 1.47 3 106
575THICK-TARGET TUNGSTEN X-RAY SPECTRA
APPENDIX
Continueda
TubemGy/mAs at 1 mEPPT (6 0.1 mm)
keV
Isovoltb
336.41.4 mm
151.8 kVp
Isovoltb
264.31.3 mm
122.3 kVp
Isovoltb
215.11.2 mm
101.5 kVp
Isovoltb
206.21.15 mm92.8 kVp
Isovoltb
177.51.1 mm
82.4 kVp
50.5 3.62 3 106 2.74 3 106 2.06 3 106 1.84 3 106 1.44 3 106
51.0 3.58 3 106 2.71 3 106 2.03 3 106 1.81 3 106 1.42 3 106
51.5 3.56 3 106 2.68 3 106 2.00 3 106 1.77 3 106 1.39 3 106
52.0 3.52 3 106 2.64 3 106 1.97 3 106 1.73 3 106 1.37 3 106
52.5 3.49 3 106 2.62 3 106 1.94 3 106 1.70 3 106 1.34 3 106
53.0 3.46 3 106 2.59 3 106 1.91 3 106 1.67 3 106 1.31 3 106
53.5 3.44 3 106 2.56 3 106 1.88 3 106 1.64 3 106 1.28 3 106
54.0 3.40 3 106 2.53 3 106 1.85 3 106 1.61 3 106 1.26 3 106
54.5 3.37 3 106 2.50 3 106 1.82 3 106 1.58 3 106 1.23 3 106
55.0 3.34 3 106 2.47 3 106 1.79 3 106 1.55 3 106 1.21 3 106
55.5 3.30 3 106 2.44 3 106 1.76 3 106 1.52 3 106 1.18 3 106
56.0 3.27 3 106 2.41 3 106 1.74 3 106 1.50 3 106 1.16 3 106
56.5 3.24 3 106 2.37 3 106 1.71 3 106 1.47 3 106 1.14 3 106
57.0 3.20 3 106 2.34 3 106 1.68 3 106 1.45 3 106 1.12 3 106
57.5 3.17 3 106 2.31 3 106 1.66 3 106 1.42 3 106 1.09 3 106
58.0 2.01 3 107 1.11 3 107 5.85 3 106 4.02 3 106 2.06 3 106
58.5 3.10 3 106 2.25 3 106 1.60 3 106 1.38 3 106 1.05 3 106
59.0 3.07 3 106 2.22 3 106 1.58 3 106 1.35 3 106 1.03 3 106
59.5 3.26 3 107 1.75 3 107 8.89 3 106 5.88 3 106 2.73 3 106
60.0 3.01 3 106 2.17 3 106 1.54 3 106 1.31 3 106 9.85 3 105
60.5 2.97 3 106 2.14 3 106 1.52 3 106 1.29 3 106 9.63 3 105
61.0 2.94 3 106 2.11 3 106 1.50 3 106 1.26 3 106 9.41 3 105
61.5 2.91 3 106 2.08 3 106 1.47 3 106 1.24 3 106 9.19 3 105
62.0 2.88 3 106 2.06 3 106 1.45 3 106 1.22 3 106 8.97 3 105
62.5 2.85 3 106 2.03 3 106 1.43 3 106 1.20 3 106 8.75 3 105
63.0 2.81 3 106 2.00 3 106 1.41 3 106 1.18 3 106 8.53 3 105
63.5 2.78 3 106 1.97 3 106 1.39 3 106 1.16 3 106 8.31 3 105
64.0 2.75 3 106 1.94 3 106 1.36 3 106 1.14 3 106 8.09 3 105
64.5 2.72 3 106 1.92 3 106 1.34 3 106 1.12 3 106 7.87 3 105
65.0 2.68 3 106 1.89 3 106 1.32 3 106 1.10 3 106 7.65 3 105
65.5 2.65 3 106 1.86 3 106 1.30 3 106 1.08 3 106 7.43 3 105
66.0 2.62 3 106 1.83 3 106 1.28 3 106 1.06 3 106 7.21 3 105
66.5 2.59 3 106 1.80 3 106 1.25 3 106 1.04 3 106 6.99 3 105
67.0 2.55 3 106 1.77 3 106 1.23 3 106 1.02 3 106 6.77 3 105
67.5 1.30 3 106 7.33 3 106 3.90 3 106 2.68 3 106 1.29 3 106
68.0 2.49 3 106 1.72 3 106 1.19 3 106 9.83 3 105 6.33 3 105
68.5 2.46 3 106 1.69 3 106 1.16 3 106 9.63 3 105 6.11 3 105
69.0 2.42 3 106 1.66 3 106 1.14 3 106 9.44 3 105 5.89 3 105
69.5 5.34 3 106 3.21 3 106 1.88 3 106 1.40 3 106 7.48 3 105
70.0 2.10 3 106 1.47 3 106 9.41 3 105 8.14 3 105 4.58 3 105
70.5 2.07 3 106 1.45 3 106 9.24 3 105 7.96 3 105 4.39 3 105
71.0 2.05 3 106 1.43 3 106 9.08 3 105 7.77 3 105 4.20 3 105
71.5 2.03 3 106 1.41 3 106 8.92 3 105 7.59 3 105 4.01 3 105
72.0 2.00 3 106 1.39 3 106 8.76 3 105 7.41 3 105 3.82 3 105
72.5 1.98 3 106 1.37 3 106 8.59 3 105 7.22 3 105 3.63 3 105
73.0 1.95 3 106 1.35 3 106 8.43 3 105 7.04 3 105 3.44 3 105
73.5 1.93 3 106 1.33 3 106 8.27 3 105 6.85 3 105 3.25 3 105
74.0 1.91 3 106 1.31 3 106 8.10 3 105 6.67 3 105 3.06 3 105
74.5 1.88 3 106 1.30 3 106 7.94 3 105 6.49 3 105 2.87 3 105
75.0 1.86 3 106 1.28 3 106 7.78 3 105 6.30 3 105 2.68 3 105
75.5 1.84 3 106 1.26 3 106 7.62 3 105 6.12 3 105 2.49 3 105
76.0 1.81 3 106 1.24 3 106 7.45 3 105 5.93 3 105 2.31 3 105
76.5 1.79 3 106 1.22 3 106 7.29 3 105 5.75 3 105 2.12 3 105
77.0 1.77 3 106 1.20 3 106 7.13 3 105 5.57 3 105 1.93 3 105
77.5 1.74 3 106 1.18 3 106 6.96 3 105 5.38 3 105 1.74 3 105
78.0 1.72 3 106 1.16 3 106 6.80 3 105 5.20 3 105 1.55 3 105
78.5 1.70 3 106 1.14 3 106 6.64 3 105 5.02 3 105 1.36 3 105
79.0 1.67 3 106 1.12 3 106 6.46 3 105 4.84 3 105 1.17 3 105
79.5 1.65 3 106 1.10 3 106 6.30 3 105 4.65 3 105 9.77 3 104
576 MERCIER ET AL.
APPENDIX
Continueda
TubemGy/mAs at 1 mEPPT (6 0.1 mm)
keV
Isovoltb
336.41.4 mm
151.8 kVp
Isovoltb
264.31.3 mm
122.3 kVp
Isovoltb
215.11.2 mm
101.5 kVp
Isovoltb
206.21.15 mm92.8 kVp
Isovoltb
177.51.1 mm
82.4 kVp
80.0 1.62 3 106 1.08 3 106 6.14 3 105 4.47 3 105 7.88 3 104
80.5 1.60 3 106 1.06 3 106 5.97 3 105 4.29 3 105 5.98 3 104
81.0 1.58 3 106 1.04 3 106 5.81 3 105 4.11 3 105 4.08 3 104
81.5 1.56 3 106 1.03 3 106 5.66 3 105 3.95 3 105 2.51 3 104
82.0 1.54 3 106 1.01 3 106 5.51 3 105 3.77 3 105 1.31 3 104
82.5 1.52 3 106 9.89 3 105 5.36 3 105 3.61 3 105 4.94 3 103
83.0 1.51 3 106 9.71 3 105 5.25 3 105 3.42 3 105 0.0083.5 1.49 3 106 9.54 3 105 5.12 3 105 3.25 3 105 0.0084.0 1.47 3 106 9.33 3 105 4.99 3 105 3.07 3 105
84.5 1.45 3 106 9.16 3 105 4.88 3 105 2.89 3 105
85.0 1.43 3 106 9.02 3 105 4.75 3 105 2.72 3 105
85.5 1.41 3 106 8.86 3 105 4.61 3 105 2.56 3 105
86.0 1.39 3 106 8.70 3 105 4.48 3 105 2.38 3 105
86.5 1.37 3 106 8.54 3 105 4.36 3 105 2.22 3 105
87.0 1.36 3 106 8.36 3 105 4.21 3 105 2.03 3 105
87.5 1.34 3 106 8.21 3 105 4.08 3 105 1.86 3 105
88.0 1.32 3 106 8.07 3 105 3.93 3 105 1.68 3 105
88.5 1.30 3 106 7.95 3 105 3.77 3 105 1.52 3 105
89.0 1.28 3 106 7.79 3 105 3.64 3 105 1.35 3 105
89.5 1.27 3 106 7.68 3 105 3.48 3 105 1.18 3 105
90.0 1.26 3 106 7.57 3 105 3.34 3 105 1.01 3 105
90.5 1.25 3 106 7.43 3 105 3.20 3 105 8.40 3 104
91.0 1.23 3 106 7.26 3 105 3.07 3 105 6.77 3 104
91.5 1.22 3 106 7.13 3 105 2.94 3 105 5.41 3 104
92.0 1.20 3 106 6.97 3 105 2.79 3 105 4.14 3 104
92.5 1.18 3 106 6.82 3 105 2.66 3 105 1.65 3 104
93.0 1.17 3 106 6.70 3 105 2.52 3 105 8.62 3 103
93.5 1.16 3 106 6.59 3 105 2.40 3 105 0.0094.0 1.14 3 106 6.43 3 105 2.26 3 105
94.5 1.13 3 106 6.32 3 105 2.12 3 105
95.0 1.12 3 106 6.19 3 105 1.99 3 105
95.5 1.11 3 106 6.06 3 105 1.84 3 105
96.0 1.09 3 106 5.95 3 10 1.69 3 105
96.5 1.08 3 106 5.83 3 105 1.56 3 105
97.0 1.06 3 106 5.69 3 105 1.41 3 105
97.5 1.05 3 106 5.61 3 105 1.27 3 105
98.0 1.04 3 106 5.53 3 105 1.14 3 105
98.5 1.03 3 106 5.40 3 105 9.90 3 104
99.0 1.02 3 106 5.27 3 105 8.47 3 104
99.5 1.00 3 106 5.18 3 105 6.94 3 104
100.0 9.93 3 105 5.05 3 105 5.44 3 104
100.5 9.78 3 105 4.93 3 105 4.01 3 104
101.0 9.65 3 105 4.82 3 105 2.81 3 104
101.5 9.54 3 105 4.70 3 105 1.80 3 104
102.0 9.40 3 105 4.59 3 105 1.05 3 104
102.5 9.36 3 105 4.52 3 105 5.99 3 103
103.0 9.26 3 105 4.37 3 105 2.90 3 103
103.5 9.17 3 105 4.24 3 105 0.00104.0 9.05 3 105 4.13 3 105 0.00104.5 8.95 3 105 4.02 3 105
105.0 8.84 3 105 3.91 3 105
105.5 8.75 3 105 3.79 3 105
106 8.64 3 105 3.70 3 105
106.5 8.52 3 105 3.58 3 105
107 8.41 3 105 3.46 3 105
107.5 8.30 3 105 3.37 3 105
108 8.20 3 105 3.24 3 105
108.5 8.11 3 105 3.14 3 105
109 8.01 3 105 3.02 3 105
577THICK-TARGET TUNGSTEN X-RAY SPECTRA
APPENDIX
Continueda
TubemGy/mAs at 1 mEPPT (6 0.1 mm)
keV
Isovoltb
336.41.4 mm
151.8 kVp
Isovoltb
264.31.3 mm
122.3 kVp
Isovoltb
215.11.2 mm
101.5 kVp
Isovoltb
206.21.15 mm92.8 kVp
Isovoltb
177.51.1 mm
82.4 kVp
109.5 7.89 3 105 2.90 3 105
110 7.81 3 105 2.80 3 105
110.5 7.68 3 105 2.68 3 105
111 7.57 3 105 2.58 3 105
111.5 7.45 3 105 2.47 3 105
112 7.36 3 105 2.35 3 105
112.5 7.26 3 105 2.22 3 105
113 7.18 3 105 2.09 3 105
113.5 7.07 3 105 1.98 3 105
114 6.91 3 105 1.87 3 105
114.5 6.79 3 105 1.75 3 105
115 6.67 3 105 1.64 3 105
115.5 6.56 3 105 1.50 3 105
116 6.48 3 105 1.38 3 105
116.5 6.35 3 105 1.25 3 105
117 6.27 3 105 1.12 3 105
117.5 6.18 3 105 9.95 3 104
118 6.10 3 105 8.77 3 104
118.5 5.99 3 105 7.61 3 104
119 5.88 3 105 6.40 3 104
119.5 5.80 3 105 5.32 3 104
120 5.73 3 105 3.76 3 104
120.5 5.66 3 105 2.83 3 104
121 5.56 3 105 1.93 3 104
121.5 5.46 3 105 1.42 3 104
122 5.40 3 105 9.12 3 103
122.5 5.33 3 105 5.63 3 103
123 5.25 3 105 0.00123.5 5.14 3 105 0.00124 5.03 3 105
124.5 4.93 3 105
125 4.87 3 105
125.5 4.76 3 105
126 4.68 3 105
126.5 4.58 3 105
127 4.52 3 105
127.5 4.45 3 105
128 4.34 3 105
128.5 4.24 3 105
129 4.14 3 105
129.5 4.06 3 105
130 4.00 3 105
130.5 3.91 3 105
131 3.82 3 105
131.5 3.74 3 105
132 3.68 3 105
132.5 3.59 3 105
133 3.46 3 105
133.5 3.37 3 105
134 3.29 3 105
134.5 3.24 3 105
135 3.19 3 105
135.5 3.11 3 105
136 2.99 3 105
136.5 2.91 3 105
137 2.82 3 105
137.5 2.72 3 105
138 2.59 3 105
138.5 2.52 3 105
578 MERCIER ET AL.
APPENDIX
Continueda
TubemGy/mAs at 1 mEPPT (6 0.1 mm)
keV
Isovoltb
336.41.4 mm
151.8 kVp
Isovoltb
264.31.3 mm
122.3 kVp
Isovoltb
215.11.2 mm
101.5 kVp
Isovoltb
206.21.15 mm92.8 kVp
Isovoltb
177.51.1 mm
82.4 kVp
139 2.43 3 105
139.5 2.31 3 105
140 2.20 3 105
140.5 2.08 3 105
141 1.99 3 105
141.5 1.93 3 105
142 1.82 3 105
142.5 1.72 3 105
143 1.62 3 105
143.5 1.55 3 105
144 1.45 3 105
144.5 1.35 3 105
145 1.25 3 105
145.5 1.14 3 105
146 1.03 3 105
146.5 9.13 3 104
147 7.95 3 104
147.5 6.84 3 104
148 5.46 3 104
148.5 4.51 3 104
149 3.47 3 104
149.5 2.30 3 104
150 1.61 3 104
150.5 1.11 3 104
151 6.02 3 104
151.5 4.15 3 104
152.0 3.01 3 103
152.5 0.00153.0 0.00
TubemGy/mAs at 1 mEPPT (6 0.1 mm)
keV
Heliodentc
64.31 6 0.5 mm
70 kVp
Isovoltb
121.10.9 mm
61.2 kVp
Heliodentc
46.71 6 0.5 mm
60 kVp
Isovoltb
880.8 mm
50.8 kVp
Isovoltb
30.6 mm
30.8 kVp
5.0 0.00 0.00 0.00 0.00 0.005.5 0.00 0.00 0.00 0.00 0.006.0 0.00 0.00 0.00 0.00 0.006.5 0.00 0.00 0.00 0.00 6.267.0 0.00 0.00 0.00 0.00 5.78 3 101
7.5 0.00 2.72 3 101 0.00 0.00 3.13 3 102
8.0 0.00 2.90 3 102 0.00 0.00 1.17 3 103
8.5 0.00 1.42 3 103 0.00 1.25 3 102 3.37 3 103
9.0 0.00 4.70 3 103 0.00 1.52 3 103 7.91 3 103
9.5 0.00 1.38 3 105 0.00 6.73 3 104 6.62 3 104
10.0 0.00 2.62 3 104 0.00 1.42 3 104 2.82 3 104
10.5 0.00 4.95 3 104 0.00 2.98 3 104 4.60 3 104
11.0 0.00 8.44 3 104 0.00 5.46 3 104 6.96 3 104
11.5 0.00 2.48 3 105 0.00 1.39 3 105 1.42 3 105
12.0 0.00 1.95 3 105 1.65 3 103 1.38 3 105 1.34 3 105
12.5 0.00 2.72 3 105 5.09 3 103 1.98 3 105 1.74 3 105
13.0 0.00 3.64 3 105 1.06 3 104 2.72 3 105 2.19 3 105
13.5 9.38 3 103 4.69 3 105 1.93 3 104 3.58 3 105 2.69 3 105
14.0 2.14 3 104 5.88 3 105 3.21 3 104 4.56 3 105 3.22 3 105
14.5 3.64 3 104 7.20 3 105 4.77 3 104 5.64 3 105 3.76 3 105
15.0 5.51 3 104 8.58 3 105 6.65 3 104 6.83 3 105 4.27 3 105
15.5 7.98 3 104 1.01 3 106 9.02 3 104 8.10 3 105 4.76 3 105
16.0 1.03 3 105 1.14 3 106 1.18 3 105 9.21 3 105 5.19 3 105
16.5 1.31 3 105 1.27 3 106 1.51 3 105 1.03 3 106 5.52 3 105
17.0 1.64 3 105 1.39 3 106 1.89 3 105 1.13 3 106 5.77 3 105
579THICK-TARGET TUNGSTEN X-RAY SPECTRA
APPENDIX
Continueda
TubemGy/mAs at 1 mEPPT (6 0.1 mm)
keV
Heliodentc
64.31 6 0.5 mm
70 kVp
Isovoltb
121.10.9 mm
61.2 kVp
Heliodentc
46.71 6 0.5 mm
60 kVp
Isovoltb
880.8 mm
50.8 kVp
Isovoltb
30.6 mm
30.8 kVp
17.5 2.02 3 105 1.50 3 106 2.34 3 105 1.22 3 106 5.99 3 105
18.0 2.44 3 105 1.60 3 106 2.84 3 105 1.30 3 106 6.13 3 105
18.5 2.91 3 105 1.69 3 106 3.39 3 105 1.36 3 106 6.24 3 105
19.0 3.42 3 105 1.76 3 106 3.98 3 105 1.42 3 106 6.29 3 105
19.5 3.96 3 105 1.83 3 106 4.61 3 105 1.48 3 106 6.32 3 105
20.0 4.54 3 105 1.89 3 106 5.22 3 105 1.52 3 106 6.30 3 105
20.5 5.16 3 105 1.94 3 106 5.85 3 105 1.55 3 106 6.29 3 105
21.0 5.80 3 105 1.98 3 106 6.47 3 105 1.59 3 106 6.23 3 105
21.5 6.68 3 105 2.03 3 106 7.07 3 105 1.62 3 106 6.14 3 105
22.0 7.58 3 105 2.06 3 106 7.62 3 105 1.63 3 106 6.00 3 105
22.5 8.49 3 105 2.08 3 106 8.15 3 105 1.65 3 106 5.79 3 105
23.0 9.41 3 105 2.10 3 106 8.63 3 105 1.65 3 106 5.57 3 105
23.5 1.03 3 106 2.11 3 106 9.06 3 105 1.65 3 106 5.31 3 105
24.0 1.10 3 106 2.11 3 106 9.44 3 105 1.64 3 106 5.03 3 105
24.5 1.17 3 106 2.10 3 106 9.79 3 105 1.63 3 106 4.71 3 105
25.0 1.23 3 106 2.10 3 106 1.01 3 106 1.62 3 106 4.42 3 105
25.5 1.29 3 106 2.09 3 106 1.04 3 106 1.60 3 106 4.09 3 105
26.0 1.34 3 106 2.08 3 106 1.07 3 106 1.58 3 106 3.75 3 105
26.5 1.39 3 106 2.06 3 106 1.09 3 106 1.56 3 106 3.42 3 105
27.0 1.43 3 106 2.04 3 106 1.11 3 106 1.54 3 106 3.03 3 105
27.5 1.47 3 106 2.02 3 106 1.13 3 106 1.51 3 106 2.62 3 105
28.0 1.51 3 106 2.00 3 106 1.15 3 106 1.48 3 106 2.21 3 105
28.5 1.54 3 106 1.97 3 106 1.16 3 106 1.46 3 106 1.77 3 105
29.0 1.57 3 106 1.94 3 106 1.17 3 106 1.43 3 106 1.28 3 105
29.5 1.60 3 106 1.91 3 106 1.17 3 106 1.39 3 106 8.48 3 104
30.0 1.63 3 106 1.87 3 106 1.17 3 106 1.36 3 106 4.64 3 104
30.5 1.65 3 106 1.83 3 106 1.18 3 106 1.33 3 106 2.06 3 104
31.0 1.67 3 106 1.80 3 106 1.18 3 106 1.29 3 106 7.45 3 103
31.5 1.68 3 106 1.77 3 106 1.18 3 106 1.26 3 106 0.0032.0 1.69 3 106 1.75 3 106 1.18 3 106 1.22 3 106 0.0032.5 1.70 3 106 1.71 3 106 1.17 3 106 1.19 3 106
33.0 1.71 3 106 1.68 3 106 1.17 3 106 1.16 3 106
33.5 1.72 3 106 1.64 3 106 1.16 3 106 1.13 3 106
34.0 1.72 3 106 1.61 3 106 1.15 3 106 1.09 3 106
34.5 1.72 3 106 1.57 3 106 1.14 3 106 1.06 3 106
35.0 1.71 3 106 1.53 3 106 1.13 3 106 1.02 3 106
35.5 1.70 3 106 1.50 3 106 1.11 3 106 9.95 3 105
36.0 1.69 3 106 1.47 3 106 1.10 3 106 9.38 3 105
36.5 1.68 3 106 1.44 3 106 1.08 3 106 9.19 3 105
37.0 1.66 3 106 1.40 3 106 1.07 3 106 8.96 3 105
37.5 1.64 3 106 1.37 3 106 1.05 3 106 8.50 3 105
38.0 1.63 3 106 1.33 3 106 1.04 3 106 8.12 3 105
38.5 1.61 3 106 1.30 3 106 1.03 3 106 7.90 3 105
39.0 1.60 3 106 1.27 3 106 1.01 3 106 7.41 3 105
39.5 1.58 3 106 1.24 3 106 9.97 3 105 7.05 3 105
40.0 1.57 3 106 1.20 3 106 9.81 3 105 6.71 3 105
40.5 1.55 3 106 1.16 3 106 9.64 3 105 6.48 3 105
41.0 1.53 3 106 1.12 3 106 9.46 3 105 6.29 3 105
41.5 1.52 3 106 1.09 3 106 9.26 3 105 5.71 3 105
42.0 1.50 3 106 1.06 3 106 9.05 3 105 5.54 3 105
42.5 1.48 3 106 1.04 3 106 8.83 3 105 5.13 3 105
43.0 1.46 3 106 1.00 3 106 8.60 3 105 4.86 3 105
43.5 1.44 3 106 9.75 3 105 8.36 3 105 4.40 3 105
44.0 1.41 3 106 9.46 3 105 8.11 3 105 4.15 3 105
44.5 1.39 3 106 9.11 3 105 7.87 3 105 3.72 3 105
45.0 1.36 3 106 8.80 3 105 7.62 3 105 3.55 3 105
45.5 1.34 3 106 8.48 3 105 7.38 3 105 3.15 3 105
46.0 1.31 3 106 8.23 3 105 7.14 3 105 2.89 3 105
46.5 1.28 3 106 7.94 3 105 6.89 3 105 2.45 3 105
580 MERCIER ET AL.
APPENDIX
Continueda
TubemGy/mAs at 1 mEPPT (6 0.1 mm)
keV
Heliodentc
64.31 6 0.5 mm
70 kVp
Isovoltb
121.10.9 mm60 kVp
Heliodentc
46.71 6 0.5 mm
60 kVp
Isovoltb
880.8 mm
50.8 kVp
Isovoltb
30.6 mm
30.8 kVp
47.0 1.25 3 106 7.68 3 105 6.65 3 105 2.13 3 105
47.5 1.22 3 106 7.41 3 105 6.40 3 105 1.82 3 105
48.0 1.19 3 106 7.15 3 105 6.15 3 105 1.34 3 105
48.5 1.16 3 106 6.84 3 105 5.89 3 105 9.60 3 104
49.0 1.12 3 106 6.59 3 105 5.62 3 105 5.61 3 104
49.5 1.09 3 106 6.29 3 105 5.36 3 105 3.18 3 104
50.0 1.06 3 106 5.98 3 105 5.09 3 105 1.51 3 104
50.5 1.03 3 106 5.72 3 105 4.82 3 105 9.68 3 103
51.0 9.99 3 105 5.43 3 105 4.54 3 105 9.69 3 103
51.5 9.69 3 105 5.08 3 105 4.27 3 105 7.75 3 103
52.0 9.39 3 105 4.80 3 105 4.01 3 105 5.82 3 103
52.5 9.09 3 105 4.56 3 105 3.74 3 105 0.0053.0 8.78 3 105 4.29 3 105 3.47 3 105 0.0053.5 8.47 3 105 4.03 3 105 3.21 3 105
54.0 8.16 3 105 3.77 3 105 2.95 3 105
54.5 7.85 3 105 3.48 3 105 2.69 3 105
55.0 7.54 3 105 3.20 3 105 2.43 3 105
55.5 7.24 3 105 2.95 3 105 2.18 3 105
56.0 6.93 3 105 2.64 3 105 1.92 3 105
56.5 6.61 3 105 2.38 3 105 1.67 3 105
57.0 6.29 3 105 2.14 3 105 1.44 3 105
57.5 5.98 3 105 1.82 3 105 1.19 3 105
58.0 5.68 3 105 1.50 3 105 9.81 3 104
58.5 5.38 3 105 1.16 3 105 7.78 3 104
59.0 5.08 3 105 8.87 3 104 6.10 3 104
59.5 4.78 3 105 5.80 3 104 4.58 3 104
60.0 4.49 3 105 3.01 3 104 3.25 3 104
60.5 4.22 3 105 1.03 3 104 5.88 3 103
61.0 3.93 3 105 8.72 3 103 2.15 3 103
61.5 3.68 3 105 6.00 3 103 0.0062.0 3.41 3 105 0.00 0.0062.5 3.14 3 105 0.0063.0 2.91 3 105
63.5 2.67 3 105
64.0 2.45 3 105
64.5 2.21 3 105
65.0 1.98 3 105
65.5 1.78 3 105
66.0 1.58 3 105
66.5 1.39 3 105
67.0 9.78 3 104
67.5 8.39 3 104
68.0 6.94 3 104
68.5 5.66 3 104
69.0 4.29 3 104
69.5 3.25 3 104
70.0 1.66 3 104
70.5 1.66 3 104
71.0 6.19 3 103
71.5 0.0072.0 0.00
a Format: absolute fluence primary spectra (X rays/mAs·cm2 at 1 m in 0.5-keV energy bins). Data with standardfont indicate 63% error. Data in italics indicate 610% error. Data in boldface indicate 65% error.
b Seifert Isovolt tube: constant potential, 208 pure tungsten anode. Total filtration: inherent filtration (7 mm beryl-lium) 1 effective pitting and plating thickness (listed in mm) 1 0.5 mm aluminum.
c Siemens Heliodent tube: constant potential, 128 pure tungsten anode. Total filtration: inherent filtration (0.8 mmpyrex glass, 15 mm insulating oil, 1.3 mm aluminum) 1 effective pitting and plating thickness.
581THICK-TARGET TUNGSTEN X-RAY SPECTRA
ACKNOWLEDGMENTS
We extend our gratitude to Mr. Dale Thomas, MSgt. Jocelyn Nixon,and Capt. Francis Afinidad of Brooks Air Force Base for unlimited accessto their outstanding calibration facility and for use of their germaniumdetector, nuclear instrument modules, oscilloscope, and primary standardion chamber. We thank Maj. Casmere Taylor, Maj. Walt Loring, and Sgt.Porter Burnett of Brooks Army Medical Center for loan of their cadmi-um-zinc-telluride detector and multichannel analyzer. We also thank Pro-fessor Gary Fullerton and Dr. Randy Glickman of The University ofTexas Health Science Center at San Antonio for loan of the MDH monitorand various optics components.
Received: July 19, 1999; accepted: April 30, 2000
REFERENCES
1. A. E. Profio, Ed., Shielding Benchmark Problems. PublicationORNL-RSIC-25, Oak Ridge National Laboratory, Oak Ridge, TN,1969.
2. M. Bhat, J. Pattison, G. Bibbo and M. Caon, Diagnostic X-ray spec-tra: A comparison of spectra generated by different computationalmethods with a measured spectrum. Med. Phys. 25, 114–120 (1998).
3. E. R. Epp and H. Weiss, Experimental study of the photon energyspectrum of primary diagnostic x-rays. Phys. Med. Biol. 11, 225–238(1966).
4. T. R. Fewell and R. E. Shuping, Photon energy distribution of sometypical diagnostic x-ray beams. Med. Phys. 4, 187–197 (1977).
5. T. R. Fewell, R. E. Shuping and K. R. Hawkins, Handbook of Com-puted Tomography X-Ray Spectra. Publication HHS (FDA) 81–8162,U.S. Government Printing Office, Washington, DC, 1981.
6. G. Hettinger and N. Starfelt, Bremsstrahlung spectra from Roentgentubes. Acta Radiol. 50, 381–394 (1958).
7. H. I. Israel, D. W. Lier and E. Storm, Comparison of detectors usedin measurement of 10 to 300 keV X-ray spectra. Nucl. Instrum. Meth-ods 91, 141–157 (1971).
8. M. Marshall, L. H. Peaple, G. M. Ardran and H. E. Crook, A com-parison of x-ray spectra and outputs from molybdenum and tungstentargets. Br. J. Radiol. 48, 31–39 (1975).
9. L. H. Peaple and A. K. Burt, The measurement of spectra from x-ray machines. Phys. Med. Biol. 14, 73–85 (1969).
10. W. W. Seelentag and W. Panzer, Stripping of X-ray bremsstrahlung
spectra up to 300 kVp on a desk type computer. Phys. Med. Biol.24, 767–780 (1979).
11. E. Storm, H. I. Israel and D. W. Lier, Bremsstrahlung Emission Mea-surement for Thick Tungsten Targets in the Energy Range 12 to 300kV. Publication LA-4624, Los Alamos National Laboratory, Los Al-amos, NM, 1971.
12. R. G. Waggener, L. B. Levy, L. F. Rogers and P. Zanca, MeasuredX-ray spectra from 25 to 110 kVp for a typical diagnostic unit. Ra-diology 105, 169–175 (1972).
13. J. W. Boag, Ionization chambers. In Radiation Dosimetry, Vol. II—Instrumentation, 2nd ed. (F. H. Attix and E. Tochilin, Eds.), pp. 54–55. Academic Press, New York, 1966.
14. T. R. Lee, Evaluation of MDH 1015 X-Ray Monitor. PublicationHEW (FDA) 77-8014, U.S. Government Printing Office, Washington,DC, 1977.
15. S. M. Seltzer, Calculated response of intrinsic germanium detectorsto narrow beams of photons with energies up to ;300 keV. Nucl.Instrum. Methods 188, 133–151 (1981).
16. J. F. Briesmeister, Ed., MCNP—A General Monte Carlo N-ParticleTransport Code, Version 4B. ORNL RSICC Computer Code Collec-tion CD-ROM # MCNP4B2, Los Alamos National Laboratory, LosAlamos, NM, 1997.
17. LLNL Libraries of Atomic Data, Electron Data, and Photon Data inEvaluated Nuclear Data Library (ENDL) Type Format. ORNLRSICC Data Library Collection CD-ROM # ENDLIB-97, Oak RidgeNational Laboratory, Oak Ridge, TN, 1997.
18. P. J. Lamperti, T. P. Loftus and R. Loevinger, Calibration of X-Rayand Gamma-Ray Measuring Instruments. NBS Special Publication250-16, National Bureau of Standards, Gaithersburg, MD, 1988.
19. G. D. Fullerton and R. Gragg, Calibration of Medium-Energy X-RayUnits (20–300 kV). In Handbook of Medical Physics, Vol. I (R. G.Waggener, J. G. Kereiakes and R. J. Shalek, Eds.), pp. 103–117. CRCPress, Boca Raton, FL, 1982.
20. F. H. Attix, Introduction to Radiological Physics and Radiation Do-simetry. Wiley, New York, 1986.
21. J. H. Hubbell and S. M. Seltzer, Tables of X-Ray Mass Attenuationand Mass Energy-Absorption Coefficients 1 keV to 20 MeV for Ele-ments Z-1 to 92 and 48 Additional Substances of Domestic Interest.Publication NISTIR 5632, National Institute of Standards and Tech-nology, Gaithersburg, MD, 1995.
22. H. A. Kramers, On the theory of X-ray absorption and of the con-tinuous X-ray spectrum. Phil. Mag. 46, 836–871 (1923).
![SSNP154 – Benchmark NAFEMS de validation du contac[] › V2 › doc › v12 › fr › man_v › v6 › v6.03... · 2017-12-14 · Responsable : DE SOZA Thomas Clé : V6.03.154](https://img.pdfslide.us/doc/110x75/5f14d681df37931baf1c5847/ssnp154-a-benchmark-nafems-de-validation-du-contac-a-v2-a-doc-a-v12-a.jpg)


![156 – Benchmark NAFEMS of validation of the contac [] Nuncode-aster.org/doc/v11/en/man_v/v6/v6.03.156.pdf · Code_Aster Version default Titre : SSNP156 – Benchmark NAFEMS de validation](https://img.pdfslide.us/doc/110x75/5ab2660a7f8b9ac66c8d58ed/156-benchmark-nafems-of-validation-of-the-contac-nuncode-asterorgdocv11enmanvv6v603156pdfcodeaster.jpg)


![SSNP154 – Benchmark NAFEMS of validation of the contac [] · 2021. 5. 14. · Titre : SSNP154 – Benchmark NAFEMS de validation du contac[...] Date : 27/06/2016 Page : 4/14 Responsable](https://img.pdfslide.us/doc/110x75/613013781ecc51586943dcdc/ssnp154-a-benchmark-nafems-of-validation-of-the-contac-2021-5-14-titre.jpg)