Embed Size (px)
Citation preview

Noname manuscript No.(will be inserted by the editor)
Measurement and Modeling of Tumblr Traffic
Rachel Mclean · Mehdi Karamollahi ·Carey Williamson
Received: date / Accepted: date
Abstract Tumblr is a popular microblogging platform that allows users to sharecontent and interact with other users. This paper focuses on the measurement andmodeling of Tumblr network traffic characteristics, since few studies have focusedon Tumblr from this perspective. Our work uses a combination of active and pas-sive approaches to network traffic measurement. Using Wireshark and mitmproxy,we identify the primary hosts associated with Tumblr traffic, the traffic patternsassociated with specific user actions, and the TCP connection behaviour. We thenstudy Tumblr usage by our campus community for one week, using passively col-lected connection summaries. As a frame of reference, we also compare this trafficwith several other popular social media platforms with user-generated content,namely Facebook, Instagram, and Twitter. Our work identifies several similaritiesand differences in the network traffic patterns for these social networking sites. Wealso develop and calibrate a synthetic workload model for Tumblr network traffic.
Keywords Network traffic measurement · Internet traffic characterization ·Workload modeling · Online social networks · Tumblr · TCP/IP
1 Introduction
Today’s Internet supports many different online social network (OSN) communi-ties. Facebook is the most well-known OSN, with nearly 26 billion monthly visitsworldwide. Its familiar structure focuses on creating networks of people, organiz-ing social events, and providing user-specific services. However, there is a widevariety of other social media platforms, including microblogging platforms likeTwitter and Tumblr. The latter two examples focus more on providing a platformfor curating and sharing user-generated content.
OSN sites with user-generated content have experienced tremendous growthin popularity over the past decade. Instagram [16] is a particularly interestingexample; owned by Facebook, Instagram began as a photo and video sharing site,
Contact information for authors:Department of Computer Science, University of Calgary, Calgary, AB, CanadaE-mail: {rarmclea,mehdi.karamollahi,cwill}@ucalgary.ca

2 Rachel Mclean et al.
but has since grown into an immensely popular social media platform, with recentlyadded functionality for voice calls, instant messaging, and live video streaming.Currently, Instagram has over one billion users who are active on at least a monthlybasis. A typical day has more than 500 million users active, posting more than400 million stories [6].
Tumblr is another example of a social media platform with user-generatedcontent. Tumblr is organized around the concept of the blogosphere, but withmicroblogging as its key idea. On Tumblr, users can create and curate their ownmicroblogs, with any topic or media content type of their choosing. The microblogsin Tumblr span many diverse topics, including anime, cooking, fitness, gardening,hiking, movies, music, sports, yoga, and more.
In this paper, we focus on characterizing the usage of Tumblr by our campuscommunity (i.e., faculty, staff, and students), and comparing its usage patternswith those of Facebook, Instagram, and Twitter, which have been well-studied inthe prior literature. One motivation for our work is the lack of recent measurementstudies of Tumblr, especially from a networking viewpoint. Another motivation isa desire to compare and contrast Tumblr with other OSN applications. Althoughexisting social media platforms each serve different niches, we find several similar-ities in their underlying usage. For example, OSNs tend to generate long-durationsessions, often involving media objects with heavy-tailed transfer sizes.
The primary research questions examined in this paper are:
– What are the key characteristics of Tumblr traffic?– How does Tumblr compare to other OSN applications in terms of network
traffic usage patterns?
For our study, we collected information about Tumblr and other OSN sitesfor a one-week period in February 2020. We analyze this traffic in terms of usagepatterns at the application, transport, and network layers. First, we characterizethe network traffic patterns for Tumblr and other popular OSN sites. Second,we characterize the TCP connections and transfer sizes used. Third, we identifyseveral characteristics that appear similar or different across these OSN sites.Finally, we design and implement a synthetic workload model for Tumblr trafficthat can be used in network simulations or capacity planning studies.
The remainder of this paper is organized as follows. Section 2 provides back-ground information on Tumblr, and reviews related research on Internet trafficmeasurement. Section 3 describes our measurement methodology. Section 4 pro-vides a workload characterization of Tumblr traffic on our campus network, andcompares these findings to the other OSN traffic observed. Section 5 presents oursynthetic workload model for Tumblr network traffic. Finally, Section 6 concludesthe paper.
2 Background and Related Work
This section provides some background information on Tumblr and network trafficmeasurement research.
Measurement and Modeling of Tumblr Traffic 3
2.1 Tumblr
Tumblr is a short-form blogging platform [15] that was launched in 2007. It cur-rently has nearly 500 million blogs and 17 million daily posts [14].
Tumblr shares many features with Twitter and Instagram, but with fewerlimitations on post type and length, allowing for highly diverse content. Each userhas at least one dedicated blog with its own associated Tumblr URL.
Tumblr blogs are generally accessible to anyone, including non-Tumblr users.These blogs typically contain a chronological list of all posts published on that blog(including original and reblogged content), along with a brief user bio, a customizedtheme, and a set of links for navigating that user’s blog. However, for Tumblr users,most of the interaction with other users is not done via their individual blogs, butvia the functionality in the Tumblr ‘dashboard’. The dashboard is only accessibleto authenticated Tumblr users, and contains a time-ordered feed of content fromall the blogs being followed.
Tumblr allows several different types of original posts, including text, audio,video, images, and external links. However, text posts may (and frequently do) in-clude photos, links, and videos. Similarly, any user may append additional contentof various types as a comment when reblogging a post.
Users may interact with a post in many different ways:
– reblog : copying a post to the user’s own blog [19];– queue: adding a copy of the post to a queue for later publication according to
some user-specified time interval;– schedule: setting a specific day and time for the post to be published to the
user’s blog;– save draft : adding a copy of the post to a collection of drafts to be reviewed,
posted, or deleted at a later time;– share: allowing users to share a link to the post via Twitter or Facebook, or by
sending a direct link to another Tumblr user using Tumblr’s instant messenger;– like: adding the post to a collection of ‘liked’ posts; and– reply : adding a message that appears in the notifications for the post creator,
and in the post’s public history, but is not itself published to anyone’s dash-board.
2.2 Related Work
Many papers in the literature have explored the complexities of online social net-works [3–5,8,9,13]. As the total population of social media users continues to grow,the ability to accurately characterize OSN user behaviour is increasingly valuable.Developing a clear understanding of network usage, number of requests, and datatraffic volume can provide useful insights on how to improve protocol efficiencyand user experience on a given platform or network.
One common approach to OSN research is to focus on the social aspects ofinteractions. For example, researchers have examined the structure and behaviourof social networks [9], analyzed click-stream data of browsing sessions [13], andcharacterized the behaviour of the users themselves [3,8].
Relatively few papers have dealt with Tumblr specifically. In 2014, Xu et al. [20]analyzed 23.2 million users and 10.2 billion posts over four months. They found

4 Rachel Mclean et al.
that the majority of content in Tumblr is recirculated in the form of rebloggedposts. They also found that Tumblr posts tended to have a longer lifespan onaverage than posts on other social media and microblogging platforms. By cross-referencing both implicit and explicit links on Twitter and Tumblr, they identifiedmore than 6.5 million cross-linked pairs of users on the two platforms. Also in2014, Chang et al. [4] characterized Tumblr in terms of user content, connections,and activity. A year later, in 2015, Alrajebah [1] examined content propagationacross Tumblr by characterizing the cascade structure of reblogs.
While many of these papers prioritize analysis of OSN content, a higher levelanalysis of traffic patterns in terms of volume and connection characteristics canreveal useful insights into network performance. In 2018, Roy et al. [12] conducteda network measurement study of Learning Management System (LMS) traffic,identifying several issues at the transport layer that resulted in sluggish networkperformance. More recently, in 2019, Klenow et al. [7] measured Instagram trafficon a campus network, showing that this traffic averaged approximately 1 TB ofdata per day, and had very consistent usage patterns from one weekday to thenext. Our work is similar in flavour to these latter two studies, but with a focuson Tumblr network traffic.
3 Methodology
Our research methodology involved a combination of active and passive approachesto network traffic measurement. The active approach was applied to study micro-scale aspects of Tumblr traffic for specific user test sessions conducted by us. Thepassive approach was used to provide a macro-scale view of Tumblr usage by ourcampus community as a whole.
3.1 Active Measurements
We conducted active measurements using our own client laptop in order to testTumblr features and study browsing sessions on both Google Chrome and MozillaFirefox. During these scripted test sessions, two existing network traffic analysistools were used to passively capture network-level data, namely Wireshark andmitmproxy.
Wireshark [18] is an open-source network protocol analyzer. It captures packetsas they pass through the network and displays them in a human-readable format,including IP addresses, port numbers, content length, and flags. Wireshark haspowerful filtering capability and statistical analysis tools, which are helpful foridentifying TCP connection behaviour associated with Tumblr and specific useractions.
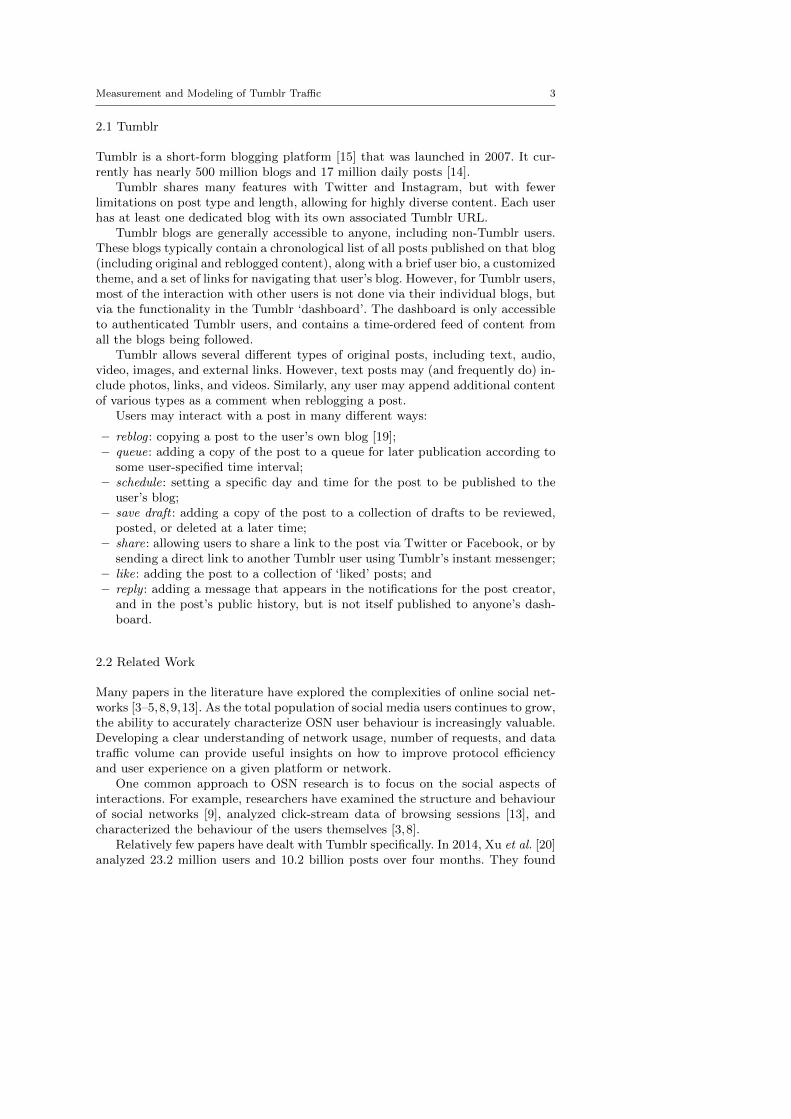
Figure 1 shows an example of a Tumblr browsing session, based on a Wiresharkcapture that lasted just over one minute. This graph shows a time-series repre-sentation of the user activity on a single TCP connection to Tumblr. The verticalaxis shows the bursts of network traffic (in bytes) as Tumblr pages and objects areaccessed, while the horizontal axis illustrates the timing structure for the user’sinteractions as indicated on the graph. Tumblr sessions generate bursty on-off pat-
Measurement and Modeling of Tumblr Traffic 5
terns in the network traffic because of the think times between user interactions,such as page downloads, uploads, or reblogging events.
Fig. 1 Annotated TCP sequence number plot of a Tumblr browsing session
Because Tumblr’s network traffic is encrypted (HTTPS), data collection wassupplemented by the use of mitmproxy [10], a tool for intercepting secure networktraffic between the server and client. We used this tool to identify traffic to andfrom Tumblr. During these test sessions, two IP addresses (152.199.24.192 and152.195.50.59) were identified as responsible for the majority of Tumblr traffic.
Table 1 summarizes all of the Tumblr-related IP addresses identified duringour active measurements. Some of the domain names (e.g., Yahoo, Oath, Veri-zon) and IP addresses reflect the historical evolution of Tumblr as a social mediaplatform [14,15].
Table 1 IP Addresses Observed for Tumblr Traffic
Domain Name IP Address
www.tumblr.com 152.199.24.192assets.tumblr.com
px.srvcs.tumblr.comapi.tumblr.com
66.media.tumblr.com 152.195.50.59static.tumblr.com
tspmagic.tumblr.com 35.211.245.42fc.yahoo.com 216.115.100.124
opus.analytics.yahoo.com 152.199.24.48consent.cmp.oath.com 152.195.55.192
(unknown Verizon/ANS) 152.195.14.41
3.2 Passive Measurements
The primary network traffic dataset for our research was obtained using the con-nection logs from Zeek (formerly known as Bro [11]). This network monitor pas-sively records connection-level summaries of traffic between our campus network
6 Rachel Mclean et al.
and the Internet. These summaries do not include packet payloads, but do includesource and destination IP addresses, port numbers, connection duration, connec-tion state, as well as the number of packets and bytes that are sent and receivedon each TCP connection.
Our research used connection logs from a one-week period between Sunday,February 2 and Saturday, February 8, 2020. This period is well into the regularWinter semester, but before the COVID-19 pandemic that led to the University ofCalgary switching to distance learning mode on March 15, 2020. These logs werefiltered by IP address to consider only the relevant addresses that were identifiedduring active measurements.
4 Network Traffic Characterization
This section presents our workload characterization of Tumblr network traffic.We begin with an overview of the OSN traffic on our campus network, and thenproceed to study Tumblr’s diurnal traffic patterns, connection-level characteris-tics, and session-level characteristics. We also highlight similarities and differencescompared to other OSN traffic.
4.1 OSN Traffic Overview
A measurement study of Tumblr and other OSN applications provides an opportu-nity to compare their characteristics and to gain a better perspective on Tumblr’straffic. For this purpose, we selected three of the most popular OSNs (Facebook,Instagram, and Twitter), and collected measurements for the exact same one-weekperiod (February 2-8, 2020). Prior to collecting this empirical data, we used activemeasurements to determine the main IP addresses used by these OSNs, whetherconnecting via a Web browser or their mobile applications.
Unlike Tumblr, most other OSNs use cloud-based services like Amazon WebServices (AWS) and/or Content Distribution Networks (CDNs) to deliver a lotof their content, such as multimedia files. It is non-trivial to find the exact IPaddresses of the CDNs used by these OSNs, since depending on the time of the day,type of content, and other characteristics of the content, the IPs change frequently.For example, depending on the Twitter account page from which content is beingretrieved, the CDN may vary. Furthermore, it is difficult to determine whetherthe observed IPs are being used for any other non-OSN services on the Internet.Therefore, for this study, we have only used the IP addresses that are owned andmanaged by these OSNs, and used consistently in all the traces.
Figure 2(a) shows a comparison between the four OSN sites in terms of thenumber of TCP connections per hour. As one might expect, Facebook receivedmore connections than the other three OSNs in this week. Twitter had the secondmost connections, with Instagram third, and Tumblr having the fewest connec-tions. Facebook also had the greatest variability in its connection activity, with apronounced spike on the Monday, and a slight decline in activity throughout theweek. The other three OSNs are much more consistent in their day-to-day trafficpatterns, except for the weekends.

Measurement and Modeling of Tumblr Traffic 7
0
50000
100000
150000
200000
250000
300000
350000
02/02 03/02 04/02 05/02 06/02 07/02 08/02 09/02
Connect
ions
Time
Hourly Connections for Four OSNs in a Week of Feb 2020
FacebookInstagram
TumblrTwitter
0
50000
100000
150000
200000
250000
300000
350000
02/02 03/02 04/02 05/02 06/02 07/02 08/02 09/02
106
107
108
109
1010
1011
02/02 03/02 04/02 05/02 06/02 07/02 08/02 09/02
Traffi
c B
yte
s (L
og)
Time
Hourly Total Traffic for Four OSNs in a Week of Feb 2020
FacebookInstagram
TumblrTwitter
106
107
108
109
1010
1011
02/02 03/02 04/02 05/02 06/02 07/02 08/02 09/02
(a) Hourly connection counts (b) Hourly traffic bytes
0.00001
0.00010
0.00100
0.01000
0.10000
1.00000
5 10 15 20 25 30 35
CC
DF
Log2(Bytes)
LLCD of Traffic Bytes for Four OSNs in a Week of Feb 2020
FacebookInstagram
TumblrTwitter
0.00001
0.00010
0.00100
0.01000
0.10000
1.00000
-20 -15 -10 -5 0 5 10 15
CC
DF
Log2(Durations in Seconds)
LLCD of Connection Durations for Four OSNs in a Week of Feb 2020
FacebookInstagram
TumblrTwitter
(c) LLCD of bytes per connection (d) LLCD of connection durations
Fig. 2 Comparison between traffic characteristics of four OSNs over one week (Feb 2-8, 2020)
Figure 2(b) shows the hourly data traffic volume (in bytes) for the four OSNsunder consideration. Surprisingly, the data traffic volume for Tumblr is comparableto, and sometimes higher than, the data volumes for the other three OSNs duringthe week, even though the number of TCP connections is much lower for Tumblr.This observation reflects larger media objects being transferred over Tumblr, asis evident from the Log-Log Complementary Distribution (LLCD) plot of transfersizes in Figure 2(c). Specifically, Tumblr has some transfer sizes that exceed 500MB, while the transfer sizes for the other three OSNs rarely exceed 50 MB. An-other contributing factor is the use of CDNs (e.g., Akamai, Fastly) for storing anddelivering large media objects for some OSNs, like Facebook. At the time of ourstudy, Tumblr did not seem to use any CDNs at all.
Figure 2(d) shows the LLCD plots of connection durations for the four OSNs.These distributions look quite similar across the four OSN sites, even in the tails.However, Instagram has a slightly shorter tail to the distribution than Tumblr.
4.2 Tumblr Traffic Overview
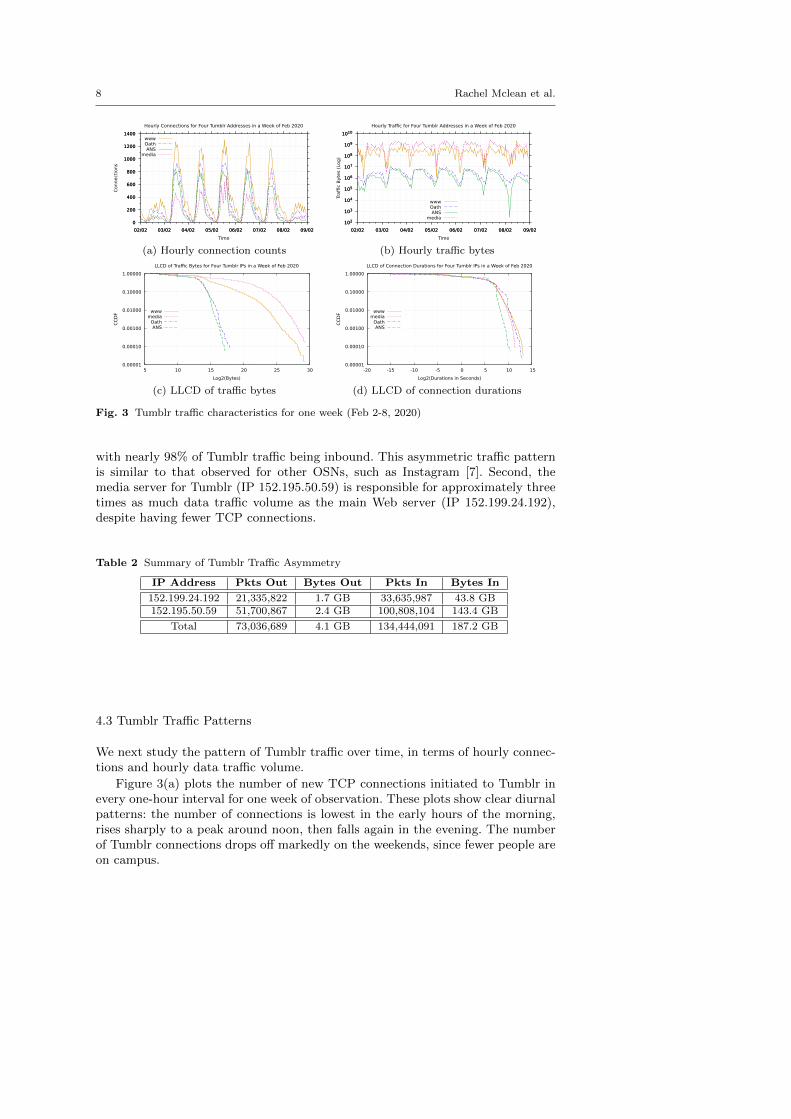
Figure 3 provides a graphical overview of the Tumblr traffic characteristics, us-ing the same format as Figure 2. The four lines on these graphs correspondto the four main IP addresses associated with Tumblr, namely the Web server(152.199.24.192), the media server (152.195.50.59), oath.com (152.195.55.192), andVerizon/ANS (152.195.14.41). We discuss these traffic characteristics over the nextfew subsections.
Table 2 shows the total volume of data transferred to and from the two primaryTumblr IP addresses identified earlier in Section 3. Two observations are evidentfrom this table. First, the volume of inbound traffic dominates the outbound traffic,
8 Rachel Mclean et al.
0
200
400
600
800
1000
1200
1400
02/02 03/02 04/02 05/02 06/02 07/02 08/02 09/02
Connect
ions
Time
Hourly Connections for Four Tumblr Addresses in a Week of Feb 2020
wwwOathANS
media
0
200
400
600
800
1000
1200
1400
02/02 03/02 04/02 05/02 06/02 07/02 08/02 09/02
102
103
104
105
106
107
108
109
1010
02/02 03/02 04/02 05/02 06/02 07/02 08/02 09/02
Traffi
c B
yte
s (L
og)
Time
Hourly Traffic for Four Tumblr Addresses in a Week of Feb 2020
wwwOathANS
media102
103
104
105
106
107
108
109
1010
02/02 03/02 04/02 05/02 06/02 07/02 08/02 09/02
(a) Hourly connection counts (b) Hourly traffic bytes
0.00001
0.00010
0.00100
0.01000
0.10000
1.00000
5 10 15 20 25 30
CC
DF
Log2(Bytes)
LLCD of Traffic Bytes for Four Tumblr IPs in a Week of Feb 2020
wwwmedia
OathANS
0.00001
0.00010
0.00100
0.01000
0.10000
1.00000
-20 -15 -10 -5 0 5 10 15
CC
DF
Log2(Durations in Seconds)
LLCD of Connection Durations for Four Tumblr IPs in a Week of Feb 2020
wwwmedia
OathANS
(c) LLCD of traffic bytes (d) LLCD of connection durations
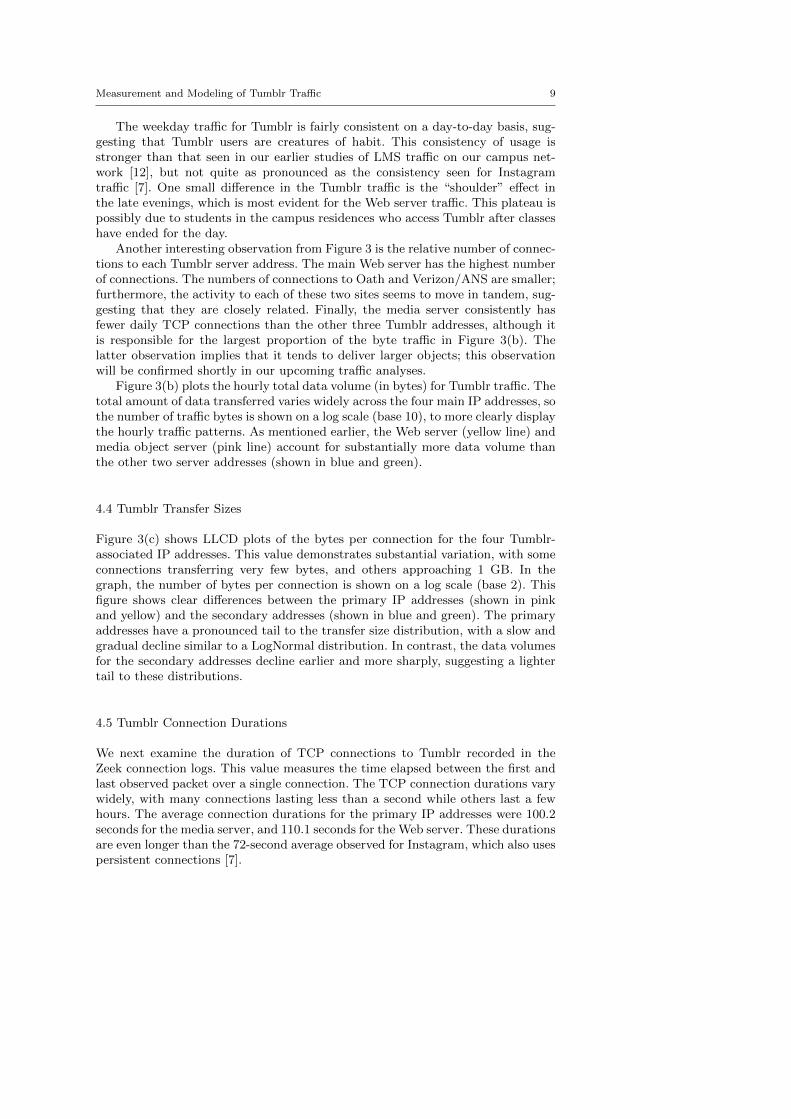
Fig. 3 Tumblr traffic characteristics for one week (Feb 2-8, 2020)
with nearly 98% of Tumblr traffic being inbound. This asymmetric traffic patternis similar to that observed for other OSNs, such as Instagram [7]. Second, themedia server for Tumblr (IP 152.195.50.59) is responsible for approximately threetimes as much data traffic volume as the main Web server (IP 152.199.24.192),despite having fewer TCP connections.
Table 2 Summary of Tumblr Traffic Asymmetry
IP Address Pkts Out Bytes Out Pkts In Bytes In
152.199.24.192 21,335,822 1.7 GB 33,635,987 43.8 GB152.195.50.59 51,700,867 2.4 GB 100,808,104 143.4 GB
Total 73,036,689 4.1 GB 134,444,091 187.2 GB
4.3 Tumblr Traffic Patterns
We next study the pattern of Tumblr traffic over time, in terms of hourly connec-tions and hourly data traffic volume.
Figure 3(a) plots the number of new TCP connections initiated to Tumblr inevery one-hour interval for one week of observation. These plots show clear diurnalpatterns: the number of connections is lowest in the early hours of the morning,rises sharply to a peak around noon, then falls again in the evening. The numberof Tumblr connections drops off markedly on the weekends, since fewer people areon campus.
Measurement and Modeling of Tumblr Traffic 9
The weekday traffic for Tumblr is fairly consistent on a day-to-day basis, sug-gesting that Tumblr users are creatures of habit. This consistency of usage isstronger than that seen in our earlier studies of LMS traffic on our campus net-work [12], but not quite as pronounced as the consistency seen for Instagramtraffic [7]. One small difference in the Tumblr traffic is the “shoulder” effect inthe late evenings, which is most evident for the Web server traffic. This plateau ispossibly due to students in the campus residences who access Tumblr after classeshave ended for the day.
Another interesting observation from Figure 3 is the relative number of connec-tions to each Tumblr server address. The main Web server has the highest numberof connections. The numbers of connections to Oath and Verizon/ANS are smaller;furthermore, the activity to each of these two sites seems to move in tandem, sug-gesting that they are closely related. Finally, the media server consistently hasfewer daily TCP connections than the other three Tumblr addresses, although itis responsible for the largest proportion of the byte traffic in Figure 3(b). Thelatter observation implies that it tends to deliver larger objects; this observationwill be confirmed shortly in our upcoming traffic analyses.
Figure 3(b) plots the hourly total data volume (in bytes) for Tumblr traffic. Thetotal amount of data transferred varies widely across the four main IP addresses, sothe number of traffic bytes is shown on a log scale (base 10), to more clearly displaythe hourly traffic patterns. As mentioned earlier, the Web server (yellow line) andmedia object server (pink line) account for substantially more data volume thanthe other two server addresses (shown in blue and green).
4.4 Tumblr Transfer Sizes
Figure 3(c) shows LLCD plots of the bytes per connection for the four Tumblr-associated IP addresses. This value demonstrates substantial variation, with someconnections transferring very few bytes, and others approaching 1 GB. In thegraph, the number of bytes per connection is shown on a log scale (base 2). Thisfigure shows clear differences between the primary IP addresses (shown in pinkand yellow) and the secondary addresses (shown in blue and green). The primaryaddresses have a pronounced tail to the transfer size distribution, with a slow andgradual decline similar to a LogNormal distribution. In contrast, the data volumesfor the secondary addresses decline earlier and more sharply, suggesting a lightertail to these distributions.
4.5 Tumblr Connection Durations
We next examine the duration of TCP connections to Tumblr recorded in theZeek connection logs. This value measures the time elapsed between the first andlast observed packet over a single connection. The TCP connection durations varywidely, with many connections lasting less than a second while others last a fewhours. The average connection durations for the primary IP addresses were 100.2seconds for the media server, and 110.1 seconds for the Web server. These durationsare even longer than the 72-second average observed for Instagram, which also usespersistent connections [7].
10 Rachel Mclean et al.
Figure 3(d) shows LLCD plots of TCP connection duration for the four mainaddresses associated with Tumblr, with the durations shown on a log scale (base2). These plots show that the distribution of connection duration is similar forall four addresses measured, suggesting that Tumblr connection durations are notdirectly related to transfer sizes. A more detailed statistical analysis (not shownhere) confirms that the correlation between transfer size and connection durationis rather weak.
Two particularly interesting observations from our Tumblr datasets are thelarge sizes of some of the transfers for a “microblogging” site (e.g., 320 MB), andthe extremely low throughputs achieved (e.g., about 5 Mbps). Since the transfersare encrypted, we do not know the types of the objects involved. We speculatethat the low throughput is attributable to both the persistent connection timeoutsbeing used, as well as the window-limited TCP performance between Calgary andTumblr (e.g., 64 KB of data every RTT).
To better understand the long-lasting TCP connections, some additional activemeasurement experiments were performed. These test sessions revealed a regular“API ping” between the client and the Tumblr Web server every 30 seconds, toupdate status information for the user. This “keep-alive” feature is unique toTumblr, and helps explain some of the long-lasting connections with very littledata volume.
4.6 Tumblr Connection State
We next analyze the TCP connection states recorded in the connection logs. A typ-ical TCP connection, opened with a SYN flag and terminated with a FIN flag, willhave a recorded final state SF, while a connection that is terminated with a RSTflag may have a recorded final state of RSTO (reset by the originator) or RSTR(reset by the responder). Other connections may be only partially1 observed, in-cluding connections that are attempted but not established (S0), connections thatare established but not terminated (S1), or connections where only midstreamtraffic is observed without opening or closing handshakes (OTH).
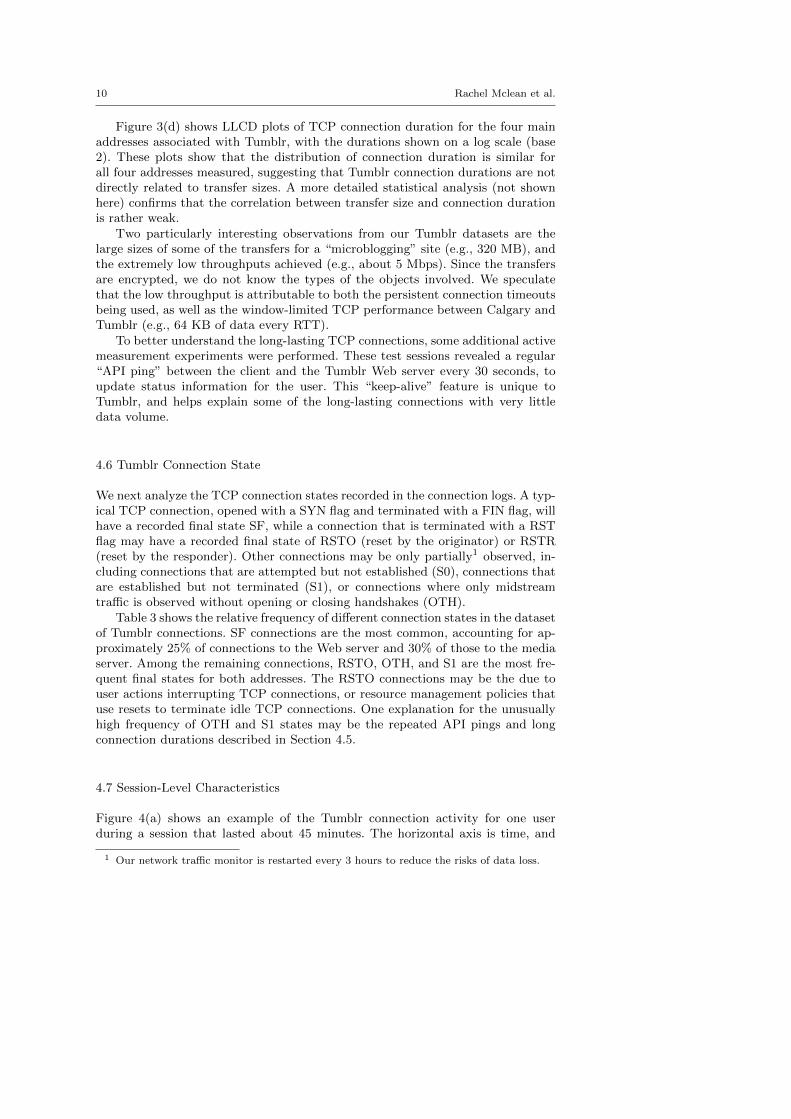
Table 3 shows the relative frequency of different connection states in the datasetof Tumblr connections. SF connections are the most common, accounting for ap-proximately 25% of connections to the Web server and 30% of those to the mediaserver. Among the remaining connections, RSTO, OTH, and S1 are the most fre-quent final states for both addresses. The RSTO connections may be the due touser actions interrupting TCP connections, or resource management policies thatuse resets to terminate idle TCP connections. One explanation for the unusuallyhigh frequency of OTH and S1 states may be the repeated API pings and longconnection durations described in Section 4.5.
4.7 Session-Level Characteristics
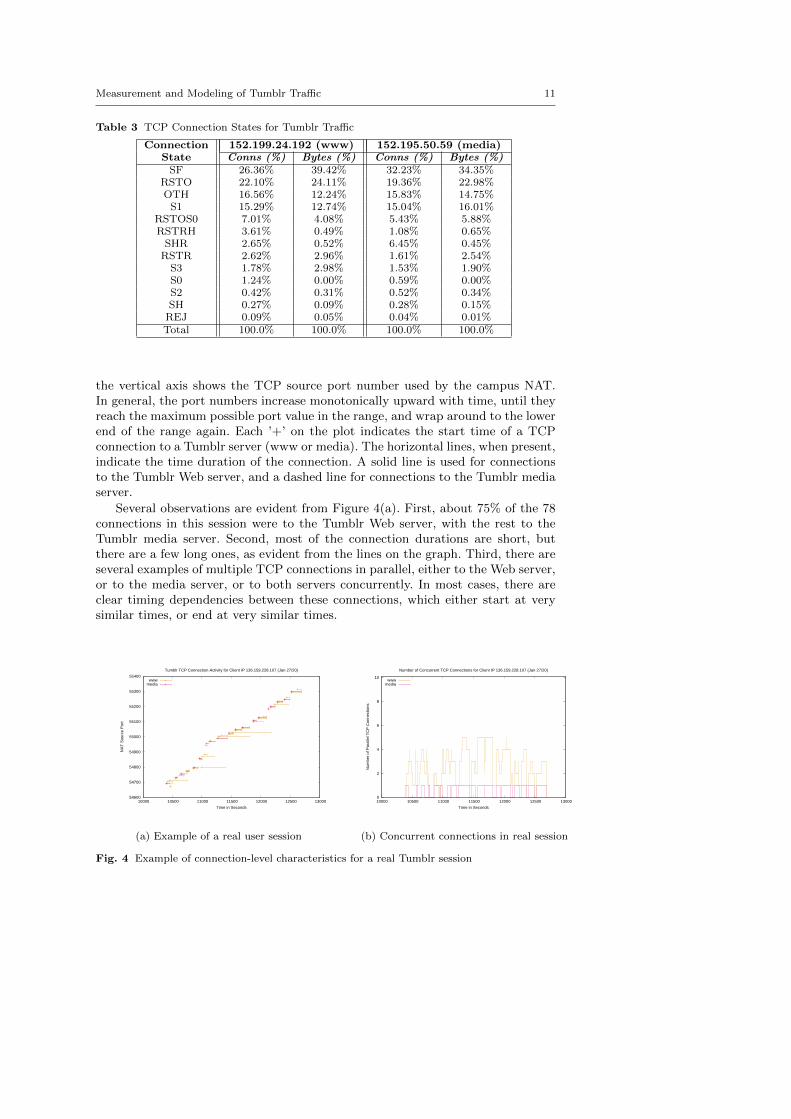
Figure 4(a) shows an example of the Tumblr connection activity for one userduring a session that lasted about 45 minutes. The horizontal axis is time, and
1 Our network traffic monitor is restarted every 3 hours to reduce the risks of data loss.
Measurement and Modeling of Tumblr Traffic 11
Table 3 TCP Connection States for Tumblr Traffic
Connection 152.199.24.192 (www) 152.195.50.59 (media)State Conns (%) Bytes (%) Conns (%) Bytes (%)
SF 26.36% 39.42% 32.23% 34.35%RSTO 22.10% 24.11% 19.36% 22.98%OTH 16.56% 12.24% 15.83% 14.75%
S1 15.29% 12.74% 15.04% 16.01%RSTOS0 7.01% 4.08% 5.43% 5.88%RSTRH 3.61% 0.49% 1.08% 0.65%
SHR 2.65% 0.52% 6.45% 0.45%RSTR 2.62% 2.96% 1.61% 2.54%
S3 1.78% 2.98% 1.53% 1.90%S0 1.24% 0.00% 0.59% 0.00%S2 0.42% 0.31% 0.52% 0.34%SH 0.27% 0.09% 0.28% 0.15%
REJ 0.09% 0.05% 0.04% 0.01%Total 100.0% 100.0% 100.0% 100.0%
the vertical axis shows the TCP source port number used by the campus NAT.In general, the port numbers increase monotonically upward with time, until theyreach the maximum possible port value in the range, and wrap around to the lowerend of the range again. Each ’+’ on the plot indicates the start time of a TCPconnection to a Tumblr server (www or media). The horizontal lines, when present,indicate the time duration of the connection. A solid line is used for connectionsto the Tumblr Web server, and a dashed line for connections to the Tumblr mediaserver.
Several observations are evident from Figure 4(a). First, about 75% of the 78connections in this session were to the Tumblr Web server, with the rest to theTumblr media server. Second, most of the connection durations are short, butthere are a few long ones, as evident from the lines on the graph. Third, there areseveral examples of multiple TCP connections in parallel, either to the Web server,or to the media server, or to both servers concurrently. In most cases, there areclear timing dependencies between these connections, which either start at verysimilar times, or end at very similar times.
54600
54700
54800
54900
55000
55100
55200
55300
55400
10000 10500 11000 11500 12000 12500 13000
NA
T S
ourc
e P
ort
Time in Seconds
Tumblr TCP Connection Activity for Client IP 136.159.228.107 (Jan 27/20)
wwwmedia
0
2
4
6
8
10
10000 10500 11000 11500 12000 12500 13000
Num
ber
of P
aral
lel T
CP
Con
nect
ions
Time in Seconds
Number of Concurrent TCP Connections for Client IP 136.159.228.107 (Jan 27/20)
wwwmedia
(a) Example of a real user session (b) Concurrent connections in real session
Fig. 4 Example of connection-level characteristics for a real Tumblr session

12 Rachel Mclean et al.
Figure 4(b) provides a detailed look at the use of parallel TCP connectionsduring this user session with the Tumblr site. This user maintains up to fiveTCP connections in parallel with the Tumblr Web server, and at most one TCPconnection with the media server. The number of concurrent connections fluctuateswith time, as the user navigates to different pages and takes different actions onthe Tumblr site.
5 Tumblr Traffic Model
As the final component of our work, we have designed and implemented a syntheticworkload model for Tumblr network traffic. The model is written in C, and consistsof just over 300 lines of code.
Our synthetic workload model for Tumblr is conceptually similar to Web brows-ing models from the mid-1990’s [2]. Specifically, we use a hierarchical workloadmodel, with three conceptual layers. The topmost layer models a single user ses-sion in Tumblr. This session consists of one or more conversations with a Tumblrserver2 (e.g., 75% to Web server and 25% to media server) at the intermediatelayer, with random think times in between. Each conversation with a server inturn involves one or more TCP connections, with either independent or correlatedstart times, and randomly generated transfer sizes. The TCP connection layerconstitutes the lowest layer of the Tumblr model; we do not model the IP packetlayer, or the dynamics of TCP congestion control. Concurrent TCP connectionsare allowed to both of the Tumblr servers, with connection start times slightlystaggered to reflect processing overheads and non-deterministic user interactions.
The Tumblr workload model has been calibrated based on the empirical mea-surement data reported in the previous section. We use a geometric distributionfor the number of connections, and hybrid distributions for the numbers of bytessent and received on each connection. Connection durations depend on data trans-fer sizes, network bandwidth for uploading/downloading, TCP handshaking, andthe timeout values used for persistent connections. Table 4 provides a summaryof the main parameters in our Tumblr model, and the default settings for theseparameters. The default settings produce Tumblr sessions with an average of 50TCP connections, and lasting just under half an hour on average.
When building a synthetic workload model for Tumblr traffic, it is importantto model the cross-correlations in TCP connections, which are clearly not indepen-dent. For this purpose, the conversation model allows some shared state betweenWeb and media server connections, with the data volumes randomly split betweenthe two connections, while the connection durations are harmonized.
Figure 5 shows an example of the output from this model for a 50-minute usersession with about 84 TCP connections. About two-thirds of these connections goto the Web server, and about one-third to the media server. These graphs use thesame style and format as Figure 4. Specifically, Figure 5(a) represents the timeseries evolution of TCP connection usage, while Figure 5(b) shows the concurrentconnection usage across the two main Tumblr servers. These graphs are visuallysimilar to those for the empirical user session shown in Figure 4. However, we
2 We ignore the Oath and Verizon/ANS servers, which contribute negligibly to the connec-tion count and data volume in the empirical Tumblr traffic.

Measurement and Modeling of Tumblr Traffic 13
Table 4 Parameters and Settings for Tumblr Traffic Model
Parameter Setting
Session IAT Exponential(120)Conversations Geometric(5)
Web Server Prob 0.70Media Server Prob 0.20Dual Server Prob 0.10
Connections Geometric(10)Persistent Conn Prob 0.20
Persistent Conn Timeout 60 sTail Prob 0.50
Bytes Sent LogNormal(12,2)Bytes Received (www) LogNormal(14,2)Bytes Received (media) LogNormal(15,2)
Upload Bandwidth 1.5 MbpsDownload Bandwidth 4.0 Mbps
User Think Time Uniform(0,60)
have not modeled the API ping feature, which likely causes some of the longerWeb server connections in Figure 4(a).
49200
49210
49220
49230
49240
49250
49260
49270
49280
49290
0 500 1000 1500 2000 2500 3000 3500
Por
t Num
ber
(Con
nID
)
Time in Seconds
TCP Connection Activity for Synthetic Tumblr Session
wwwmedia
0
2
4
6
8
10
0 500 1000 1500 2000 2500 3000 3500
Num
ber
of P
aral
lel T
CP
Con
nect
ions
Time in Seconds
Number of Concurrent TCP Connections for Synthetic Tumblr Session
wwwmedia
(a) Example of a synthetic user session (b) Concurrent connections in synthetic session
Fig. 5 Example of connection-level characteristics for a synthetic Tumblr session
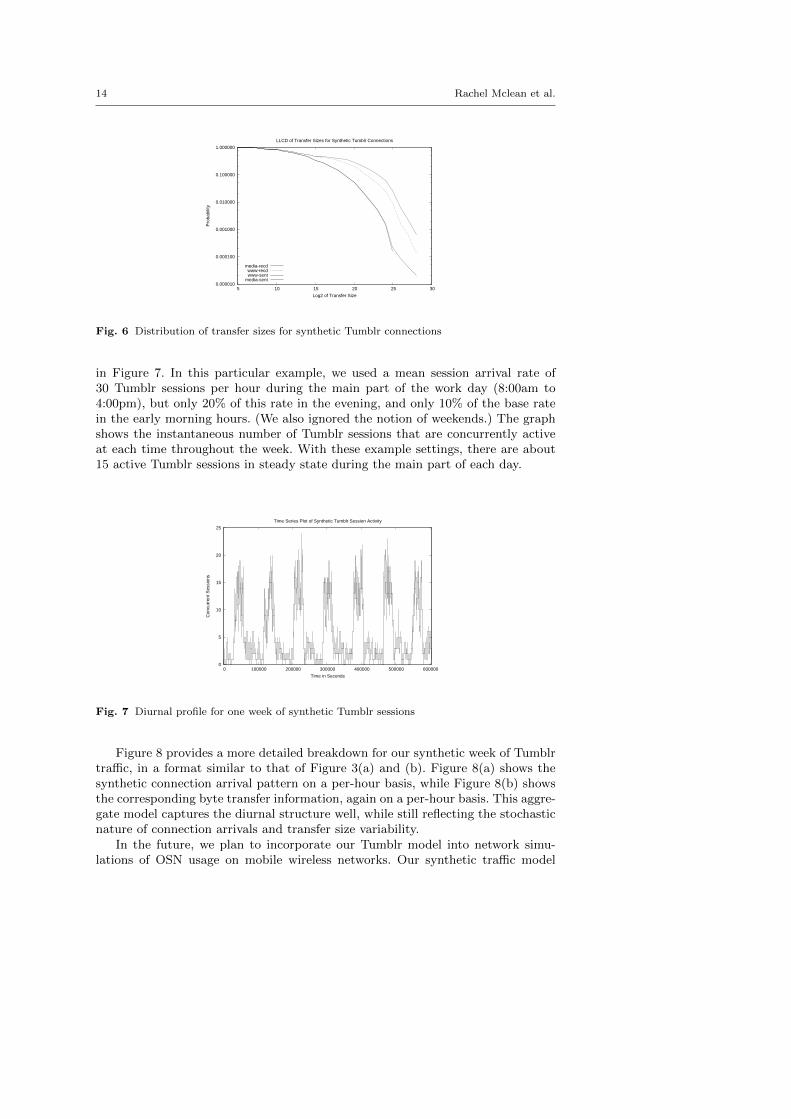
Figure 6 provides a more detailed look at how transfer sizes for connectionsare modeled. In the example shown here, we use a hybrid distribution, with 50%of the transfer sizes being in the body of the distribution (e.g., less than 64 KB),and 50% of the transfer sizes being in the tail of the distribution. The tail ismodeled using a LogNormal distribution, as indicated earlier. We explicitly modelthe asymmetry of the traffic, with received bytes on average being about fourtimes larger than sent bytes. We also increase the average transfer size for themedia server, which has a more pronounced tail to the distribution for receivedbytes. The modeling results in Figure 6 are structurally similar to those shown forthe empirical workload in Figure 3(c), though the latter did not explicitly separatethe two directions of traffic.
By combining the foregoing Tumblr session model with a time-varying Poissonarrival process, we have generated one synthetic week of Tumblr traffic, as shown
14 Rachel Mclean et al.
0.000010
0.000100
0.001000
0.010000
0.100000
1.000000
5 10 15 20 25 30
Pro
babi
lity
Log2 of Transfer Size
LLCD of Transfer Sizes for Synthetic Tumblr Connections
media-recdwww-recdwww-sent
media-sent
Fig. 6 Distribution of transfer sizes for synthetic Tumblr connections
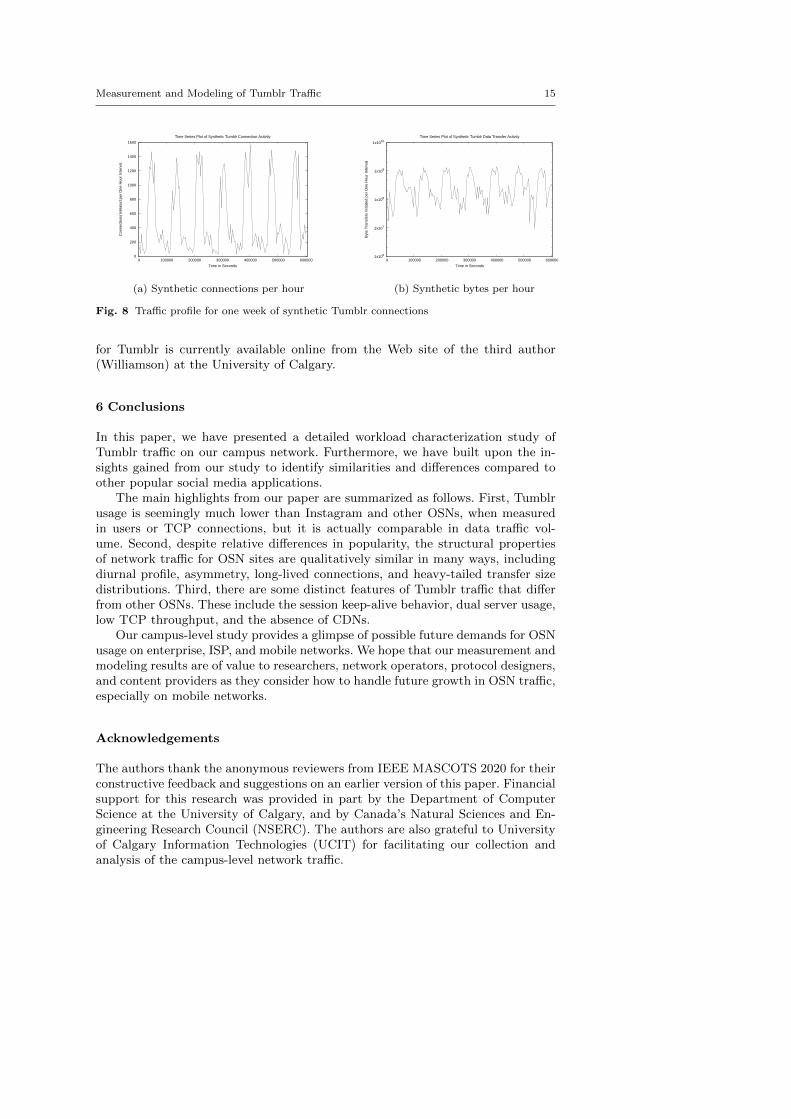
in Figure 7. In this particular example, we used a mean session arrival rate of30 Tumblr sessions per hour during the main part of the work day (8:00am to4:00pm), but only 20% of this rate in the evening, and only 10% of the base ratein the early morning hours. (We also ignored the notion of weekends.) The graphshows the instantaneous number of Tumblr sessions that are concurrently activeat each time throughout the week. With these example settings, there are about15 active Tumblr sessions in steady state during the main part of each day.
0
5
10
15
20
25
0 100000 200000 300000 400000 500000 600000
Con
curr
ent S
essi
ons
Time in Seconds
Time Series Plot of Synthetic Tumblr Session Activity
Fig. 7 Diurnal profile for one week of synthetic Tumblr sessions
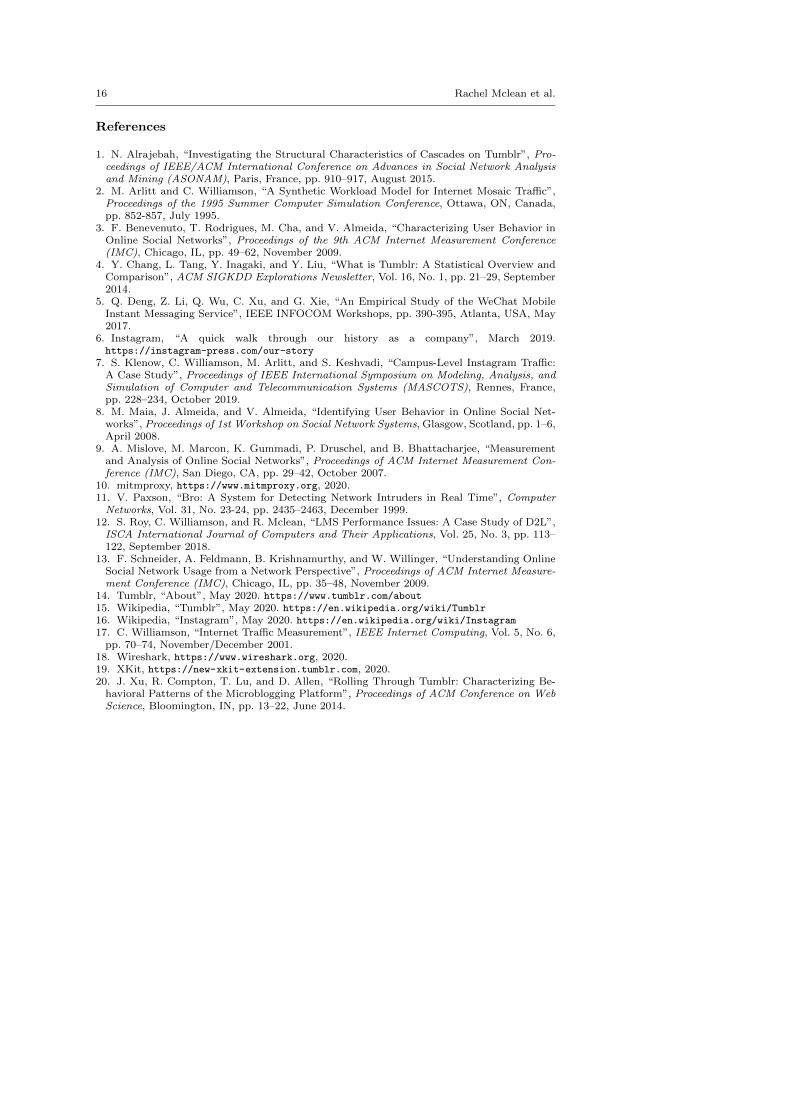
Figure 8 provides a more detailed breakdown for our synthetic week of Tumblrtraffic, in a format similar to that of Figure 3(a) and (b). Figure 8(a) shows thesynthetic connection arrival pattern on a per-hour basis, while Figure 8(b) showsthe corresponding byte transfer information, again on a per-hour basis. This aggre-gate model captures the diurnal structure well, while still reflecting the stochasticnature of connection arrivals and transfer size variability.
In the future, we plan to incorporate our Tumblr model into network simu-lations of OSN usage on mobile wireless networks. Our synthetic traffic model
Measurement and Modeling of Tumblr Traffic 15
0
200
400
600
800
1000
1200
1400
1600
0 100000 200000 300000 400000 500000 600000
Con
nect
ions
Initi
ated
per
One
Hou
r In
terv
al
Time in Seconds
Time Series Plot of Synthetic Tumblr Connection Activity
1x10⁶
1x10⁷
1x10⁸
1x10⁹
1x10¹⁰
0 100000 200000 300000 400000 500000 600000
Byt
e T
rans
fers
Initi
ated
per
One
Hou
r In
terv
al
Time in Seconds
Time Series Plot of Synthetic Tumblr Data Transfer Activity
(a) Synthetic connections per hour (b) Synthetic bytes per hour
Fig. 8 Traffic profile for one week of synthetic Tumblr connections
for Tumblr is currently available online from the Web site of the third author(Williamson) at the University of Calgary.
6 Conclusions
In this paper, we have presented a detailed workload characterization study ofTumblr traffic on our campus network. Furthermore, we have built upon the in-sights gained from our study to identify similarities and differences compared toother popular social media applications.
The main highlights from our paper are summarized as follows. First, Tumblrusage is seemingly much lower than Instagram and other OSNs, when measuredin users or TCP connections, but it is actually comparable in data traffic vol-ume. Second, despite relative differences in popularity, the structural propertiesof network traffic for OSN sites are qualitatively similar in many ways, includingdiurnal profile, asymmetry, long-lived connections, and heavy-tailed transfer sizedistributions. Third, there are some distinct features of Tumblr traffic that differfrom other OSNs. These include the session keep-alive behavior, dual server usage,low TCP throughput, and the absence of CDNs.
Our campus-level study provides a glimpse of possible future demands for OSNusage on enterprise, ISP, and mobile networks. We hope that our measurement andmodeling results are of value to researchers, network operators, protocol designers,and content providers as they consider how to handle future growth in OSN traffic,especially on mobile networks.
Acknowledgements
The authors thank the anonymous reviewers from IEEE MASCOTS 2020 for theirconstructive feedback and suggestions on an earlier version of this paper. Financialsupport for this research was provided in part by the Department of ComputerScience at the University of Calgary, and by Canada’s Natural Sciences and En-gineering Research Council (NSERC). The authors are also grateful to Universityof Calgary Information Technologies (UCIT) for facilitating our collection andanalysis of the campus-level network traffic.
16 Rachel Mclean et al.
References
1. N. Alrajebah, “Investigating the Structural Characteristics of Cascades on Tumblr”, Pro-ceedings of IEEE/ACM International Conference on Advances in Social Network Analysisand Mining (ASONAM), Paris, France, pp. 910–917, August 2015.
2. M. Arlitt and C. Williamson, “A Synthetic Workload Model for Internet Mosaic Traffic”,Proceedings of the 1995 Summer Computer Simulation Conference, Ottawa, ON, Canada,pp. 852-857, July 1995.
3. F. Benevenuto, T. Rodrigues, M. Cha, and V. Almeida, “Characterizing User Behavior inOnline Social Networks”, Proceedings of the 9th ACM Internet Measurement Conference(IMC), Chicago, IL, pp. 49–62, November 2009.
4. Y. Chang, L. Tang, Y. Inagaki, and Y. Liu, “What is Tumblr: A Statistical Overview andComparison”, ACM SIGKDD Explorations Newsletter, Vol. 16, No. 1, pp. 21–29, September2014.
5. Q. Deng, Z. Li, Q. Wu, C. Xu, and G. Xie, “An Empirical Study of the WeChat MobileInstant Messaging Service”, IEEE INFOCOM Workshops, pp. 390-395, Atlanta, USA, May2017.
6. Instagram, “A quick walk through our history as a company”, March 2019.https://instagram-press.com/our-story
7. S. Klenow, C. Williamson, M. Arlitt, and S. Keshvadi, “Campus-Level Instagram Traffic:A Case Study”, Proceedings of IEEE International Symposium on Modeling, Analysis, andSimulation of Computer and Telecommunication Systems (MASCOTS), Rennes, France,pp. 228–234, October 2019.
8. M. Maia, J. Almeida, and V. Almeida, “Identifying User Behavior in Online Social Net-works”, Proceedings of 1st Workshop on Social Network Systems, Glasgow, Scotland, pp. 1–6,April 2008.
9. A. Mislove, M. Marcon, K. Gummadi, P. Druschel, and B. Bhattacharjee, “Measurementand Analysis of Online Social Networks”, Proceedings of ACM Internet Measurement Con-ference (IMC), San Diego, CA, pp. 29–42, October 2007.
10. mitmproxy, https://www.mitmproxy.org, 2020.11. V. Paxson, “Bro: A System for Detecting Network Intruders in Real Time”, ComputerNetworks, Vol. 31, No. 23-24, pp. 2435–2463, December 1999.
12. S. Roy, C. Williamson, and R. Mclean, “LMS Performance Issues: A Case Study of D2L”,ISCA International Journal of Computers and Their Applications, Vol. 25, No. 3, pp. 113–122, September 2018.
13. F. Schneider, A. Feldmann, B. Krishnamurthy, and W. Willinger, “Understanding OnlineSocial Network Usage from a Network Perspective”, Proceedings of ACM Internet Measure-ment Conference (IMC), Chicago, IL, pp. 35–48, November 2009.
14. Tumblr, “About”, May 2020. https://www.tumblr.com/about15. Wikipedia, “Tumblr”, May 2020. https://en.wikipedia.org/wiki/Tumblr16. Wikipedia, “Instagram”, May 2020. https://en.wikipedia.org/wiki/Instagram17. C. Williamson, “Internet Traffic Measurement”, IEEE Internet Computing, Vol. 5, No. 6,
pp. 70–74, November/December 2001.18. Wireshark, https://www.wireshark.org, 2020.19. XKit, https://new-xkit-extension.tumblr.com, 2020.20. J. Xu, R. Compton, T. Lu, and D. Allen, “Rolling Through Tumblr: Characterizing Be-
havioral Patterns of the Microblogging Platform”, Proceedings of ACM Conference on WebScience, Bloomington, IN, pp. 13–22, June 2014.