Embed Size (px)
Citation preview
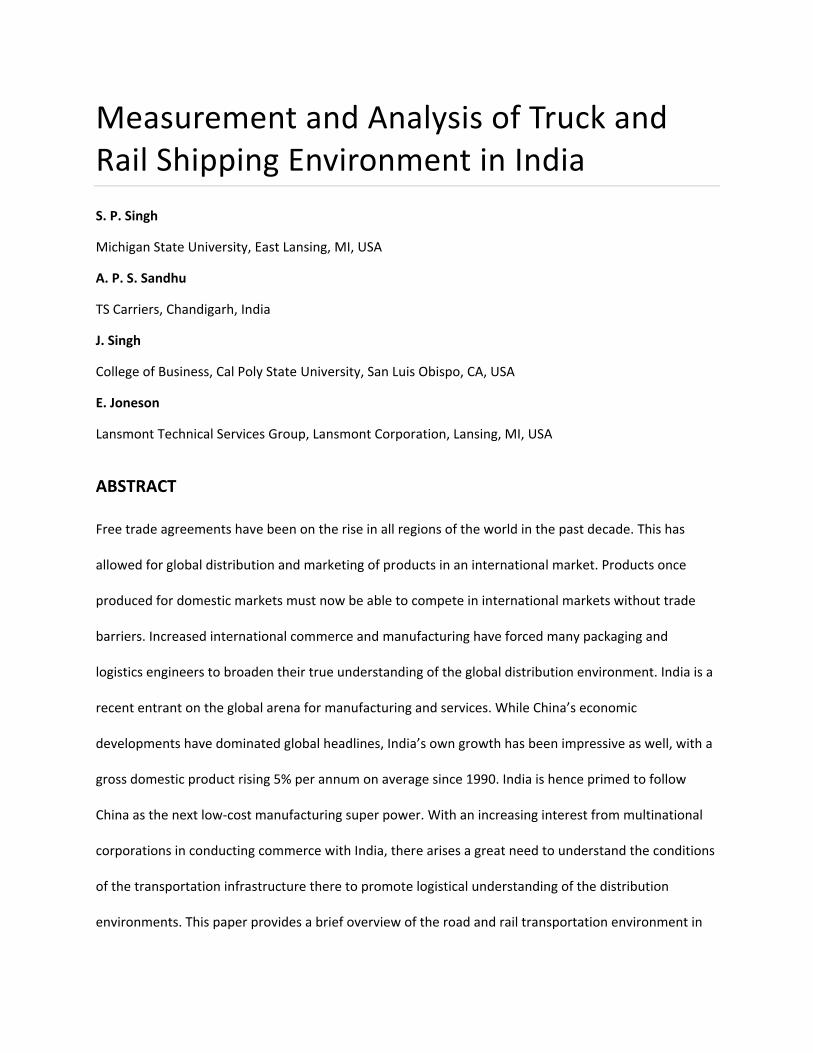
Measurement and Analysis of Truck and Rail Shipping Environment in India
S. P. Singh
Michigan State University, East Lansing, MI, USA
A. P. S. Sandhu
TS Carriers, Chandigarh, India
J. Singh
College of Business, Cal Poly State University, San Luis Obispo, CA, USA
E. Joneson
Lansmont Technical Services Group, Lansmont Corporation, Lansing, MI, USA
ABSTRACT
Free trade agreements have been on the rise in all regions of the world in the past decade. This has
allowed for global distribution and marketing of products in an international market. Products once
produced for domestic markets must now be able to compete in international markets without trade
barriers. Increased international commerce and manufacturing have forced many packaging and
logistics engineers to broaden their true understanding of the global distribution environment. India is a
recent entrant on the global arena for manufacturing and services. While China’s economic
developments have dominated global headlines, India’s own growth has been impressive as well, with a
gross domestic product rising 5% per annum on average since 1990. India is hence primed to follow
China as the next low-cost manufacturing super power. With an increasing interest from multinational
corporations in conducting commerce with India, there arises a great need to understand the conditions
of the transportation infrastructure there to promote logistical understanding of the distribution
environments. This paper provides a brief overview of the road and rail transportation environment in
India. It also provides the results of a 2 year study that measured and analyzed truck and rail transport
vibration for the major freight distribution routes between New Delhi, Bangalore, Mumbai, Chennai,
Hyderabad and Kolkatta.
KEY WORDS: vibration; packaging; India; truck and rail transport; testing
INTRODUCTION
There has been an increase in the development of free trade agreements in all regions of the world in
the past decade. This has allowed for global distribution and marketing of products in an international
market. Products once produced for domestic markets must now be able to compete in international
markets without trade barriers. Increased international commerce and manufacturing have forced many
packaging and logistics engineers to broaden their true understanding of the global distribution
environment. Countries such as Mexico, China, India, Malaysia and even Vietnam are now regularly
mentioned when many of us discuss the logistics involved in our respective distribution systems. What
defines over-the road transport in California will not likely work for roads around Shenzhen, China or
Bangalore, India. The dynamics associated with handling at a Wal-Mart distribution centre in the USA
will most likely differ with those found in operations in China and Thailand.
Current global manufacturing trends require goods and materials to flow throughout the world in what
many consider to be poorly understood distribution environments and channels. That lack of thorough
understanding has triggered comprehensive, yet complimentary global vibration data acquisition
studies. These studies are intended to establish comprehensive awareness of relatively new, unfamiliar
distribution channels, while also providing the basis for proper testing that can better simulate those
channels. The variation in distribution hazards is attributed to a complex interaction between packages,
humans, material handling equipment, logistical vehicles and transfer systems. As the global shipping
environment grows, where companies produce products at a few locations and market and distribute on
a worldwide basis, the impact of the distribution hazards around the world needs to be better
quantified and simulated. While China’s economic developments have dominated global headlines,
India’s own growth has been impressive as well, with gross domestic product rising 5% per annum on
average since 1990.1
The development of various free trade agreements in different regions of the world like North America,
Europe and Southeast Asia is a clear trend to increase global shipments and trade. Driven by the
competitive nature of wanting to attract foreign investment, developing countries realize the
importance of providing an overall attractive business environment. In July of 2003, the China Packaging
Research and Test Center (CPRTC) issued a request for support to develop a national vibration standard
for transporting of packages. This request was triggered in part due to the interest of the China Project,
originally discussed by Baird and Daum2 and again by Baird and Young,3 and supported by several
companies with moving products in and/or out of China. CPRTC’s subsequent request for help in
defining a national random vibration standard documented ‘The distribution environment within China
differs significantly from that of western countries.’ Similarly in 2003, the Center for Distribution
Packaging Research at Michigan State University initiated a multi-year study funded by multinational
companies that are interested in developing a global economy and trade with different regions
especially Asia and South America. One of the key areas that the study focused on is the ‘India Project’
that involved a 2 year measurement of the truck and rail vibration environments among the major
distribution hubs in India. These were selected in cooperation with the multinational companies and
input from the Indian Institute of Packaging. This paper provides the various data measurement
methods and analysis conducted on the various distribution systems. This is then used to develop
recommended test methods to be used by organizations such as the American Society of testing and
Materials (ASTM) and the International Safe Transit Association (ISTA). Two existing test methods, ASTM
D 4169 and ISTA 4AB, are designed to allow users to select and use specific distribution route data when
such knowledge is available for simulation of the vibration environment.
This study focused on measuring and analyzing truck and rail distribution among major distribution
centres of India: New Delhi, Bangalore, Mumbai, Chennai, Hyderabad and Kolkatta. Based on this
collective effort, measurement studies were initiated in India in 2004, by Michigan State University in
cooperation with the Indian Institute of Packaging and the ISTA. This study called the India Project
measured truck transport vibration and rail vibration. The project conducted these measurements over
an 18 month time period. Figure 1 shows the routes mapped for vibration for truck and rail
transportation in India.
The Indian logistics and transportation industry has enormous potential growth prospects for local and
overseas operators alike. A liberalizing market, substantial investment in infrastructure, escalating levels
of disposable income, and vibrant manufacturing and retail sectors are combining to produce a market
environment that could soon rival the fast moving Chinese economy.4 However, as with the Chinese
market there are many challenges for the industry. Congestion, fragmentation, over-regulation and a
weak transport network are holding back the industry.4 There are many risks for Western companies
attempting to enter the market, although this has not prevented the major global logistics operators
from establishing a presence.
India road network
India has recently been ranked as the second largest road network in the world, overtaking China.
Preceded only by the USA, with 6.4 million kilometres of road network, India with its 3.3 million
kilometres has overtaken China (1.8 million kilometres).5 The roads in India can be categorized as
national highways (NHs), state highways (SHs), district roads and rural roads. The NHs are intended to

Figure 1.Truck and rail transportation routes investigated in India.
facilitate medium- and long distance intercity passenger and freight traffic across the country. The SHs
help carry the traffic along major centres within a state. District and rural roads help smaller locations
transport agricultural produce to nearby markets as well as meet their social needs. As of 2003, the
length of NHs in India was 58100km while the length of SHs was 137700km, and the district and village
roads accounted for a majority, 2287500km.6
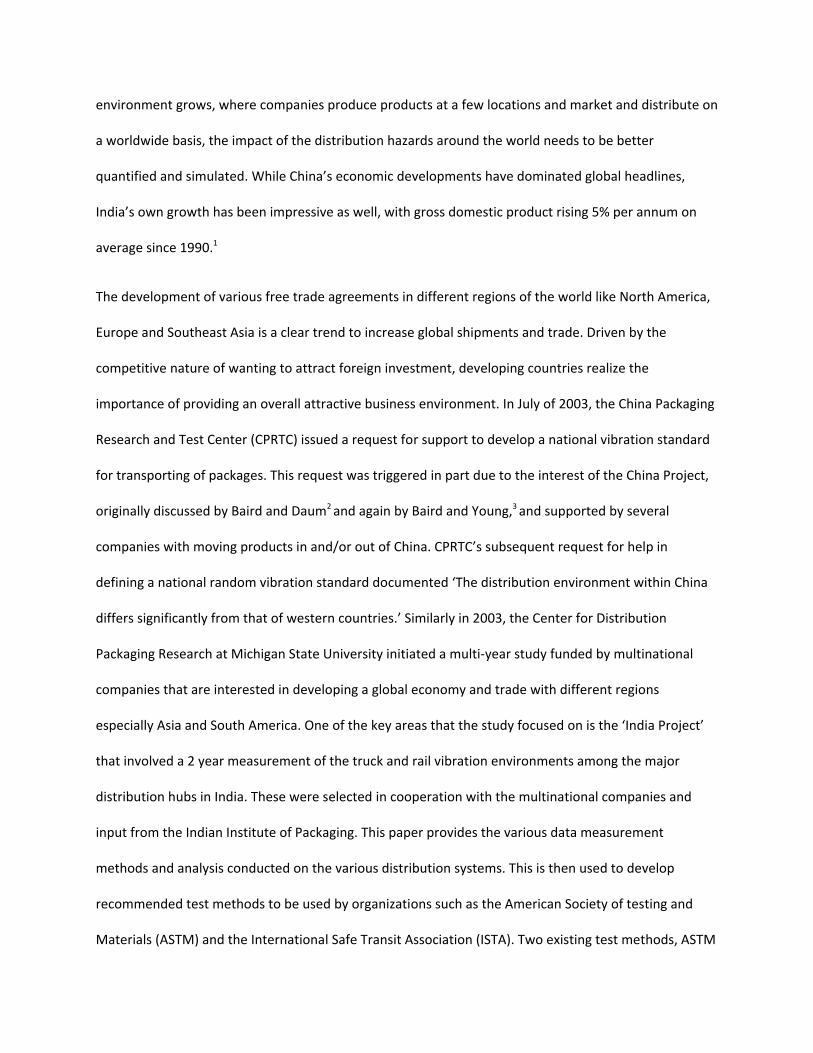
Figure 2 shows all the roads (total and surfaced) including NHs and SHs in India until 2003.6
Although vast improvements for the roadway system in India are planned in the future, its performance
at present is poor, and hindered by capacity constraints and bottlenecks, especially on the trunk routes.
Most NHs are still two-lane or less, and average traffic speed rarely exceeds 30–40km/h, whereas on a
good road network, it should average 60–70km/h.7 An estimated Indian Rupees 20000–30000 crore
(US$4–7 billion) is attributed to lost or damaged products annually due to these constraints. In the rural
sector, 40% of villages lack all weather access roads and are practically cut-off during the rainy season.7
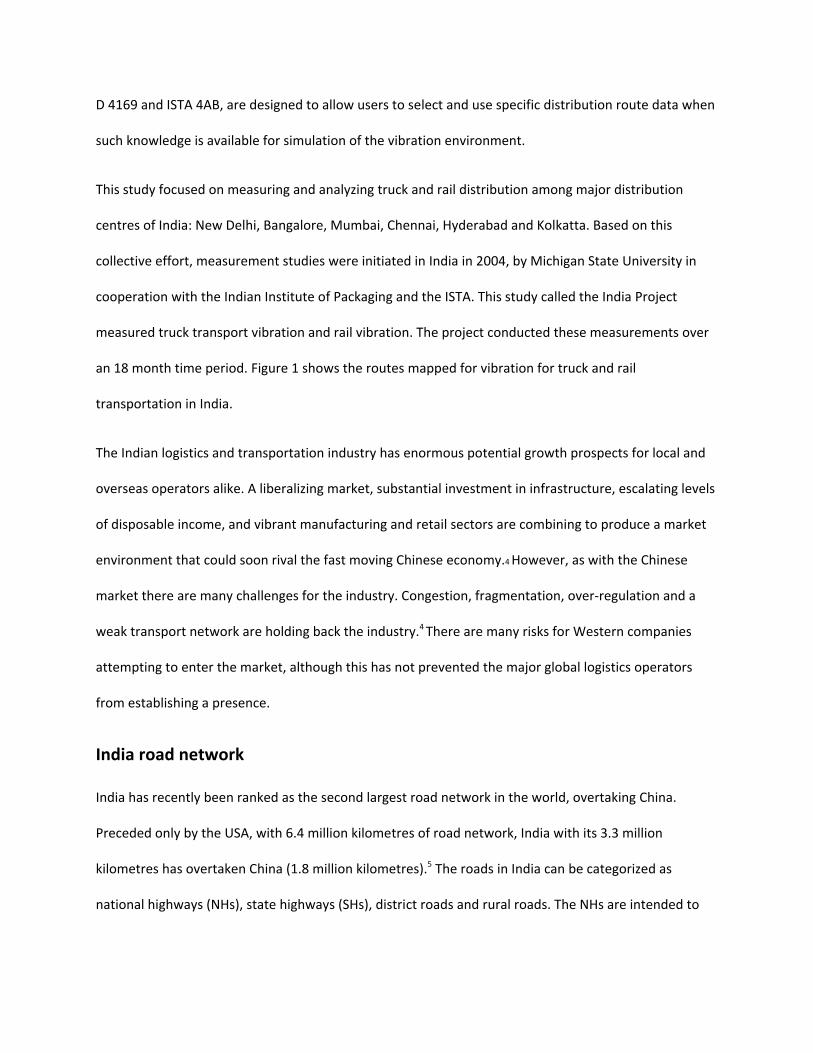
Figure 3 shows the percentage of total paved roads from select countries from around the world. This
has been discussed in some detail in this paper as the extent of vibration measurements was done on
"P<§'
#'• ,,~'"'~E
,,#E~
§ ~'"',
~'"',
"'~~
120
100
80•i 60
~~
40
20
~ I., I .. . ., ., .. L... L.o. -... -... L.,
~ ~ ; ~; ~
~~
~ i ~~ ~
~ ~ ~ ~ ~_Total Length of Roads. Sur1aced Roads DTotal Length of NHDSurlaced NH .Tolal Length 01 SH l:lSurfaced SH
I---- ~
I---- I----
I---- - I- -
r--- - r-"'r- - r- - - r- -
tt= - r- I- - r- - - I- -
~ l- I- ~
~ • ~ • ~.. 8 ~ ~ .
8- ~
~~ ~ •E
~ ~" ~~ •~
~~
in is ~
~I
good paved roads and not on the unpaved inside regional road infrastructure, which would even
attribute to higher levels.
Figure 2.Total and surfaced NHs and SHs in India.6
Figure 3. Roads paved: percentage of total roads.8
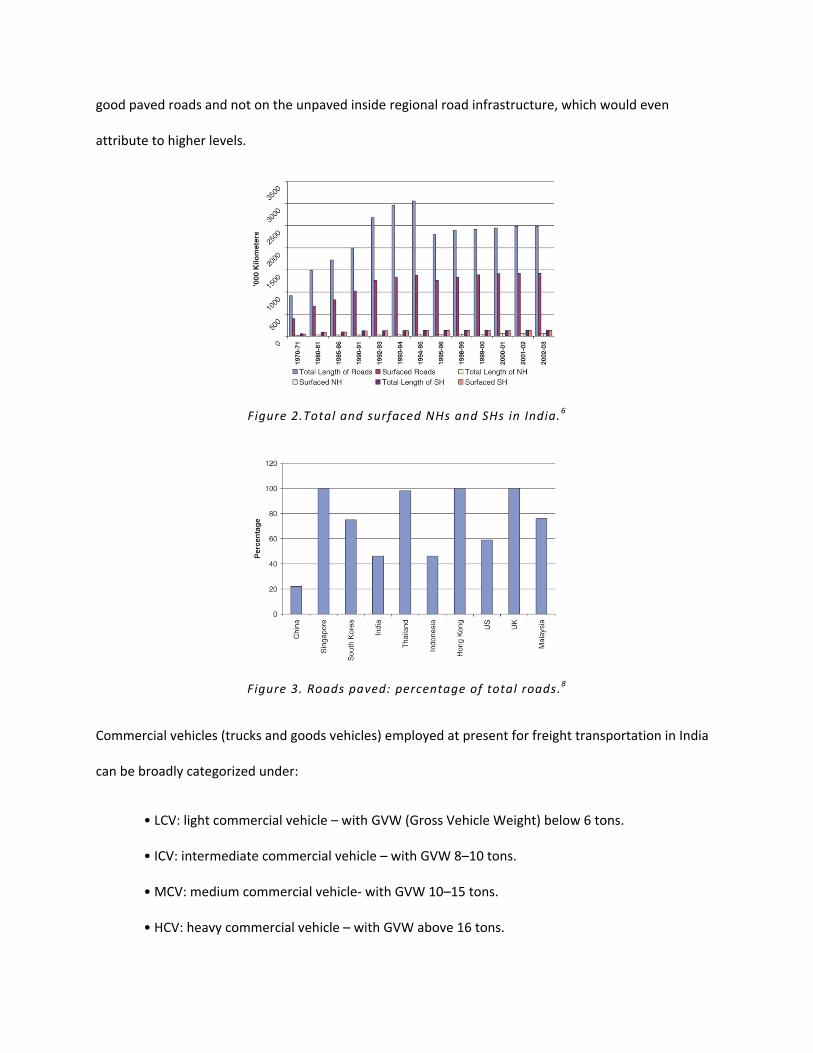
Commercial vehicles (trucks and goods vehicles) employed at present for freight transportation in India
can be broadly categorized under:
• LCV: light commercial vehicle – with GVW (Gross Vehicle Weight) below 6 tons.
• ICV: intermediate commercial vehicle – with GVW 8–10 tons.
• MCV: medium commercial vehicle- with GVW 10–15 tons.
• HCV: heavy commercial vehicle – with GVW above 16 tons.
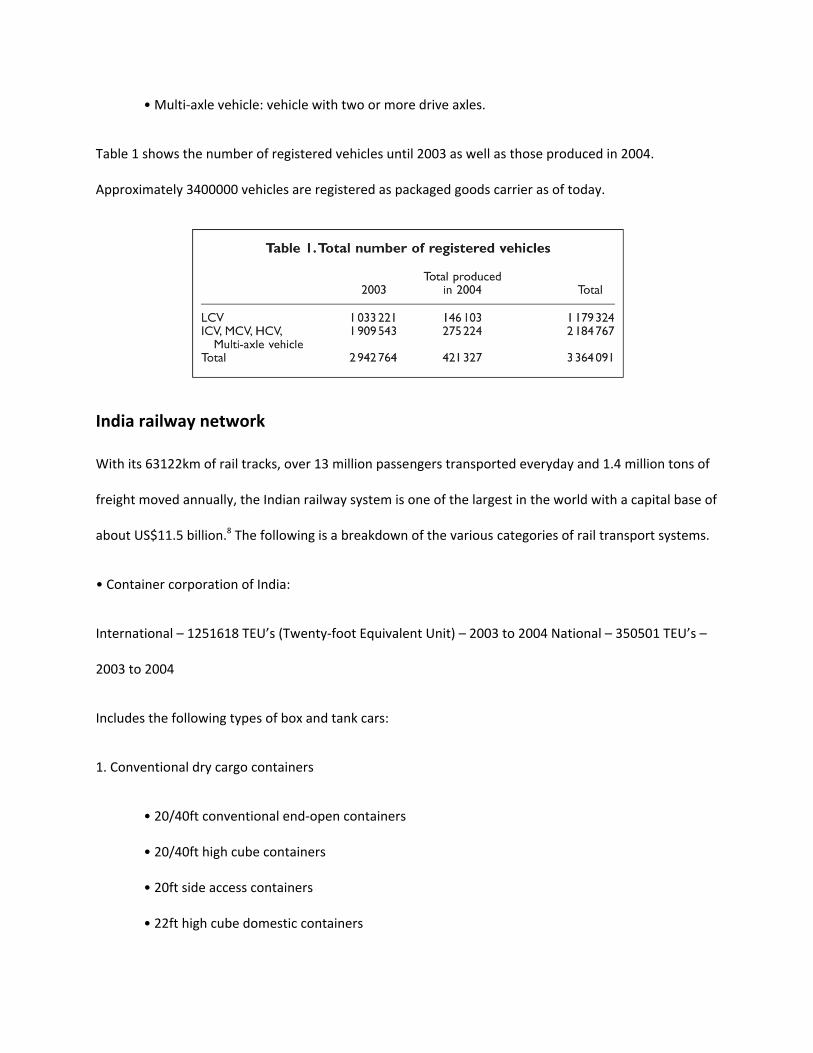
Table I. Total number of registered vehicles
Total produced2003 in 2004 Total
LCV 1033221 146103 I 179324ICV, MCV, HCV, 1909543 275224 2184767
Multi-axle vehicleTotal 2942764 421327 3364091
• Multi-axle vehicle: vehicle with two or more drive axles.
Table 1 shows the number of registered vehicles until 2003 as well as those produced in 2004.
Approximately 3400000 vehicles are registered as packaged goods carrier as of today.
India railway network
With its 63122km of rail tracks, over 13 million passengers transported everyday and 1.4 million tons of
freight moved annually, the Indian railway system is one of the largest in the world with a capital base of
about US$11.5 billion.8 The following is a breakdown of the various categories of rail transport systems.
• Container corporation of India:
International – 1251618 TEU’s (Twenty-foot Equivalent Unit) – 2003 to 2004 National – 350501 TEU’s –
2003 to 2004
Includes the following types of box and tank cars:
1. Conventional dry cargo containers
• 20/40ft conventional end-open containers
• 20/40ft high cube containers
• 20ft side access containers
• 22ft high cube domestic containers
700,----------------------
600 +------------
5OOt-r=...,-----400
300
200
100
2001-02 2006-07
• Originating Freight (Million Tonne) • Freight Tonne Km. (Billion Tonne)
2. Specialty containers
• 20/40/40ft high refrigerated container
• 20/40ft collapsible flat rack and platform container
• 20/40ft open-top container
• 20ft tank container
These are the principal modes of transportation for carrying bulk freight and long-distance passenger
traffic. In 2003–2004, the Indian railways carried around 557.4 million tons of freight and 5112 million
passengers. The Indian railways have an extensive network, which is spread over 63122 route kilometres
(Rkm), comprising broad gauge (45622Rkm), metre gauge (14364Rkm) and narrow gauge (3136Rkm).8
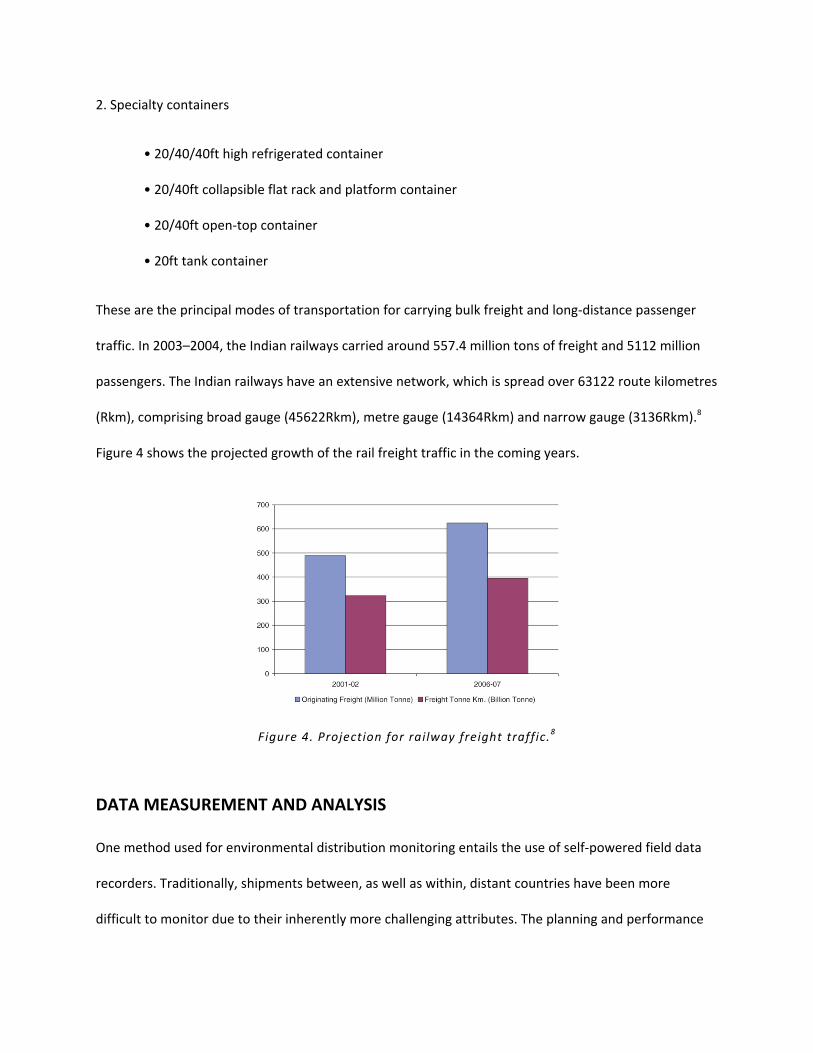
Figure 4 shows the projected growth of the rail freight traffic in the coming years.
Figure 4. Projection for railway freight traffic.8
DATA MEASUREMENT AND ANALYSIS
One method used for environmental distribution monitoring entails the use of self-powered field data
recorders. Traditionally, shipments between, as well as within, distant countries have been more
difficult to monitor due to their inherently more challenging attributes. The planning and performance
requirements for data recorders, personnel and the continuous logistics management have likely limited
the total number of global monitoring projects. However, improvements in technology such as battery
power, instrument memory and data transmission have opened the door to larger scale, continuous
global monitoring studies.
Instrumentation and methodology
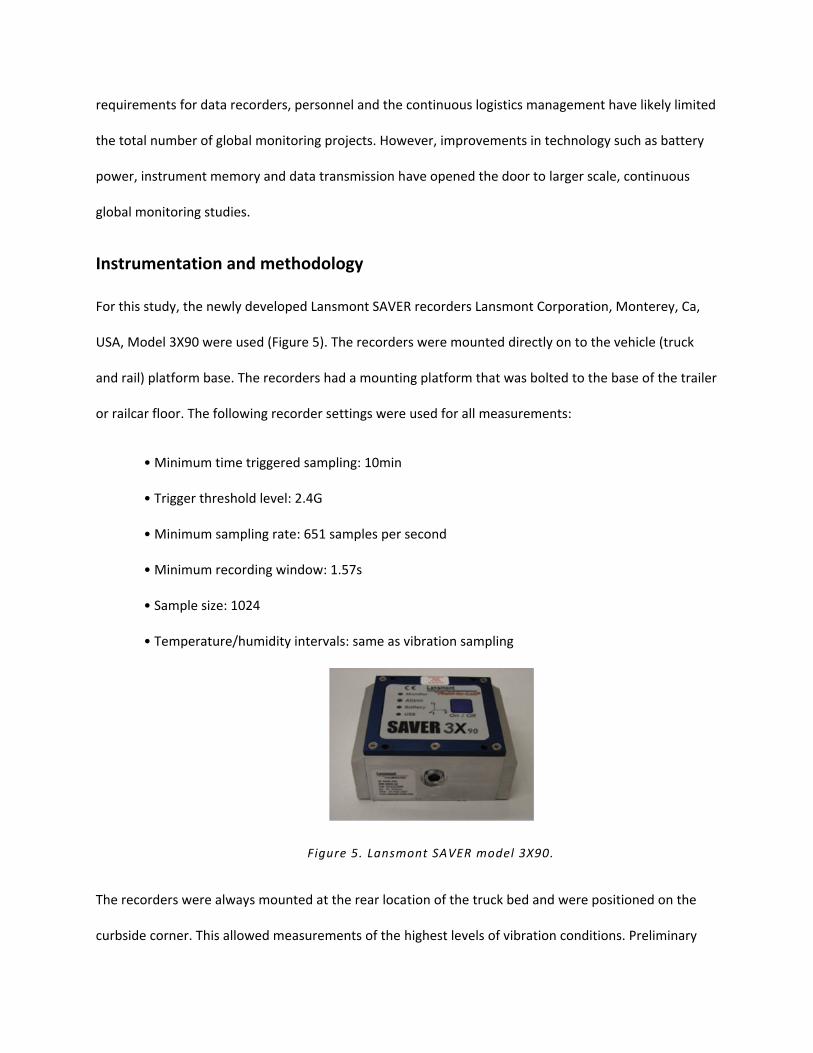
For this study, the newly developed Lansmont SAVER recorders Lansmont Corporation, Monterey, Ca,
USA, Model 3X90 were used (Figure 5). The recorders were mounted directly on to the vehicle (truck
and rail) platform base. The recorders had a mounting platform that was bolted to the base of the trailer
or railcar floor. The following recorder settings were used for all measurements:
• Minimum time triggered sampling: 10min
• Trigger threshold level: 2.4G
• Minimum sampling rate: 651 samples per second
• Minimum recording window: 1.57s
• Sample size: 1024
• Temperature/humidity intervals: same as vibration sampling
Figure 5. Lansmont SAVER model 3X90.
The recorders were always mounted at the rear location of the truck bed and were positioned on the
curbside corner. This allowed measurements of the highest levels of vibration conditions. Preliminary
data collected showed that the rear and curbside location produced the highest levels of vertical
vibration on most highways that are generally two-lane, and have poor shoulders causing vehicle to go
over severe road imperfections.
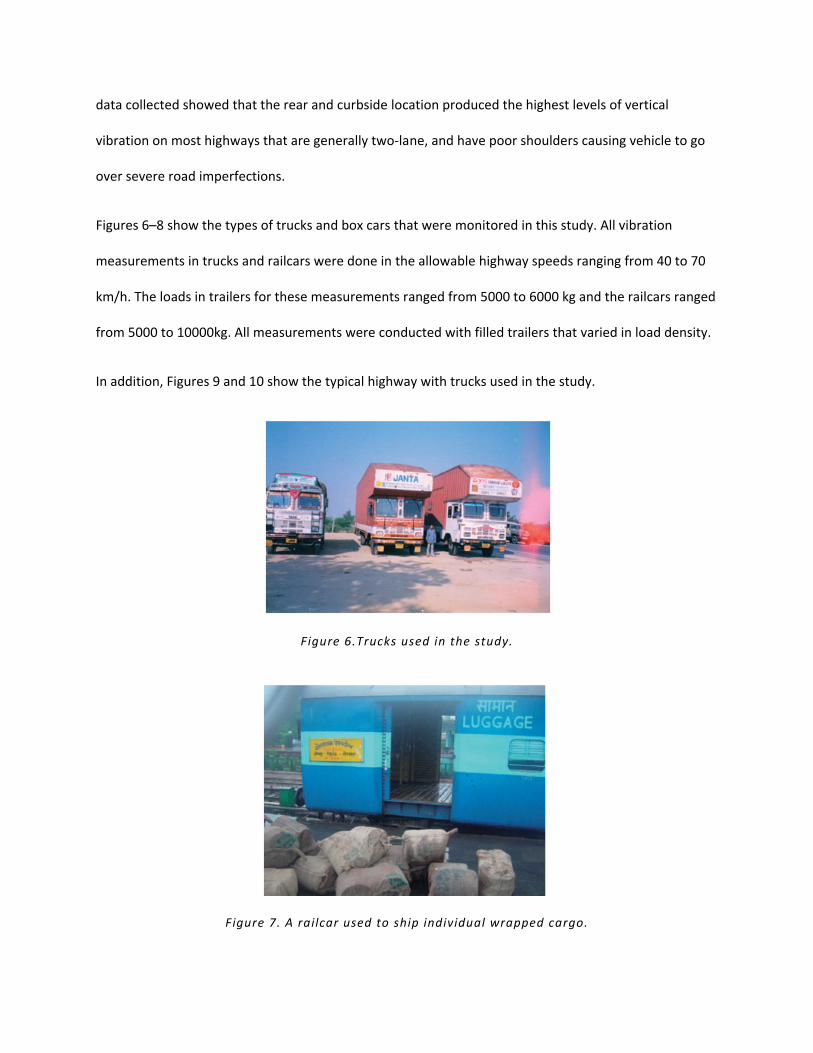
Figures 6–8 show the types of trucks and box cars that were monitored in this study. All vibration
measurements in trucks and railcars were done in the allowable highway speeds ranging from 40 to 70
km/h. The loads in trailers for these measurements ranged from 5000 to 6000 kg and the railcars ranged
from 5000 to 10000kg. All measurements were conducted with filled trailers that varied in load density.
In addition, Figures 9 and 10 show the typical highway with trucks used in the study.
Figure 6.Trucks used in the study.
Figure 7. A railcar used to ship individual wrapped cargo.
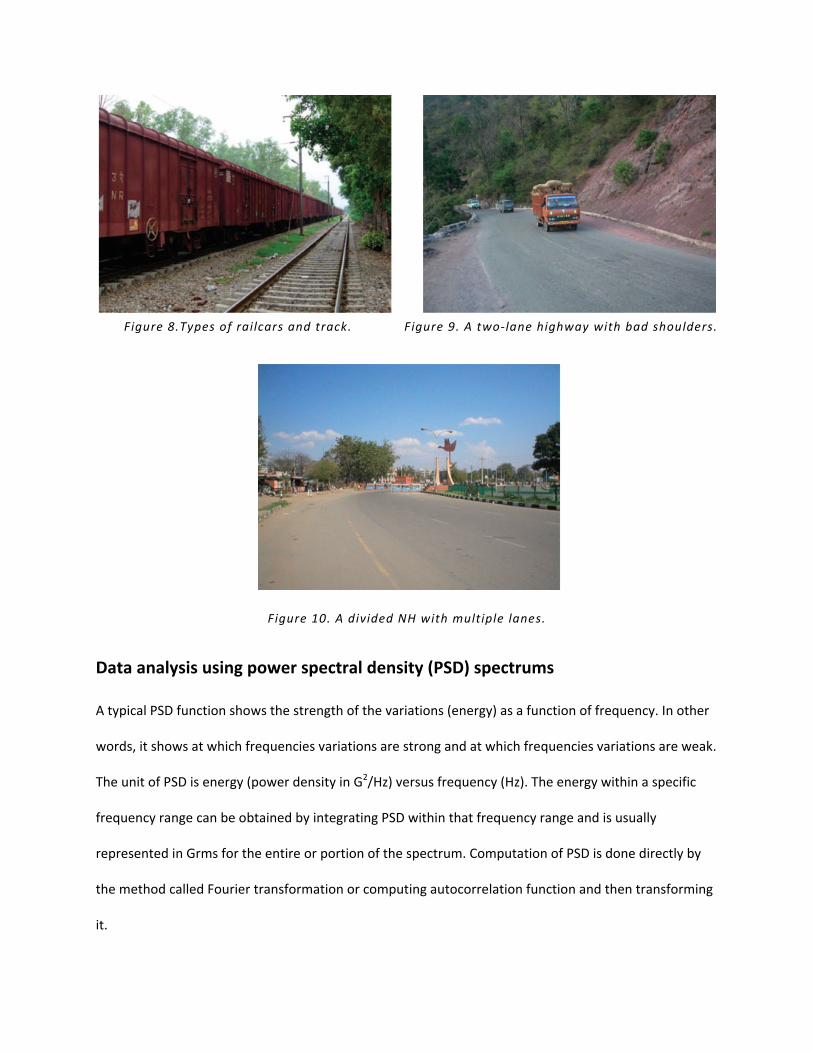
Figure 8.Types of railcars and track. Figure 9. A two-lane highway with bad shoulders.
Figure 10. A divided NH with multiple lanes.
Data analysis using power spectral density (PSD) spectrums
A typical PSD function shows the strength of the variations (energy) as a function of frequency. In other
words, it shows at which frequencies variations are strong and at which frequencies variations are weak.
The unit of PSD is energy (power density in G2/Hz) versus frequency (Hz). The energy within a specific
frequency range can be obtained by integrating PSD within that frequency range and is usually
represented in Grms for the entire or portion of the spectrum. Computation of PSD is done directly by
the method called Fourier transformation or computing autocorrelation function and then transforming
it.
1
1111I1
Structure1 (floor) 40-55 Hz
.-/....
V \ 1/01
I
001H Tires 15-20 Hz I I
I I I I 1111111111111111
.00
.000
Power Density
2 3 10 20 30 100
Frequencv (Hz)
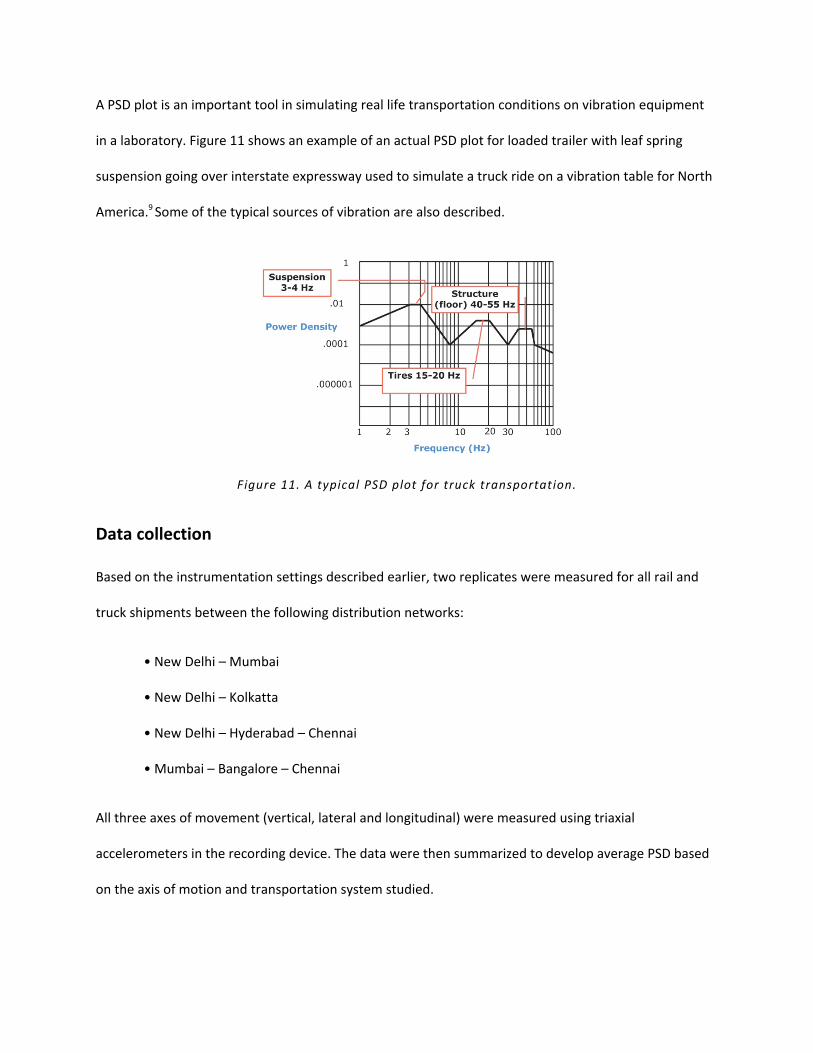
A PSD plot is an important tool in simulating real life transportation conditions on vibration equipment
in a laboratory. Figure 11 shows an example of an actual PSD plot for loaded trailer with leaf spring
suspension going over interstate expressway used to simulate a truck ride on a vibration table for North
America.9 Some of the typical sources of vibration are also described.
Figure 11. A typical PSD plot for truck transportation.
Data collection
Based on the instrumentation settings described earlier, two replicates were measured for all rail and
truck shipments between the following distribution networks:
• New Delhi – Mumbai
• New Delhi – Kolkatta
• New Delhi – Hyderabad – Chennai
• Mumbai – Bangalore – Chennai
All three axes of movement (vertical, lateral and longitudinal) were measured using triaxial
accelerometers in the recording device. The data were then summarized to develop average PSD based
on the axis of motion and transportation system studied.
OBJECTIVES
This study had the following objectives:
1. To measure the vibration levels in truck and rail shipments of freight to various major
metropolitan cities in India;
2. To compare the vibration levels in trucks versus those in railcars; and
3. To develop lab-simulated vibration test methods to simulate truck and rail shipments.
RESULTS AND DISCUSSION
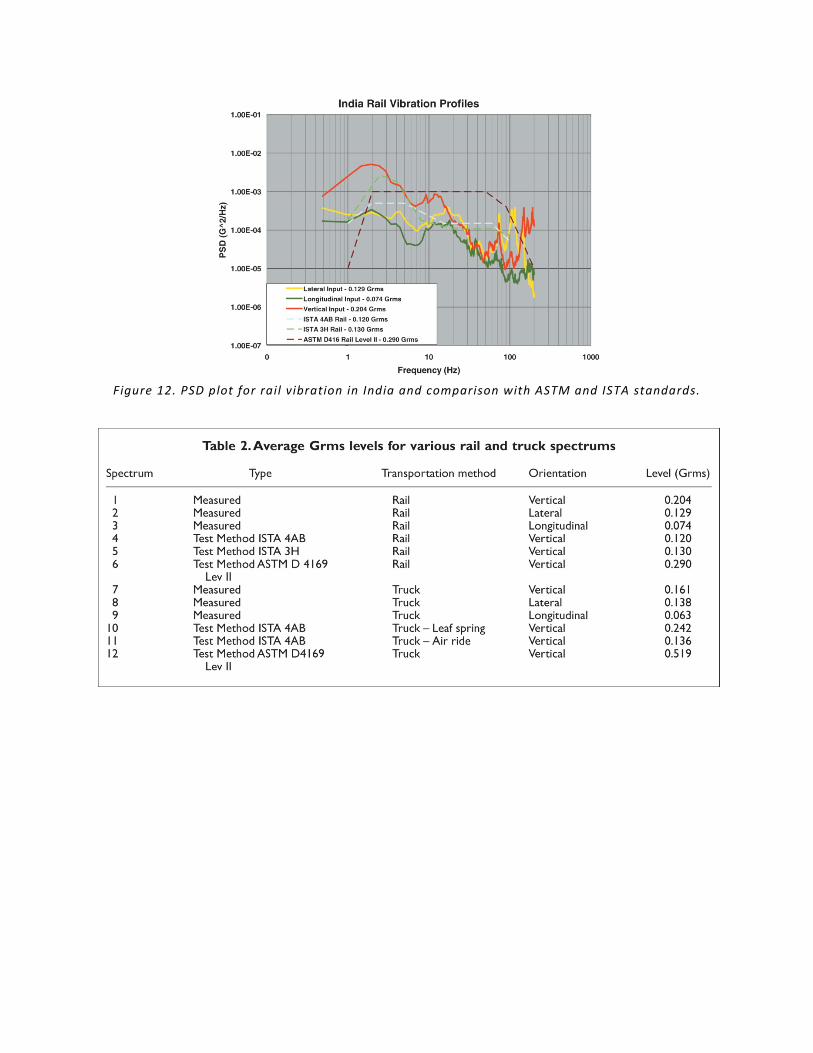
Figure 12 shows the average PSD for all rail shipments in the vertical, lateral and longitudinal modes.
The data spectrums were compared to the ISTA4AB rail spectrum that represents data for rail shipments
in North America in the vertical mode. It is evident that the measured vertical vibration levels, as shown
in the spectrums, are significantly more severe in India than in North America. Table 2 shows the
average Grms levels for all rail spectrums measured in India in comparison to recommended test levels
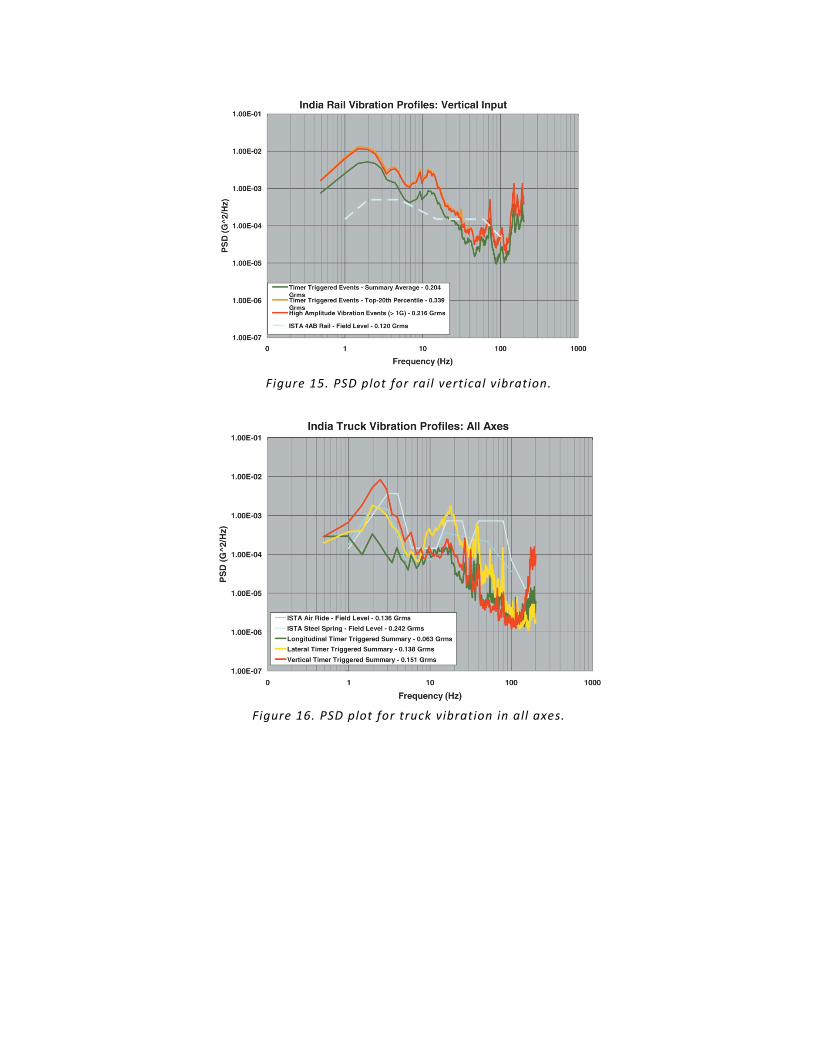
in North America. Figures 13–15 represent the data in the form of the average spectrum for all data, the
spectrum for the top 20% of all severe data and the spectrum for all data that were higher than 1G. This
method has recently been used to test products using variable time and varying intensity levels.9
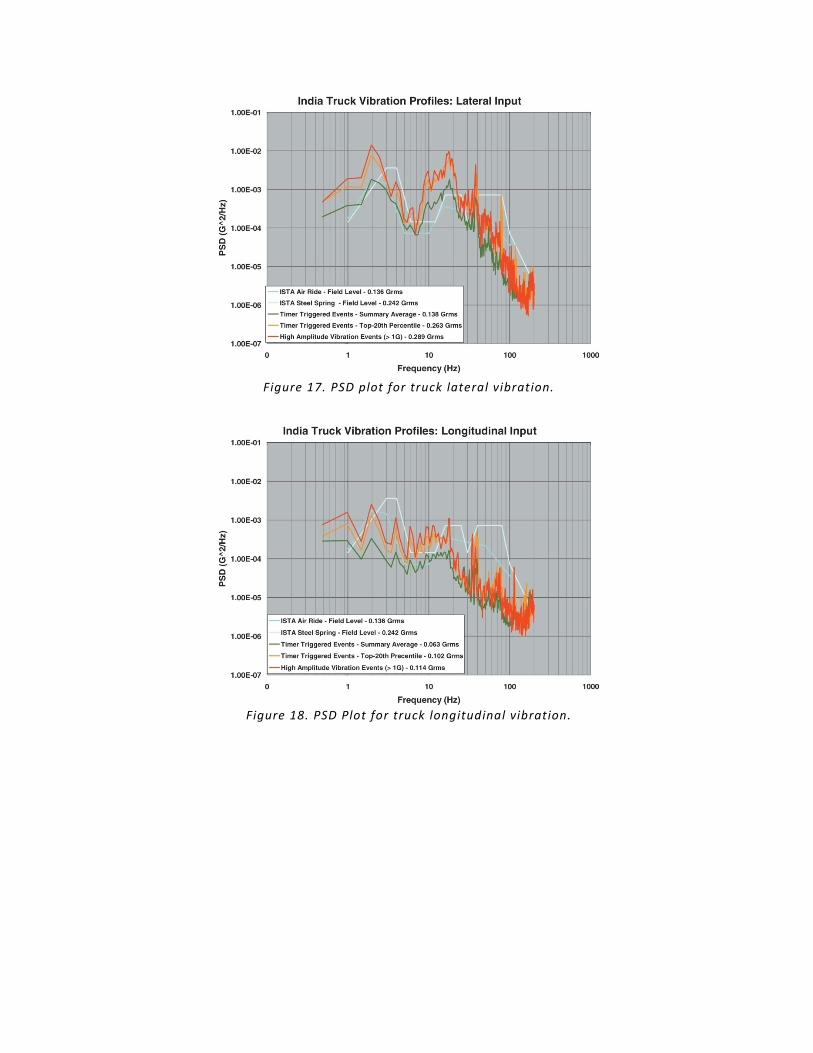
Similarly, Figure 16 represents the vibration levels for all axes. Figures 17–19 show the PSD for lateral,
longitudinal and vertical vibration levels for the most severe and average levels recorded. Table 2
provides a comparison between the various test methods and measured vibration spectrums.
An important distinction between the measured spectrums and drive spectrums is the intensity at low-
level frequencies. In the majority of the comparisons between measured and test spectrums for both
truck and rail vibration, the measured spectrums are at least 10 to 70 times the intensity level (power
density) between frequencies of 1 to 5Hz than test spectrums. These low-frequency, high acceleration
India Rail Vibration Profiles
1.00E-02 1------+_-----+------+--------3
1000'00'0
Frequency (Hz)
1.00E-D3 1------7"'-+_-
1.00E-D6
lalerallnpul- 0.129 Grms
-longitudinalinpul - 0.074 Grms
-Verticalinpul - 0.204 Grms
ISTA 4AB Rail - 0.120 Grms
- -ISTA3H Reit· 0.130 Grms
1.00E-07 L--=-~-~A::S:::TM:c"':=.::"c::R~.;~IL:=:.~:='~II.:.:. O~.290~G~,m~'L-..J. "' ""
o
~?z. 1.00E-04 I------+_r---'\_ --tf'--'-"r-"'---;c~
1.00E-oS 1--------t-------+-----~~~{,.I~---_1
Table 2.Average Grms levels for various rail and truck spectrums
Spectrum Type Transportation method Orientation Level (Grms)
I Measured Rail Vertical 0.2042 Measured Rail Lateral 0.1293 Measured Rail Longitudinal 0.0744 Test Method ISTA 4AB Rail Vertical 0.120S Test Method ISTA 3H Rail Vertical 0.1306 Test Method ASTM D 4169 Rail Vertical 0.290
Lev II7 Measured Truck Vertical 0.1618 Measured Truck Lateral 0.1389 Measured Truck Longitudinal 0.063
10 Test Method ISTA 4AB Truck - Leaf spring Vertical 0.242II Test Method ISTA 4AB Truck - Air ride Vertical 0.13612 Test Method ASTM D4169 Truck Vertical 0.S19
Lev II
Figure 12. PSD plot for rail vibration in India and comparison with ASTM and ISTA standards.

India Rail Vibration Profiles: Lateral Input1.00E-D1
1.00E-D2
1.00E-D3
N:I:N
~ 1.00E-D4
C
'"..1.00E-DS
Timer Triggered Events· Summery Average - 0.129 Grms
1.00E-06 --Timer Triggered Events - Top-20th Percentile - 0.222Grms
--High Amplitude Vibration Events (> 1G)- 0.328 Grms
ISTA 4AB Rail- 0.120 Grms
"
1.00E-D7
o 10
Frequency (Hz)
100 1000
India Rail Vibration Profiles: Longitudinal Input1.00E-01
1.00E-02
1.00E-03
~~ 1.00E-04
C
'"..
1.00E-06
--Timer Triggered Events· Summary Average - 0.014 Grms
--Timer Triggered Events - Top-20th Percentile - 0.111Grms
--High Amplitude Vibration Events (> 1G)· 0.103 Grms
ISTA4AB Rail- Field Level-O.120 Grms
1.00E-07
o 10
Frequency (Hz)
100 1000
Figure 13. PSD plot for rail lateral vibration.
Figure 14. PSD plot for rail longitudinal vibration.
India Rail Vibration Profiles: Vertical Input1.00E-ol
1.00E-02 1-------bP"""c----t------t-------,J
1.00E-03 1-----,.,L-t----""".:>L-:t='I-------t--f+-----i
~e. 1.00E-04 !-------t-------f---"I~~2I1
c:r
1.00E-oS I-------t-------+------~'----~-~-i
--Timer Triggered Events - Summery Aversge - 0.204
1.00E-06 --~i'::r Triggered Events· Top-20th Percentile· 0.339 F-----j-------~Grms
--High Amplitude Vibration Events (,. 1G) - 0.216 Grms
ISTA4AB Rail- Field Level- 0.120 Grms
1000'00,.Frequency (Hz)
1.00E-<l7 ... ~ ~~~__...J ...J
•
India Truck Vibration Profiles: All Axes1.00E-ol
1.00E-02 !-------f---=----+------j--------,!
100010010
Frequency (Hz)
ISTA Air Ride _Field Level. 0.136 Grms
ISTA Steel Spring - Field Level-O.242 Grms
-Longitudinal Timer Triggered Summary - 0.063 Grms
Lsteral Timer Triggered Summary - 0.138 Grms
l;;;;;;;Iv.;;n;;;,~,;;,T~';;m~"~T~'~;g1ig.~';;..;;;;...~m;;m;;.j;'Y!;i;.o~.'~5~'~G~'mL.;;;;;;;:/.. J. .J1.00E-07
•
1.00E-06
1.00E-03
NJ::
"< 1.00E-04~CUlQ.
1.00E-oS
Figure 15. PSD plot for rail vertical vibration.
Figure 16. PSD plot for truck vibration in all axes.
India Truck Vibration Profiles: Lateral Input1.00E-01
100010010
Frequency (HZ)
1.00E-02
ISlA Air Ride - Field Level- 0.136 Grms
1.00E-06 ISTA Steel Spring - Field Level- 0.242 Grms
- Timer Triggered Events - Summery Average - 0.138 Grms
-Timer Triggered Events- To~201hPercentile - 0.263 Grmll
1.00E-07 ,-_H~;~g~h=Am:::::pl="='d='~V~Ib="='=;O~"~E~"~"~"~(~>~'=G~).~O~.2~8~9=G~,m~.:...._... ..J.. "'"
o
1.00E-03
N:I:N
~ 1.00E-04
C<J)..
1.00E-05
India Truck Vibration Profiles: Longitudinal Input1.00E-Q1
1.00E-Q2
1.00E-QJ
N:I:N
~ 1.00E.Q4
C<J)..
1.00E-QS
1.00E-Q6
ISTA Air Ride - Field Level· 0.136 Grms
ISTA Steel Spring· Field Level· 0.242 Grms
-Timer Triggered Events· Summary Average· 0.063 Grms
-Timer Triggered Events- To~201hPrecentile- 0.102 Grms
-High Amplitude Vibratlon Events (> lG) - 0.114 Grms1.00E-Q7
o 10
Frequency (Hz)
100 1000
Figure 17. PSD plot for truck lateral vibration.
Figure 18. PSD Plot for truck longitudinal vibration.
India Truck Vibration Profiles: Verlicallnput
1.00e-02 I------+-,..-:;r----+------t--------I
100010010
Frequency (Hz)
ISlA Air Ride - Field Level - 0.136 Grms
ISlA Steel Spring. Field Level- 0,242 Grms
-Timer Triggered Events - Summary Average - 0.151 Grms
-Timer Triggered Events - Top-20th Percentile - 0.182 Grms
, .OOE-07 '--_H~;g~h~A:::m:;p':::ilud::.:..V:::":::":::":::OO:.:E:::~:::":::"'"(>:::'::G):.:.:::O ..:;19:::'::G,~m::.._...J.__..... ....
o
1.ooe-Q31-----7"1-/'---
1.00E~
1.00e-os 1------+------j---"'lc.l.4Ht------I
..~~ 1.00E-Q4 1------+----.--l<'If/«J''-'o~
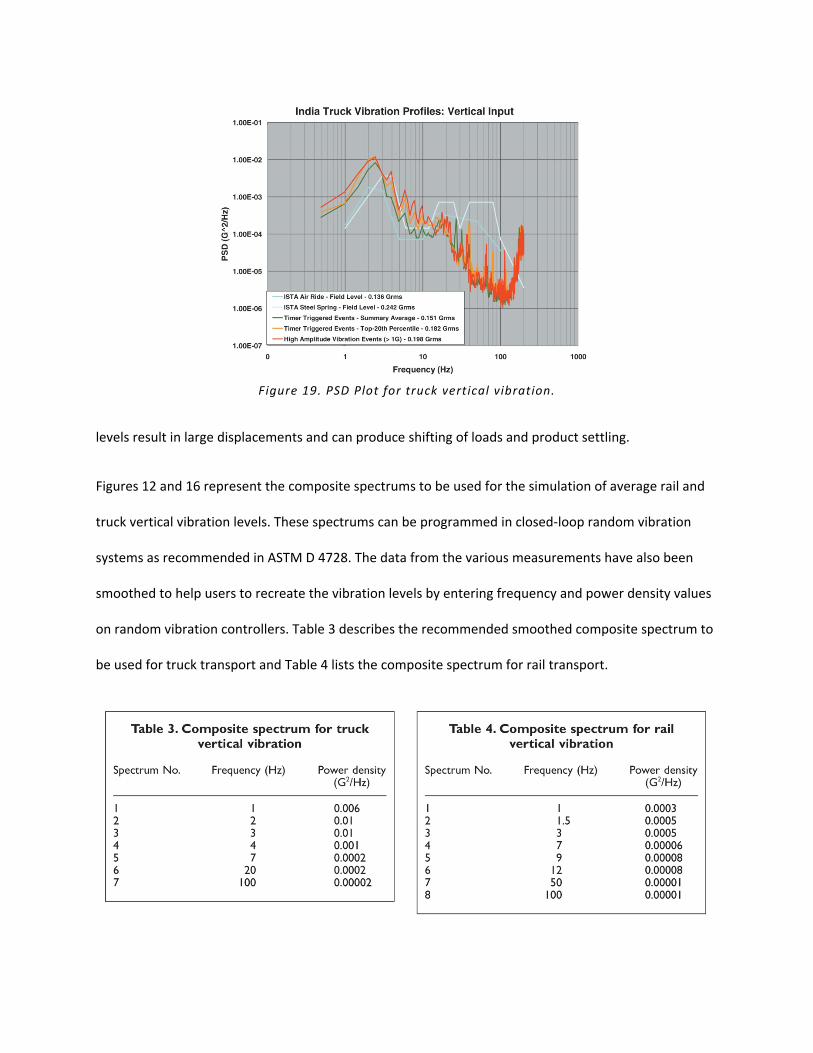
Table 3. Composite spectrum for truck Table 4. Composite spectrum for railvertical vibration vertical vibration
Spectrum No. Frequency (Hz) Power density Spectrum No. Frequency (Hz) Power density(G'/Hz) (G'/Hz)
I I 0.006 I I 0.00032 2 0.01 2 1.5 0.00053 3 0.01 3 3 0.00054 4 0.001 4 7 0.000065 7 0.0002 5 9 0.000086 20 0.0002 6 12 0.000087 100 0.00002 7 50 0.00001
8 100 0.00001
Figure 19. PSD Plot for truck vertical vibration.
levels result in large displacements and can produce shifting of loads and product settling.
Figures 12 and 16 represent the composite spectrums to be used for the simulation of average rail and
truck vertical vibration levels. These spectrums can be programmed in closed-loop random vibration
systems as recommended in ASTM D 4728. The data from the various measurements have also been
smoothed to help users to recreate the vibration levels by entering frequency and power density values
on random vibration controllers. Table 3 describes the recommended smoothed composite spectrum to
be used for truck transport and Table 4 lists the composite spectrum for rail transport.
CONCLUSIONS
The study concludes the following:
• Comparison of the India Project data for both truck and rail vibration, as compared to the
ASTM and ISTA, shows that the measured vertical vibration levels are more severe than levels
used for existing test methods.
• The measured levels in lateral should be used in conjunction with vertical levels for packages
and products that may not be perfectly cubed in the trailer and result in void spaces. The truck
and rail vibration data shows excessive lateral and longitudinal movement.
• The higher intensity vibration levels in India as compared to those from North America and
Europe need to be recognized and appreciated. • There is a difference between vibration levels
in ‘truck’ versus ‘rail’ shipments and are at different frequencies than those observed in North
America and Europe.
ACKNOWLEDGEMENTS
The authors would like to acknowledge the financial support and instrumentation provided by the members of the
Consortium of Distribution Packaging Research for this study.
REFERENCES
1. Connecting India – transport challenges and opportunities, Briefing Report. 2005. Drewry Shipping Consultants Limited, London, England. Product Code R.0503.
2. Baird T, Daum M. A Survey of the China Shipping and Handling Environment, ISTACON 2000. International Safe Transit Association: Orlando, Florida, USA.
3. Baird T, Young D. The China Project: An Assessment of the China Shipping and Handling Environments, ISTACON 2000. International Safe Transit Association: Orlando, Florida, USA. 4. India Transport & Logistics 2005, July 2005; http://www.researchandmarkets.com/reportinfo.asp?report_id=304418 [accessed 27 April 2006].
5. Unnikrishanan R. India drives past China to No. 2 slot in road network, July 2005; The Economic Times Online, http://economictimes.indiatimes.com/articleshow/msid-1164519,prtpage-1.cms [accessed 27 April 2006].
6. Indian Economy, Economy Database. 2005; http://www.indiainfoline.com/econ/andb/infr/infr13.html [accessed 27 April 2006].
7. Roy S. Connecting India – I. 2006; http://www.etconstructionanddesign.com/march_06/infrastructure.htm [accessed 26 April 2006].
8. Opportunities and policy challenges for investmentin India. Background paper. Department of Industrial Policy & Promotion, Ministry of Commerce and Industry, Government of India: New Delhi, India, 2004.
9. Singh J, Singh SP, Joneson E. Measurement and analysis of US truck vibration for leaf spring and air ride suspensions, and development of tests to simulate these conditions. Packag. Technol. Sci. 2006; 19(6): 309– 323.