Embed Size (px)
Citation preview

Chameleonic Radio
Technical Memo No. 13
Measurement and Analysis of the Sti-Co “Interoperable Mobile
Antenna” Kathy Wei Hurst
S.W. Ellingson
September 30, 2006
Bradley Dept. of Electrical & Computer EngineeringVirginia Polytechnic Institute & State University
Blacksburg, VA 24061

Measurement and Analysis of the Sti-Co“Interoperable Mobile Antenna”
Kathy Wei Hurst and S.W. Ellingson∗
September 30, 2006
Contents
1 Introduction 2
2 A General Description of the Antenna 2
3 Measurements 2
4 Model Analysis 5
5 Conclusions 13
∗Bradley Dept. of Electrical & Computer Engineering, 302 Whittemore Hall, Virginia PolytechnicInstitute & State University, Blacksburg VA 24061 USA. E-mail: [email protected]
1

1 Introduction
The Sti-Co, Inc. “Interoperable Mobile Antenna” (Model No. MGNT-TB-V/U/C) isa multiband antenna intended for use in the public safety VHF (150–174 MHz), UHF(406–512 MHz), and 800 MHz (806–896 MHz) bands. A summary of the character-istics of this antenna, provided by the vendor, appears in Figure 1. This antenna isproposed to be a solution to operating on multiple frequency bands without installingmultiple antennas.
In this report, we conduct measurements and perform some analysis of this an-tenna in an attempt to establish its true performance. Section 2 provides a generaldescription of the antenna. Section 3 presents measurements of frequency response,including insertion and return loss. Section 4 describes an electromagnetic model ofthe antenna which is used to predict its pattern and gain. Conclusions are summarizedin Section 5.
2 A General Description of the Antenna
The antenna is shown in Figure 1. It is designed to be mounted on the roof of a vehi-cle. The antenna consists of a central monopole-like radiator that is 45 cm long and1.3 cm in diameter. This central element is surrounded by shorter wires, arranged ina circle of radius 4.25 cm. The shorter wires are approximately 0.25 cm in diameterand come in two lengths: 11.75 cm and 16.75 cm.
The antenna is designed to simultaneously interface to three separate radios: oneoperating in the VHF band, one in the UHF band, and one in the 800 MHz band.The interface is accomplished by use of a triplexer, shown in Figure 2. A triplexer isa device which combines the RF signals at three ports into a single port. Typically,as is the case here, the transfer functions between the ports are designed with aparticular bandpass, such that each of the three ports represents one frequency bandand excludes other bands. In this manner, one VHF band radio, one UHF bandradio, and one 800 MHz band radio can nominally share the same antenna withoutinterfering with each other.
3 Measurements
We performed two series of measurements: one of input return loss (s11) looking intoeach triplexer port, and one of insertion loss (s21) measured across the triplexer, fromradio port to antenna port.
The s11 measurements were performed in situ, with the antenna mounted on theroof of a 1996 Jeep Cherokee. A Rhode & Schwartz FSH3 spectrum analyzer withtracking generator and VSWR bridge options installed was used. The results for each
2

Figure 1: A summary of the antenna provided by the vendor. Appears on-line athttp://www.sti-co.com/ioak mobile.asp (downloaded September 27, 2006).
3

Figure 2: Triplexer (diagram from user manual).
4

Figure 3: s11 looking into VHF radio port of the triplexer.
band/port are shown in Figures 3 through 5.
The s21 measurements were performed using the same spectrum analyzer/trackinggenerator, without the VSWR bridge. The results for each band/port are shown inFigures 6 through 8. An insertion loss of about 1.5 dB was noted across each band,which is consistent with the vendor-provided specifications.
4 Model Analysis
The difficulty in obtaining a uniform/omnidirectional pattern, as desired for a mobileantenna, over a very large frequency range is well-known. Therefore, it is of interest todetermine the pattern of this antenna. The vendor-provided specifications are vague,indicating only that the pattern is “omnidirectional” with gain of “unity”.
However, it is quite difficult to measure the in situ antenna pattern accuratelyfor the frequencies in question. As an alternative, we developed a wire grid modelof the antenna and analyzed this model using the Moment Method. We selected aNEC-2 based implementation of the Moment Method known as EZ-NEC1. The wiregrid model of the antenna is shown in Figure 9, and the actual numerical parametersare as shown in Figure 10.
1http://www.eznec.com.
5

Figure 4: s11 looking into UHF radio port of the triplexer.
Figure 5: s11 looking into 800 MHz radio port of the triplexer. The peak near 890 MHzis probably interference.
6

Figure 6: s21 across triplexer, VHF port.
Figure 7: s21 across triplexer, UHF port.
7

Figure 8: s21 across triplexer, 800 MHz port.
Note that the wire grid model has the form of a dipole, in which a copy of theoriginal antenna is reflected around the plane of the mounting surface. This is a directapplication of image theory [1], which predicts that this dipole form of the antennawill have (1) a terminal impedance equal to twice that of the monopole form, (2) di-rectivity (gain assuming no ohmic loss) equal to half that of the monopole form, and(3) identical pattern characteristics in the hemisphere corresponding to the originalmonopole form. We use the dipole form because this removes any possibility that theground screen is not being treated appropriately in the analysis, and represents nocompromise since the characteristics of the monopole form can be obtained withoutapproximation from the results of analysis of the dipole form.
To establish some confidence in this model, we measured s11 looking directly intothe antenna (in situ, as described in the previous section) and compared the resultto that obtained using the moment method/wire grid model. Figure 11 shows theresult. Note that the agreement is excellent through the first resonance, correspondingto the VHF band. Above 200 MHz, the agreement is poor: The model predictsapproximately the correct “envelope” of the response, but overestimates s11. It ispossible that this represents some loss in the actual antenna that does not exist inthe model. For example, there could be some lossy ferromagnetic material in thebase of the antenna that is used to control impedance or pattern characteristics.Another possibility is that this simply represents insufficient fidelity in modeling thebase region of the antenna, where the various radiators come together in the pillbox-shaped structure. In either case, we expect that the pattern measurements presented
8
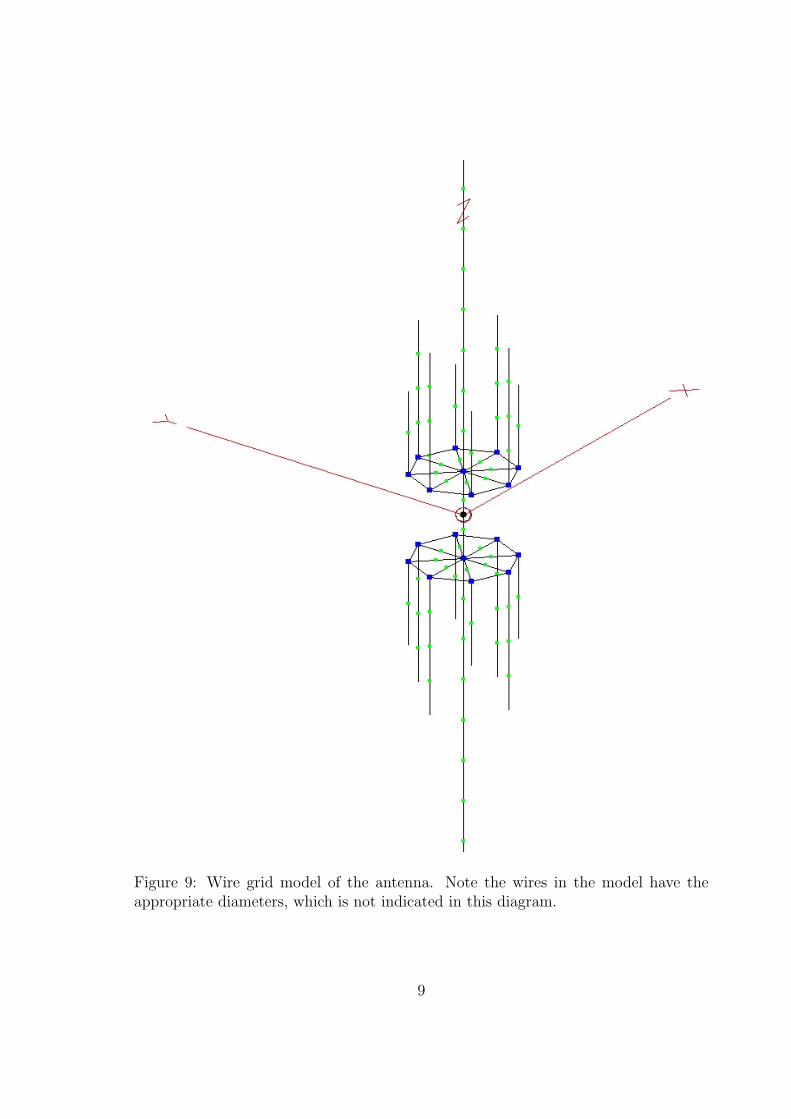
Figure 9: Wire grid model of the antenna. Note the wires in the model have theappropriate diameters, which is not indicated in this diagram.
9

Figure 10: Wire list used to generate the model shown in Figure 9. (Screen shot fromEZ-NEC.)
10

Figure 11: s11 looking directly into antenna (i.e., without triplexer), comparing modelresult to measurement. The peak near 890 MHz is probably interference.
below to be quite accurate, since the pattern depends primarily on the radiatingequivalent currents present on the long wires, and only to a very small degree on thecurrents in the compact base region.
Using the wire grid/moment method model, we predicted volumetric pattern datafor the antenna across the three bands of interest. The H-plane (plane of the hori-zon) patterns were virtually uniform in azimuth, as expected. The E-plane (elevationplane) patterns are shown in Figures 12 through 14. In each case, the pattern is com-puted in the center of the band; i.e., 162 MHz, 459 MHz, and 851 MHz respectively.The patterns shown here are in each case normalized to unity gain in the direction ofmaximum gain. The actual (unnormalized) gain of the antenna in the horizon planeis indicated in the caption.
The VHF pattern is very close to the nominal ideal pattern for a vehicular antennathat is intended to communicate with other ground based units. The UHF patternshows significant degradation relative to this ideal, exhibiting nearly 5 dB loss relativeto the VHF pattern. This is a consequence of the increasing electrical length of theantenna’s central radiator, which has led to undesirable bifurcation in the pattern. Asthe frequency increases further, the horizon gain can be expected to oscillate betweenlow values and high values [1]. The 800 MHz pattern exhibits a position in thisoscillation in which the gain is relatively high.
11

Figure 12: Elevation plane pattern, center of VHF band. Horizon gain is +5.2 dBi.
Figure 13: Elevation plane pattern, center of UHF band. Horizon gain is +0.3 dBi.Gain at 40◦ elevation is +2.1 dB.
Figure 14: Elevation plane pattern, center of 800 MHz band. Horizon gain is +6.2 dBi.
12
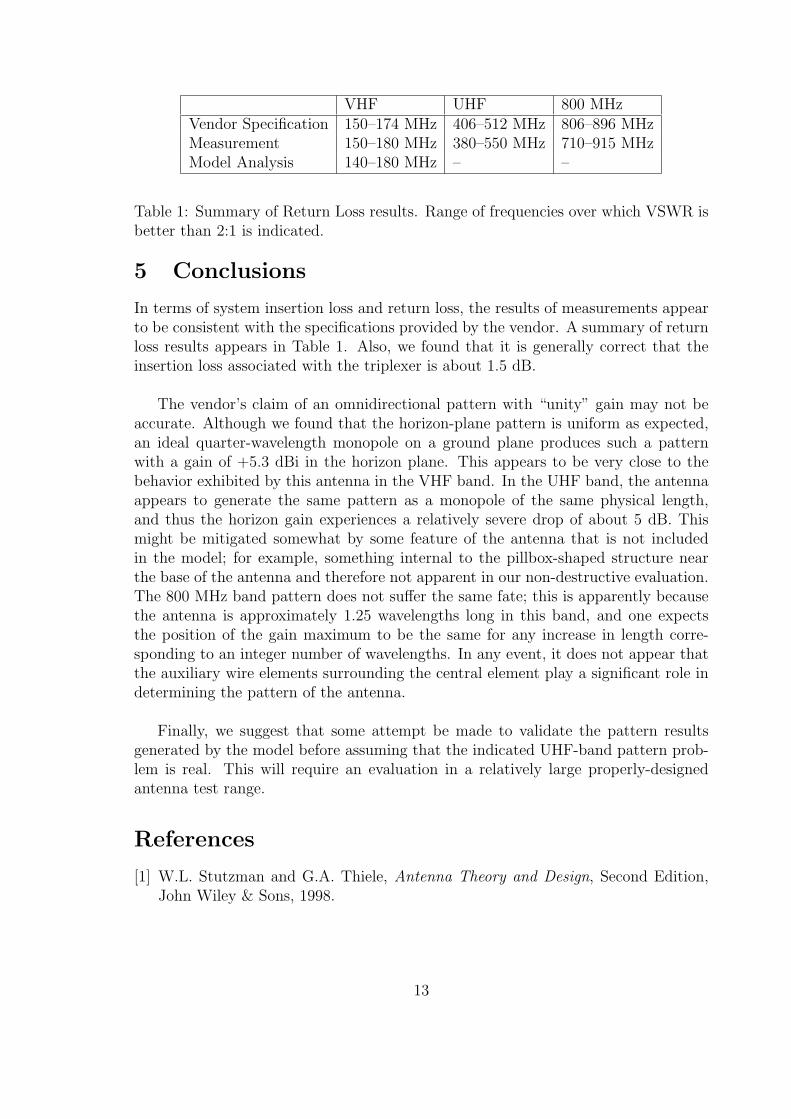
VHF UHF 800 MHzVendor Specification 150–174 MHz 406–512 MHz 806–896 MHzMeasurement 150–180 MHz 380–550 MHz 710–915 MHzModel Analysis 140–180 MHz – –
Table 1: Summary of Return Loss results. Range of frequencies over which VSWR isbetter than 2:1 is indicated.
5 Conclusions
In terms of system insertion loss and return loss, the results of measurements appearto be consistent with the specifications provided by the vendor. A summary of returnloss results appears in Table 1. Also, we found that it is generally correct that theinsertion loss associated with the triplexer is about 1.5 dB.
The vendor’s claim of an omnidirectional pattern with “unity” gain may not beaccurate. Although we found that the horizon-plane pattern is uniform as expected,an ideal quarter-wavelength monopole on a ground plane produces such a patternwith a gain of +5.3 dBi in the horizon plane. This appears to be very close to thebehavior exhibited by this antenna in the VHF band. In the UHF band, the antennaappears to generate the same pattern as a monopole of the same physical length,and thus the horizon gain experiences a relatively severe drop of about 5 dB. Thismight be mitigated somewhat by some feature of the antenna that is not includedin the model; for example, something internal to the pillbox-shaped structure nearthe base of the antenna and therefore not apparent in our non-destructive evaluation.The 800 MHz band pattern does not suffer the same fate; this is apparently becausethe antenna is approximately 1.25 wavelengths long in this band, and one expectsthe position of the gain maximum to be the same for any increase in length corre-sponding to an integer number of wavelengths. In any event, it does not appear thatthe auxiliary wire elements surrounding the central element play a significant role indetermining the pattern of the antenna.
Finally, we suggest that some attempt be made to validate the pattern resultsgenerated by the model before assuming that the indicated UHF-band pattern prob-lem is real. This will require an evaluation in a relatively large properly-designedantenna test range.
References
[1] W.L. Stutzman and G.A. Thiele, Antenna Theory and Design, Second Edition,John Wiley & Sons, 1998.
13