Embed Size (px)
Citation preview

October 1992 UILU-ENG-92-2240
CRHC-92-22
Center for Reliable and High-Performance Computing
. !
/// _.-/
_. J '._J
MEASUREMENT ANDANALYSIS OFOPERATING SYSTEMFAULT TOLERANCE
I. Lee, D. Tang, and R. K. Iyer
(_Ac_-C_-190_73) M__ASUREM_NT ANO
.A_,_ALYSZS !?,7 ,-°ERATIN3 SYSTc__ FAULT
/OLrPAr, C_= (Illinois Univ.) 38 p
N_33-12 540
Unclas
03/60 0127129
Coordinated Science Laboratory
College of EngineeringUNIVERSITY OF ILLINOIS AT URBANA-CHAMPAIGN
Approved for Public Release. Distribution Unlimited.
https://ntrs.nasa.gov/search.jsp?R=19930003352 2020-04-27T03:51:47+00:00Z

Measurement and Analysis of Operating System Fault Tolerance
Inhwan Lee, Dong Tang, and Ravishankar K. Iyer
Center for Reliable and. [-Iigh-Perfqrmance Computing_. t:ooroi0.ate.o _c_ence.t,atm_tory .university ot min£is at t2rpana-t:nampa_gn
1101 West :springneka,AvenueurDal]a, IL OI_UI
September 30, 1992

Abstract
This paperdemonstratesa methodology tomodel and evaluatethe faulttolerancecharacteristicsof operational
software. The methodology is illustrated through case studies on three different operating systems: the TandemGUARDIAN fault-tolerant system, the VAX/VMS distributed system, and the IBM/MVS system. Measurements are
made on these systems for substantial periods to collect software error and recovery data. In addition to investigat-
ing basic dependability characteristics such as major so_ problems and error distributions, we develop two lev-eis of models to describe error and recovery processes inside an operating system and on multiple instances of an
operating system running in a dislributed environmenL Based oft the models, reward analysis is conducted to evalu-ate the loss of service due to software errors and the effect of the fault-tolerance techniques implemented in the sys-
tems. Software error correlation in multicomputer systems is also investigated.
Results show that I/O management and program flow control are the major sources of software problems in
the measured IBM/MVS and VAX/VMS operating systems, while memory management is the major source of
software problems in the TandeJn/GUARDIAN operating system. Software errors tend to occur in bursts on both
IBM and VAX machines. This phenomemm islesspronounced in theTandem system,which can be attributedto
its fault-tolerant design. The fault tolerance in the Tandem system reduces the loss of service due to softwarefailures by an order of magnitude. Although the measured Tandem system is an experimental system working under
accelerated stresses, the loss of service due to software problems is much smaller than that in the measuredVAX/VMS and IBM/MVS systems. It is shown that the softwme Time To Error distributions obtained _rom data
are not simple exponentials. This is in contrast with the conunon assumption of exponential failure times made infanh-tolerant software models. Investigation of error conelatiom show that about 10% of software failures in the
VAXcluster and 20% in the Tandem system occuned conctmeafly on multiple machines. The network-related
software in the VAXcluster and the memory management software in the Tandem system are suspected to be
software reliability bottlenecks for concurrent failures.

I. Introduction
While hardware reliability has improved significantly in the past decades, improvements in software reliability
have not been quite as pronounced. Hardware faults are generally well-understood and e_cient hardware fault
models exist; hardware fault tolerance is relatively inexpensive to implement. Unfortunately none of these is true
for software. It is generally befieved that softwA,-e is the major source of system outages in fault-tolerant systems
[Gray90]. Software faults are logically complex, poorly-understood, and hard to model. Besides, software fault
tolerance is a moving target because software quality keeps changing with design updates and software varies
significantly from system to system. To complicate matters, softwaze interacts with hardware and the environment,
blurring the boundaries between them.
This paper presents a common methodology to model and evaluate the fault tolerance characteristics of opera-
fional software. The methodology is illustrated through case studies on three different operating systems: the
Tandem/GUARDIAN fault-tolerant system, the VAX/VMS distributed system, and the IBM/MVS system. A study
of these three operating systen_ is interesting because they are widely used and are representative of the diversity in
the field. The Taudem/GUARDIAN and VAX/VM$ data provide high-level information on software fault toler-
ance. The MV$ data provides detailed information on low-level error recovery. Our intuitive observation is that
GUARDIAN and MVS have a variety of software fault tolerauce features, while VIVIS has less explicit software
fault tolerance.
Ideally, we would like to have measurements on different systems under identical conditions. The reality,
however, is that differences in operating system architectures, instrumentation conditions, measurement periods, and
operational environments make this ideal practically impossible. Hence, a direct and detailed comparison between
the systems is inappropriate. However, it is worthwhile to demonstrate the applications of a modeling and evalua-
tion methodology on different systems. Also, these are mature operating systems which are slow-changing and have
considerable common functionality. Thus, the major results can provide some high-level comparisons that point to
the type and nature of relevant dependability issues.
The methodology proposed consists of the following steps:
(1) Error data reduction and classification -- This step identifies soRware errors/failures and categorizes them bythe affected system functions.

(2) Characterization of error time distributions -- This step obtains empirical disu'ibutions to describe software
error detection and recovery characteristics.
(3) Modeling and reward analysis a This step performs two levels of modeling and reward analysis.
(a) Low-level modeling of error detection and recovery in an operating system: this is illustrated using
the IBM/MVS data.
Co) High-level modeling and evaluation of loss of work in a distributed environment: this is illustrated
using the Tandem/GUARDIAN and VAX/VMS data.
(4) Investigation of error correlations -- This step identifies _t software errors/failures on multiple
instances of an operating system in a distributed environment and their sources.
The next section discusses the related resem_h. Sections 3 and 4 describe measurements and error
classifications. Section 5 characterizes ¢ffiror time distributions. Section 6 builds two levels of models to describe
software fault tolerance and performs reward analysis to evaluate software dependability. Section 7 investigates
errors correiations in distributed environments. Section 8 summarizes this study.
IL Related Research
Software reliability modeling has been studied extensively and a large number of models have been proposed
[Musa87]. However, modeling and evaluation of fault tolerant software systems are not well understoocL A discus-
sion of key issues appeared in [Hecht86]. An analysis of failures and recovery of the MVS operating system running
on an IBM 3081 machine was given in [Velardi84]. The study showed that 25% to 35% of all software failures
were hardware-related and the system failure probability for hardware-related software errors was close to three
times that for all software errors in general [lyer85a]. A detailed analysis of software error and recovery in the
MVS operating system was discussed in [Hsueh87]. More recently a wide-ranging analysis of failures in the MVS
operating system and IBM database management systems is reported in [Sullivan91, Chillarege92].
Analytical modeling of fault tolerant software has been provided by several authors. In [Laprie84], an approxi-
mate model was derived to account for failures due to design faults; the model was used to evaluate a fault-tolerant
software system. In [Scott87], several reliability models were used to evaluate three different software fault toler-
ance methods. Recently, more detailed dependability modeling and evaluation of two major software fault tolerance
approaches _ recovery blocks and N-version programming _ have been proposed [Arlat90].

Although an operating system is a complex software system, little work has been done on modeling and
evaluation of fault tolerance on operating systems. Major approaches for software fault tolerance rely on design
diversity [Avizienis84, Randel175]. However, these approaches are usually inapplicable to large operating systems
due to immense cost in developing and maintaining these software. Still each of the measured operating systems
has distinct fault tolerance features. Single-failure tolerance of the Tandem system -- although not explicitly
intended for tolerating software design faults m provides the GUARDIAN system with a significant level of fault
tolerance. In the MVS system, softwme fault tolerance is provided by recovery management. The philosophy in
MVS is that the programmer who writes a critical system function envisages typical failure scenarios and provides
recovery routines for each failure, so as to prevent a total system loss.
HI. Measurements
For this study, measurements were made on three ditfefent operating systems: the Tandem/GUARDIAN sys-
tem, the VAX/VMS system, and the IBM/MVS system. Table 3.1 summarizes the measured systems. These systems
are representative of the diversity in the field in that they have varying degrees of fault tolerance embedded in the
operating system. The Tandem/GUARDIAN system lXovides recovery from a wide range of software errors via the
"Nonstop" environment. The IBM/MVS system includes robust recovery management to tolerate software-related
errors. The Quorum algorithm (to be discussed later) implemented in the distributed VAX/VMS system running on
a VAXcluste_ makes the VAXcluster fimction as a k-out-of-n fault-tolerant system. The following subsections intro-
duce the three systems and measurements.
Table 3.1. Summary of Systems
HW System SW System
Tandem Cyclone GUARDIAN
VAXcluster
IBM 3081
Architecture Fault-Tolerance
Single-Failure Tolerance
Workload
Distributed SW Development/Testing
VMS Distributed Quorum Algorithm Scientific Applications
MVS Single Recovery Management System Design/Development
A. Tandem/GUARDIAN
The Tandem GUARDIAN system is a loosely-coupled multiprocessor system built for on-line transaction pro-
cessing [Katzman78]. High availability is achieved via single-failure tolerance. With multiple processors running

processpairs, dual interprocessor buses, dual-port device controllers, disk mirroring, and redundant power supplies,
a single failure in a processor, bus, device controller, disk, or power supply can be tolerated. Key software corn-
portents in the Tandem system are processes and messages [Bartlett78]. From a software perspective, a Tandem
system can be viewed as a collection of processes constantly sending and receiving messages. The GUARDIAN
operating system has extensive low-level software error detection mechanisms. GUARDIAN is also capable of
detecting errors using the "I'm alive" message protocoL Each processor periodically sends an "I'm alive" message
to all processors on the system including itself. If the operating system in a processor does not receive the "I'm
alive" message from another processor, it declares that processor to be failed. Detected errors are corrected by
software either at component or system level using redundancy.
The data for this study was obtained from the processor halt log. The processor halt log is a subset of the
TMDS (Tandem Maintenance and Diagnostic System) event log maintained by the GUARDIAN operating system.
This log consists of events generated by tJmm types of sources: the operating system, hardware, and human inter-
vention. A software halt occurs when the operating system in a processor detects a woblem that cannot be resolved.
According to experienced Tandem engineers, software halts are mostly related to real software problems (i.e.,
software bugs). This is plausible considering the extensive hardware-error detection mechanisms in the Tandem
system. Once a software halt occurs in a processor, a memory dmnp is taken from the processor, and the processor
is reloaded. A fix is made later on based on the results of diagnosis using the memory dump.
Measurements were made on five systems m one field system and four in-house systems m for over a total of
five system-years. Software halts are rare in the Tandem system and only one of the in-house systems had enough
software halts for a meaningful analysis. This system was a Tandem Cyclone system used by Tandem software
developers for a wide range of design and development experiments. It was operating as a beta site and was
configured with old hardware. Sometimes the system was deliberately faulted for analysis. As such it is not
representative of the Tandem system in the field. The measured period was 19 months (from July 1990 to January
1992).
B. VAX/VMS

The VAX/VMS error data was collected from two DEC VAXclusters. A VAXcluster is a distributed com-
puter system consisting of several VAX machines and mass st_age controllers. These machines and controllers
(nodes) are connected by the Computer Interconnect (CI) bus organized as a star topology. Features of the VAX-
cluster include: nodes communicating based on a message-oriented interconnect and memory-to-memory block
transfers, sharing of disk storage through the network (CI bus and ports), and running a distributed version of the
VAX/VMS operating system [Kronenberg86].
The VAX/VMS distributed operating system provides sharing of resources (devices, files, and records) among
users. Major components to provide resource sharing include the file and record management services, disk class
driver, lock manager, connection manager, and SCA software [Kronenberg86]. These routines manage the cluster-
wide resource sharing and communications. They are also responsible for coordinating the cluster members and han-
dling recoverable failures in remote nodes. For the purpose of this study, we will call all these software components
I10 management routines.
One of the VAXcluster design goals is to achieve high-availability by integrating multiple machines in a sin-
gle system. The Quorum algorithm [Kronenberg86] implemented in the distributed VAX/VMS system makes the
VAXcluster function as a k-out-of-n system. Each operating system running in the VAXcluster has a parameter
called VOTES and a parameter called QUORUM. If there are n machines in the system, each operating system usu-
ally sets its QUORUM to Ln/2+ 1 J. The parameter VOTES is dynamically set to the number of machines currently
alive in the VAXcluster. The processing of the VAXclaster proceeds only if VOTES is greater than or equal to
QUORUM. Thus, the VAXcluster functions llke an In/2+ 1 J-out-of-n system.
The first system, VAX1, consisted of seven machines and four controllers. The data collection periods for the
different machines in VAX1 varied from 8 to 10 months (during October 1987 -- August 1988). The cumulative
measurement time was 5.5 machine years. The second system, VAX2, consisted of four machines and one con-
troller. The data collecti6n period was 27 months (January 1989 -- March 1991). There were also 16 other small
machines connected to VAX2 through an Ethemet during the measured period. Measurements were also made on
these machines. The cumulative measurement time for VAX2 was 25.7 machine years. The two systems were used
to provide service for scientists, engineers, and students for their research during the measured periods. The source

of the error data was the ERROR_LOG files produced by the VAX/VMS operating system.
C. IBM/MVS
The MVS is a widely used IBM operating system. Primary features of the system are report_l to be efficient
storage management and automatic software error recovery. In the MVS environment errors are detected by both
hardware and software facilities. The hardware detects conditions such as memory violations, program errors (e.g.,
arithmetic exceptions), and addressing errors. The softwm-e detects more complex error conditions. The data
management and supervisor routines ensure that valid data are processed and non-conflicting requests are made.
For example, these routines can detect an incorrect parameter specification in a system macro, or a supervisor call
issued by an unauthorized program.
The MVS system attempts to correct software errors using recovery routines. The philosophy in the MVS is
that for each major system function, the programmer envisages possible failure scenarios and writes a recovery rou-
tine for each. However, it is the responsibility of the instAnaaon (or the user) to write recovery routines for other
programs. The installation can improve the error detection capability of the system by means of a software facility
called Resource Access Control Facility (RACI_. The RACF is used to build detailed profiles of system software
modules. These profiles are used to inspect the comect usage of system resources. The user can also employ other
software facilities to detect the occurrences of selected events. In addition, the operator can detect some evident
error conditions and decide to cancel or restart a job.
The detection of an error is recorded by an operating system module. The software record contains the infor-/
marion about the event that caused the record to be generated and a 12-bit error symptom code describing the reason
for the abnormal termination of a program. The total number of implemented error codes is more than 500.
Measurements were made on an IBM 3081 mainframe running the IBM/IVlVS operating system. The system
consisted of dual processors with two multiplexed channel sets. Time-staraped, low-level error and recovery data on
errors affecting the operating system functions were collected. During the measured period, the system was used
primarily to provide a time-sharing environment to a group of engineering communities for their daily work on sys-
tem design and development. The measurement period was one year.
7

IV. Error Classification
In this section we identify software errors by processing the raw data and categorize these errors by the
affected system function. A common step in data processing for all these systems is the data coalescing. In a com-
puter system, a single problem commonly result in many repeated error observations occurring in rapid succession.
To ensure that the analysis is not biased by repeated observations of the same problem, all error entries which have
the same error type and occur within a short time (usually five minutes) interval of each other should be coalesced
in data processing. However, the coalescing algorithms used in the three systems are not identical. Also, the error
classification is different for the three systems. This is because these systems have different hardware and software
architectures and error detection mechanisms. In the following discussion, major sources of software problems for
these systems are identified by statistical analysis. This information can only be obtained from mensorement-based
analysis and can be used in designing techniques for software fault tolerance.
A. Tandem/GUARDIAN
The first step of the analysis was to identify event clusters for individual operating systems using the software
failure data from the processor halt log. An event cluster consists of a sequence of related events ending with an
event representing the recovery of a failed operating system. An event cluster represents an operating system failure
and identifies the time period during which the operating system is unavailable. We also created event clusters
using the non-software failure data from the processor halt log in a similar fashion. Further details of the data pro-
cessing are given in [l.ee91].
The processor halt log also provides information about the instruction processing environments (i.e., apparent
causes of software halts from the operating system perspective and processes which were executing) prior to the
occurrence of software halts. Table 4.1 shows the apparent causes of the collected software halts. The codes A, B,
C, and D in the third column of the table will be used to refer to the cause later. The table shows that software halts
occurred most frequendy due to problems in accessing the system disk. Each processor in the system has its own
copy of the kernel in its main memory, but it relies on the system disk, which is accessed through either processor 0
or 1, for all additional operating system related procedures and files. As a result, a problem in accessing the system
disk can cause software halts in multiple processors on the system. This explains why it was the most frequent
8

Table4.1. Apparent Cause of Software Halt (Tandem)
Software Subsystem # Events Cause Breakdown # Events
Process Control 32
Memo_Managem_t 7
Message System 14
Processor Control 1
(A) illegal address reference by
interrupt handler or system process
_) arithmetic overflow occur to
interrupt handler or system process((2) memory manager read errs,
potentially related to system disk access
(D) pro_r_ internal error
4
18
1
(A) page or byte unlock e_or 1
(B) illegal attempt to deallocate segment or
bad segment table entry 3
(C) unexpected page fault ortoo many en-ors on a processor switch 2
_D) physical-page table and segment page table mismatch 1
(A) processor unsynchronized 1
(B) unable to send "I'm alive" message to itself 6
_C_ declared down by the other live processors 7
instruction failure or sequence error on boot 1
(A) uncorrectable memory error I
(13) software encounter unexpected problem
Hardware-Related 21
Application Software 4Unknown 3
during recoveryfi'om powcx failure
_C'_ unexpected interrupt or trap
15
5
cause of the software halts. Problems with the system disk can be caused by software faults or double component
failures such as near-coincident halts in processors 0 and I.
The second most frequent cause of softwarehaltswas an unexpected problem such as insufficient status infor-
marion found by software during a recovery from a power failure. This could be due to design faults in the software
that handles such recovery. The third most frequent cause of software halts was an illegal address reference by an
interrupt handler or a system process, x Illegal address references can occur due to underlying software faults or
undetected hardware errors. Other frequent causes of software halts were failures in sending or receiving the "I'm
alive" message. The underlying cause of this can be an operating system failure, a processor hardware failure, or
interrupt bursts from faulty hardware. The interrupt bursts would interfere with the message interrupt handling. The
"I'm alive" protocol allows problems to be identified by the operating system on which the problem occurs, or by
_System processes consist of a small number of privileged processes. Examples are the monitor process, the memory mmager, the operator
process, and the I/O processes.

other operating systems. Obviously this protocol plays an active role in detecting processor software halts at a high
level.
Table 4.2 shows a breakdown of the software halts based on the processes which were executing prior to the
occurrence of software halts. The process that was executing points to the likely problem source. The third column
of the table lists the cause of the halt (Table 4.1 nomenclaaae). "Non-process" refers to no specific process and
indicates that an interrupt handler or special operating system procedure such as an idle loop was executing. The
system monitor runs in each processor on the system. This process handles housekeeping functions and initiates
process creation and deletion within a processor. Like the system monitor, the memory manager runs in each pro-
cessor. This process services special requests from page-fault interrupt handler to bring needed pages into processor
memory from disk. "All others" refers to a collection of about twenty processes. No more than two software halts
occurred while each of these processes was executing.
The table clearly shows that software halts occurred mostly frequently while the memory manager process
was executing to provide services to user applications. The most frequent cause of these halts was problems in
accessing the system disk. The second most frequent cause was illegal address references by the memory manager
process. The occurrence of software halts due to this cause did not show specific pattern. The fact that there were
eight softwaxe halts due to this cause (Tables 4.1 and 4.2) indicates that these are likely to be due to underlying
software faults.
B. VAX/VMS
Table 4.2. Active Process at Software Halt (Tandem)
Process # Events Cause Breakdown # Events
Non-process 22 memory management (C) 2
message system (A, B, C) 6
hardwm'e-related (A, B) 13unknown 1
System Monitor 4 Im_cessor control I
memory mam_ement (B) 3
process control (A, C) 27
memory management (D) 1
hardware-related (C") 4
Memory Manager 28
Unknown 4
All Others 24
10

Thetime-stamped VAX log contained information on both errors and failures. An error was defined as an
abnormality in any component of the system. If an error led to a termination of the system service on a machine, it
was defined as a failure. A failure was identified by a reboot report following one or multiple error reports. Based
on the information provided by the error logs, errors were classified into three categories: hardware, software, and
unknown. Hardware errors included five different types: CPU, memory, disk, tape, and network errors. Errors of the
same type occurring within five minutes of each other were coalesced into a single error event. Details of the meas-
urements and data processing can be found in [Tang92a].
Software errors were identified from "bugcheck" reports in the log files and divided into three types:
(1) Control -- Problems involving program flow control or synchronization. For example, "Unexpected system
service exception", "Exception while above ASTDEL or on interrupt stack", and "Spinlock(s) of higher rank
already owned by CPU".
(2) Memory -- Problems related to memory management or usage. For example, "Bad memory deailocation
request size or address", "Double deallocation of memory block", "Page fault with IPL too high", and "Kernel
stack not valid".
(3) I/O -- Inconsistent conditions detected by YO management routines. For example, "Inconsistent I/O data
base", _RMS has detected an invalid condition", "Fatal error detected by VAX port driver", "Invalid lock id",
and "Insufficient nonpaged pool to remaster locks on this system".
Table 4.3 shows the software error frequency, percentage, and associated failure probability, by error type for
the measured VAX/VMS systems. The failure probability is defined as the failure frequency divided by the error
frequency. It is seen that control errors are the dominant type of error (57%). However, closer examination of the
data shows that some of control errors were related to network errors, which probably occurred in I/O management
routines. These errors should be regarded as I/O errors. That is, the actual percentage of I/O errors is higher than
that (36%) in the table. Thus, for the measured VAX/VMS systems, major software problems are from program
flow control and I/O management.
The table shows that the failure probability of software errors is high (0.76). This is in contrast with the low
failure probability of hardware errors (<0.01) shown in [Tang92a]. In the two VAXclusters, software failures
11

constitute approximately 23% of all machine failures. That is, the impact of software failures on system dependabil-
ity for the measured systems is significant.
Table 4.3. Statistics for VAX/VMS Software Errors
Type Control Memory I/O All
Error Frequency 97 12 60 169
Percentage 57.4 7.1 35.5 100
Failure Probability 0.86 0.58 0.68 0.76
C. IBM/MVS
For the MVS system, two levels of data coalescing were performed [Hsueh87]. F'n'st, identical error entries
which occurred within five minutes of each other were coalesced into a single record. Second, different error
records occurring in close proximity in time (i.e., within 15 minutes of each other) were merged into a single error
group. The first step eliminates multiple identical entries due to the same problem. The sectmd step provides a
mechanism to identify error bursts containing multiple but different error records. The reduced software errors were
then classified into the following eight types:
(1) Control (CTRL) m invalid use of control statements or invalid supervisor calls
(2) Deadlocks (DLCK) -- endless loops or wait states, or violation of system- or user-defined time limits
(3) I/O & Data Management (IK)) -- errors occurring during I/O management or during creation/processing of
data sets
(4) Storage Management (SM) -- errors in storage allocation/de, allocation or in virtual memory mapping
(5) Storage Exceptions (SE) _ addressing of nonexistent or innecessible memory locations
(6) Programming Exceptions fiE) -- program errors (e.g., arithmetic overflow) other than storage exceptions
(7) Others (OTHR) -- errors which don't fit any of the above categories
(8) Multiple Errors or Error Bursts (MULT) -- error bursts consisting of different types (listed above) of errors
Table 4.4 lists the frequencies of the software errors defined above. The table shows that more than a half
(52.5%) of the software errors were I/O & data management errors, i.e., the major source of software errors is I/O &
data management. A significant percentage (17.4%) of the errors were classified as multiple errors.
12

Table4.4. Statisticsfor IBM/MVS Software Errors
D. Summary
Type of ErrorsControlDeadlock
I/O & Data ManagementProgram ExceptionsStor_e ExceptionsStorage ManagementOthers
Multiple Err_Total
Frequency213
23
1448
65
149
313
66
481
Percent
7.720.84
52.502.435.40
11.352.32
17.44
2758 100.00
In the IBM/MVS system, the major som'ce of software errors was I/O & data management. This is in agree-
ment with the results from the VAX/VMS system whm,e program flow control and I/O management were the major
sources of software enxx_. However, memory management was the major source of software halts in the
Tandem/GUARDIAN system. This difference is mainly attributed to the different hardware and software architec-
tures among these systems. In the VAXcluster, programs highly rely on resource sharing through communications
across the network. A lot of problems arose from the network related hardware and software which are suspected to
be a reliabifity bottleneck. In the Tandem system, memory management implicitly involves lots of activities includ-
ing inter-process communications throughin_'-proceas_" buses as well as disk accesses because each processor
controls a subset of the disks in the system and files are distributed to all disks. As a result, there is a more chance
of software halt occurring due to memory management.
V. Time To Error Distributions
Actual Time To Error CITE) distributions are essential in evaluating software dependability. Often, for sim-
plicity or due to lack of information, TTE or Time Between Error (TBE), and Time To Recovery (T'I_) are
assumed to be exponentially distributed [ArlaO0]. An early measurement-based study showed that the software
Time Between Failures (TBF) in a VM/CMS system had a Weibull distribution [Iyer85b]. This section investigates
TTE (or TBE) and TTR distributions in the measured systems.
A. TBE Distributions
13

Before presenting TBE distributions, we first explain how a TBE distribution is obtained from a multicom-
puter system such as the VAXcluster or Tandem system. We use the VAXcluster to illustrate the procedure. In a
VAXcluster, all machine members are working in a similar environment and running the same version of the VMS
operating system. If the VAXcluster is viewed as a single resource, then every software error on all machines can
be sequentially ordered and a distribution can be constructed. In this way, the whole system is treated as a single
entity in which multiple instances of an operating system are running concutr_tly. The constructed TBE distribu-
tion describes the software error characteristics for the whole system. We will call this distribution the multicom-
puter software TBE distribution.
Figures 5.1, 5.2, and 5.3 show the empirical TBE or TTE distributions fitted to analytic functions using SAS
[SAS85] for the three measured systems. All these distributions failed to fit simple exponential functions. The
fitting was tested using Kolmogorov-Smirnov test or Chi-square test at 0.05 significance level. The two-phase
hyperexponential distribution provided satisfactory fits for the VAXcluster and Tandem multicomputer software
TBE distributions. An attempt to fit the MVS TBE distribution to a phase-type exponential distribution led to a
large number of stages. As a result, the following multi-stage gamma distribution was used:
f (t)= _, a_g(t;oq,st) (5.1)i-I
where ai'dO, _,ai=l, andi=l
0 t <$,
g (t: ct, s) = (5.2)
F-_(t-s) _'le-0-*) t> s 6
A five-stagegamma distributionprovideda satisfactoryfit.
The resultsshow thatthe multicomputer softwareTBE distribution(VAX/VMS and Tandem/GUARDIAN)
can be modeled asa probabilisticcombinationof two exponentialrandom variables,which shows thatthereare two
dominant errormodes. The highererrorrate,),,z,with occurrenceprobabilityct2,capturesboth the errorbursts
(multipleerrorsoccurringon thesame operatingsystem withina shortperiodof time)and concurrenterrors(multi-
ple errorson differentinstancesof an operatingsystem which interactwith each other)on thesesystems. The lower
errorrate,XI, with occurrenceprobability(xl,capturesregularerrorsand providesinterbursterrorrate.
14

0.2
f(t)
0.00
Figure 5.1. TIE Distribution (MVS)
f (t) = 0.748.g (t ;2.1 ,- 1) + 0.55.g (t ;0.5, 0) + 0.069.g (t ;3.5, 3)
__ ______---0.037.:(t,5_0, $_)L0-O98"g (t ;:.?,1_7) ...........
• | | .... I . .i I I I l .... I .... I , , .....
100 200 300 400
t (.u_utes)
f Ct)
Figure 5.2. TBE Distribution (VAX1)
.12.
.08.
.O4.
f (t ) = ctt 3qe -_' + ct_k_e -xa'
%=0.67 k1=0.20
ct2=0.33 Xa=2.75 f(t)
Figure 5.3. TBH Distribution (Tandem)
"12/' f(t) = at_e -;q' + ¢t2_ze -xa'
.081 cq--0.87 ;q--0.10_=0.13 _--2.78
.00o 5 to f5 2o 25 0 5 10 15 20 25
t (days) t (days)
The VAX1 data (Figure 5.2) shows that a significant portion of the TBE instances (42%) are less than one
day. This is in agreement with the existence of multiple errors (i.e., error bursts) in the IBM/MVS system. How-
ever, most of the VAXcluster TBE instances in the bursts are from a half hour to several hours which is longer than
those instances in the IBM/MVS. A few TBE instances in VAX1 are less than a half hour. The software errors
associated with these instances occurred on different machines. This indicates that some errors are correlated (this
issue will be discussed further in section 7). Recall that we have used a coalescing algorithm to merge error reports
within five minutes of each other. However, after this processing, there are still error burst phenomena.
These error bursts may be repeated occurrences of the same software problem, or multiple effects of an inter-
mittent hardware fault on the software. Actually, software error bursts have been observed in laboratory experi-
ments reported in [Bishop88]. The study showed that, if the input sequences of the software under investigation are
correlated (rather than being independent), one can expect more "bunching" of failures than those predicted using a
constant failure rate assumption. In an operating system, input sequences (user requests) are highly likely to be
15

correla_._l. Hence, a defect area can be triggered repeatedly.
Figure 5.3 shows that the probability of error bursts in the Tandem system (0.13) is lower than that in the
VAXcluster (0.32). That is, software halt bursts in the Tandem system are not as pronounced. This can be attri-
buted to differences in the quality of software and error detection mechanisms. The Tandem system is designed for
fault tolerance from the scratch, and the GUARDIAN operating system is believed to be more robust and less likely
to cause repeated problems in a short time. In addition, the Tandem system is equipped with extensive hardware
error detection mechanisms. Most hardware errors in the Tandem system are detected by hardware and corrected by
software, and hence there is less chance that intermittent hardware errors cause repeated software errors.
It is clear that the measured TBE (or TIE) is not exponentially distributed. This result is in contrast with the
typical assumption made in software dependability modeling [ArlaO0]. The results do, however, conform with the
previous measurements on IBM [Iyer85b] and DEC [Castillo81] machines. Several reasons for this non-exponential
behavior, including the impact of workload, were documented in [CastilloS1].
B. TTR Distributions
Figure 5.4 shows the spline-fit for the TTR distribution of multiple errors in the MVS system. The figure also
shows an three-phase hypereXlxmential function to approximate the distribution. Figures 5.5 and 5.6 plot the empir-
ical software TTR distributions for VAXl and the Tandem system. Due to their peculiar shapes, we provided the
raw distributions. Since most MVS software errors do not lead to system failures, the TIR for multiple errors,
Figure 5.4. MVS Multiple Error TTR Distribution (fitted)
f (t)
f (t) = 0.078e -°/u + 0.002426e -°_s6_ + 0.002163e -_°°sszst
0.00 2 4 6 8 10
t (m/nutes)
16

which take the longest time to recover among all software error types in the MVS system, is still short. Most TTR
instances are less than 10 minutes; suggesting that most often reload (at least temporarily) cleared the problems.
In VAX1 (Figure 5.5), most of the TYR instances (85%) are less than 15 minutes. This is atlributed to those
errors which are recovered by on-line recovery or automatic reboot without shutdown repair. However, some TTR
instances last as long as several hours (the maximum is about 6.6 hours). These failures are, in our experience,
probably due to a combination of software and hardware problems.
Figure 5.6 shows that the software recovery time in the Tandem system is longer than that in the VAXcluster.
This is most likely due to the human factor in system maintenance. If a software halt occurs in the Tandem system,
a memory dump is taken and then the halted processor is reloaded. Most software halts occur on one operating sys-
tem. Since the system can tolerate a single operating system failure, operations tend to collect on-line information
for diagnostic uses before attempting a recovery. This explains why the recovery time was longer in the Tandem
system.
Typically, analytical models assume exponential or constant recovery times. Our results show that this does
not apply generally. We have seen that all three TTR distributions are not simple exponentials. For the MVS sys-
tern, since the recovery is usually quick, a constant recovery time assumption may be suitable. For the VAXcluster
and Tandem systems, neither exponential nor constant recovery time can be assumed. More complex "multi-mode"
functions may be needed to model these TI'R distributions.
To summarize, significant software err¢_ were found to occur in bursts on both IBM and VAX machines.
This phenomenon is less pronounced in the Tandem system, which can be attributed to its fault-tolerant design. The
f (t)
Figure 5.5. VAX1 Software TTR Distribution(sample size = 95)
.25
.20
.15
.10
.05
.000 20
Mean = 18Std Dev ffi55Maximum = 396
40 6O
t (m/maes)
m
80 100
Figure 5.6. Tandem Software TIR Distribution(sample size = 50)
0.3
0.2
0.1-_o Nm
I I0 1
Ifl rl I I
2 3 4
tOao_rs)
17

measuredsoftware TBE and TTR distributions failed to fit simple exponential functions. This is in contrast with the
common assumption of exponential failure times made in analytical modeling of software dependability. It was
shown that a multicomputer software TBE distribution can be modeled by a two-phase hyperexponential random
variable: a lower error rate captures regular errors, and a higher error rate captures error bursts and concurrent
errors on multiple machines.
VL Modeling and Analysis
This section presents two levels of modeling and reward analysis to describe and evaluate the dynamic
software dependability behavior. Low-level modeling focuses on e_or detection and recovery inside an operating
system, while high-level modeling and reward analysis deals with distributed systems where multiple instances of
operating systems interact. The IBM/MVS data is suited for illustrating the lower-level modeling, while the
Tandem/GUARDIAN and VAX/VMS data are suited for illustrating the higher-level modeling and reward analysis.
The two-level modeling and reward analysis not only allows us to evaluate software fault tolerance and software
dependability, but also provides a framework to model complex software systems in a hierarchical fashion. We first
presents the high-level modeling and reward analysis, and then presents the low-level modeling.
A. Distributed Operating System
In distributed environments such as the Tandem and VAXcluster systems, multiple instances of an operating
system are running, and these instances form a single overall software system. This subsection discusses a high-
level modeling to analyze this complex overall software system. Each instance of an operating system is treated as
a software element of the overall software system, and software fault tolerance is discussed at a high level. The
modeling is illustrated using the Tandem/GUARDIAN and VAX/VMS data.
The Tandem/GUARDIAN operating system closely interacts with hardware to provide software fault tolerance
at system level. The GUARDIAN is robust and is equipped with extensive mechanisms to detect errors on
software. Built-in single-failure tolerance allows the system to tolerate detected software errors using redundancy at
system level. In a VAXcluster, the system-level software fault tolerance is provided by the Quorum algorithm. The
VAXclustex can function as a k-out-of-n system.
18

Figure6.1.ModelStructure
We constructed two-dimensional continuous-time Markov models using the software error dam from the Tan-
dem and VAXcluster systems. Figure 6.1 shows the model smacture. In the model the state Si.j represents that,
among a total of n systems, i a_e in an error state, and j are in a failure state, and (n - i - j) are running error-free.
The state transition probabilities were estimated from the measured dam. For example, the state Wansition probabil-
ity from state Si,j to state Sid+1 was obtained from
observed number of transitions from state Si,j to state Sx.j+t(6.1)
P(i, j3.(t,j+l) = observed number of transitions from state Sij
To quantify the impact of software errors on overall software dependability, we define two reward functions
for the Markov models. The first applies to a non single-failure tolerant system such as the VAXcluster and the
second applies to a single-failure tolerant system such as the Tandem system.
NSFT (No Single-Failure Tolerance) Reward Function:
We first define the reward function for a non single-failure tolerant system. In this case the system allows
recovery from minor errors, but a major failure results in degradation. Given a lime interval AT, a reward rate for a
single operating system is defined as
r(AT) = W(AT) / zLT (6.2)
where W(AT) denotes the useful service time provided by the operating system during the AT and is calculated by
19

iT in normal stateW(AT) = T - cx in error state (6.3)
in failure state
where c is the number of raw errors occurring on the operating system during the AT and % is the mean recovery
time for a single error. Thus, one unit of reward is given for each unit of time when the operating system is in the
normal state. In an error state, the reward loss depends on the amount of time the operating system spends on error
recovery. (If AT is less than cx, W(AT) is set to 0.) In a failure state, the reward is zero. In a distributed environ-
ment, the reward is also inversely proportional to the number of failed systems.
With the above definition, the reward rate for state Si.) in the model (Figure 6.1) is obtained from
n - i._x - J (6.4)rid = n
where _ is the average number errors occurring in an operating system, per unit time, in state Std, and n is the total
number of systems. Here each operating system failure causes degradation.
SFT (Single-Failure Tolerance) Reward Function:
The Tandem system allows recovery from minor errors and also a single major failure causes no loss of ser-
vice in the Tandem system. To describe the built-in single-failure tolerance, we modify the reward rate (Equation
6.4) as follows:
ri,j =
n -i"_z-j ifj = Oor j =nn
n -i@c-j+ 1if 1 _] _ (n-l).
n
(6.5)
Here we assume that the system can tolerate a single operating system failure (i.e., a single processor software halt)
without noticeable performance degradation. Thus the first failure causes no reward loss. For the second and subse-
quent failures, the reward loss is proportional to the number of these failures.
Given the Markov reward model described above, the expected steady-state reward rate, Y, can be estimated
from [Trivedi92]
r = _, ri.j'_i./ (6.6)S_,jeS
where S is the set of valid states in the model and _,j is the steady-state occupancy probability for state S_,j. The
2O

steady-staterewardraterepresentstherelative amount of useful service the system can provide per unit time in the
long run, and can be regarded as a measure of software system service capability. The steady-state reward loss rate,
(1 - F), represents the relative amount of service lost per unit time due to software errors in the long run. If we
consider a specific group of errors in the analysis, the steady-state reward loss quantifies the performance loss due to
this group of errors.
Table 6.1 shows the estimated steady-state reward loss for the Tandem and VAXcluster systems. The table
shows the reward losses due to software as well as non-software problems. It is seen that software problems
account for 27% of the service loss incurred by all problems in the Tandem system, while they account for 12% of
the service loss incurred by all problems in the VAXcluster system. This indicates that software is not a dominant
source of service loss in the measured VAXcluster system, while software is a significant source of service loss in
the measured Tandem system. A census of Tandem system availability [Gray90] has shown that, as the reliability
of hardware and maintenance improves significantly, software is the major source (62%) of outages in the Tandem
system. Our results corroberate this finding. 2 Although the measured Tandem system was an experimental system,
it has a smaller reward loss Coy an order of magnitude) due to software problems. The same observation was made
for the reward loss due to non-software problems. These observations demonswate the high dependability of the
measured Tandem system. In the VAXcluster, closer examination shows that most service loss due to non-software
was actually incurred by hardware.
What Does Single-Failure Tolerance Buy?
Table 6.1. Steady-State Reward Loss
System Measure Software Non-Software Total
Reward Loss 0.00006 0.00016 0.00022Tandem
Percentage 27.3 72.7 100
Reward Loss 0.00077 0.00"565 0.00642VAXcluster
Percentage 12.0 88.0 100
2Note that it it ina_ to directly compare our number with Gray's because Gray', is an aggregate of many systems and ours is ameamremeat on a single system.
21

The Tandem/GUARDIAN data allows us to evalual¢ the impact of built-in software fault tolerance on system
dependability and to relate loss of service to different software components. We performed reward analysis using
the two reward rates defined above (SFT and NSFT) to evaluate the reduction in reward loss (loss of service) due to
the software fault tolerance. The reward rate defined in Equation 6.4 allows us to determine the reward loss assum-
ing no SFT. The reward rate defined in Equation 6.5 measures reward loss under SFT. The ratio of the two
rewards estimated using these reward rate definitions determines the gain due to SFF. We evaluated the impact of
seven different groups of halts on overall software dependability in the Tandem system: all software halts, the five
mutually exclusive subsets of software halts (Table 4.4), and all non-software halts.
Table 6.2 shows the estimated steady-state reward loss due to the seven groups of halts for the two reward
measures. The first row of the table shows that single-failure tolerance of the measured Tandem system reduced the
loss of service incurred by all softwmm halts by 96%, which clearly demonstrates the effectiveness of this fault toler-
ance mechanism against software failures. The table also shows that memory management is a potential dependabil-
ity bottleneck in the Tandem system: the software halts which occurred while the memory manager process was
executing account for 50 % of the loss of service incurred by all software halts (with SFT). The percentage was 25
with NSFT. A higher percentage of reward loss with SFT, compared with that with NSFT, indicates that the
software halts which occurred while the memory manager process was executing tended to occur near-coincidentally
on multiple operating systems.
The software halls under _all others _ account for 65 % of the loss of service incurred by all software halts
with NSFT. However, their real contribution to the measured system (with SFT) is about 17 %. This indicates that
Table 6.2. Steady-State Reward Loss (Tandem)
Source of Dam
all s/w halts
s/w halts under non-process
s/w halts under system monitor
s/w halts under memory managers/w halts under unknown
s/w halts under all others
with SFT
Reward Loss Percentage
0.O0006 100 %
0.00002 33 %
0.0 0 %
0.00003 50 %
0.0 0 %
0.00001 17 %
with NSFT
Reward Loss Percentage
0.00136 100 %
0.00012 9 %
0.00000
0.00034 25 %
0.00000
0.00088 65 %
Reward LoSSsFr
Reward LOSSNsFr
4.4 %
16.7 %
0%8.8 %
0%
1.1%
all non-s/w halls 0.00016 0.00206 7.8 %
22

these were mostly single operating system failures. The high szeady-suue reward loss with NSFT indicates that it
took longer to recover from some of these halts. Interpretation of the impact of the software halts under "non-
process" is less interesting because many of these were due to unexpected problems found by software during
recoveries from power failures. This implies that the affected processors were already down due to power failures.
Some of these halts occurred in two or three processors at almost the same time. There were not enough software
halts under the system monitor of "unknown" to provide meaningful interpretations.
The last row of Table 6.2 shows that non-software halts caused more loss of service than software halts. This
can be attributed to two reasons. First, some non-sol, ware halts which occur due to permanent hardware faults are
resolved by replacing the faulty hardware, resulting in long recovery times and more loss of service. Second, non-
software halts can occur due to environmental or operational faults. An environmental or operational fault can
potentially affect all lxocessors in the system. Both the first and last rows of Table 6.2 show that, although the
measured Tandem system was in a high-stress environment, the steady-state reward loss is small (with SFT). This
reflects the high dependability of the measured system. The last row also shows that single-failure tolerance
reduced the loss of service incurred by all non-softwaz'e halts by 92%. The percentage is slightly lower than that for
software halts, which is attributed to the non-software halts, due m environmental or operational faults, which
affected the whole system.
B. Single Operating System
This subsection discusses a low-level modeling to describe error detection and recovery inside an operating
system. The methodology is illustrated using the IBM/MVS data. The MVS operating system provides software
fault tolerance through recovery management. It also provides a flexible platform to build additional software fault
tolerance at user level. Recovery routines in the MVS operating system provide a means by which the operating
system prevents a total loss on the occurrence of software errors. When a program is abnormally interrupted due to
an error, the supervisor routine gets the control. If the problem is such that further processing can degrade the sys-
tem or destroy data, the supervisor routine gives the control to Recovery Termination Manager (RTM), an operating
system module responsible for error and recovery management. If a recovery routine is available for the interrupted
program, the RTM gives the control to this routine before it terminates the program. The purpose of a recovery
23

routine is to free the resources kept by the falling program, to locate the error, and to request either a retry or the
termination of the program. Recovery routines are generally provided to cover critical MVS functions. However, it
is the responsibility of the installation (or the user) to write recovery routines for other programs.
More than one recovery routine can be specified for the same program. If the current recovery routine is
unable to restore a valid state, the RTM can give the control to anothe_ recovery routine, if available. This process
is called percolation. The percolation process ends if either a routine issues a valid retry request or no more
recovery routines are available. In the latter ease, the program and its related subtasks are terminated. If a valid
retry is requested, a retry is attempted to restore a valid stale using the information supplied by the recovery routine
and gives the conu'ol to the program. In order for a retry to be valid, there should be no risk of error recurrence and
the retry address should be properly specified. An error recovery can resdt in the following four situations:
(1) Resume operation (Resume Op) -- The system suceessfidly recovered from the error and returned the con-
trol to the interrupted program.
(2) Task Termination (Task term)--- The program and its relsa0ed subtasks are terminated, but the systemdidn't fail.
(3) Job Temnination (Job term)--- The job in control at the time of the ezror is aborted.
(4) System Damage (System failure)--- The job or task, which was terminated, is critical for system operation.
As a result of the termination, a system failure occurs.
Using the collected error and recovery data, we constructed a continuous-time Markov model that provides a
complete view of the measured MVS operating system from the error detection to the recovery. The states of the
model consists of the eight different types of error states and the four states resulting from error recoveries. Figure
6.2 shows the model. The norma/state represents that the operating system is running error-free. The transition
probabilities wee estimated from the measured data using Equation 6.1. Note that the system failure state is not
shown in the figure. This is because the occurrence of system failure was rare and the number of observed system
failures was statistically insignificant.
Table 6.3 shows the waiting time characteristics of the normal and error states in the model. 3 The table shows
3 The waiting time for state i is the time that the system spends in state i before making a transition. Some researchershave used the team sojourn time for this measure.
24

Figure 6.2. Software Error/Recovery Model
o.o278
0.0243
25

State
NormalCTRL
DLCK
I/oPE
SESM
OqTqR
MULT
Table 6.3. Waiting Time
# of Mean Waiting Time
obs (in seconds)
2757 10461.33
213 21.92
23 4.72
1448 25.0565 42.23
149 36.82
313 33.40
66 1.86
481 175.59
StandardDeviation
32735.04
84.21
22.61
77.62
92.9879.59
95.01
12.98
252.79
that the duration of a single error is typically in the range of 20 to 40 seconds, except for deadlock (DLCK) and
"others" (OTHR). The table also shows that errors of the type "others" (OTHR) are relatively insignificant because
their average duration is less than 2 seconds. The average recovery time from a program exception is twice as long
as that from a control error (21 seconds versus 42 seconds). This is probably due to the extensive software involve-
ment in recovering fi'om Ixogram exceptions. Table 6.3 clearly brings out the importance of incorporating multiple
errors (or error bursts) into a system model. The average duration of a multiple error is at least four times longer
than that of any types of single error.
An error recovery can be as simple as a retry or can be more complex requiring several percolations before a
retry. The problem can also be such that no relry or percolation is possible. Figure 6.2 shows that about 83.1% of
all retries are successful. The table also shows that the operating system attempts to recover from 93.5% of I/O and
data management errors and 78.4% of control related errors by retries. These observations indicate that most I/O
and control related errors are relatively easy to recover from, compared to the other types of errors such as deadlock
and storage errors. Also note that "no percolation" occurs only in recovering from storage management errors. This
indicates that storage management errors are more complicated than the other types of errors. The problem can also
be such that no retry or percolation is possible.
Model Behavior:
The dynamic behavior of the modeled operating system can be described by various probabilities. Given the
irreducible semi-Markov model of Figure 6.2, the following steady-state probabilities were evaluated. The deriva-
tions of these measures are given in [Howard71].
26

(1) transition probability (_j) -- given that the system is now making a transition, the probability that the tran-
sition is to state j
(2) occupancy probability (_j) -- at any instant of time the probability that the system occupies state j
(3) mean recurrence time (Oj) -- mean recurrence time of state j
The occupancy probability of the normal state can be viewed as the operating system availability without
degradation. The state transition probability, on the other hand, represents the dynamic behavior of the error detec-
tion and recove_ry processes in the operating system. Table 6.4(a) lists the state transition probabilities and occu-
pancy probabilities for the normal and error states. Table 6.4(b) lists the state transition probabilities and the mean
recurrent times of the recovery and result states. A dashed line in the table indicates a negligible value (less than
0.00001). Table 6.4(a) shows that the occupancy probability of the normal state in the model is 0.995. This indi-
cates that in 99.5% of time the operating system is running error-free. In 0.5% of time the operating system is in
error or recovery states. Table 6A(b) shows that in more than half of this time (i.e., 0.29% out of 0.5%) the operat-
ing system is in the multiple error state. An early study on the MVS error/recovery showed that average reward rate
for the software error/recovery state was 0.2736 [Hsueh88]. Based on this reward rate and the occupancy probabil-
ity for the error/recovery state obtained above (0.005), we estimate that the steady-state reward loss is 0.00363
which is larger than that estimated for the Tandem and VAXcluster systems.
Table 6.4. Error/Recovery Model Characteristics
Normal Error state
Measure state CTRL DLCK I/O PE SE SM OTHR MULT
0.2474
0.9950
0.0191
0.00016
0.0020 0.1299
0.00125
0.0060 0.0134 0.0281 0.0057
0.000098 0.000189 0.00036
(a)
0.0431
0.002913
Measure Retry
..x. 0.1704 0.0845O 4.25 8.55
Recovery statePercolation No-Percolation
0.0030
241.43
* - in hour
(b)
Result
Resume op Task term .Job term
O.1414 0.0712 0.0348
5.11 10.16 20.74
27
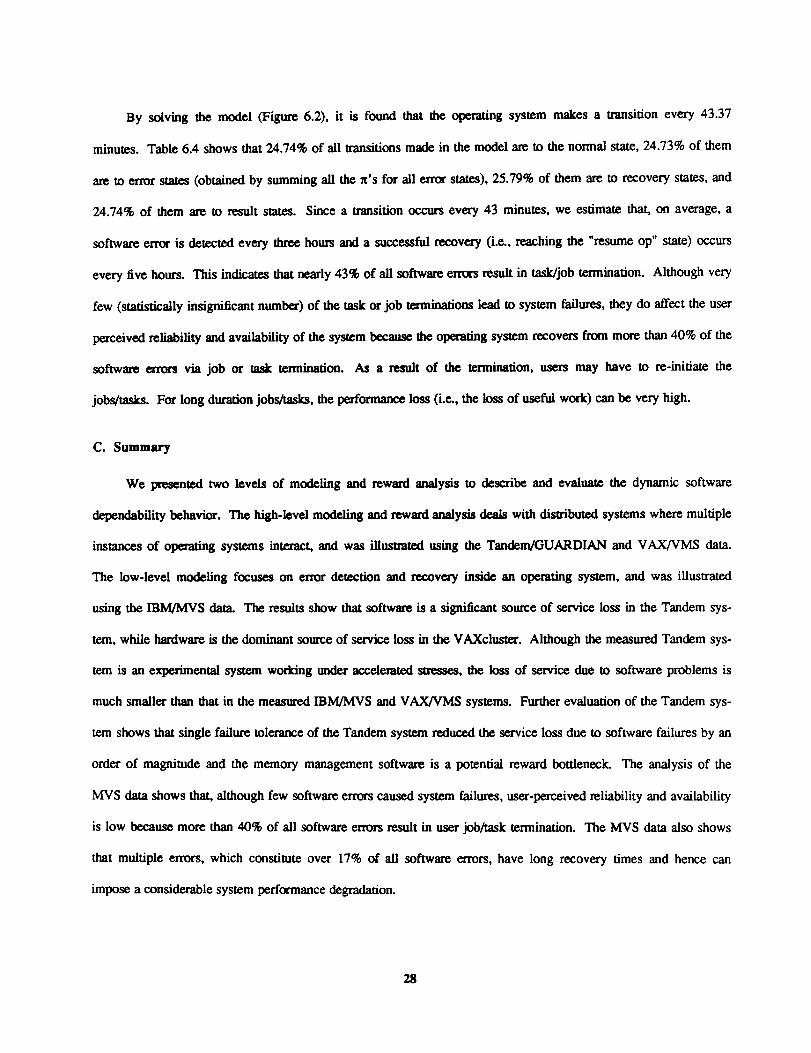
By solvingthe model (Figure 6.2), it is found that the operating system makes a transition every 43.37
minutes. Table 6.4 shows that 24.74% of all transitions made in the model are to the normal state, 24.73% of them
are to error states (obtained by summing all the n's for all error state, s), 25.79% of them are to recovery states, and
24.74% of them are to result state,s. Since a transition occurs every 43 minutes, we estimate that, on average, a
software error is detected every three hours and a successful recovea'y (i.e., reaching the "resume op" state) occurs
every five hours. This indicates that nearly 43% of all software errors result in task/job termination. Although very
few (statistically insignificant numbe_r) of the task or job terminations lead to system failures, they do affect the user
perceived reliability and availability of the system because the operating system recovers from more than 40% of the
software errors via job or task termination. As a result of the termination, users may have to re-initiate the
jobs/tasks. For long duration jobs/tasks, the performance loss (i.e., the loss of useful work) can be very high.
C. Summary
We presented two levels of modeling and reward analysis to describe and evahmte the dynamic software
dependability behavior. The high-level modeling and reward analysis deals with distributed systems where multiple
instancesof operatingsystems interact,and was illustratedusing the Tandem/GUARDIAN and VAX/VMS data.
The low-levelmodeling focuseson errordetectionand recovery insidean operatingsystem,and was illusu'ated
using theIBM/MVS data. The resultsshow thatsoftwm'eisa significantsourceof servicelossinthe Tandem sys-
tem, while hardware isthedominant som'ceofservicelossintheVAXcluster. Although the measured Tandem sys-
tem isan experimentalsystem working under acceleratedstresses,the lossof servicedue to softwareproblems is
much smallerthan thatin themeasured IBM/MVS and VAX/VMS systems. FurtherevalualJonof theTandem sys-
tem shows thatsinglefailuretoleranceof theTandem system reducedthe servicelossdue to softwarefailuresby an
order of magnitude and the memory management software isa potentialreward bottleneck.The analysisof the
MVS datashows that,althoughfew softwareerrorscaused system failures,user-perceivedreliabilityand availability
islow becausemore than 40% of allsoftwareerrorsresultinuserjob/tasktermination.The MVS data alsoshows
thatmultipleerrors,which constituteover 17% of allsoftwareerrors,have long recovery times and hence can
impose a considerablesystem performancedegradation.
28

VII. Error Correlation
When multiple instances of an operating systems interact with each other on a system, the issue of correlated
errors/failures should be addressed. An early study shows [Tang92b] that even a small failure correlation or a few
correlated failures can have a significant impact on system dependability. This section discusses software error
correlations in the VAXcluster and Tandem systems.
We found that about 10% of software failures occurred on multiple machines concurrently in VAX1. It is
instructive to examine these cases in det_ to understand how software failures occurred concurrently on different
machines. Figure 7.1 depicts a ease scenario. In the figure, Europa, Jupiter, and Mercury are machine names in
VAX1. A dashed line represents that the corresponding machine is in a failure state. At one time, a network error
(net1) was reposed from the CI (Computer Interconnect) port on Europa. This resulted in a software failure (soft1)
13 seconds later. Twenty-four seconds after the first network ea'ror (net1), additional network errors (net2,net3) were
reporled on the second machine (Jupiter), which was followed by a software failure (soft2). The error sequence on
Jupiter was _ (net4,net5,soft3) on the third machine (Mercury). The three machines experienced software
failures concurrently f_ 45.5 minutes. All three software failures occurred shortly after network errors occurred.
Thus, sometimes network-related hardware _" software problems cause concurrent software failures on multiple
machines.
Figure 7.1. A Scenario of Conemrent Software Failures
netl soR1
Europa 113 see. [ 47.83 rain.
reboot
net2 net3 soft2
Mercury I
Note:
60sP_.
47.33 min.
net4 net5 soft3 reboot
I , 111 see.I 45.5min. 14sec. [
softl, soft2, soft3 -- Exception while above ASTDEL or on interrupt stack.
netl, net3, net5 -- Port will be re-started, net2, net4 _ Virtual circuit timeout.
reboot
29

TheVAXclusterdatashowsanotherdangerof network-relatederrorsin theformof hardware-related
software errors. If a software err_ (failure) occurs in close ixoximity (e.g., within a minute) to a hardware error, it
is referred to as a hardware-related software error (failure) [Iyer85a]. The occurrence of hardware-related software
errors can be explained in several ways. First, hardware errors can be detected by software. For instance, a
hardware error, such as a flipped memory bit, may change the software condition, causing a software error. This
software error can either be corrected by built-in software fault tolerance or result in a software failure. Second,
hardware errors can cause softwaxe failures by exercising parts of the operating system such as recovery routines
which are rarely used, thus activating dormant software faults.
Table 7.1 shows the total counts of hardware-related software errors and failures, and their percentages to all
errors and failures (including those caused by hardware), respectively, in the two VAXcluster systems. Each operat-
ing system was treated as an independent entity. The table shows that, out of 32 hardware-related software errors,
28 resulted in software failures, which shows the severity of hardwaxe-related software errors. Closer examination
of the data shows that network errors are responsible for most hardware-related software errors (75%).
Network errors are not only the major source of hardware-related software failures, but also related to a
significant portion of correlated machine failures which are not reported as software failures [TangO2b]. All these
failures are believed to occur in or relate to the network interface software in I/O management routines. Thus, we
speculate that the network-related software is a reliability bottleneck in the measured VAXcluster systems.
The Tandem GUARDIAN data shows that about 20% of the software halts occurred concurrently on multiple
operating systems. A significant portion of these concurrent software failures are believed to be related to software
development/testing efforts on the measured system. However, there were three occasions where software halts
occurring while the memory manager process was executing, resulted in system coldloads - restarts of all instances
of the operating system. In one case, a single software halt due to an illegal address reference by the memory
Table 7.1. Hardware-Related Software Errors (VAXclusters)
Measure Frequency Percentage
Error 32 18.9
Failure 28 21.4
30
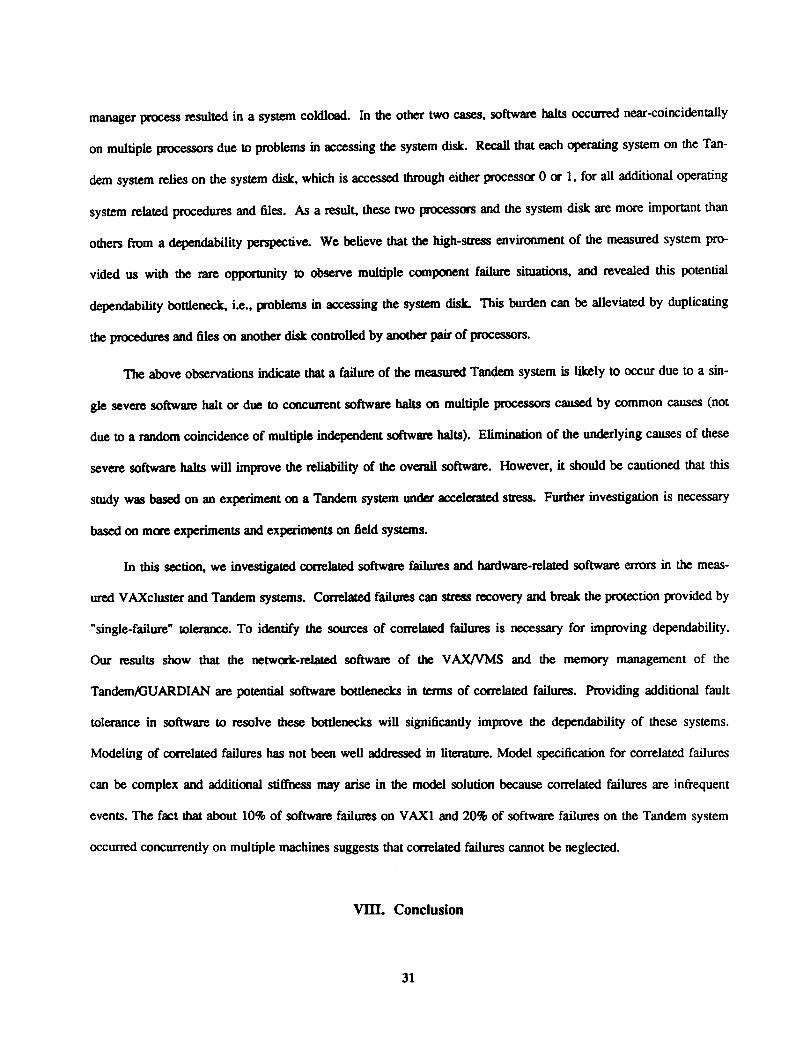
managerprocess resulted in a system coldload. In the other two cases, software halts occurred near-coincidentally
on multiple Ixvcessors due to problems in accessing the system disk. Recall that each operating system on the Tan-
dem system relies on the system disk, which is accessed through either processor 0 or 1, for all additional operating
system related procedures and files. As a result, these two processors and the system disk are more important than
others from a dependability perspective. We believe that the high-stress environment of the measured system pro-
vided us with the rare opportunity to observe multiple component failure situations, and revealed this potential
dependability bottleneck, i.e., problems in accessing the system disk. This burden can be alleviated by duplicating
the procedures and files on another disk controlled by another pair of processors.
The above observations indicate that a failure of the measured Tandem system is likely to occur due to a sin-
gle severe software halt or due to concurrent software halts on multiple processors caused by common causes (not
due to a random coincidence of multiple independent software halts). Elimination of the underlying causes of these
severe software halts will improve the reliability of the overall software. However, it should be cautioned that this
study was based on an experiment on a Tandem system under accelerated stress. Further investigation is necessary
based on more experiments and experiments on field systems.
In this section, we investigated correlated software failures and hardware-related software errors in the meas-
ured VAXcluster and Tandem systems. Correlated failures can stress recovery and break the protection provided by
"single-failure" tolerance. To identify the sources of correlated failures is necessary for improving dependability.
Our results show that the network-related software of the VAX/VMS and the memory management of the
Tandem/GUARDIAN are potential software bottlenecks in terms of correlated failures. Providing additional fault
tolerance in software to resolve these bottlenecks will significantly improve the dependability of these systems.
Modeling of correlmed failures has not been well addressed in literature. Model specification for correlated failures
can be complex and additional stiffness may arise in the model solution because correlated failures are infrequent
events. The fact that about 10% of software failures on VAX1 and 20% of software failures on the Tandem system
occurred concurrently on multiple machines suggests that correlated failures cannot be neglected.
VIII. Conclusion
31

In this paper, we demonstrated a methodology to model and evaluate the fault tolerance characteristics of
operational software. The methodology was illustrated through case studies on three different operating systems: the
Tandem/GUARDIAN system, the VAX/VMS system, and the IBM/MVS system. Measurements were made on
these systems for substantial periods to collect software error and recovery data. Major software problems and error
characteristics were identified by statistical analysis. A two level modeling approach was used to model and evaluate
error and recovery processes inside an openuing system and on multiple instances of an operating system running in
a distributed environment. Based on the models, reward analysis is conducted to evaluate the loss of service due to
software errors and the effect of fault-tolerance techniques implemented in the systems. Software error correlation
in multicompute_" systems is also investigated.
Results show that DO management and program flow control axe the major sources of software problems in
the IBM/MVS and VAX/VMS operating systems, while memory management is the major source of software prob-
lems in the Tandem/GUARDIAN operating system. Software errors tend to occur in bursts on both IBM and VAX
machines. This phenomenon is less lxonouncod in the Tandem system, which can be attributed to its fault-tolerant
design. The fault-tolerance in the Tandem system reduced its loss of service due to software failures by an order of
magnitude. Although the measured Tandem system is an experimental system working under acceleratod stresses,
the loss of service due to software problems is much smaller than that in the measured IBM/MVS and VAX/VMS
systems.
It is shown that the software Time To Error distributions obtained from the data are not simple exponentials.
This is in contrast with the common assumption of exponential failure times made in fault-tolerant software models.
Both the VAXcluster and Tandem data showed that a multicomputer software Time Between Error distribution can
be modeled by a 2-phase hyperexponential random variable: a lower rate error pattern which characterizes regular
errors, and a higher rate error pattern which characterizes error bursts and concurrent errors on multiple machines.
Investigation on error correlations found that about 10% of software failures in VAX1 and 20% in the Tandem sys-
tem occurred currently on multiple machines. It was suspected that the network-related software in the VAXcluster
and memory management software in the Tandem system are software reliability bottlenecks, in terms of concurrent
f_lures_
32

It shouldbeemphasizedthattheresultsof this study should not be interpreted as a direct comparison between
the three measured operating systems, but rather an illustration of the proposed methodologies. The differences in
operating system architectures, instrumentation conditions, measurement periods, and operational environments
make a direct comparison impossible.
Acknowledgements
We thank Tandem Computers Incor_rated, NASA AMES Research Center, and IBM Poughkeepsie for their
assistance in collecting the data from the Tandem machines, VAXcluster system, and IBM machines, respectively.
Thanks are also due to Abhay Mehta of Tandem for providing technical support for the stndy of the Tandem sys-
tem, and Robert Dimpsey, Kumar Goswami, and Wei-Lun Kao for their useful comments on this manuscript. This
research was supported in part by the Office of Naval Research under Grant NO0014-91-J-1116 and in part by
NASA under grant NAG-I-613. The content of this paper does not neces.mxily reflect the position or policy of the
government and no endorsement should be inferred.
References
[Arlat90] L. Arlat, K. Kanoun, and J.C. Laprie, "Dependability Modeling and Evaluation of Software Fault-Tolerant
Systems," IEEE Transactions on Computers, Vol. 39, No. 4, April 1990, pp. 504-513.
[Avizienis84] A. Avizienis and J.Pj. Kelly, "Fault Tolerance by Design Diversity: Concepts and Experiments,"IEEE Computer, August 1984, pp. 67-80.
[Bartlett78] JJL Bartlett, "A 'Nonstop' _tlng System," Proceedings of the International Hawaii Conference on
System Science, 1978, pp. 103-117.
[Bishop88] P.G. Bishop and F.D. Pullen, "PODS Revisited -- A Study of Software Failure Behavior," IEEEFTCS-18, June 1988, pp. 2-8.
[CastilloS1] X. Castillo, A Compatible Hardware�Software Reliability Prediction Model, Ph.D. Thesis, Carnegie-
Mellon University, July 1981.
[Castillo82] X. Castillo and D.P. Siewiorek, "A Workload Dependent Software Reliability Prediction Model," IEEEFTCS-12, Santa Monica, California, June 1982, pp. 279-286.
[Chillarege92] R. Chillarege and M.S. Sullivan, "A Comparison of Software Defects in Database Management Sys-
tems and Operating Systems," to appear in IEEE FTCS-22, Boston, MA, June 1992.
[HowardT1] R. A. Howard, Dynamic Probabilistic Systems, Joi!n Wiley & Sons, Inc., New York, 1971.
[Gray90] J. Gray, "A Census of Tandem System Availability Between 1985 and 1990," IEEE Transactions on Reli-ability, Vol. 39, No. 4, Oct. 1990, pp. 409-418.
[Hecht86] H. Hecht and M. Hecht, "Software Reliability in the System Context," IEEE Transactions on Software
Engineering, VoL SE-12, No. 1, Jan. 1986, pp. 51-58.
[Hsueh87] M.C. I-Isueh and R.K. Iyer, "A Measurement-Based Model of Software Reliability in a Production
Environment," Proceedings of the llth Annual International Computer Software & Applications Conference,Tokyo, Japan, October 1987, pp. 354-360.
33

[Hsueh88] M.C. Hsuch, R.K. lyer, and K.S. Trivedi, "Performability Modeling Based on Real Data: A Case Study,"
IEEE Transactions on Computers, Vol. 37, No. 4, April 1988, pp. 478-484.
[Iyer85a] ILK. Iyer and P. Velardi, "Hardware-Related Software Errors: Measurement and Analysis," IEEE Tran-sactions on Software Engineering, Vol. SE-11, No. 2, February 1985, pp. 223-231.
[Iyer85b] ILK. Iyer and D.J. Rossetti, "Effect of System Workload on Operating System Reliability: A Study on
IBM 3081," IEEE Transactions on Software Engineering, Vol. SE-11, No. 12, De._mber 1985, pp. 1438-1448.
[Katzman78] jas,. Katzman, "A Fault-Tolerant Computing System," Proceedings of the International Hawaii
Conference on System Science, 1978, pp. 85-102.
[Kronenberg86] N.P. Kronenberg, H.M. Levy and W.D. Strecker, "VAXcluste_. A Closely-Coupled DistributedSystem," ACM Transactions on Computer Systems, VoL 4, No. 2, May 1986, pp. 130-146.
[Laprie84] J.C. Luprie, "Dependable Evaluation of Softwm¢ Systems in Operation," IEEE Transactions on
Software Engineering, Vol. SE-10, No. 6, Nov. 1984, pp. 701-714.
[Leegl] I. Lee, ILK. Iyer and D. Tang, "Error/Failure Analysis Using Event Logs from Fault Tolerant Systems,"
Proceedings of the 21st International Symposium on Fcudt-Tolerant Computing, June 1991.
[Musa871 J.D. Musa, A. Iannino, and K. Okumoto, Software Reliability: Measurement, Prediction, Application,
McGraw-Hill Book Company, 1987.
[Randell75] B. RandeU, "System Structure for Softwaxe Fault Tolerance," IEEE Transactions on Software
Engineering, VoL SE-1, No. 2, June 1975.
[SAS85] SAS Institute Inc., SAS User's Guide: Statistics, Version 5 Edition, Cary, NC, 1985.
[Scott87] ILK. Scott, J.W. Gault, and D.F. Mcallister, "Fault-Tolerant Software Reliability Modeling," IEEE Tran-
sactions on Software Engineering, VoL SE-13, No. 5, May 1987, pp. 582-592.
[SuUivan91] M.S. Sullivan and R. Chillarege, "Software Defects and Their Impact on System Availability -- AStudy of Field Failures in Operating Systems," IEEE FTCS-21, Montreal, Canada, June 1991.
[Tang92a] D. Tang and RJC. Iyer, "Measurement and Modeling of a Multicomputer System," IEEE Transactions
on Computers, to appear.
[Tang92b] D. Tang and R. K. Iyer, "Analysis and Modeling of Correlated Failures in Multicomputer Systems,"
IEEE Transactions on Computers, May 1992.
[Trivedi92] K.S. Trivedi, J.K. Muppala, S.P. Woolet, and B.R. I-Iaverkort, "Composite Performance and Dependa-
bility Analysis," Performance Evaluation, Vol. 14, February 1992, pp.197-215.
[Velardi84] P. Velardi and ILK. Iyet, "A Study of Software Failures and Recovery in the MVS Operating System,"
IEEE Transactions on Computers, VoL C-33, No. 6, June 1984, pp. 564-568.
34

REPORT
14. REPORTSECURITYCLAS$1FICA[ION
Uric la_s i f i_d2a. SECURITYCLASSIFICATIONAurRORITY
2b. OECLA$$1FICjI,TION1DOWNGRADING SCHEDULE
4. PERFORMINGORGANIZATION REPORTNUMBER(S)
UILU-ENG-92-2240
_. _AMi OF PERFORMING ORGANIZATION
Coordinated Science Lab
University of r_liqg_§_. aDDRESS (C_. Stare. _ ZIPC_a_)
1308 W. Main St.
Urbana, IL 61801
Ca. NAME OF FUNDING/SPONSORINGORGANIZATION
ONR and NASA
ADDRESS(C/t/, Staw. ,hal Z_ Co_,)
ON-R: Arlington, Virginia 22217
NASA: Hampton, Virginia 23665
DOCUMENTATION
CRHC 92-22
6b. OFFI(_ESYMBOL(If *D_i¢,Ue)
N/k
PAGE I
lb. RESTRICTIVEMARKINGSNone
]. OlSTRIiiUTIONtAVAILAilIUTY OF REPORT
Approved for public release;discr£bution unlimi =ed
rcwm AO_nmOM8 No. 0704-0188
S. MONITORING ORGANIZATION REPORT NUMBER(S)
7,. NAME OF MONITORING ORGANIZATION
ON-R and NASA
7b. ADDRESS(CRy, SCa_. a_ ZIP Co_e)
ONE: ArllngCon, Virginia 22217
%. PROCUREMENTINSTRUMENT IDENTIFICATION NUMBER
ON-R: NO0014_91_j_ I116 NASA:
I0. SOURCEOF FUNDING NUMBERS
ELEMENT NO. NO.
NAG-I'613
Measurement and Analysis of Operating
12. PERSONAl.AUTHOR(S)
13a. TYPEOF REPORT 113b. TIME COVE-REDTechnical I FROM TO
l
16.SUP_EMENTARY NOTATION
System Fault Tolerance
14. DATE OF REPORT (Y_.Momtl, O_)October 1992
,7 COSAn CODES | 111,.SUBJECTTERMS (Commt_l' oet r_mnm if _ a_r_ _ _ _ numlamr)
FIELD ! GROUP I SUB-GROUP J F_t-Tolecance. Software Dependability EvaJu_don.Ope:nu_g Sysr_mrn.Distribumd Sysmm.Error Measucemen_,Error Recovery, Madcov Model, Rewa,-d Analysis, Correlation
19. ABSTRACT(Conlbtwe on rever_ if rmcelidlly and icl_n_fy by'IMcxk rwml#_)
This pape_ demonsua_s a methodology to model and evalua_ the fault tolerance charac,.eristics of opemdon_
software. The methodology b illu.sl_al_ dxrough case studies on three different openuing systems: the Tandem
GUARDIAN fault-toleram system, the VAX/VMS disn-ibuted system, and the IBM/MVS system. Measurements arc
made on these systems for substantial periods to collect software error and recovery dam. In addition to investigat-
ing basic dependability chsrac_m'istics such as major software problems and error diswibudons, we develop two lev-els of models to describe errc_ and recovery processes inside an operating system and on multiple instances of an
operaung system running in a dismbu_d environmenL Based on the models, reward analysis is conducted to evalu-ate the loss of service due to software errors and the effect of the fauR-eolerance techniques implemented in the sys-
tems. Software error ¢orrelmion in muldcomputer systems is also investigated.
conmm_
20. OtSTRIBUrlONIAVAII-_BILITY OF ABSTI_CT 121 ABSTRACTSECURITYCLASSIFICATION
C'e'_UNCLA$SIFIEDIUNLIMITED C_ SAME AS RPT. [] OTIC USERS ! Unclassified
_2,. NAME OF RESPONSIBLEiNDIVIDUAL i22 tELEPHONE0tKJuOe _re, Co_e) I 22¢. OFFICE SYMBOLI I
)0 Form 1473, JUN 86 _,ev, ouseclitlons,re ol3loietlt. SECURITYCLA_;$1FIC_TION OF THI_; PAGi_
UNCLAS S IFIED